Tick Bite Risk as a Socio-Spatial Representation- An Exploratory Study in Massif Central, France - MDPI
←
→
Page content transcription
If your browser does not render page correctly, please read the page content below
Research Article

Tick Bite Risk as a Socio-Spatial Representation—
An Exploratory Study in Massif Central, France
Sylvain Dernat * and François Johany
 INRA, Joint research unit (JRU) Territoires, 63122 Saint-Genès-Champanelle, France.;
 francois.johany@clermont.inra.fr
 * Correspondence: sylvain.dernat@inra.fr (S.D.); Tel.: +33-047-362-4987

 Received: 13 February 2019; Accepted: 11 March 2019; Published: 13 March 2019

 Abstract: Ticks are responsible for the largest number of transmissions of vector-borne diseases in the
 northern hemisphere, which makes the risk from tick bites a serious public health problem. Biological
 scientific research and prevention studies are important, but they have not focused on the population’s
 perception of tick bite risk, especially at a spatial level. This exploratory article sets out to study this
 point through an innovative methodology involving the collection of 133 mental maps associated with
 a semi-structured interview and a socio-demographic questionnaire collected in the Massif Central
 region, France. The results show a strong link between the representation of the tick bite risk and the
 representation of particular landscapes. Forests appear as dangerous for the population, especially in
 the traditional activities of family walking or hiking. This calls into question overly anxiogenic
 prevention approaches that neglect the impact on practices in risk-prone spaces. It accentuates the
 need for localized education measure to improve knowledge about tick biology and avoid
 stereotypical and unnecessary negative representations associated with the environment.

 Keywords: socio-spatial representation; tick bites; environmental risk; mental maps

1. Introduction
     The majority of vector-borne diseases in temperate regions of the northern hemisphere are due
to acarines, mainly ticks. According to the World Health Organization [1], Lyme borreliosis is currently
the most common vector-borne disease throughout its range, which appears to be closely related to
that of its vector, the Ixodes ticks, found from Japan to North America and from Scandinavia to North
Africa [2]. Tick-borne diseases are therefore a major problem in industrialized countries and an
emergent problem in less developed countries [3]. They are the subject of abundant multidisciplinary
scientific literature in cell biology, epidemiology, and the medical sciences, however, in the
humanities and social sciences, publications remain more limited [4]. In a review of the literature,
Mowbray et al. [5] showed that the majority of articles focus on the study of prevention behaviors. It
appears that the knowledge of the risk related to ticks remains low in the population [6], therefore,
most orientation is directed toward the socio-cognitive dimension associated with prevention
behaviors, such as personal efficiency [6–9]. However, the risk factors related to the local environment
are well established [10,11], especially among professional populations [12]. The presence or absence
of agricultural and industrial areas that lead to significant changes in the abiotic and biotic
environment, as well as the existing socio-economic conditions (unemployment and inequalities),
may have increased the abundance of infected ticks and human contact with them. For example,
abandoned agricultural fields have become adapted to transmission through rodent hosts, pesticide
use and industrial air pollutant emissions have dropped, and wildlife hosts for ticks have increased,
resulting in changes in tick populations. In addition, significant differences were found between
regions in terms of preventive behaviors and exposure factors. For example, people living in certain

Land 2019, 8, 46; doi:10.3390/land8030046                                          www.mdpi.com/journal/land
Land 2019, 8, 46                                                                                   2 of 32

grassland areas are more likely to adopt preventive behaviors [13]. This shows that the effects of
lifestyle on health are often mistakenly thought to operate the same way on all individuals [14], but
it is more likely that they vary according to practices, even when there is no geographical
determinism [15]. These results strongly suggest that social and contextual factors, such as the
epidemiological status of a region, are important to consider when designing effective prevention
campaigns [16]. It also stresses the importance for public health authorities to better understand and
control these factors in targeted local populations to be able to implement prevention programs that
are well adapted to a population and its epidemiological context. The spatial dimension of tick bite
risk (TBR) is therefore a major factor [17]. Yet the capacity for a spatial understanding of risk in the
population remains undervalued. While social and contextual elements are important, we sometimes
forget how the risk is perceived [4]. There is no research on the population’s representation of TBR
with respect to its socio-spatial dimension. However, in a study at the hyper-localized scale of a
French forest, Meha [18,19] shows that the TBR, at least its representation, influences the practices
and the behaviors of the people who frequent forest areas.
      Within a multidisciplinary research project combining epidemiology and social sciences, we
focused on the public’s socio-spatial representation [20] of TBR by linking it to the risk from an
epidemiological point of view. Contemporary society is increasingly inclined to seek security, and as
a result, risks appear more prominently in the media and in policy [21]. The study of a population’s
acceptance of risks is undertaken through social and environmental psychology approaches, such as
studying how individuals assess risk [22]. Risk is a social representation [23,24], which has a strong
spatial and temporal consonance. It is an often studied element in environmental psychology and
social geography. The TBR corresponds to this in the sense that the way individuals think of this risk
depends on a social and spatial identity (education, social groups, spatial practices, etc.) as well as on
a cognitive perception or a personal experience (bite) of this risk. The risk cannot be explained
independently of the context; it appears as a value constructed by the subject using information that
is more of a social or individual order than one that is purely technical [22]. The relation of the
individual to the risks will depend on himself (his norms, his values, his aspirations, etc.) and on the
way he understands and represents his environment (social environment, but also spatial and
temporal) [25]. Thus, the representation is not the simple product of a mechanical processing of
information. It is situated in a complex socio-cognitive process, actively constructed by the subject
through the meanings conferred on the space, the goals of the subject, and the social rules used in
this space [26]. It is individuals who give meaning to their environment [27], who read into this space
experiences from their own personal history [28,29], as well as events found in their collective history
[30]. A representation of the TBR with respect to its space includes the social norms assembled
through education and socialization that integrate a social history of the risk of being bitten as
conveyed by various media or, more personally, in a “common sense”, oral tradition that varies
according to places and lifestyles. This adds the perspective of the individual’s own activities,
especially the risk found in leisure activities related to nature.
      The purpose of this article is threefold: To highlight the elements familiar to the public in their
representation of the TBR, especially the spatialized aspect; to understand how this risk is socially
constructed from a spatial point of view; and to identify any gap between the individuals’
understanding of the risk and access to the information that researchers want to disseminate.

2. Materials and Methods

2.1. Collection Area
     The biological-epidemiological literature shows that the Ixodes ricinus tick is the most
widespread tick species in France. The risk of disease transmission by this tick correlates with human
exposure to the environmental hazard, and thus exists when there is overlap between spatial
distributions of humans, Ixodes ricinus ticks, and pathogens [31]. The hazard is generally estimated by
the average density of infected ticks in a given area (called acarological risk). Tick density depends
on a variety of factors, the three main ones being climate, vegetation cover, and host density. Ixodes
Land 2019, 8, 46                                                                                   3 of 32

ricinus generally prefers deciduous, or mixed deciduous and coniferous forests, which provide a
suitable ground vegetation and climate, which is also required for the tick’s hosts. Wierzbicka et al.
[32] have confirmed that the prevalence of Lyme borreliosis in Central Europe is positively correlated
with the use of forests by humans, and De Keukeleire et al. [12,33] have shown that the accessibility
to the forest and its distance from the home of an individual impacts the risk of exposure. The
increasing proximity of densely populated urban areas to forests seems to be the main reason for the
emergence of this risk, particularly since many of the habitats favorable to tick populations coincide
with newly developed areas where residential properties have gradually encroached on forests [34].
The number of infected ticks can reach very high levels in fragmented areas, creating pockets of
malady in the vicinity of humans, sometimes in very urban areas [35] and on private land [36].
Whether in the United States [37] or in Europe [38], we observe that the majority of indexed cases are
related to outdoor activities in heavily forested areas located on the periphery of cities. This creates a
paradox with the fact that periurban forest areas are increasingly perceived as natural spaces that
provide a preventative health function [39]. However, restricting our image of spaces where people
are active to those that are in close proximity to their place of residence can lead to the trap of an
exclusively local approach that does not address the day to day spatial reality of many inhabitants
[15,40]. The inhabitants’ standard of living is also a factor. Most of the time, individuals stay within
an area that they can comfortably afford, described by Rémy [41] as a “territory of withdrawal,”
whereas those with more financial means are able to move about more easily. This highlights the
need to understand the distribution of the population in terms of income levels. Specific activities,
where they take place, distances traveled, and the constraints imposed on certain individuals or
groups are all parameters influenced by the population’s standard of living and their representations
of their socio-physical environment [42,43]. These elements determine the variety of regional or local
contexts in various terms (biological, climatic, sociological, economic, and political) that in turn
determine the risk of exposure to ticks. In rural areas, this risk is endemic and thus well known, but
it poses a new problem in the peri-urban spaces where large human populations are in close
proximity to forests [19]. In order to evaluate this population’s perception, or their socio-spatial
representations, of TBR, we consider it important to include three particular criteria in the approach:
The environmental hazard characterized by the distance from hardwood forests; the urban, peri-
urban, or rural character; and, finally, the economic capital, defined by the average income of
households in the municipalities studied (Figure 1).
     To collect data on these target populations and to remain consistent with a social approach,
collections sites must be established in a geographical area that does not encompass excessive
heterogeneity in socio-spatial practices. To ensure data consistency, it is better to collect data on a
larger population living in a similar territory than on small numbers scattered over various remote
locations. With this in mind, we selected data collection sites in an area surrounding the city of
Clermont-Ferrand and a rural area in the Combrailles region of France’s central mountains (Massif
Central). This area has been the focus of significant research in terms of highlighting both the
ecological factors influencing the presence of Ixodes ricinus ticks [44], and the correlation between the
infection of Ixodes ricinus by the bacteria which causes Lyme borreliosis and the occurrence of the
disease in the population [45]. This allows us to investigate the complementarity of epidemiology
and health modeling approaches that we can use in our analysis. These spatially integrated analyses
can provide a better understanding of the interactions between changes in ecosystems and climate,
land use and human behavior, and the ecology of vectors and infectious hosts [46]. The rural area
identified is characterized by a hedgerow landscape, alternating between pasture, wood, and
hedgerows. The region’s climate has oceanic aspects conducive to the development of tick populations.
Agriculture in the Combrailles area is primarily dedicated to livestock farming, which results in a close
proximity between domestic animals, wildlife, and the human population. Therefore, the local
population risks contact with infected ticks through both professional and leisure activities.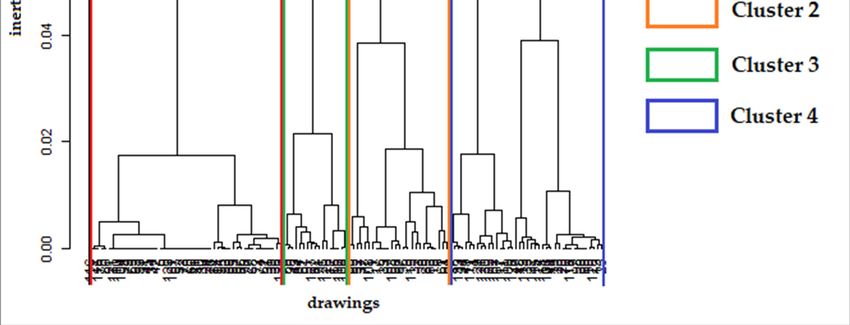
Land 2019, 8, 46                                                                                  4 of 32

                                   Figure 1. Maps of the collection area.

     Figure 1 shows the two zones studied. The northwestern zone, which is situated in the
Combrailles region and the mountains of the Chaîne des Puys, is most exposed to TBR. The
environmental hazard posed by hardwood forests is less present in the second zone, which includes
Clemont-Ferrand and the adjacent plain. The two zones selected correspond to our objectives of data
coherence and the spatiality of the participants’ lifestyles: To the north, a rural zone close to forests
in the Combraille region, where the standard of living is below the national average; and to the south,
an urban area around the city of Clermont-Ferrand, which is partially surrounded by forests, and has
a population with a higher standard of living.

2.2. Collection Method
     Data was collected during one-to-one interviews lasting about 20 minutes. Interviews started
with a presentation of the research framework (in accordance with French regulations at the time of
data collection, each participant signed a consent form authorizing the collection and secure storage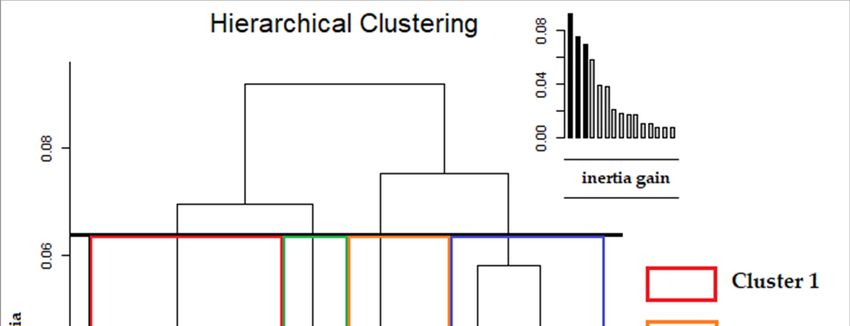
Land 2019, 8, 46                                                                                   5 of 32

of their data), proceeded with the interview, and finished with the signing of an agreement on the
use and confidentiality of the data.
      The methodology is based on the use of mental maps coupled with a recording of the
accompanying verbalization [47]. This method aims to identify the socio-spatial representations of
the individuals interviewed as expressed in their mental maps. Concretely, it is a question of asking
an individual to draw a spatial representation of how he understands the TBR. In the interview, each
participant was provided with a white A4 sheet of paper and a single-color pen, and then asked to
“draw a place, an area, an environment in which you could be bitten by a tick”. While drawing, the
participant commented verbally on the selected elements and his justifications for them. The
participant also decided when to stop drawing. The verbalization adds complementary information
to the mental map, providing elements of understanding and helping to identify aspects not
represented, but present in the participant’s mind (temporal dynamics for example). The realization
of the drawing was filmed to be able to restore a posteriori the construction of the mental map, and
the speech was recorded with a dictaphone. At the end of the drawing process, the interviewee was
asked if the drawing realized evoked a specific place or if it was completely invented.
      Finally, an anonymous questionnaire containing the socio-demographic characteristics of the
participant was proposed. It collected information on the gender, age, place of residence, profession,
any experience or not with tick bites (personally or among relatives or animals), practices related to
outdoor recreation (hiking, biking, walks, outdoor work, etc.), and asked if the participant felt they
are well informed about where ticks are found. At the end of the questionnaire, the participant was
thanked for their participation.
      This method of collection was tested beforehand with 11 people (researchers and general public),
allowing us to adjust the inductions and make sure the instructions and the questions were
understood. These preliminary tests did not identify any specific problems.
      The data were collected in France between February and July 2018 by two investigators on eight
sites around the city of Clermont-Ferrand and the region of Combrailles as shown in Figure 1.
      The interviews were conducted during the week or the weekend depending on the likelihood of
finding willing participants. In rural areas, they were conducted in municipal halls during local
markets to facilitate contact with the resident population. In urban areas, they were held in municipal
libraries during their busiest days. In both areas, respondents were unaware that they would be
interviewed about TBR. The researchers asked them to participate in a survey on “environmental
risks”. This made it possible to avoid a specific preconception among the respondents, or a bias
toward participants that were particularly concerned by the topic of TBR (such as hikers and patients
with Lyme borreliosis). Recruitment of participants was undertaken directly in the local gathering
place by approaching individuals face to face (with the authorization of the mayor and municipal
services). At the low-density rural sites, a prior announcement was made in the local newspaper
specifying a scientific study on “environmental risks”, along with the place and the date.

2.3. Data Analysis Methods
     The collected data were classified and recorded under a key enabling the identification of each
set of data, each place of collection, and each individual participating anonymously. The audio
recordings were fully transcribed. Mental maps and their transcriptions were analyzed individually
and manually by a specifically developed method. Out of 143 interviews, only 133 were selected for
analysis. Six individuals did not want to draw, three drawings were completely illegible, and one
drawing included elements that identify the participant and invalidate the anonymity required for
the analysis. The responses of those individuals were not analyzed.
     The analysis was performed using a triangulation method [48]. This approach is particularly adapted
to the study of social representations [49] and is designed to highlight the combinations of elements that
spatially structure the studied representation [47]. There are three parts to this type of analysis.
     The drawing was initially analyzed by its characteristics. For each drawing, we considered a
number of elements, which are conventionally used in mental maps [50]. We used the classification
system of Maurel [51] to assign a type to each drawing: Cartographic (map-like), photographic (like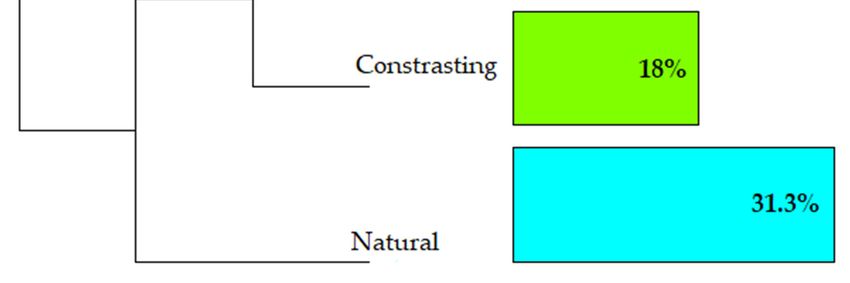
Land 2019, 8, 46                                                                                   6 of 32

a photo), schematic (no geographical features), plan (a way-finding drawing), and mixed (multiple
categories). We also noted the scale of the drawing: National (France), regional (a French
administrative region or department), intermediate (an area with or without administrative
boundaries, but corresponding to social, technical, or physical elements, such as a set of villages or
towns), local (a city or a village), micro-local (a small area), without scale, and multi-scale. We then
noted the inclusion of any humans, animals, ticks, or dynamics elements, like climate. We also
identified the presence and type of text: Nominative (to complement drawing elements), illustrative
(to replace a non-drawn element), or legend (used as in a traditional map). The analysis of the
drawings continued with a “pre-iconographic” technique proposed by Le Moel, Moliner, and
Ramadier [52]. The first step was to identify the different spatial “shapes” represented on the
drawings. A shape is the analog representation of an object (a forest, fields, a path, etc.). After a
detailed examination of each drawing, a list of the elements drawn was identified. In the second step,
these elements were grouped into object categories. Using this information, each drawing was then
characterized by the object categories that it contained. For a given category, a drawing is identified
as containing, or not, one or more shapes belonging to that category. A multiple correspondence
analysis (MCA) was then carried out under the software R 3.5.1 version, FactoMineR package on the
different categories to study their coexistence, followed by a hierarchical classification that allows the
grouping of profiles from similar drawings [53]. This makes it possible to study relationships between
variables and associations between categories. Two categories were considered closely associated if they
were often seen together. We were then able to characterize groups of individuals by these analyses.
     In the second part, the transcriptions of the audio recordings were examined through a textual
analysis, the objective of which was to analyze the socio-spatial representations and verbal practices
in the subject’s verbalization during the drawing. In previous analyses, we have shown the
importance of spatial verbalization [47]. We used the Reinert method [54], processed with IRaMuTeQ
software IramuteQ 0.7 alpha 2 [55,56]. This method focuses on studying the representations contained
in the corpus by using the redundancy of word associations, where the words are studied with those
surrounding them. The corpus was cut into fragments of a similar size. A factorial correspondence
analysis (FCA) was performed on these fragments, followed by the application of a hierarchical
ascending classification (HAC). The software statistically ranks words according to their similarity
or dissimilarity. The classification begins by dividing the complete corpus into two groups according
to vocabulary. The operation is repeated by dividing the largest opposing classes, maximizing khi2,
and then repeating again if necessary. This ensures a distribution of opposing classes distinguished
from each other by the contrast of their vocabulary. The software provided the list of words most
significantly present (depending on khi2) in the “lexical world” of a class. The results were then
projected onto the FCA (performed on the contingency table), which highlights the categories of
verbalization and the associated representations.
     Finally, the variables from the socio-demographic complementary questionnaires (respondent
profile, knowledge of tick risks and outdoor practices) as well as the combinations of categories of
identified objects (in pre-iconographic analysis) were crossed with the textual analysis to identify
distinct groups in the representation characterized by different socio-spatial postures. The IramuteQ
software provides each verbalization class with a list of significant associated variables (again
depending on the khi2). These illustrative variables were included in the FCA to illustrate the classes
of verbalization.

3. Results

3.1. Sample
     Table 1 shows the distribution of the number of people surveyed according to the places of
collection. There is some imbalance between urban and rural areas given the difficulty of finding
participants willing to respond to the survey in the rural area. The table also shows that one site
accounts for almost half of the rural area’s sample.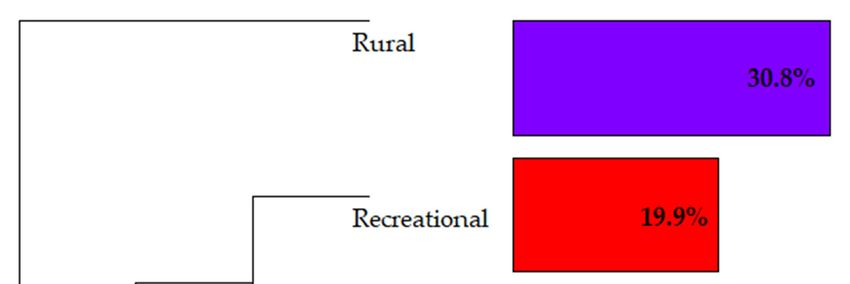
Land 2019, 8, 46                                                                                           7 of 32

                              Table 1. Distribution of surveyed population (n = 143).

                              Collect sites               Number       % of area        % global
                              Urban area                     95            100            66.4
                           Clermont-Ferrand                  26            27.3           18.2
                              Chamalières                    26            27.3           18.2
                                Orcines                      13            13.7           9.1
                               Nohanent                      30            31.7           21.0
                               Rural area                    48            100            33.6
                              Les Ancizes                     6            12.5           4.2
                        Saint-Georges-de-Mons                11            22.9           7.7
                       Saint-Gervais-d’Auvergne              22            45.8           15.4
                         Saint-Eloy-les-Mines                 9            18.7           6.3

     The sample was established with the aim of differentiating the population on three variables:
Urban or rural residence, income level, and proximity to a forest area conducive to TBR. The analysis
of the socio-demographic data of the sample is presented in Table 2. We interviewed 143 people.

                          Table 2. Characteristics of the interviewed population (n = 143).

                   Characteristics                                                  Number          %
                      Gender                           Women                          81           56.64
                                                         Men                          62           43.36
                        Age                            Average                           52
                                                       Median                            55
                    Age groups                          0–19 1                        10           06.99
                                                         20–39                        31           21.68
                                                         40–59                        39           27.27
                                                         60–74                        53           37.06
                                                          >74                         10           6.99
              Living environment                         Rural                        60           41.96
                                                      Periurban                       38           26.57
                                                        Urban                         45           31.47
               Socio-professional                      Farmers                         2            1.4
                  categories 2                  Craftsmen, tradesmen                  10           6.99
                                          Managers, intellectual professions          35           24.48
                                                 Employees, workers                   23           16.08
                                              Intermediate professions                 9           6.29
                                                       Students                       16           11.19
                                           Retirees or without professions            48           33.57
               Average monthly                    4,000€ and more                     20           13.99
               household income              Between 2,500€ and 3,999€                30           20.98
                                             Between 1,000€ and 2,499€                71           46.65
                                                  Less than 1,000€                    22           15.38
 1   Interviews with minor respondents, subsequent to parental consent. 2 According to the nomenclature of the
                             French national institute of economic statistics (INSEE).
     The surveyed population is relatively balanced in terms of gender, age, and community. A large
proportion of the of socio-professional categories is composed of retired individuals. This can be
explained in part by the preponderance of retired individuals in the rural population (approximately
half of the local rural population), and by the fact that this group was more accessible during the
weekday collection sessions. Although the number of participants in the primarily rural, Combrailles
region is smaller in the study area that includes the urban area of Clermont-Ferrand, the overall
Land 2019, 8, 46 8 of 32
number of rural versus urban participants remains balanced because the more populated urban/peri-
urban zone also includes participants from the rural, outer fringes of this selection area. Finally, the
majority of the surveyed population has a relatively modest standard of living; approximately 65%
of the households earned less than 2,500 euros per month.
Table 3. Outdoor activities practiced by respondents (n = 143).
Outdoor activities Number %
Nearby walks, picnic… 138 96.5
Hiking 131 91.61
Gardening 121 84.62
Mountain biking/cycling 62 43.36
Snow sports 56 39.16
Cutting wood 52 36.36
Canoeing and water sports 49 34.27
Climbing 30 20.98
Running 28 19.58
Fishing/hunting 27 18.88
Riding 9 6.29
Other outdoor activities1 11 7.69
1 Painting, yoga, etc.
The analysis of outdoor practices in the surveyed population, shown in Table 3, is interesting
relative to TBR. It shows that most of the population participate in activities that expose them to the
risk of tick bites (96.5% of those interviewed claim to practice at least one outdoor activity). This is
particularly the case for outdoor walking activities (walks, hikes, etc.) that are practiced at least once
a month by nearly 72% of those surveyed. Gardening, which is an activity with potential exposure to
ticks closer to home, is practiced by 84.62% of respondents, 64.1% of whom say they garden at least
once a month. It should be noted that 73.9% of the population do not practice outdoor activities at a
distance greater than 30 km from the family home more than once a month, and the majority of the
population (53.5%) do not practice such activities (at distances greater than 30 km away) more than
three times a year. The declared outdoor practices therefore remain principally local activities for the
population and thus correspond to the defined natural environment of the collection area.
Table 4. Knowledge of tick bites among respondents (n = 143).
Characteristics Number %
Bitten several times 59 41.3
Bitten once 16 11.2
Tick bites Bites on family, friends 39 27.3
experience Bites on family pets 14 9.8
Heard about bites 5 3.5
Nothing 9 6.3
Knowledge of Good 35 24.5
places conducive Medium 86 60.1
to being bitten None 21 14.7
Good 17 11.9
Knowledge about
Medium 69 48.3
prevention means
None 57 39.9Land 2019, 8, 46 9 of 32
The analysis of the TBR questionnaire in Table 4 shows that the population studied has
considerable experience with tick bites. More than 90% of the interviewed participants have had
experience with bites in their immediate social environment (themselves, family, friends, or pets) and
nearly 50% of them have been bitten at least once. As a result, most of the interviewees (nearly 85%)
feel they have good or average knowledge of areas conducive to tick bites. Only 14.5% feel they have
no knowledge. However, knowledge about means of prevention is lower. Only about 60% of
respondents believe they have good or average knowledge about these means. The experience of
being bitten therefore seems to be more affected by the representation of the knowledge of the areas
where one risks being bitten than the representation of methods of prevention.
3.2. Pre-Iconographic Analysis
3.2.1. Characteristics of Drawings
The step of characterizing the drawings was performed independently of their specific elements.
It focuses on the types of representations chosen and how they are organized in the drawing activity.
Type of Drawings
The photographic type, which translates more naturally as a landscape, was the most frequently
assigned classification. As shown in Table A1, this type represents more than half of the drawings.
The schematic type represents nearly one-third of the drawings. Although there is no geographical
information depicted in this drawing type, there is still some sense of a photo taken by the individual
to express his ideas. We can see that the induction request favors the individual’s notion of a
landscape rather than a map or cartographic type drawing. Thus, unsurprisingly, only 12 drawings
are classified as cartographic. It can also be said that mixed-type drawings are closely associated with
the photographic type drawings.
Scales
More than 70% of the drawings are at a micro-local or local scale. Table A2 shows that few
drawings were made at larger scales, which points to a correlation with the time the bite occurred,
the bite experience itself, or its representation. The drawings show no actual cartographical elements
relating to the risk of tick bite. This relates back to the predominance of the photographic type, which
seems to mark the subject’s photo-like impression of a particular instance in time associated with a
tick bite. A number of drawings are multi-scale, but tend to orient several localized representations
in a larger set. Others do not express a scale of representations.
Imagined or Real Place
Table 5 shows that the majority of respondents make reference to an actual location with which
they are familiar when they are asked to draw a place related to TBR. This is an important element
because it shows that actual experiences in their environment strongly influence the representation.
Table 5. Type of representation in the drawings (n = 133).
Characteristics Number %
Place Imagined 62 46.6
Real 71 53.4
Figure 2 maps the locations indicated in the participants’ drawings. We see that the vast majority
of them are places identified with TBR. It also shows that the participants draw a place that is
relatively near to their residence or the area where they live (according to the elements of residence
collected in the questionnaire). This suggests that their representation is conditioned to some degree
by local influences.Land 2019, 8, 46 10 of 32
Figure 2. Map of the locations indicated in the participants’ drawings.
Textual Elements
Only one-third of the drawings incorporate textual elements as shown in Table A3 and A4. None
of them make reference to a legend, which reinforces their classification among non-cartographic
drawings. When textual elements exist, they are generally used to facilitate an understanding of other
elements in the drawing, or to situate the drawing in a context, for example, the word “countryside”
to localize a path crossing fields.
3.2.2. Identification of Objects
We identified 663 objects in the 133 drawings analyzed, an average of almost 5 objects per
drawing (average: 4.96, median: 4, min: 1, max: 14, standard deviation: 2.57). These objects are
grouped into 125 different forms, and assigned to 11 different classes, which include 6 spatial and 4
non-spatial classes and 1 class for “other” elements). Seventy-nine of the object forms were only
drawn once, representing approximately 60% of the total number of forms. The relatively low
number of different forms reflects the significant recurrence of certain objects within the drawings.
This can be interpreted as evidence of a shared representation among the participants. The following
paragraphs present the characterization of each class and its results.
Presence of Humans, Ticks, and Animals
The first three classes of objects are presented in Table 6. They mark the presence of humans,
ticks, and animals in the drawings. They are separated to differentiate three dimensions. The presence
of humans in the drawing shows the projection of the individual in his environment and the potential
anthropization of the space. The presence of ticks highlights the perception of their presence in the
environment. The presence of animals is an important factor in the analysis because it indicates an
understanding of the risk involved in the interaction with potential hosts, such as wild animals and,
particularly, the close proximity with pets (usually dogs).Land 2019, 8, 46 11 of 32
Table 6. Presence of humans, ticks, and animals in drawings (n = 133).
Presence Number %
Yes 28 21.1
Humans
No 105 78.9
Yes 18 13.5
Ticks
No 115 86.5
Yes 39 29.3
Animals
No 94 70.7
We can see clearly that these three classes are not frequently found in the drawing. The most
significant is the presence of animals in nearly a third of the drawings. These are mostly pets
represented by 21 dogs and 8 cats. This points to the relationship between these domestic animals
and the representation of the tick bite risk. The other animals in the drawings are mostly farm animals
(horses, cows) and wild animals (deer). However, only one drawing refers to small wild animals (a
hedgehog), and only four refer to birds. These smaller animals are the main hosts of ticks and greatly
contribute to the spread of disease. Moreover, we see no link between the drawing of ticks and
animals, or ticks and humans, but humans and domestic animals are frequently seen together (in 20
drawings). Ticks are represented independently, and the drawings contain no reference to the
mechanisms of transmission between species.
Elements of Climate or Weather
Weather and climate play an important role in tick biting. However, these elements do not
appear frequently in the drawings. Only about 20% of participants (Table A5) include objects related
to this factor in the drawings. The most frequently found is the sun (22 times), which is intended to
express the notion of good weather or warmth.
Landscape Elements
The analysis of the drawings reveals five categories of elements related to the space and more
specifically to the landscape represented by the participants (Table 7). Two categories concern
elements of plant cover. We split these into two categories to differentiate trees from other plants.
Forest cover is important in the proliferation of ticks, which is linked to the presence of host animals
and consistent levels of moisture in the soil, and in the sampling of our population, who live near
forests. Thus, nearly three-quarters of the drawings show trees, and often in the form of forested
areas. This shows that participants made a strong link between this type of plant cover and TBR.
More specifically, in a number of drawings, it was possible to differentiate between hardwood (37
times) and coniferous (23 times) trees. This important aspect may indicate a lack of understanding
among certain participants, since coniferous forests are less suitable for ticks and harbor less risk than
hardwood or mixed forests. Other types of vegetation cover are present in more than four-fifths of
the drawings. This is the main element for the majority in the sample. The participants associate the
risk of tick bites with the presence of plants. Thus, the representation of tall grass, the most frequent
element of the class, appears in about 92 drawings. This is a classic element associated with ticks,
which do indeed climb on plants of an average size to wait for a host. It is therefore an element well
integrated by participants, along with the presence of trees. Note that among plants (without trees),
the variety of objects is greater than in the previous category. Along with tall grass, there are also
bushes (26 times), flowers (15 times), and even mushrooms (12 times).
Table 7. Landscape elements in drawings (n = 133).
Characteristics Number %
Yes 102 76.7
Forested
No 31 23.3
Plants (without Yes 108 81.2
trees) No 25 18.8
Yes 65 48.9
Pathways
No 68 51.1Land 2019, 8, 46 12 of 32
Yes 19 14.3
Buildings
No 114 85.7
Yes 29 21.8
Reliefs
No 104 78.2
Water Yes 22 16.5
environment No 111 83.5
Another category, pathways, is found in about half of the drawings. These are mostly a
representation of paths or trails (63 times) that cross the plant landscape mentioned above. They often
evoke examples of walking or hiking that show the association between this type of activity and the
risk of tick bite (linked, for example, with a depiction of mushrooms). It is interesting to note that the
three remaining landscape categories are not often present. The relationship between pathways and
plants in landscapes is therefore an important structuring element in the representations.
Nevertheless, there is a presence of relief elements (mountains are observed in more than 20% of the
participants’ drawings. This may seem surprising since ticks are found less often at altitudes above
1,500m (although warming trends raise this limit)). However, two explanations can be proposed: The
link with the image of walking or hiking trails and the sampling that covers a population that lives
in or near a mountainous area. Some respondents also note the presence of elements of an aquatic
environment (lake, pond, river). Even though ticks do not live in the water, it is possible that this
association is again a link with wild, undeveloped areas accessible on foot. This would then
correspond to the relative absence of the final category that refers to developed space. Houses,
gardens, villages, and towns are poorly represented. This suggests that the image of an environment
harboring more risk of tick bite is more often associated with a natural space than an urbanized one.
Other Elements
Finally, the drawings also contain a number of other elements that cannot be placed in a previous
category and are too few to be classified in a new category (Table A6). Given their heterogeneity, they
are grouped into another class. For example, there is a drawing of an umbrella, garbage bins, a shovel,
and a barbecue. They are explained more specifically by the individual drawing in which they were
produced. However, nearly 80% of the drawings do not have elements of this category, which
supports the completeness of the proposed categorization.
3.2.3. Multiple Correspondence Analysis and Hierarchical Clustering.
The hierarchical clustering derived from the multiple correspondence analysis on the pre-
iconographic analysis data shows a relevant four-class distribution that maximizes inter-class inertia.
This classification is visible in the dendrogram in Figure 3. It does not take into account type or scale
criteria, which exert too much influence on the results, but focuses on the categories of objects
represented in the participants’ drawings. The statistical analysis shows that the element categories
which best explain this classification are the presence or absence of buildings, humans, plants, climate
elements, or geographical reliefs.Land 2019, 8, 46 13 of 32
Figure 3. Dendrogram of the hierarchical clustering.
The first class (cluster 1 of the dendrogram) groups together 50 drawings. This is the main class.
It is formed by drawings that are characterized by the absence of elements indicating anthropization
(humans or buildings), and the absence of ticks, geographical reliefs, or elements of climate. It is
particularly characterized by the presence of plant cover (especially ground vegetation as opposed to
tree canopy) and, to a lesser extent, animals and/or pathways. Often, this class simply reflects a
representation centered around a pathway crossing a plant cover. The drawing of Figure 4 is
characteristic of this class.Land 2019, 8, 46 14 of 32
Figure 4. Example of a typical drawing in class 1.
The second class (cluster 2 of the dendrogram) groups together 26 drawings. In direct contrast
to the first class, these drawings do not feature elements of vegetal cover or pathways. This class also
includes the category, “others”, and drawings characterized by the presence of reliefs. The objects in
these drawings represent little or no spatialization, sometimes describing specific landscape elements
(a mountain range) or a specific situation, such as a campsite. The images in this class leave the
impression of being drawn by individuals who had difficulty drawing or difficulty understanding
the instructions. Figure 5 shows a typical drawing from this class.Land 2019, 8, 46 15 of 32
Figure 5. Example of a typical drawing in class 2.
The third class (cluster 3 of the dendrogram) includes 17 drawings. This class presents the most
objects referring to climate, plants, buildings, and/or elements of an aquatic environment. These are
drawings that characterize fairly specific and anthropized environments, such as family gardens, or
recreational parks and lakes, where nature is constrained to a greater extent by humans. The drawing
in Figure 6 is characteristic of this class.
Figure 6. Example of a typical drawing in class 3.Land 2019, 8, 46 16 of 32
The fourth class (cluster 4 of the dendrogram) groups together 40 drawings. Numerically, this is
the second largest class of drawings. It is similar to class 1 in the sense that it strongly emphasizes the
presence of vegetation cover (especially trees), animals, and pathways. This class is also characterized
by the absence of buildings, however, its drawings often depict the presence of humans and/or ticks,
where the interviewee describes himself (or humans in general) in a more precise place in the TBR
environment. In these drawings, we can see that the human becomes the central element in the
perception of the path crossing a plant cover along with the presence of pets. The drawing in Figure
7 is typical of this class.
Figure 7. Example of a typical drawing in class 4.
The hierarchical classification identifies two main classes (class 1 and class 4) accounting for
nearly 68% of the drawings. Both classes are largely based on the representation of a pathway
crossing a vegetation cover that frequently includes an image of pets. These are therefore the central
elements in the interviewed population’s representation, which is more often a depiction of a wild
and less anthropized nature. This is contrary to the depictions in the third class, which present a
representation of TBR corresponding to the proximity with buildings and/or places of leisure. The
second class remains the most remote by virtue of its minimal or absent spatial character, where the
image of a landscape less pronounced.
3.3. Textual Analysis
As noted earlier, we performed a textual analysis of the participants’ verbalization, which was
recorded during the drawing phase of the interview. This analysis allowed us to establish four classes
of verbalization that more explicitly reveal how individuals interpret the TBR. These classes
correspond to specific perceptions that are partially independent from the drawings themselves. The
analysis provides a dendrogram (Figure 8) showing one class of speech that represents 30.8% of the
corpus and remains independent of the other three classes as part of the initial partitioning of the
hierarchical clustering.Land 2019, 8, 46 17 of 32
Figure 8. Dendrogram resulting from the textual analysis of the interviewees’ recorded
verbalization during the drawing of mental maps (n = 133).
This first class of verbalization, described as “rural” (30.8%), includes the majority of the
expressions of animals: dogs (χ2: 36.58, p < 0.05), cats (13.38, p < 0.05), wild animals (9.07, p < 0.05))
and farm animals, such as cows (25.37, p < 0.05) or herds (6.79, p < 0.05)). It characterizes a more rural
view of TBR with associated landscape terms: Pond (11.37, p < 0.05), vegetable garden (11.37, p < 0.05),
hedge (11.21, p < 0.05), pasture (11.37, p < 0.05)), or words, like boot (11.37, p < 0.05). It is also the class
where the place of humans (15.99, p < 0.05) is central in the drawing description and where disease
or Lyme disease itself is mentioned: disease (7.47 p < 0.05), Lyme disease (5.74, p < 0.05). Following is
a typical transcript of verbalization in this class:
“It’s quickly seen, I’m going to make you a place, I’m doing a house, that’s it. There I am going
to make a small path. There I will make you a forest quickly. So there the forest, the little path,
little path. There I am going to make you a stable, I mark stable, I have right, a stable and then
I’ll put, I put a key, a small barrier, a small stream, I mark? A small stream, there are fields, there
are grass, small flowers too. There is the cow, I’m bad at drawing anyway, I’m bad, cow. There
I think that’s the risk. In any case, for me the risk is in rural areas it is not in urban environment
though… Oh no, there are also dogs, dogs that go in the weeds near the creeks. It makes me
think a little about the farm at my parents’ house, well, what does it do, because wood… I do
not think so. Yesterday I went to the wood I did not chop and yesterday when I went to give the
flour with the cows, there are ticks they have and dogs bring us back. Ah, and in the hay too, the
little haystack. I’m a little peasant on the edges” (Text B1).
The other three classes of speech are more closely related, but maintain some differences. They
all refer to forest vegetation cover, but offer certain contrasts.
The largest class, which we called “natural”, represents 31.3% of the verbalization recorded. The
words in this class are more likely to identify details of the natural environment and make no
reference to anthropized elements except for paths (χ2: 26.39, p < 0.05) where the individual goes (9.03,
p < 0.05) or walks (9.25, p < 0.05). Most of the details concern the vegetation (14.2, p < 0.05): Tall grasses
(71.89, p < 0.05), bushes (26.73, p < 0.05), trees (21.85, p < 0.05), brambles (13.37, p < 0.05), wastelands
(6.64, p < 0.05), ferns (3.7, p < 0.05), woodlands (3.59, p < 0.06), etc. There are also elements qualifying
the relief as mountains (10.86, p < 0.05) or the presence of aquatic environments, such as river (18.68,
p < 0.05), wet (9.03, p < 0.05), and water (6.56, p < 0.05)). Following is an example of this type of
verbalization:Land 2019, 8, 46 18 of 32
“Then I will see a way because potentially more mountainous, it is not a marked path but
especially not a paved road. Herbs, tall grass everywhere, on the way or next to it, small bushes
in various places. We will not put them on the way because if there is a path there is no bush,
trees, that’s it. Of the forest too, small trees, medium trees and potentially we do not just stay on
the way when we walk and we can go to that side where possibly. We can believe in safety but
we can is not always. That’s the idea for me, both of the grass of the trees, of the vegetation.”
(Text B2).
The “recreational” class is next and concerns 19.9% of the words recorded in the verbalization.
It is characterized by terms related to recreational activities in nature. The following are examples of
activities that are mainly found in this class: Gathering (χ2: 35.25, p < 0.05), mushroom picking (28.54,
p < 0.05), picnics (20.36, p < 0.05), hiking (15.53, p < 0.05), lake swimming (11.85, p < 0.05), stroll (4.14,
p < 0.05), and eat (4.14, p < 0.05). Here, we also find references to trees that are less characteristic to
TBR, such as conifers (35.72, p < 0.05). The following is an example of verbalization in this class:
“Well, it can be in nature in a forest. A surrounding forest of the chain of Puys for example. Here.
If I evolve with little protection in the legs, arms, during a search for mushrooms for example. I
do not know if it looks like mushrooms, that’s mushrooms. The forest… After it can be during a
friendly picnic in the nature at the edge of a lake in the grass. Can we make a lake? I can write,
so lake. It’s minimalist like drawing, lake. After we are in the herbs, the herbs, in the flowers and
then we are lying in there, or sitting, we rest we relax, moments like that. It can be in the garden
too. I have a vegetable garden with vegetables. I am in it I work my land, and then vegetable
garden. Around there is also grass and it can be in also on this occasion. Let’s say that I work my
garden, I’m not very good in drawing, it’s not an artistic contest but for example I would like to
make a tool, like a spade, knowing that I do not dig in the middle of summer it would be rather
a fork can -being a hoe, in the kitchen garden […] So picking in the forest, mushrooms, lake,
picnic, gardening, it’s situations.” (Text B3).
“Contrasting” is the last class and represents 18.01% of the verbalization. Its unique aspect comes
from the fact that it is the only class that does not specifically characterize the natural environment.
There are more generic words that relate to drawing skills, such as draw (χ2: 28.18, p < 0.05) and
represent (21.0, p < 0.05); words related to urban life, such as house (11.61, p < 0.05) and city (7.2, p < 0.05)
and live (22.25, p < 0.05); words related to means of transportation, such as car (13.76, p < 0.05) and train
(6.04, p < 0.05) and boat (4.84, p < 0.05); or related to ticks themselves, such as bite (14.92, p < 0.05), paw
(13.76, p < 0.05), species (2.98, p < 0.05), or ticks (9.5, p < 0.05). In general, it is a class of verbalization that
involves traditional descriptions of the natural environment and the activities related to it. The
following two transcriptions are typical of the verbalization that characterizes this class:
“So what comes to mind is grass, it’s not too hard but it’s very badly drawn. And after, it can be
in the countryside but it can be in a garden in town. I caught it not so long ago in a garden in
town. As long as there is grass for me it is everywhere where there is grass and animals often. It
can be dogs or something else but that’s all. Me where we meet them is in the grass.” (Text B4).
“I do not know, I do not know where they are in nature but where I will be afraid of being bitten
it is admitted that one is in my room, there I have my bed, there is my dog who is lying on it, I
am here and then for some reason he scratches himself and the tick comes out of his coat and it
comes on me. This is where I will be most afraid of being stung. I do not know if there is any in
the nature where anything, on the cover yes…“ (Text B5).
3.4. Cross Analysis
The cross analysis allowed us to combine the data from the pre-iconographic analysis of the
drawings with that of the textual analysis of the verbalization, and to include the socio-demographic
characteristics of the individuals, their knowledge on the TBR (biting experiences, knowledge of bite
sites, knowledge of prevention methods), and their outdoor activities. The results of this analysis,Land 2019, 8, 46 19 of 32
shown in Table 18, make it possible to qualify the verbalization according to the class of drawing and
the variables.
Table 8. Verbalization classes from the textual analysis with the sample and drawing variable (n = 133).
“Rural” “Natural”
Variable X2 p Variable χ2 p
Expbite_none 8.03Land 2019, 8, 46 20 of 32
The climate is present in their drawings, as is the notion of pathways. Class 4 drawings refer to a
population that takes regular hiking trips further away from their home where they encounter TBR.
The “recreational” class is characterized by the presence of a majority of women. It also includes
households with higher incomes and those who participate in frequent outdoor activities, further
from home, such as picnicking or hunting for wild mushrooms or berries. As with the natural class,
the recreational class is often associated with class 4 drawings and an urban profile, but is marked by
the absence of hiking as the primary leisure activity.
The final class of verbalization, “contrasting,” is particularly identified with the class 2 drawings.
Here, we find a population that is not often familiar with TBR and is rarely confronted with the risk,
except in urban or peri-urban activities (such as jogging). It is mostly a younger population that
displays little knowledge of places associated with TBR. Drawings from both classes 2 and 3 reflect a
close proximity to urban space in the representation and a difficulty of projecting experience to a
wider, unknown environment. These last three verbalization classes primarily reflect the urban
population surveyed around Clermont-Ferrand, and the socio-demographic characteristics of the
area’s collection sites.
This cross analysis shows that the verbalization which occurred during the drawing of mental
maps is a fundamental element of the analysis and undeniably enriches the data. The verbalization
of most interviewees adds essential elements (experiences, precision, etc.) that complement the
unspoken elements of the interview’s drawing process. This corresponds with the methodological
position discussed previously [47].
4. Discussion
4.1. Tick Bite Risk and Socio-Spatial Representations
The perception of TBR appears to be built from the individual’s social and spatial identities that
echo past experiences and the ability to understand this risk in a spatial sense. These are socio-spatial
representations of the TBR and not simply collective representations [24].
4.1.1. Representational Elements.
First, we see a variety of elements that make up this representation. The pre-iconographic
analysis, reinforced by textual analysis, highlights the predominance of natural spaces that
encompass various forms of vegetation cover, such as tall grass, shrubs, or forests. The vegetation
cover is often detailed (genet, fern, brambles, etc.). The representations suggest that risk is associated
with the distance from certain species judged as dangerous. Moreover, most participants also
identified the forest in their drawings. This reflects the statistical reality of an increased risk of tick bites
in forests, especially hardwood or mixed (deciduous and coniferous) [12,33,57,58]. However, the
difference in risk according to the type of forest appears to be unknown to most individuals. Few
indicated the lower risk from coniferous forests either in drawings or verbally. As a sort of inhospitable
universe, the forests are often described as dense or dark, and risky plant cover is described as
wastelands, brambles, and bushes. Forests with sufficient humidity and the presence of typical animal
hosts (rodents, birds, deer, etc.) do, in fact, provide favorable terrains for the ixodes ticks.
Animals have an important place in the representations, but these are often pets rather than wild
animals (particularly noticeable in the Combrailles sector). A large proportion of individuals
included pets in their representation because of their independent ability to bring back ticks. This
suggests that the participants are aware of the risk of disease transmission to animals (even if specific
animal diseases are not mentioned). The link between animals and the transmission of Lyme borreliosis
is present in the representations, even if the animals themselves do not transmit the disease to humans.
They are of course hosts for ticks, but not all animals carry the bacteria that causes Lyme borreliosis. The
presence of pets is also a symbol associated with the practice of outdoor activities. For example, the dog
is often associated with walks in the countryside, and the cat with activities in the garden.
This leads to other reference elements, such as recreational spaces or objects. These are more
loosely defined elements, but they reveal the association between TBR and outdoor recreationalLand 2019, 8, 46 21 of 32
practices, such as hiking, walking, hunting for edible plants, picnics, etc. Included are references to
elements and accessories related to these activities (resorts, mushrooms, berries, hiking shoes, shorts,
bathing suits, picnic tables, etc.). However, the activities and elements related to walking are in the
majority of drawings and correspond to a stereotype of the TBR typically projected as an image of a
person walking in nature. The marked presence of paths in a large portion of the drawings reflects
this fact even if it is not the path itself, but the vegetation bordering the path that presents the risk.
More developed paths would generally offer less risk than undeveloped ones, where there is likely
to be more contact with adjacent vegetation.
To a lesser degree, individuals also cite aquatic environments, such as lakes, ponds, rivers,
marshes, etc. Although they can be considered a factor favoring humidity, the presence of ticks in or
in the immediate vicinity of water is unfounded. There appears to be a misconception among these
participants. The urban environment seldom appears in the drawings, but is associated with
questions that people might have about TBR: Are ticks found in town? Are urban gardens infested?
Do they live in our houses? There are clearly misconceptions concerning the biology and behavior of
ticks, which people see only occasionally in natural surroundings. For example, interviewees speak
of ticks often falling from trees. Even if a tick could theoretically fall from a bird or tree, all of the
situations where the interviewees encountered ticks or bites were typical of expectations that these
would come from a low branch, a bush, or grasses, or when one is already hooked (on an animal or
person). Similarly, the elements of climate are also significant. Individuals rarely referred to it, or did
so only in a sense limited to the sun and summer. However, ticks can be present for most of the year,
any time when it is not too cold or too dry, and autumn are particularly favorable. Global warming
has extended natural tick habitats [59] and it is not impossible to see one in winter or at increasingly
higher altitudes.
4.1.2. Socio-Spatial Anchoring
The content elements described above are expressed differently depending on the individual
and therefore contribute to representations that differ in their social anchoring. First, there is a fairly
clear demarcation between rural residents and those living in urban or peri-urban areas.
In our sampling, the individuals from rural areas generally have a lower standard of living, less
formal education, and are significantly older. The outdoor practices they reference are related to their
environment, such as walking, cutting wood, and fishing. Outdoor activities are rarely practiced far
from the family home and anchor the representation of the TBR in the immediate area of their rural
lifestyle. This environment is often linked to agriculture (meadow, pasture, cows, etc.) and
neighboring forests. Specific places are indicated where the interviewees believe they can be bitten:
The kitchen garden, a field, the banks of a river, an area where mushrooms grow. The representation
is often linked to a personal or family history that involves their environment [28]. The knowledge of
ticks is, however, not perfect and gaps remain with respect to means of prevention. The fear of Lyme
borreliosis is strong, and even though this is often the case in older populations, it does denote an
aspect of collective or shared knowledge.
Individuals from urban and peri-urban areas have higher levels of income, education, and
employment. Their outdoor practices (walking, hiking, etc.) are also noticeably close to the rural
environment, but often require more travel, further from the family home (particularly hiking), even
when they stay within a local radius of less than 30 km. The representation of the TBR is thus less
specific. It mixes tangible personal experiences with shared or socially acquired knowledge, which
elicits qualified verbalization, such as “maybe,” “not sure,” or “I think.” Knowledge of ticks and
prevention is less than average and experience with bites is less evident than among participants in
rural areas. The drawings are more likely to refer to a known place than a conceptualized landscape.
Nevertheless, there is little homogeneity in this more urban group. We can see that outdoor
practices often differ depending on the age of the individuals. The younger children leave the urban
space less often and rarely identify places related to ticks. Their practices are more limited (picnics,
for example), more localized (primarily in the urban space of Clermont-Ferrand), and representations
use more elements, which reflect information from media or from common sense in the generalYou can also read