Investor Presentation - The African Development Bank Group October 2016
←
→
Page content transcription
If your browser does not render page correctly, please read the page content below
Investor Presentation
The African Development Bank Group
            October 2016

                                     1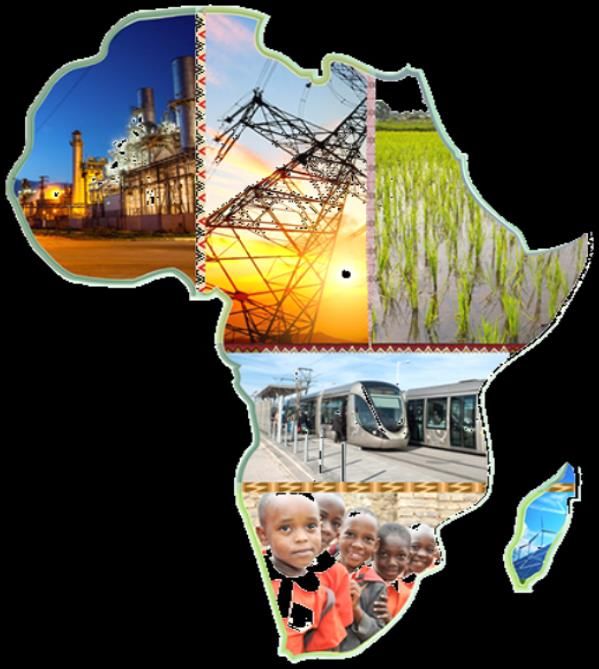
Table of contents

1   Overview of the Bank Group                     3

    Financial Profile of the African Development   22
2
    Bank

3   Capital Market Activities                      33

4   Appendix
       A - Financial Statements                    40
       B - African Economic Overview and Outlook   43
       C - Green Bonds                             48
       D - Frequently Asked Questions              69

                                                        2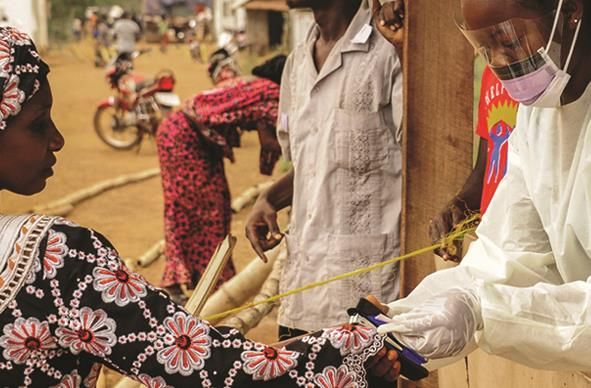
The African Development Group

                          Africa is a continent of contrast, rich in natural
                          resources yet its people are among the poorest in
                          the world. The image of Africa that gets projected in
                          the world is that of a continent with disease, hunger,
                          corruption and the need for aid beyond foreseeable
                          future. But, there is another story that is less told
                          which acknowledges the challenges faced by the
                          continent but also recognizes the progress made in
                          terms of more children going to school, less war,
                          growing quest for better governance and an
                          expanding middle class. The African Development
                          Bank is part of that story.

1   Overview of the Bank Group

                                                                                   3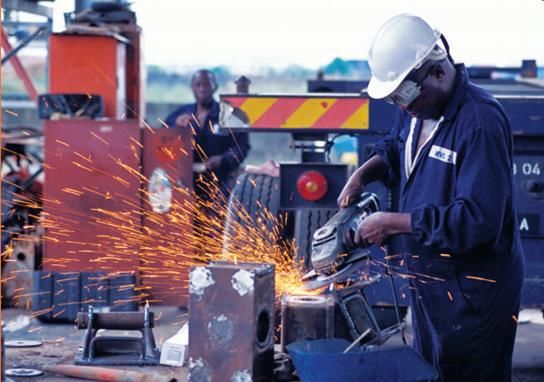
Africa’s premier development financial institution

     The AfDB Group: three constituent institutions, separate legally and financially, with a common goal…

            African Development Bank (“AfDB”)         African Development Fund (“ADF”)              Nigeria Trust Fund (“NTF”)

        •   Established in 1964                     • Concessional financing, established in    • Established in 1976 by Nigeria
        •   80 member countries                       1972                                      • Targeted at the Bank’s needier
        •   Authorized capital: US$ 93 billion      • Financed by 27 State participants and 4     countries
        •   Resources raised from capital markets     regional donors                           • Maturing in 2018
        •   0% risk weighting under Basel II        • Subscription: US$ 36 billion              • Total resources: US$ 235 million
        •   Level 1 under Basel III                 • Focus on low income countries
                                                    • Replenished every 3 years

                                                        Governance and Oversight
     • Board of Governors:                          • Board of Directors :                      • Decisions by both Boards require two
       • Highest decision making body,                 • 20 Executive Directors elected by        third majority or 70% should any
       • Composed of Ministers of Finance                the Board of Governors                   member require so
         and Ministers of Cooperation                  • Oversees the general operations of
         of the Bank’s member countries                  the Bank

…focused on combating poverty, and improving living conditions on the continent
                                                                                                                                         4
50 years of partnership for the development of Africa
             Americas                                                                                                               Europe
       USA                  6.6%                                                                                           Germany           4.20%
       Canada               3.9%                                                                                           France            3.80%
       Brazil               0.4%                      G-7 Shareholding: 28%                                                Italy             2.40%
       Argentina            0.1%                                                                                           UK                1.80%
                                                                                                                           Sweden            1.60%
                                                                                                                           Switzerland       1.50%
                                                                                                                           Denmark           1.20%
                                                                                                                           Norway            1.20%
                    Africa                                                                                                 Spain             1.10%
Nigeria             8.20%     Guinea          0.40%                                                                        Netherlands       0.90%
Egypt               5.60%     Mali            0.40%                                                                        Belgium           0.70%
South Africa        5.10%     Namibia         0.40%                                                                        Austria           0.50%
Algeria             4.20%     Malawi          0.30%                                                                        Finland           0.50%
Cote d’Ivoire       3.80%     Niger           0.30%                                                                        Portugal          0.30%
Morocco             3.60%     Sierra Leone    0.30%                                                                        Luxembourg        0.20%
Libya               3.00%     Sudan           0.30%
Ghana               2.20%     Benin           0.20%
Zimbabwe            2.10%     Burundi         0.20%
Ethiopia            1.60%     Eq.Guinea       0.20%
Kenya               1.50%     Gambia          0.20%                                                                             Middle East
Tunisia             1.40%     Liberia         0.20%
Angola              1.20%     Togo            0.20%                                                                        Kuwait                0.5%
Dem.Rep.Congo       1.20%     Cape Verde      0.10%                                                                        Turkey                0.3%
Zambia              1.20%     Cent.Afr.Rep.   0.10%                                                                        Saudi Arabia          0.2%
Botswana            1.10%     Chad            0.10%                         General Capital Increases
Cameroon            1.10%     Lesotho         0.10%   In USD million                                              60,612
Gabon               1.10%     Mauritania      0.10%
Senegal             1.10%     Rwanda          0.10%                                                                                       Asia
Tanzania            0.80%     Sao Tome & P.   0.10%                                                                         Japan                 5.5%
Madagascar          0.70%     Swaziland       0.10%                                           14,966                        China                 1.2%
Mauritius           0.70%     Eritrea         0.04%                                                     7,857               Korea                 0.5%
Mozambique          0.60%                                                5,584       1,545
                              Seychelles      0.04%            ,527                                                         India                 0.3%
South Sudan         0.50%     Somalia         0.04%
Uganda              0.50%     Djibouti        0.03%
Burkina Faso        0.40%     Guinea-Bissau   0.03%         GCI-I      GCI-II     GCI-III    GCI-IV    GCI-V    GCI-VI*
Congo               0.40%     Comoros         0.02%         1976       1979       1981       1987      1998      2010

      Shareholding as of June 2016
                                                                                                                                                         5
                                                      * 2 countries did not participate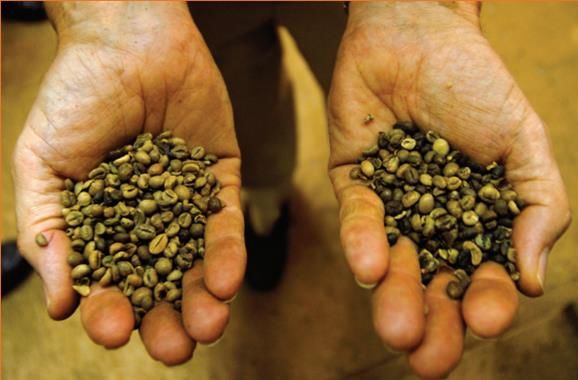
The Bank Group addresses the diverse needs of the continent
Preserving the long-term financial integrity of the AfDB
Additionality and Development
Outcome Assessment-Core
AfDB Sovereign Operations indicators
16 middle-income countries
eligible to receive AfDB funding
• Job creation
• Government revenues
Criteria :
• Financial return
GNI per capita
• Foreign currency earnings
Country’s creditworthiness
Private Sector Operations
Viable enterprises and multinational
ADF Concessional Financing projects, additionality and
34 low-income countries eligible development outcome
to loans and grants
• Direct loans
• Lines of credits
• Equity participation
• Guarantees
Access to both AfDB and ADF
10 countries eligible for both AfDB
and ADF Funding: Cameroon, Enclave Finance
Kenya, Nigeria*, Zambia, Côte Self-sustaining, export oriented
d'Ivoire, Ethiopia, Rwanda, project, located in an ADF-eligible
Senegal, Tanzania, Uganda country
* Nigeria graduated to the AfDB-only category in 2014 and is currently benefiting from a transition period
of 5 years which will be concluded on 31 December 2018 6
At the center of Africa’s transformation

                                           7
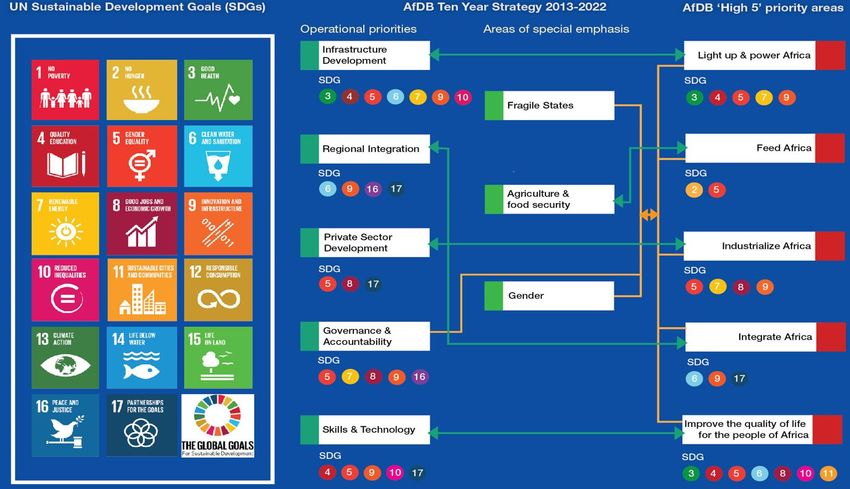
High 5s - Scaling up implementation of the Ten Year Strategy

                                                                                                                    Improve the quality of life
                                                                                                                     for the people of Africa
Light up and power Africa                                                                                          Develop innovative flagship
                                                                                                                      programs to open up
  Unlock the continent’s                                                                                             opportunities for youth
    energy potential in                                                                                           employment, improve access
   order to drive much-                                                                                            to basic services and create
 needed industrialization                                                                                          economic opportunities for
                                                                                                                        the extreme poor

                                    Feed Africa                 Industrialize Africa           Integrate Africa

                              Transform agriculture to      Lead other partners in the       Address barriers, create
                            increase productivity, lower     process of industrializing     regional value chains and
                             food prices, enhance food      Africa and developing the     leverage complementarities
                             security, revive rural areas     private sector to create          in order to tap the
                            and create jobs for Africans    wealth from natural assets       continent’s huge market
                                                                                                     potential
                                                                                                                                             8
Light up and power Africa
Energy in Africa,
a grey picture
Over 640 million Africans To provide universal energy
lack access to electricity access by 2025
Hydropower
provides about a Our • 162 GW electricity
fifth of current ambition generation
capacity but not even • 130 million on-grid
Per capita use of electricity a tenth of its total connections
Africa 613 kWh potential is harnessed • 75 million off-grid
Europe 6,500 kWh connections
USA 13,000 kWh • 150 million households with
access to clean cooking
solutions
Insufficient energy access
Partnership-driven effort
Work with partners to develop
Causes hundreds of thousands of deaths
Power shortages Africa’s poorest pay a framework that takes into
annually through the use of wood-
estimated to cost 60 – 80 times more account different energy
burning stoves
2% GDP annually, per unit in northern sources, geographic conditions,
Undermines hospital and emergency
undermining Nigeria than regulation and pricing,
services operations
economic growth, residents of technologies and distribution
Compromises educational attainment
employment creation New York mechanisms
Drives up cost of doing business due to
and investment and London
the use of generators
AfDB to invest USD 12 billion and leverage about USD 50 billion over 5 years
9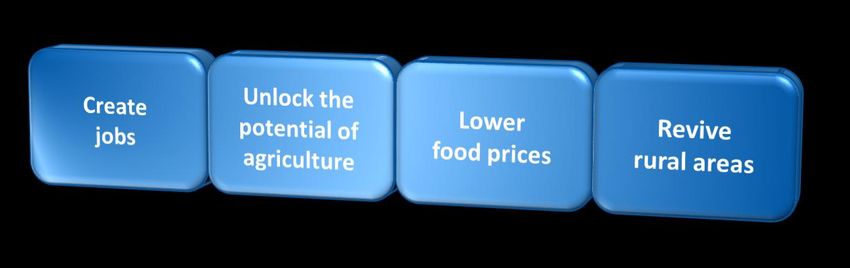
Feed Africa

Agriculture employs over 60% of the African workforce and accounts                                                              Inadequate
for 33% of the continent’s GDP, yet Africa is the world’s most                               Poor infrastructure
                                                                                                                               mechanization
food-insecure region

Heavy dependence on food imports (over USD 35 billion)
                                                                                               Limited access to
                                                                                             credit, fertilizers and        Insecure land tenure
More than 1 in 4 Africans is malnourished                                                         technology

Droughts, water scarcity and famine are well-known and real                               How is AfDB tackling these challenges?
                                                                                “Feed Africa initiative” will deploy financial resources to enable African
60% of arable land in the world not yet put to production is in Africa             countries to seize the opportunity to promote agriculture related
                                                                                                              industrialization
Africa’s potential for agricultural production is enormous                    Accelerate support for massive agricultural transformation across Africa to:

                Adequately
                                      Lift                   Restore
Our             feed 150
                                      100 million            productivity
                million
Goals:          additional
                                      people out             to 190 million
                                      of poverty             hectares
                people

                AfDB’s investment to quadruple from a current annual average of USD 612 million to about USD 2.4 billion                                 10
Industrialize Africa
African economies are largely dependent
on sectors with low added value Our ambition
• Africa’s share of global manufacturing at around 1.9%
• 62% of imports and 19% of exports are manufactured • Move Africa to the top of the value chain
• Increase industrial GDP by 130% to USD 1.55
Commodity dependence Industry GDP per capita trillion by 2025
(% government revenue) • Develop efficient industry clusters
North America • Provide policy advisory services, technical
East Asia assistance to governments and funding to key
Libya USD 11,500
98% USD 3,400 PPP projects
• Increase investment/financing to lend to
Equatorial Guinea small and medium enterprises (SMEs) and
85%
increase their capacity
Angola • Improve access to market finance for African
80% enterprises
Africa • Catalyze funding into infrastructure and
Nigeria industrial projects
USD 700
74% • Link up African enterprises and major projects
with potential partners and investors
Low value-added activities lead We cannot do it alone!
to low GDP/capita
AfDB to invest about USD 5.6 billion per year
11Integrate Africa
African countries are losing out on billions of
Policy Regulatory dollars in potential trade every year because
of fragmented regional markets and lack of
cross-border production networks that can
Regional integration challenges: spur economic dynamism
Institutional Infrastructural The Bank Group focus
Boosting Facilitating
Intra-African trade at 15%, lowest globally compared to Building regional intra-African movement of
infrastructure trade and people across
investment borders
70% in the EU 60% in Asia
Our ambition…..to lead several continent-wide initiatives targeting both “hard”
and “soft” infrastructure
• Continental Free Trade Area – to address Africa’s low internal and external
trade performances
• Comprehensive Africa Agriculture Development Program
54% in the • Program for Infrastructure Development in Africa – designed to develop
North America a vision and strategic framework for the development of regional and
Free Trade Area continental infrastructure
• Sahel and the Drought Resilience and Sustainable Livelihoods Program in the
Horn of Africa
AfDB to invest about USD 3.5 billion per year from 2016 to develop high quality regional infrastructure 12Improve the quality of life for the people of Africa
Our vision
Build
critical skills
Widespread inclusive growth, allowing all Africans
across different countries to have access to
• Basic services (education, health care, water and sanitation)
• Productive employment and entrepreneurship opportunities
Catalytic
approach
Improve access will turn
demographic Strengthen
Ensuring that Africa’s demographic growth yields significant to water and
sanitation growth into health systems
economic dividends and contributes to inclusive growth will
economic
dividends
Contribute to halting
Create 80 million
Offer a new hope for Create jobs
the migration flows
younger generations millions of jobs
draining African youth
13Delivering on a strong pipeline of projects
In USD million
Sectoral distribution of 2015 approvals
8,778
7,316
6,754
Industry: 0.1% Finance: 21.3%
Breakdown of infrastructure
approvals
Agriculture: 8.1%
2013 2014 2015 Communications
1.40%
ADB ADF NTF Special Funds
Infrastructure: 48.6%
Energy
Approvals by region Social: 9.4% 13.80%
22.80%
20.80%
17.70% 18.30%
Water
Multi-sector*: 12.5% Supply and Transport
Sanitation 27.20%
10.80%
9.60% 6.30%
* Multi-sector includes public finance management and other governance-related operations
14Innovating and crowding-in resources to do more
Large scale partnerships that enlarge the Bank’s footprint in Africa
USD USD USD USD
6 billion 2 billion 707 million 1 billion
Enhanced Private Sector
Africa Growing Together Fund Africa 50
Assistance for Africa
(China)
(Japan)
Risk transfer instruments improving capital efficiency
• Risk sharing vehicle that enables AfDB to
support more private sector projects in
Private Sector Credit lower income countries to increase
Enhancement Facility development impact
• Expected to catalyze USD 1 billion of
additional lending over 3 years
15Improving governance in Africa
Over 100 governance projects completed, resulting in better macroeconomic management, increased
tax revenue, more foreign direct investment and less time required to start a business
Mali USD 21 million Morocco USD 111 million
to improve public expenditure management to strengthen the commercial legal system,
in support of economic recovery institute tax reforms and promote Public-
Private Partnerships (PPPs) and institutions
Project will enhance fiscal decentralization, to combat corruption
ensure greater efficiency and transparency
in public procurement and strengthen Project will support competitiveness
internal controls and SME growth
Tanzania USD 69 million Zimbabwe USD 3 million
for policy reforms in the power to support Civil Society Organizations
utilities sector working in economic and financial
governance, women’s rights and
Reforms will address governance of Parliamentary capacity building
state owned enterprises initiatives on women’s economic
empowerment
16Fostering development through Trade Finance
Ample array of trade finance products
Unmet demand estimated at USD 120 billion annually
USD USD
Benefits countries by facilitating 1 305
Trade Finance Program international trade, critical for billion million
provides: economic growth
• Guarantees to major
international banks
• Trade liquidity support
to local banks and soft Consistent partner, even in times
commodity corporates of market stress
Risk Participation Trade Finance
Agreements Lines of Credit
Local partners provide Supported more than 1,000 trade
finance to SMEs and local transactions worth USD 3 billion USD
corporates, promoting since inception 110
intra-African and million
international trade
Liquidity and risk mitigation to more than AfDB 2014
85 local banks in more than 20 African Best Development
Two-thirds of the
countries, most of which are in Financial
transactions benefited SMEs
low-income countries and/or fragile
Institution in
and transition states
Soft Commodity Trade Finance
Finance Facilities
in Africa
17Building resilient health systems
AfDB made a valuable contribution towards the rapid containment of the Ebola outbreak
Many lives saved versus the Psychosocial support
prediction of millions dying provided to survivors
An estimated 321 million
Health systems strengthened, human
people in the Economic Community
resources capacity built to respond
of West African State (ECOWAS)
effectively to Ebola virus disease and
sub region benefited from AfDB
other infectious diseases
Ebola containment projects
Bank now supporting
Communities empowered to Post Ebola efforts through the
effectively respond to Ebola Post Ebola Recovery Social
Investment Fund project
18Addressing the energy gap
Low electricity access rates
Guinea Uganda Guinea-Bissau Gambia Senegal
12% 14% 19% 35% 57%
Gambia, Guinea, Guinea-Bissau, Senegal • 58,000 rural households in 16 districts
Uganda
• Pooling of hydropower to end power representing around 280,000 people will
The Gambia River Basin shortages benefit from the investment
• 1.3 million people will benefit from • Project will significantly improve public
Development Organization
regular and more affordable electricity institutions and businesses in the area
Energy Project Rural Electricity Access
• Interconnection network among the • Provide a reliable energy supply to 5,320
four countries will help share energy from business centers and 1,470 public
power plants in the area institutions
USD 1 billion with USD 134 million financed by the Bank USD 121 million project with USD 100 million financed by the Bank
19Water, the development nexus
Currently
Water is the lifeblood 3 key initiatives hosted by AfDB
30% 70% > 30% of the High 5s
of people in Africa do not have of water points
have no access to access to in rural areas are Food security Rural Water Multi-donor
reliable water modern non-functional African
Supply and Water
sources sanitation Water
Energy security Sanitation Partnership
hydropower Facility
Initiative Program
Industrialization
Countries in Africa can lose up to water is a key input and facilitator Help countries Increase financing Promote effective
achieve the objectives for water supply water management
5% 25% 2% Regional integration of the Africa Water and sanitation in policies and practices
of annual GDP of annual GDP of annual GDP transboundary waters Vision 2025 rural areas
to poor to droughts to frequent
coverage of and floods in power Improving quality of life In 2015, 13 projects worth USD 531 million were
drinking water affected outages through impact on health,
education, gender equity, approved for development of the water and
and sanitation countries
employment and livelihoods sanitation sector in Africa
20Path to green growth
Several African countries have already embarked on ambitious programs
that integrate climate action with sustainable development
Rwanda One of the world’s most ambitious
AfDB is committed
to tripling climate renewable energy strategies
finance to USD • Combines sustainability, wealth creation
National Strategy for and poverty reduction measures
5 billion per year
Climate Change and Low • Power generation from renewable
by 2020
Carbon Development energy to increase to 50% by 2017
Climate from 4% in 2008
Investment
Funds
USD 973
million
Ethiopia A comprehensive approach to mitigate the
impact of climate change
Global Africa Climate Climate Resilient • Almost all electricity comes from hydropower
Environment Change Fund
Facility Green Economy and generation capacity has tripled since 2005
USD 11
USD 252 Strategy • 53.5% of the population now enjoying access
million
million to electricity compared to 16% eight years ago
Sustainable Green
Energy Fund for Climate Fund
Africa USD 2.5
USD 102 billion funding
million target for 2016
21The African Development Bank
The financial position of the AfDB is very
strong. Thanks to its solid capitalization,
ample liquidity buffers and prudent risk-
management framework the institution has
the capacity to absorb potential shocks
emanating from the turbulent operating
environment. The Bank has substantial
headroom in risk- bearing capacity to
further expand its lending. Continued
financial and operational prudence will
remain key.
2 Financial Profile of the African Development Bank
22Summary financial information
June
(in USD million) 2011 2012 2013 2014 2015
2016**
Assets 31,107 32,605 32,335 33,251 34,212 37,439
Loans 14,210 16,928 17,842 18,324 17,405 18,760
Investments 11,653 9,971 9,372 10,637 10,791 13,515
Borrowings 19,810 20,408 19,939 20,828 22,173 25,651
Equity 7,494 8,207 8,980 8,809 8,895 9,324
Paid-in Capital net of CEAS* 3,601 4,108 4,581 4,730 4,647 5,070
Reserves 3,894 4,100 4,400 4,079 4,010 4,150
Income before distributions 253 301 278 220 134 104
Subscribed Capital 57,300 100,230 100,424 94,366 90,255 92,124
* Cumulative Exchange Adjustment on Subscriptions
** Unaudited
Note: Data converted from UA (SDR) to USD at period-end exchange rates
Source: AfDB Annual Report/Financial Statements
23A solid institution to pursue Africa’s development goals
Critical
Prudent financial Strong Diversified
development
risk management capitalization funding profile
mandate
Aaa/AAA/AAA
Extraordinary
Excellent Preferred shareholder
Liquidity creditor status support
Intrinsic financial strength bolstered by shareholders’ support
24Managing the Bank’s portfolio in a challenging environment
Bank’s internal
risk rating Portfolio risk profile
5
Sovereign WARR Non-sovereign WARR Combined WARR
4 4.0 (B)
3 3.0 (BB) Falling commodity prices
2.63 (BBB-) have negatively impacted
2 resource based non-sovereign
2006 2007 2008 2009 2010 2011 2012 2013 2014 2015 projects
WARR: Weighted Average Risk Rating
A defined risk appetite for the lending portfolio: BB+ to B- (i.e. 3 to 4) notwithstanding….
combined WARR at the
In USD million
Sovereign Non-sovereign
19,282
stronger end
18,577 19,055 18,760 of the targeted risk appetite
20 000 17,530
16 000 14,788
12,088 13,093
12 000 9,180
8,044 8,952
8 000
4 000
0
2006 2007 2008 2009 2010 2011 2012 2013 2014 2015 June 2016
25Strong risk bearing capacity to support business growth
Risk capital increased by USD 2 billion since 2006
Amount in USD 8,870
8,818 8,696
8,207 8,672
7,494
7,440 7,178
7,432 7,424 Adequate portion
6,699 of earnings
incorporated into
reserves
Reinforced capital
base bolstered by
2006 2007 2008 2009 2010 2011 2012 2013* 2014* 2015* Jun-2016*
payments received
under the sixth
Reserves in USD Paid-in Capital in USD general capital
* In 2013, AfDB adopted the economic capital framework and as a result, in computing risk capital, reserves were reduced after increase approved
taking into account adjustments for valuations of equity investments and borrowings through other comprehensive income in 2010
“Capitalization…
remains a key rating
strength for the Bank”
Fitch, August 2016
USD 1.5 billion of additional paid-in capital expected from 2016 to 2027
26A comfortable cushion for risk bearing activities
Measuring and monitoring capital requirements for credit,
counterparty, market and operational risks
9 000 8,870
In USD million Available
AfDB risk 8 000 risk
capital 3,160 capital
7 000
supports a (36%)
USD 19 billion 6 000 243 74 - 218 5,710
509
portfolio of 868
5 000 Risk
sovereign,
1,162 capital
commercial 4 000 5,710
and equity 3,070 utilized
3 000 (64%)
financing as
well as a USD 2 000
13.5 billion
treasury 1 000
portfolio 0
As of 30 June 2016
* Diversification benefit stems from correlation between risks
Capital utilization driven by the volume and quality of the Bank’s various risk exposures
27Safeguarding stakeholders’ interests
Key prudential ratios well within statutory limits
Leverage 100%
Limit
GCI-VI
Debt / usable capital 200%
(usable capital = Capital
80% Increase
Σ paid-in capital, reserves,
callable capital of non-
borrowing countries rated
A- and above) 60%
58% Leverage
Gearing 40%
Loans* + equity Global
Financial 28% Gearing
investments +
Crisis
guarantees / subscribed 20%
capital** + surplus +
reserves Leverage ratio Gearing ratio
*Including undisbursed 0%
** Unimpaired 2006 2007 2008 2009 2010 2011 2012 2013 2014 2015
28Positive allocable income in a negative operating environment
USD 2.9 billion of allocable
Allocable income at income since 2006 African Development Fund
comfortable level reinforces
the Bank’s financial capacity
USD 1.7 billion allocated to high Middle Income
USD 1.2 billion allocated Country Trust Fund
development impact initiatives
to reserves
Reserves have first and surplus accounts
claim on earnings Special Relief Fund
In USD million 287 • Non-sovereign operations generated a proportionally
234 larger share of revenue but higher profit margins were
109 190
counterbalanced by slightly higher provision rates
88
58
• Increase in non-sovereign operations provisioning
146 178 resulted from unfavorable operating context
132
• Low interest rate environment
2013 2014 2015
Allocation to development initiatives Allocation to reserves
AfDB cost-to-income ratio continues to be the lowest among peers
292015 income continues to fund key development initiatives
(in USD million) 2015 2014 2013 2012 2011
Income before distribution approved by the board 129 220 278 301 253
Distribution of income approved by the board 172 174 166 169 173
Net Income -43 46 112 132 80
(in USD million) 2015 2014 2013 2012 2011
Income before distribution approved by the Board 129 220 278 301 253
Adjusted for:
- Unrealized (gain)/loss on derivatives and borrowings 69 43 -53 16 5
- Translation (gain)/loss -20 6 -21 3 43
- Fair valuation (gain)/loss of macro hedge swaps 13 19 29 15 -5
Allocable Income (Income - Adjustments) 190 287 234 335 295
The income distributions approved by the Board of Governor for key development initiatives are reported as expenses
in the Income Statement in the year such distributions are approved.
The decisions on income distribution approved by the Board are made on the basis of Allocable Income
The allocable income represents the income before distribution for the year adjusted with unrealized gain/(loss) on
borrowings and related derivatives and translation gain/(Loss).
*Totals may not add up due to rounding 30Managing market risks
Minimize credit risk exposure with
Mitigating interest rate risk credit and derivative counterparties
Minimized by matching interest rate Minimum credit ratings established
characteristics of assets and liabilities for investments (A)
Stabilize net interest margin Minimum ratings for derivative
counterparties (A-)
Conservative
principles
underlying
our asset and Relying on our own resources in the
Prohibited from taking foreign exchange liability face of shocks before shareholders’
rate risk management support materializes
Liabilities in any currency matched Ability to meet net cash flow
with assets in the same currency requirements including debt
Currency composition of net redemption and loan disbursements
assets aligned with the SDR* for 1-year without access to
currency basket additional resources
*SDR: Special Drawing Rights
31Conservative management of liquidity
Multi-currency portfolio
AA+ to including:
AA-
43%
AAA
43% USD EUR GBP
A+ and
BBB+ and
lower
below JPY CHF CAD ZAR
13%
0.56%
AfDB investment portfolio
67%
Investment objectives
19%
10%
3%
1%
Capital Sovereign Financial Time Deposits Corporate bonds ABS
Liquidity Return Supranational and institutions
preservation Agencies
*As of 30 June 2016 32The African Development Bank
3 Capital Market Activities
33Funding needs driven by development financing commitments
Borrowing program
In USD million 11,869
Outstanding
5,667
3,844 4,664 3,912 borrowings of
USD 25 billion
2012 2013 2014 2015 2016
Issuing AAA bonds across continents…
USD
57%
NZD NGN KES
EUR
AED JPY HKD GHS CAD ZAR 36%
5%
SWAPPED INTO…
BRL BWP AUD EUR USD
IDR
CHF
VND ZMK GBP UGX ZAR 2%
Derivatives used to protect against
currency risks and interest rate risks
MXN TZS TRY CHF SEK
RUB SGD
34A global footprint
Sourcing funding opportunities for the Bank and its clients while catering to investor demand
CANADA
USD 1mln SWEDEN
USD 238mln
UK RUSSIA
USD 809mln USD 23mln
Diversified SWITZERLAND
funding… USD 359mln
EUROPEAN UNION
USA USD 668mln TURKEY JAPAN
USD 16,084mln USD 194mln USD 1,980mln
VIETNAM
UAE
USD 19mln
Global benchmarks GHANA USD 136mln
MEXICO
USD 40mln INDONESIA
USD 105mln ZAMBIA
USD 7mln USD 11mln
Public Domestic Issues NIGERIA
BRAZIL USD 82mln UGANDA
USD 776mln USD 18mln
Private Placements
NEW ZEALAND
AUSTRALIA USD 149mln
Uridashis SOUTH AFRICA USD 2,871mln
USD 710mln
Euro commercial paper
As of 30 June 2016
Loans Outstanding borrowings before swaps
35AfDB global benchmarks
Quality and rarity continue to drive successful issuance
Feb 2016 Apr 2016 Jul 2016 Sept 2016
USD 1 billion USD 1 billion USD 1 billion USD 1 billion
1.125% due March 2019 1.000% due May 2019 1.250% due July 2021 1.125% due September 2019
US Treasuries + 29.5bps US Treasuries + 20.3bps US Treasuries + 23.2bps US Treasuries + 26.9bps
Midswaps + 29bps Midswaps + 13bps Midswaps + 24bps Midswaps + 9bps
Central Banks and Official Central Banks and Official
80.8% 68.3% Central Banks and Official Central Banks and Official
Institutions Institutions 64.2% 67.2%
Institutions Institutions
Asset Managers/Fund
Bank Treasuries 8.3% 20.1%
Managers Asset Managers/Fund
18.1%
Managers
Asset Managers/Fund Bank Treasuries 20.5%
7.8% Bank Treasuries 7.3%
Managers
Bank Treasuries 10.9%
Corporates 1.7% Corporates 3.8%
Asset Managers/Fund
15.3%
Managers Corporates 3.8%
Insurance Companies 1.4% Insurance Companies 0.4%
Africa Africa Africa Middle East
14.3% 17.0% 2.5% Africa
12.0%
2.9%
Europe
39.0%
Europe Europe Europe
Americas
48.4% 48.8% 37.7%
20.4%
Americas
Americas 45.8%
Americas 27.3%
37.0%
Asia
Asia Asia Asia
17.0%
11.9% 6.9% 11.1%
Solid reputation High quality of execution A very strong development mandate and
Pristine AAA rating and fundamentals
business profile 36Kangaroos, Bulldogs and Euro benchmarks
GBP 250
million bond
due December
2018 issued in
Inaugural Euro benchmark 2016
EUR 750
million bond
due October Back to Sterling…
2026 issued
in 2016
Building a curve Total amount
in Australia… of AUD 175
million issued
in 2016
1000
In AUD million Total amount
650
of AUD 375
500
million issued
300 325 in 2015
250 275
Note: Bulldogs and Kangaroos are bonds issued in the
UK and Australia respectively by a foreign borrower
Jan 2018 Feb 2019 Feb 2020 Mar 2022 Mar 2024 Jan 2025 Jun 2026 37Accessing Africa’s foremost bond markets
Authorization to freely
Authorization to issue in exchange bond Withholding tax
Waivers the domestic market proceeds in any other exemption
requested for currency
bond issuance
in domestic
markets
Confirmation that the Eligibility of the bonds
bonds will be accorded for bank liquidity ratio
Tax exemption on
an asset-risk weighting requirements
income and gains to
of 0% AfDB bonds are level 1
bondholders
AfDB bonds are 0% risk assets under
weighted under Basel II Basel III
Landmark NGN 12.95 billion 7-year
domestic bond in Nigeria Issuance in Uganda ZAR 650 million
First-ever debt program from amounting to UGX 25 3-year Eurobond in
a supranational issuer billion since 2012 2014
AfDB and Bloomberg launched the AFMI Bloomberg African Bond Index (ABABI ) – 2015
Transparent and credible benchmark indices to provide investors with a tool with which to measure and track
the performance of Africa’s bond markets
Composite index comprised of the Bloomberg South Africa, Egypt, Nigeria and Kenya local currency sovereign
indices
38Socially responsible issuer tapping sustainable markets
Good Environmental, Social Strong name recognition in
A strong and transparent Green Bond Framework underpinned
and Governance (ESG) Japanese Socially Responsible by transformative climate adaptation and mitigation projects
credentials Investing (SRI) markets
South Africa - Xina Solar One Concentrated Solar Power Plant
USD 20 million Infrastructure Nigeria - Urban Water Sector Reform and Port Harcourt Water
bond due July 2025 Supply and Sanitation
AUD 100 million Food
Kenya - Lake Turkana Wind Farm
Security bond due April 2020 Zambia - Ithezi-Tezhi Hydropower Plant
Morocco - Power Transmission and Distribution Development
AfDB adheres to the Green Bond Principles
DECEMBER 2015
AfDB Green bonds Dedicated AfDB green investors
Blackrock, California State Teachers Retirement System (CalSTRS), AFRICAN DEVELOPMENT BANK
2015 Calvert Investment Management, Nordea Investment Management, USD 500,000,000
1.375% Green Bond
2014 USD 500 mln Pictet Asset Management, Praxis Intermediate Income Fund, Senior Unsecured Notes
Due 2018
2013 SEK 2 bln Raiffeisen Capital Management, State Street Global advisors, Second,
USD 500 mln Third and Fourth Swedish National Pension Funds, Teachers Insurance “Best Green Bond”
EMEA Finance
and Annuity Association (TIAA) Asset Management, Trillium Asset
Management, Zürcher Kantonalbank Asset Management
Helping Africa gradually transition to green growth
39The African Development Bank
4 Appendix
A. Financial Statements
40AfDB Income Statement (UA million)
Year ended 31 December 2015 2014 2013 2012 2011
Operational Income and Expenses
Income from Loans 350.20 342.13 335.01 351.16 314.92
Income from Investments and related derivatives 122.21 132.41 131.24 199.35 168.85
Income from Other Securities 3.73 3.85 3.95 4.83 5.41
Total income from Loans and Investments 491.20 484.73 470.20 555.34 489.18
Interest and amortized issuance costs (346.13) (375.96) (302.99) (356.41) (316.82)
Net interest on borrowing-related derivatives 180.22 221.21 111.85 139.16 112.16
Unrealized losses on borrowings, related derivatives and others (49.51) (29.83) 34.11 (10.17) (3.04)
Provision for Impairment on Loan Principal and Charges Receivable (65.43) (18.02) (41.14) (29.69) (17.68)
Provision for Impairment on Equity Investments 0.43 0.75 0.76 (0.05) (0.15)
Provision for Impairment on Investments - - 9.19 0.29 6.39
Translation Gains/(Losses) 14.60 (4.07) 13.33 (2.27) (27.95)
Other Income 4.27 3.39 3.02 15.29 4.46
Net Operational Income 229.66 282.20 302.98 309.79 246.55
Administrative Expenses (122.00) (123.16) (110.97) (107.55) (79.50)
Depreciation – Property, Equipment and Intangible Assets (9.05) (7.61) (6.70) (4.59) (4.47)
Sundry (Expenses)/Income (5.44) 0.26 (4.98) (1.94) 1.93
Total Other Expenses (136.49) (130.50) (122.65) (114.07) (82.04)
Income before Distributions Approved by the Board of Governors 93.16 151.69 180.33 195.71 164.51
Distributions of Income Approved by the Board of Governors (124.00) (120.00) (107.50) (110.00) (113.00)
Net Income for the Year (30.84) 31.69 72.83 85.71 51.51
1 UA = 1 SDR = 1.53527 USD (2011) = 1.53692 USD (2012) = 1.54000 (2013) = 1.44881 (2014) = 1.38573 (2015) 41AfDB Balance Sheet Highlights (UA million)
Year ended 31 December 2015 2014 2013 2012 2011
Assets
Due from Banks 1,214.61 406.71 954.13 881.45 344.16
Demand Obligations 3.80 3.80 3.80 3.80 3.80
Treasury Investments 8,392.26 7,341.62 6,058.45 6,487.51 7,590.47
Derivative Assets 1,454.62 1,143.68 985.96 1,558.33 1,696.68
Non-Negotiable Instruments on Account of Capital 0.27 0.74 1.20 1.97 3.04
Accounts Receivable 489.54 640.16 843.86 762.67 914.85
Outstanding Loans 12,868.55 12,496.52 11,440.70 10,885.80 9,373.52
Hedged Loans – Fair Value Adjustment 79.84 112.70 32.49 86.85 49.87
Equity Participations 703.27 596.82 525.01 438.56 309.76
Other Securities 46.42 94.11 82.90 76.54 79.99
Other Assets 93.56 79.46 41.22 31.06 13.34
Total Assets 25,346.74 22,950.83 20,996.72 21,214.55 20,261.45
Liabilities, Capital and Reserves
Accounts Payable 1,332.39 1,211.81 1,246.11 2,083.07 1,974.68
Derivative Liabilities 1,084.99 853.74 971.85 512.60 502.29
Borrowings 16,449.26 14,375.95 12,947.44 13,278.80 12,902.96
Capital Subscriptions Paid 3,727.69 3,438.23 3,147.08 2,839.48 2,505.97
Reserves 2,921.25 2,815.32 2,856.88 2,667.44 2,536.18
Total Liabilities, Capital and Reserves 25,346.74 22,950.83 20,996.72 21,214.55 20,261.45
1 UA = 1 SDR = 1.53527 USD (2011) = 1.53692 USD (2012) = 1.54000 (2013) = 1.44881 (2014) = 1.38573 (2015)
42The African Development Bank
4 Appendix
B. African Economic Overview and Outlook
43Resilient growth in the face of global and regional headwinds
Drivers of Africa’s growth
10
GDP growth (%)
Strong public investment
8
in infrastructure
6
Asia Pacific
4
Strong domestic
Africa consumer base
North America
2
Europe
0
Latin America
2006 2007 2008 2009 2010 2011 2012 2013 2014 2015
and the
Burgeoning
-2 Caribbean services sector
-4
-6
Gradual economic
diversification
44Diverse country-specific factors driving growth
4%
2% Growth picked-up on the back
North of improvements in political
Africa 2014 2015
and economic stability
Five of the ten fastest-growing
6%
countries in the world with 3%
Lower growth due to depressed
West commodity prices as well as to
real GDP growth above 7%
Africa the impact of the Ebola outbreak
are in Africa 2014 2015
Ethiopia
6%
Central 4% Decline in oil and metal prices
Côte d’Ivoire adversely affected growth in
Africa the region
DRC
2014 2015
Rwanda
7%
East 6% Political instability in Burundi
and South Sudan weighed down
Tanzania Africa on growth in the region
2014 2015
3% Growth impacted by acute
Southern 2%
shortages of power, hostile
Africa weather conditions and low
2014 2015 commodity prices
45Macroeconomic environment remains relatively stable
Current Account Balance (% GDP) Fiscal and monetary policies have
Low commodity prices depressed
proven prudent, keeping inflation
revenues, contributing to the widening of
2013 2014 2015 generally stable aided by low fuel prices
both fiscal and current accounts 2 in importing countries
0
-2
Fiscal Balance excluding grants (% GDP) -4 Inflation (%)
2013 2014 2015 -6 10
0
-8
8
-2 -10
-4 Oil-Exporting Oil-Importing Africa 6
-6
4
-8
2
-10 The strengthening of the US dollar also put Oil-Exporting Oil-Importing Africa
additional pressure on the exchange rate of 0
Oil-Exporting Oil-Importing Africa 2013 2014 2015
a number of countries
46Africa’s growth should remain favorable, in spite of challenges
Africa has shown its resilience and should continue to maintain
its position as the second fastest growing region of the world
4.5%
2017
3.7%
2016
3.6%
2015
47The African Development Bank
4 Appendix
C. Green Bonds
48AfDB’s Green Bond framework
• Pipeline of projects
Monitoring and reporting
• Disbursement of eligible
Portfolio selection projects • Framework for selecting
• Semi-annual allocation of green projects
• AfDB eligibility proceeds to green projects to • Impact assessment of
criteria for Green be approved by ALCO projects: metrics : positive
Bond linked to the
outcome of the investment
climate finance
tracking Management of proceeds • Disclosure on disbursements
methodology & deployment of proceeds
• Update on projects
Investor Marketing
• Updates through roadshows and
targeted communications • Certification process:
• Respond to Investor queries Second opinion from
• ESG rating CICERO
External assurance
49Outstanding Green Bond project portfolio breakdown
By region By sector
Western Energy
Biogas
Africa Efficiency
1%
1% Eastern Africa 14%
Southern 19% Wind
Hydro
Africa 30%
3%
30% Multinational
2%
Solar
Water 25%
8%
Transport
Northern 19%
Africa
48%
Examples of eligible mitigation and adaptation projects
• Renewable energy generation
• Energy efficiency
• Vehicle energy efficiency fleet retrofit or urban transport modal change
• Biosphere conversation projects
• Solid waste management
• Fugitive emissions and carbon capture
• Urban development
• Water supply and access
• Low carbon transport
50AfDB guiding principles for climate change finance tracking
Projects reducing vulnerability of human or natural systems to climate change by
maintaining or increasing adaptive capacity and resilience
Projects leading to significant GHG emissions reductions over the lifetime of the
asset will also be eligible
Only projects whose financing can be qualified in full as promoting either low-
carbon or climate resilient development will be considered for the Bank’s Green
Bond portfolio
51Typology of climate and mitigation for tracking purposes
Wind Energy Solar Energy
Activities with Adaptation Co-benefits
• Improve design of turbines to withstand higher
• Improve design of solar panels to withstand
wind speeds as a result of extreme weather
higher intensity storms resulting from CC&CV
events
• Strengthen regulatory and institutional
• Construct power generation capacity from solar
framework to support expansion of wind and
thermal, solar PV and wind
solar power generation
Activities with Mitigation Co-benefits
• Support wind and solar energy technology manufacturers
52Typology of climate and mitigation for tracking purposes
Other Sources of Energy
Activities with Adaptation Co-benefits
• Secure access to water for crops used as bioenergy source (i.e. biofuel)
Activities with Mitigation Co-benefits
Construct power generation capacity from
other renewable sources (biomass, geothermal Support other renewable energy
and other non-hydro)
• Geothermal power • Rural electricity with off-grid
• Solid biomass power (pellets, sawmill renewable energy (in the case
residues, bagasse, forest plantations, etc.) of hybrid systems, only
only if biomass resources are residues, or renewable energy
produced in a sustainable manner components are counted)
• Biogas power (only if the biomass • Urban off-grid applications
resources used for biogas production are (PV public lighting)
residues, or produced in a sustainable
manner)
• Ocean power (wave, tidal, ocean currents,
salt gradient)
53Project evaluation & selection
ALL PROJECTS
Joint
Multilateral Bank’s Bank’s
Development Environmental Methodology for
Bank (MDB) Strategy Tracking Climate
Report on permeates design Adaptation and
Adaptation/Mit of all projects Mitigation
igation Finance Finance SCREENING AND SELECTION OF
PROJECTS ACCORDING TO THE
CLIMATE FINANCE TRACKING
METHODOLOGY
• Energy, Environment and Climate Change
Department with operational departments APPLICATION OF GREEN
evaluate and select climate change BOND FRAMEWORK
BOND
projects according to the Bank’s PROCEEDS
methodology for tracking climate finance
GREEN BOND
• Energy, Environment and Climate Change ELIGIBLE PROJECTS
Department with Treasury Department
evaluate and select projects for the Green USD
Bond portfolio according to the Bank’s EUR ZAR
SEMI-ANNUAL
Green Bond framework ALLOCATION
54What can be financed with AfDB Green Bonds?
Biosphere conservation Solid Waste Management
projects (reduce emissions (e.g. incineration of waste,
Greenfield from deforestation and landfill gas capture and Fugitive emissions and
Renewable Energy degradation of ecosystems) landfill gas combustion) carbon capture (e.g. carbon
Generation capture and storage,
(e.g. solar, wind, reduction of gas flaring or
geothermal, and methane fugitive emissions
ocean power) in the oil and gas industry,
coal mine methane capture)
Vehicle energy efficiency
fleet retrofit or urban Industrial Processes
transport modal change (reduce GHG emissions
from industrial processes
improvements and cleaner
production)
Demand-side Brownfield and
Greenfield Energy Efficiency
(e.g. energy efficiency Urban Development (e.g.
improvements in lighting and rehabilitation and upgrade of urban
equipment; retrofit of water drainage systems in areas
transmission lines, substations Water Supply and Access vulnerable to frequency and/or
or distribution systems to (e.g. water-saving measures such as severity of flash floods and storm
reduce technical losses) introduction of less water intensive surges brought by climate change)
crops or preservation of soil
moisture and fertility)
55Selected eligible Green Bond projects
Morocco
Ouarzazate Solar Complex – Phase I (NOORo 1)
Africa’s largest concentrated solar power plant
AfDB financing USD 204 million
• 160 MW of Concentrated Solar Power (CSP) capacity by end 2014
• Annual GHG reductions of 0.27 MT CO2e per year
• Curb CO2 emissions by 6.8 million tons over the lifetime of the asset
• Creation of 800 jobs between 2012 and 2014 and 50 permanent jobs thereafter
• Increase in the share of renewable energies in Morocco’s energy supply by 2020
Morocco
Ouarzazate Solar Complex – Phase II (NOORo II and NOORo III)
AfDB financing USD 121 million
• 500 MW of CSP capacity
• Annual GHG reductions of 0.52 MT CO2e per year
• Curb CO2 emissions by 13 million tons over the lifetime of the asset
• Creation of 1,600 jobs during construction and 200 permanent jobs thereafter
• Increase in the share of renewable energies in Morocco’s energy supply by 2020
56Selected eligible Green Bond projects
South Africa
Xina Solar One Concentrated Solar Power plant
AfDB Financing USD 100 million
• 100 MW of capacity
• Annual GHG reductions of 0.40 MT CO2e
• Creation of 1,415 jobs
• 85% of electricity in South Africa is coal generated, and accounts
for over 40 percent of Africa’s CO2 emissions. Project aims to
increase renewable energy production and reduce use of coal-
power plants
Kenya
Lake Turkana Wind Farm
Africa’s largest wind power project
AfDB financing EUR 115 million
• 300 MW of wind capacity
• Annual GHG reductions of 0.74 MT CO2e per year
• Curb CO2 emissions by 16 million tons over the lifetime of the asset
Computer generated mockup of the Lake Turkana project • Creation of 850 jobs
57Selected eligible Green Bond projects
Morocco
ONEE Integrated Wind/Hydro Programme
AfDB financing USD 450 million
• Three wind farms of 100-300MW capacity and two hydro
facilities to supply base-load power
• Annual GHG reductions of 3.3 MT CO2e per year
• 4000 jobs during construction and 350 permanent jobs
• 86,000 new rural household connections
Zambia
Itezhi-Tezhi Hydro Project
AfDB financing USD 35 million
• Installed capacity of 120 MW
• Annual GHG reductions of 0.56 MT CO2e per year
• Creation of 820 jobs
• Mitigating the severe energy generation deficit of the Zambian
electricity network while reducing dependency on coal
powered plants
58Selected eligible Green Bond projects
South Africa
Eskom Renewable Energy Projects – Sere Wind Facility
and Upington CTSP
AfDB financing USD 265 million
• One wind farm of 100MW capacity and a solar plant of
100MW to supply base-load power
• Annual GHG reductions of 0.81 MT CO2e
• 3071 jobs created
• Reduced dependency on coal-fired power
Cape Verde
Cabeolica Wind Farm Project
AfDB financing USD 20 million
• 25.5 MW capacity
• Diversify its energy matrix which is currently dominated
by diesel thermal power generation
• Annual GHG reductions of 0.07 MT CO2e
59Selected eligible Green Bond projects
Egypt
Gabal El-Asfar Wastewater Treatment Plant, Stage II
Africa’s largest wastewater treatment plant
AfDB financing USD 74 million
• 500,000 m3/d primary and secondary wastewater
treatment capacity
• Improved water and sanitation for approximately 10
million people with attendant reduction in pollution and
water borne diseases
• Annual GHG reductions of 0.2 MT CO2e
Tunisia
The Electricity Distribution Networks
Rehabilitation and Restructuring Project
AfDB financing USD 65 million
• Energy efficiency project aimed at promoting
more efficient and sustainable energy use in view of
increased economic development
• Construction and rehabilitation of power lines and
stations to maximize efficiencies
• Annual GHG reduction of 110 tonnes of CO2e
60Selected eligible Green Bond projects
Morocco
Power Transmission and Distribution Development
Project
AfDB financing USD 154 million
• Designed to minimize energy transmission losses from
production sites to the distribution grid
• Reduction of electricity losses from 4.7% to 3.5% will help
save 376 GWh annually
• Annual GHG emissions reduction of 0.18 MT CO2e
Morocco
National Irrigation Water Saving Programme
Support Project (PAPNEEI)
AfDB financing USD 74 million
• Protect water resources for rural populations
through sustainable management of these resources
• Direct benefit for 5,853 farms and 30,000 persons
• 69 million m3 of water saved
61Addressing the potential negative effects of large hydro
• Hydro projects that need to observe the strictest environmental and social impact standards require a full
Environmental and Social Impact Analysis (ESIA) when any of the following criteria are met:
Dam projects involving the establishment of a reservoir of 1,000 ha or more affecting land used by local populations;
Power transmission lines of more than 110 kV, crossing highly populated, forested or cultivated areas;
Power generation plants of more than 30 MW.
• Net proceeds of AfDB Green Bonds might finance large hydro as long as and only if net emission reductions
can be demonstrated (i.e. emission reductions from replacing fossil fuel generation minus emissions
generated from creating the reservoir e.g. cutting trees)
• The Green Bonds project portfolio currently contains two hydro projects: ONEE Integrated Wind/Hydro in
Morocco and Itezhi-Tezhi in Zambia
Case study: Itezhi-Tezhi hydro project
• Planned electricity generation of clean hydro power will save an estimated 360,000 tonnes of CO2 emissions per year
• As a category 1 project, a full ESIA was conducted for the Itezhi-Tezhi project which involved public consultations
(publicly available online*). A positive environmental externality of USD 39 million minimum is expected to be created
by the overall project
• For the 404 persons affected by the project, a full Resettlement Action Plan was prepared and implemented in
accordance with the Bank’s policy on involuntary resettlement including supporting the vulnerable to relocate. A
budgetary allocation was also provided by the Zambia Energy Utility Company (ZESCO) to ensure fair and timely
compensation of project affected persons
* http://www.afdb.org/fileadmin/uploads/afdb/Documents/Environmental-and-Social-Assessments/0305_Final%20Document%20_ITT_ESIA_RAP%20Summary.pdf
62Allocation of proceeds
• An amount equal to the net proceeds of the bonds will be
allocated within the treasury’s liquidity portfolio, to a sub-
portfolio, that will be linked to the AfDB’s lending operations
in the fields of climate change adaptation and mitigation
(“eligible projects”)
• So long as the bonds are outstanding, the balance of this sub-
portfolio will be reduced, at the end of each semester, under
the Bank’s debt allocation framework, by amounts matching
the disbursements made during the semester in respect of
eligible projects
63Green unpacked: commitment to transparency
To enable investors to follow the implementation of AfDB’s Green Bond program, a dedicated website
has been established which includes, among other things:
• Key information about the AfDB’s Green Bond program and
framework, including project selection criteria
• Key documents related to AfDB’s Green Bond program
including the second opinion from CICERO as well as links to
other relevant Bank documents such as the Long-Term
Strategy and the Environment Policy
• Annual newsletter reporting on the projects which are part of
the Green Bond portfolio
• Impact reporting measurements
Installed capacity
Annual energy savings
Lifetime GHG emission reductions
Annual GHG emission reductions
Job creation
http://www.afdb.org/en/topics-and-sectors/initiatives-partnerships/green-bond-program/
64Green Bond impact reporting (1)
Annual Lifetime GHG Annual GHG Volume of
Job
energy emissions emissions water saved/
Year Total project Installed creation
Name of project Region Type output/ reduced or reduced or treated
approved cost (USD) capacity (MW) (no. of
savings avoided avoided (in million
people)
(GWh) (in tons CO2e) (in tons CO2e) m3)
Mahe Sustainable Water
2015 Eastern Africa Hydro 26,000,000 1 104
Augmentation project
Uganda Rural Electricity Access Energy
2015 Eastern Africa 121,405,000 1,018
Project Efficiency 113 938,000 47,000
Ouarzazate Solar Complex Project -
2014 Phase II (NOORo II and NOORo III Northern Africa Solar 2,370,893,916 350 1,800
1,100 13,050,000 522,000
power plants)
2014 Xina Solar One Project Southern Africa Solar 908,000,000 100 1,415
383 7,200,000 400,000
2013 Lake Turkana Wind Power Project Eastern Africa Wind 693,874,555 300 750
1,249 16,000,000 736,615
Ouarzazate Solar Power Station Solar
2012 Project - Phase I (NOORo 1 power Northern Africa 1,489,000,000 160 850
497 6,784,150 271,366
plant)
ONEE Integrated Wind/Hydro and
2012 Northern Africa Wind 2,479,457,888 1100 4,350
Rural Electrification Programme 2,496 65,000,000 3,250,000
2012 Ithezi-Tezhi Power Project Southern Africa Hydro 239,000,000 120 820
611 14,400,000 560,654
Project to Improve the Quality of Water
2011 Northern Africa 51,882,976 78 0
Treated Water
65Green Bond impact reporting (2)
Annual GHG
Lifetime GHG Volume of Job
Annual energy emissions
Total project Installed emissions reduced water creation
Year Name of project Region Type output/savings reduced or
cost (USD) capacity (MW) or avoided (in tons saved/treated (no. of
approved (GWh) avoided (in
CO2e) (in million m3) people)
tons CO2e)
2011 Rift Valley Railways Project Multinational Transport 372,000,000 0
Eskom Renewable Energy Project - Sere Wind
2011 Southern Africa 332,575,200 100 1,521
Wind Facility 219 4,760,000 238,000
Eskom Renewable Energy Project -
2011 Southern Africa Solar 870,238,440 100 1,550
Upington CSTP 531 11,400,000 570,000
2011 Kivuwatt Project Eastern Africa Biogas 127,580,000 25 311
107 53,655
2010 Cabeólica Wind Power Project Western Africa Wind 84,704,271 25.5 90
98 2,100,000 67,444
Gabal El-Asfar Wastewater Treatment
2009 Northern Africa Water 294,661,627 6.5 183 550
Plant - Stage II, Phase II Project 2.14 14,600,000 730,000
The Electricity Distribution Networks
Energy
2009 Rehabilitation and Restructuring Northern Africa 73,313,204 0
Efficiency 0 8,600 430
Project
Power Transmission and Distribution Energy
2009 Northern Africa 169,114,489 0
Development Project Efficiency 376 2,745,000 183,000
The National Irrigation Water Saving
2009 Northern Africa Water 74,663,045 69 234,627
Programme Support Project (PAPNEEI)
2008 Buseruka Hydropower Project Eastern Africa Hydro 41,100,000 9 232
52 985,740 32,858
66Third party assurance
“A clear impression of an institution that is well aware of the challenges posed by climate change as well as other environmental and
social concerns that may be associated with investments projects. In particular we are pleased with the consciousness shown towards
the external impacts of projects both across space and time”
CICERO, 1st September 2013
“On a relative benchmarking with other supranationals and development banks, the bank continues to demonstrate robust benefits and
programs to attract and retain talent. Additionally, the bank has a well-defined system in place to manage credit and reputational risks
arising from these impacts.”
MSCI ESG Research, 5th December 2014
The company's environmental social lending and investment banking guidelines cover client-related environmental and social risks and
impact management aspects, including risk and impact assessments, effective stakeholder engagement and grievance mechanisms.
Oekom Corporate Rating, 12th December 2014
“AfDB’s overall Corporate Social Responsibility performance is considered advanced in absolute terms (63/100) and it has significantly
increased since last review (July 2014) “
“AfDB displays an homogeneous approach to the management of its ESG impacts, achieving an advanced performance
in all the three pillars. As for the Governance pillar, ESG issues appear to be integrated in the governance strategy
with material ESG issues discussed at board meetings and the related risks covered by internal controls. The institution
Environmental strategy addresses the material issues related to its business operations, and environmental and climate
safeguards are implemented. As regards the Social pillar, AfDB discloses extensive measures to foster consultation
of Stakeholders in its projects and thematic policies, in addition tools have been set up to monitor the achievement
of its development goals in its member countries.”
Vigeo, August 2016
67You can also read