City Power Johannesburg (SOC) Ltd Business Plan 2013 2016 - City Power Business Plan (2013 - 2016)
←
→
Page content transcription
If your browser does not render page correctly, please read the page content below
City Power Business Plan (2013 - 2016)

          City Power Johannesburg (SOC) Ltd
                    Business Plan
                       2013 - 2016

Board Approved                                Page 1
City Power Business Plan (2013 - 2016)

Sign Off:

CEO/MD Name: ……………………………………………………………………

Signature Sector ED: ………..………………..…………………………………

Signature of Sector MMC: ……………………..……………………………….

Date: ………………………………………………………………………………..

Receipt & Review:
Signature of Group Governance Representative: …………………………………………….

Signature of EISD Representative: ……………………………………………

Company Details
Company Name:                            City Power Johannesburg (SOC) Ltd
Company Registration Number:             Reg 2000/030051/30
Physical Address:                        40 Heronmere Road, Reuven
Postal Address:                          PO Box 38766, Booysens, 2016
Phone Number:                            (+27) 011 490 7000
Fax Number:                              (+27) 011 490 7590
E-mail:                                  electricity@citypower.co.za
Website:                                 www.citypower.co.za
Customer Contact Centre:                 (+27) 011 375 5555

Board Approved                                                          Page 2
City Power Business Plan (2013 - 2016)

TABLE OF CONTENTS:
SECTION 1: STRATEGIC CONTEXT ..................................................................................................................... 4
    INTRODUCTION .......................................................................................................................................................................... 4
    PROBLEM STATEMENT ................................................................................................................................................................ 5
    GROWTH AND DEVELOPMENT STRATEGY 2040 (GDS 2040).............................................................................................................. 5
    MAYORAL PRIORIES AND CITY POWER ALIGNMENT............................................................................................................................ 6
    GDS – IDP 5 YEAR PLAN .......................................................................................................................................................... 13

SECTION 2: STRATEGIC ANALYSIS AND FOCUS ............................................................................................... 16
    PESTLE ENVIRONMENTAL SCAN ................................................................................................................................................. 16
    SWOT ANALYSIS – PRIORITISED ................................................................................................................................................. 17
    KEY DRIVING FORCES IMPACTING CITY POWER’S STRATEGY ............................................................................................................... 18
SECTION 3: STRATEGY AND SCORECARD ........................................................................................................ 19
    STRATEGY MAP ....................................................................................................................................................................... 19
    SCORECARD ............................................................................................................................................................................ 20
SECTION 4: DAY–TO–DAY OPERATIONS ......................................................................................................... 24
    PROVIDE NETWORK INFRASTRUCTURE .......................................................................................................................................... 24
    DISTRIBUTE ELECTRICITY ............................................................................................................................................................ 25
    NETWORK EXPANSION .............................................................................................................................................................. 25
    ELECTRIFICATION...................................................................................................................................................................... 29
    PUBLIC LIGHTING ..................................................................................................................................................................... 33
    ASSET MAINTENANCE MANAGEMENT .......................................................................................................................................... 35
    REVENUE WAR PLAN ................................................................................................................................................................ 37

SECTION 5: HUMAN CAPITAL PLAN ................................................................................................................ 45
    MANAGEMENT AND ORGANISATIONAL STRUCTURES ........................................................................................................................ 45
    STAFF ESTABLISHMENT .............................................................................................................................................................. 49
    HUMAN CAPITAL EXPENDITURE ................................................................................................................................................... 49
    EMPLOYMENT EQUITY ............................................................................................................................................................... 50
    STAFF TURNOVER / MOVEMENT DURING PREVIOUS FINANCIAL YEAR .................................................................................................... 50
SECTION 6: FINANCIAL PLAN .......................................................................................................................... 51
    TARIFF PLAN ........................................................................................................................................................................... 51
    FINANCIAL PLAN ...................................................................................................................................................................... 56
    CAPITAL EXPENDITURE: INFRASTRUCTURE & SERVICE DELIVERY CAPITAL PLAN ....................................................................................... 61
    THE TABLE BELOW SHOWS THE APPROVED LONG TERM CAPITAL BUDGET:............................................................................................... 63
SECTION 7: RISK ASSESSMENT ....................................................................................................................... 70
    BACKGROUND ......................................................................................................................................................................... 70
    RISK IDENTIFICATION................................................................................................................................................................. 70
    STRATEGIC RISKS REPORT .......................................................................................................................................................... 73
SECTION 8: CONCLUSION ............................................................................................................................... 76
SECTION 9: BUSINESS ACRONYMS AND APPENDICES .................................................................................... 77
    BUSINESS ACRONYMS ............................................................................................................................................................... 77

Board Approved                                                                                                                                                                 Page 3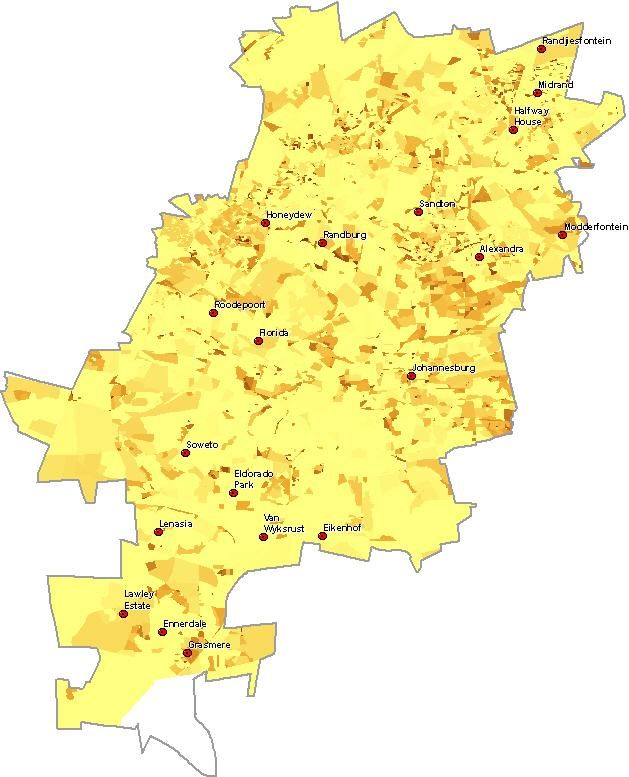
City Power Business Plan (2013 - 2016)

SECTION 1: STRATEGIC CONTEXT

Introduction

Following the first democratic elections that took place in 1994, and the local government
election that followed in 1995, eleven local authorities were amalgamated to form the
Greater Johannesburg Metropolitan Council. By mid-1997 it became apparent that the new
structures were not optimally effective and the Councils of Greater Johannesburg were
facing a severe financial crisis. It was then agreed that a unified, metropolitan-wide initiative
was necessary to focus specifically on the critical problems facing the City. This led to the
inception of the i-Goli 2002 plan. i-Goli 2002 was essentially a three-year strategic plan. It
involved the structural transformation of Metro functions with the view to ensuring enhanced
and more cost effective service delivery. It achieved this by reducing fragmentation,
eliminating duplication, improving accountability, focusing on human resource development
and improving performance incentives. From an organisational perspective, the i-Goli 2002
Plan put in place “sensible” structures that delivered at greater levels of efficiency.

The i-Goli 2002 Plan envisaged that the City would work through a combination of new
political governance structures, agencies and corporatised entities. A key element of the
i-Goli 2002 strategy for service delivery was the establishment of utilities, agencies and
corporatised entities now called the municipal owned entities (MOEs). One of the entities
established was City Power Johannesburg (SOC) Ltd, 100% owned by the City of
Johannesburg, and established in terms of the Companies Act, on 30 November 2000.

In line with the establishment of City Power Johannesburg (SOC) Ltd, the Council utilises an
Environment and Infrastructure and Services Department (EISD) to oversee the
performance and Group Governance to oversee the governance of the company, as well as
to regulate it. In this regard various agreements in principle were concluded during the
establishment of the companies. These included the Sale of Business Agreement (SBA) and
the Service Delivery Agreement (SDA).

The relationship maintained with the Greater Johannesburg Metropolitan Council is one of
Service Authority and Service Provider. City Power Johannesburg (SOC) Ltd is the preferred
Service Provider for the Service Authority, the Council.

The Mandate of City Power Johannesburg (SOC) Ltd from its only shareholder, which is the
City of Johannesburg, is to buy and sell electricity to the citizens of Johannesburg. The 2
main suppliers of electricity are Eskom at 80% and Kelvin Power at 20%. The company is
regulated by the National Energy Regulator of South Africa. The chart below is a
representation of the organisation‟s business:

Board Approved                                                                           Page 4
City Power Business Plan (2013 - 2016)

                              What business are we in?
Problem Statement

  National Energy Regulator of South Africa (NERSA)                Kelvin

    Generation
                         Transmission            Distribution

We are in the business of buying electricity and selling it to
customers.

The problem statement for the City Power business plan is to assist the City of
Johannesburg to address the South African challenge of security and quality of electricity
supply i.e. enabling consumers who reside in the City of Johannesburg jurisdiction to obtain
electricity at a defined quality and reliability at affordable rates and transparent prices.

In parallel to this objective City Power will also be required to ensure the sustainability of the
business through the achievement of certain agreed to financial, social and environmental
goals.

Growth and Development Strategy 2040 (GDS 2040)

City Power was established in 2000 according to the principles of the i-Goli 2002 Plan and it
is wholly owned by the City of Johannesburg. The review of the Growth and Development
Strategy 2030 was brought about by a shift in the light of climate change and natural
resource scarcity. Natural resource scarcity affects both human and economic development.
Without securing natural resources, cities cannot sustain human and economic
development. “Cities are seeking new ways of overcoming critical natural resource
constraints, „decoupling‟ as a concept has emerged to assist national governments and cities
to „decouple‟ economic production and consumption from resource use. The emphasis has
shifted in an important way, reframing economic and human development within the context
of sustainability” 2040 GDS.

Board Approved                                                                            Page 5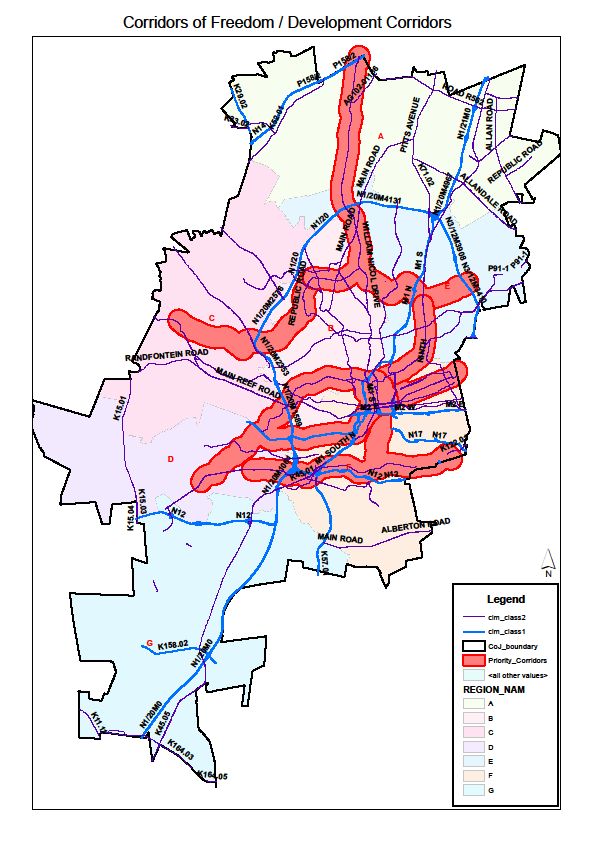
City Power Business Plan (2013 - 2016)
GDS Outcomes
There are four GDS outcomes in the GDS2040 these are outlined below:
Outcome 1: Improved quality of life and development driven resilience for all
Outcome 2: Provide a resilient, liveable, sustainable urban environment- underpinned by
infrastructure supportive of a low-carbon economy
Outcome 3: An inclusive, job-intensive, resilient and competitive economy
Outcome 4: A leading metropolitan government that pro-actively contributes to and builds
a sustainable, socially inclusive, locally integrated and globally competitive
Global Credit Rating.
GDS Principles
There are six GDS principles in the GDS2040 these are outlined below:
Eradicating poverty
Building and growing an inclusive economy
Building sustainable human settlements
Ensuring resource security and environmental sustainability
Achieving social inclusion
Promoting good governance
Mayoral Priories and City Power Alignment
In this business plan the organisation ensures alignment with the City‟s strategic direction
and aligns to the GDS 2040. City Power is part of sustainable infrastructure cluster and the
cluster has identified seven flagships sub-programs which driven by different departments
and MOE‟s. City Power is directly involved with some of the programmes while it has direct
and indirect input on others. The table below shows the flagship programmes and City
Power‟s involvement and input to these programmes:
Lead and Influence Indirect Input To Indirect Input To
Financial Sustainability Agriculture and Food Security Human Capital Development and
and Resilience Management
Resource Sustainability Safer Cities Strategic Communication and
Marketing
Sustainable Human Investment attraction, retention
Urban Water Management
Settlement and expansion
Active Citizenry City where none goes hungry
Smart City
Green Economy
SMME and
Entrepreneurial Support
Board Approved Page 6
City Power Business Plan (2013 - 2016)

The above priorities have been further broken done to a 10 STEP Programme that has ten
interventions and targets for the next three to five years. City Power has a STEP programme
to ensure alignment to the mayoral priorities. STEP is an acronym that stands for:
S – Service Delivery, T – Transformation, E – Excellence, P – Performance

The 10 STEP Programme
Decade 1     Priorities                         City Power Response

Term of      Financial resilience and           S – Service Delivery, T – Transformation, E –
Office       sustainability                     Excellence, P – Performance
Priorities
(2012-       Sustainable Human                  1. Attaining an Unqualified audit in a sustainable
2017)        Settlements                            manner
                                                2. Reduce losses to 10% by December 2015
             Active engaged citizenry
                                                3. Achieving 98% meter reading by June 2013 (100%
             SMME and entrepreneur                  Compliance to the by-law)
             development and support            4. Achieving 100% payment level for key and LPU
                                                    customer by June 2013
             Food Security                      5. Achieving 90% data accuracy by 2015
                                                6. Installing 110 000 SWH by December 2016
Decade       Smart City                         7. Achieving full compliance to NRS 047 and 048
One                                                 immediately
Priorities   Resource Sustainability
                                                8. Achieving 90:10 Planned: Unplanned by December
(2017-       Investment attraction, retention       2015
2022)        and expansion                      9. Accelerated Visible Service Delivery (eg.100%
                                                    compliance to the SLA, electrification, PL)
             Green Economy                      10. Innovative Product Pricing (Introduction of Domestic
                                                    Time of Use and Green Tariffs) by 2015

City Power’s alignment projects to the SDBIP

The 5 year IDP is translated into one year plans which are called the Service Delivery
Budget Implementation Plan (SDBIP). City Power‟s has four main programmes that ensure
attainment of the SDBIP which are:
• City Power‟s Infrastructure Plan on COJ‟s Transit Oriented Development (TOD)
       – New substation for the Park Station precinct at an estimated cost of R 100 M
       – New substation for the Westgate precinct at an estimated cost of R 110 M
       – “Sebenza” will be situated in the North-East of Johannesburg adjacent to Kelvin
           Power Station and
       – “Quattro” in the South West of Johannesburg in the vicinity of the old Orlando
           Power station site.
       – Eskom‟s transmission networks will also need to be extended to supply our
           planned 275/88kV intake points at both Quattro and Sebenza.
       – Public lighting and electrification programme
• Smart Grid
• Energy Plan
• Asset Management Plan

Board Approved                                                                             Page 7
City Power Business Plan (2013 - 2016)
Below is a map that illustrates the TOD
Revenue War Plan
Key Priorities City Power Initiatives Status Expected Outcomes
Financial Improve metering data In progress Achieve 90% data
Resilience and accuracy and completeness accuracy by 2015
Sustainability, Attaining an unqualified
Deployment of statistical In planning stage
Smart City, audit in a sustainable
and check metering
Resource manner
Deployment of smart In planning stage Achieving 100%
Sustainability
meters payment level for key
Deployment of prepaid In progress and LPU customer by
meters, Remote Access June 2013
Terminal system (RATS) Reduce losses to 10%
and protective structures by 2015
Conversion of LPU to AMR In progress Achieving 98% meter
reading by June 2013
(100% Compliance to the
by-law)
Board Approved Page 8City Power Business Plan (2013 - 2016)
Accelerated Visible Service Delivery
Key Priorities City Power Initiatives Outcomes
Programmes
Sustainable Electrification Bulk supply programmes in
Human Fleurhof , Lufhereng, Elias
Settlements Motsoaledi and Lehae
Resource Accelerated Visible
4500 households in Lehae Service Delivery
Sustainability
Phase 2, Klipspruit Ext11 (eg.100%
and Golden triangle compliance to the
SLA, electrification,
Public 10000 public light
PL)
Lighting cumulatively in Soweto,
Attaining an
Orange Farms and Ivory
Unqualified audit in
Park in the next two financial
a sustainable
years (2013/14 and 2014/15)
manner
2 days turnaround time on Achieving full
public lighting maintenance compliance to NRS
047 and 048
Customer Operationalisation of immediately
Services Customer Services Charter
Charter and the Service Level
Agreement
Energy Plan
Key Priorities City Power Energy What we are doing?
Programme
Resource Energy efficient Deployment of energy efficient technologies
Sustainability street lighting eg: induction lighting, CFLs, and piloting LEDs
Green program
Economy
Building retrofit Retrofitting of Municipal owned buildings,
program Tender/Bid process currently underway.
Building Assessment of privately owned buildings, at
performance rating inception stage
system
Waste to energy Landfill Gas Electricity Generation at
programmes Robinson Deep and Goudkoppies, PPA
negotiations underway to bring 12MW into the
grid
Low pressure solar Roll out underway focusing on customers
water geyser consuming less the 1000kWh/ month.
program update
Board Approved Page 9City Power Business Plan (2013 - 2016)
Key Priorities City Power Energy What we are doing?
Programme
Virtual Power Up market solar water geysers program at
Station conceptual stage
Innovative Product Introduction of Domestic Time of Use and
Pricing Green Tariffs by 2015, application has been
made to NERSA to consider green and TOU
tariff
Tariff support for Use of distribution system costs, application
distributed has been made to NERSA to consider green
generation sources tariff
Tariff support for Enhancement of PV System efficiencies,
photovoltaic application has been made to NERSA to
systems consider green tariff
Promotion of gas Displacement of electric stove, at conceptual
cooking to replace stage
electric stoves
Natural gas Conversion of City Power open cycle gas
electricity turbines and Establishment of Co-gen
generation precincts, at conceptual stage
City Power’s Smart Grid Initiative
Key Priorities Initiative What we are doing?
Smart City, Customer The advanced transmission and distribution
Green Centric: operations inherent in a smart grid will shorten
Economy power outages and improve quality of power.
Resource Customers will also benefit by having real time
Sustainability billing information from smart meters – better
planning and no surprises.
Condition The smart grid infrastructure, such as the
Monitoring communication medium interconnecting network
nodes, allows proactive diagnostic of potential asset
failures before they result in costly outages /
catastrophic system failures. Asset life-cycle will be
prolonged
Energy Ripple control and smart meters allow City Power to
Demand Side better manage peak loads. This in turn has a huge
Management: benefit to City Power‟s bottom line – less stressed
plant and reduced maximum demand penalties.
Board Approved Page 10City Power Business Plan (2013 - 2016)
Key Priorities Initiative What we are doing?
Outage Self-healing characteristics of a smart grid system
Management: will result in less costly power outages. Faulted
circuits will be identified quicker, hence improved
response times and NRS compliance.
Revenue Smart grid system (communication, smart meters
Protection etc.) enables real-time and remote disconnection
and reconnection of supply for non-payment of
services.
Accurate Data Smart and Power Quality meters enable the
on Network determination of technical and non-technical losses
Losses: in the entire network (comparative metering).
Advanced The AMI allows for real-time billing information
Metering availability to both the customer and City Power.
Infrastructure Huge reduction in cost associated with meter
(AMI): reading, disconnection and reconnection of non-
paying customers.
Co-Production
Key Priorities City Power Initiatives Outcomes
Programmes
Active Coproduction Develop Coproduction Plan
Engaged Plan
Citizenry
Energy Plan Develop 30 sustainable
SMME and
SMMEs over next three years
Entrepreneur
Development Improved
Infrastructure Create 8 000 job over next
And Support community
plan three year
engagement,
Smart Grid Develop 10 sustainable Improve
SMMEs over next three years, Customer
through installation and Centricity and
maintenance process people
development
Education and Create 500 jobs over next
awareness three year through Community
Liason Officer (CLO)
programmes, community
ambassadors and public
education
Board Approved Page 11City Power Business Plan (2013 - 2016)
Key Priorities City Power Initiatives Outcomes
Programmes
Learning Partner with universities to
academy have 100 learnerships,
apprenticeship and Bursars
over the next three years
Asset Management Plan
Key Priorities City Power Initiatives Outcomes
Programmes
Sustainable Improve network data
Human accuracy and
Achieve 90% data
Settlements completeness
accuracy by 2015
Resource Achieving 90:10
Improve Implementation of
Sustainability Planned: Unplanned by
Network Condition Monitoring
system December 2015
performance
Achieving full compliance
and quality of Implementation of Shift to NRS 047 and 048
supply System immediately
Accelerated Visible
Review and implement
Service Delivery
core and support value
chains
Board Approved Page 12City Power Business Plan (2013 - 2016)
GDS – IDP 5 Year Plan
CP IDP Impact on Actuals Plan Budget Plan Budget Plan Budget Budget
PIP KPI Unit Plan 2015/16
Programme Community 2011/12 2012/13 2012/13 2013/14 2013/14 2014/15 2014/15 2015/16
SAIDI Minutes 11.37 11.7 1137 1037 937
SAIFI Number 3.08 3.08 4.78 4.68 4.58
CAIDI Minutes 368.67 368 237.87 221.58 204.59
CAIFI Number 0.08 1.12 5.65 Opex: 4.65 Opex: 3.65 Opex:
Planned: Opex: R810m R849m R873m
Improve Network Improved
Unplanned % 62:38 65:35 R1129m 70:30 Capex: 75:25 Capex: 80:20 Capex:
performance and restoration
Maintenance 293m 318m 289m
quality of supply times, reduction
in unplanned HV Outages: NPR Number 68 70 : 78 76 74
Sustainable Outages, NRS 047
% 90 90 90 90 90
Human improved Compliance
Settlements network health NRS 048
% 97 97 97 97 97
Smart City Compliance
Resource Opex: Opex: Opex: Opex:
Sustainability Refurbishment of
Average age of R175m R169m R185m R200m
ageing Years 50 39 39 38 38
Investment infrastructure (HV) Capex: Capex: Capex: Capex:
infrastructure
attraction, R160m R90m R203m R208m
retention and More people Additional Capacity MW New 90 Opex: 90 120 120
expansion Opex: Opex: Opex:
Expansion and with access to Electrification Number 5610 3200 R295m 3400 R184 m 3600 R238m 3800 255m
Green Strengthening of electricity, Capex:
Economy Provision of public Capex: Capex: Capex
Network Economic Number 5126 4200 R45m 4400 R712m 4600 R1468m 4800 R1131m
growth Lights
After Diversity
Maximum Demand KvA New 0.12 0.3 0.46 0.6
Climate (ADMD) Opex: Opex: Opex: Opex:
Demand Side Change & R50m 114m 118m 150m
Energy Mix % New NEW 0 0.01 0.02
Management Energy Capex: Capex: Capex: Capex:
Diversification Solar Water R127m R18m R15m R5m
Number New 20000 30000 30000 40000
Heaters
Reduction in GHG % New 5% 10% 15%
Board Approved Page 13City Power Business Plan (2013 - 2016)
CP IDP Impact on Actuals Plan Budget Plan Budget Plan Budget Budget
PIP KPI Unit Plan 2015/16
Programme Community 2011/12 2012/13 2012/13 2013/14 2013/14 2014/15 2014/15 2015/16
Payment Levels
(Current % 92.4 93 96 98 98
Sustainable consumption)
Human Meter Reading
Relief in Tariffs, % 98 96 96 Opex: 96 Opex: 98 Opex:
Settlements performance
Smart City,
Active engaged Revenue step 250m 247m 264m
reduction in Meter Roll Out Number New 30000 100000 150000 200000
citizenry change programme Capex: Capex: Capex:
accounted for Losses (Technical/
Resource % 19.31 15 13.5 R505m 12 R580m 10 R535m
electricity & Non-Technical)
Sustainability
% of ESP
customers with FBE % New 97 97 97
provided
EPWP Number 2333 3000 5000 5000 5000
50% black owned
% New 5 8 10 12
companies
30% black woman % New 2 5 8 10
owned company
Improve Customer Customer
Improved % 65 65 65 65 70
Financial Centricity and people
services Satisfaction
resilience and development Affirmative Action
sustainability % 79.2 85 85 Opex: 85 Opex: 85 Opex:
(all) R290m R229m R357m
Smart City Gender Equity (all) % 20.91 23 24 Capex: 25 Capex: 26 Capex:
Resource
People with R108m R40m R60m
Sustainability % 2.9 2 2 2 2
Disability
DIFR Ratio 0.51 1 1 1 1
Unqualified
Continuous ISO accreditation Audit report
Improved Audit report Opex:
Improvement of the Unqualified Unqualified Unqualified Unqualified Audit
services Attainment of an Qualified 403m
business Audit report Audit report Audit report report
unqualified audit Audit report Audit Capex:
report Report R234m
Board Approved Page 14City Power Business Plan (2013 - 2016)
City Power shifting the Strategic Focus (Changing the Course)
Board and management of the company recently reviewed the strategic direction of the
organization and it became clear that the entity is at a strategic inflection point. Ten years
on, an assessment must be made as to whether the current business model is still relevant
and is aligned to stakeholder expectations and to the GDS 2040. In addition, the current
business model needs to be reviewed in light of the creation of the R&CRM unit at COJ. In
light of the changing energy landscape City Power must consider becoming a provider of
alternative sources of energy. This strategic direction will impact on how the company
conducts its business going forward, requiring the need to review the business model. This
will help redefine the company strategy and ensure alignment to the Growth and
Development Strategy and IDP.
City Power History
We are at a
strategic
inflection
point?
2012– 2017
2007 – 2012
• GDS 2040
• GDS 2030 • Improving condition monitoring
2002 – 2007 • Improving network performance
maintenance
• Making sure we get paid for our
• Perfecting time based maintenance
services & improve revenue
• Egoli 2002
• Introducing condition monitoring management
• Bringing the different municipalities maintenance
• Improve stakeholder
together
• Implementation and improving Capex communication, engagement
• Moving from fire fighting to planned program to reduce backlog and management including
maintenance R&CRM
• Consolidation and centralisation of
• Developing and initiating Capex customers services • Shift to low carbon infrastructure
program to reduce backlog and introduction of SSM & DSM
• Improving prepaid & smart meter
• Introduction of customer segmentation technologies • Introduction on TOU and green
tariffs
• Introduction of prepaid meters • Piloting of DSM projects
Board Approved Page 15City Power Business Plan (2013 - 2016)
SECTION 2: STRATEGIC ANALYSIS AND FOCUS
PESTLE Environmental Scan
PESTLE ANALYSIS
IMPACT
EXTERNAL FACTORS EFFECTS ON THE ORGANIZATION
SEVERITY
Re-alignment of projects and re-allocation of funding
Mayoral and CoJ Priorities
Not always based on business case and may de-focus CP plan
Political Lack of Business Alignment to Political and Service Delivery High
Competing Needs
requirements.
Pressure from politicians prior to elections Service delivery pressures
Inadequate Funding
Investment ratings and policy Unable to meet expectations, limited expansion programmes
Impact of new Toll roads Increase operational costs, decrease customer disposable income
Pass through electricity costs; Customer dissatisfaction; Businesses going
Increasing cost of Electricity Supply
Economic out of business; Decreasing consumption
High
Economic downturn due to Global recession:
Affordability of inputs – loans, people costs, fleet and bulk Impacts on Service delivery; Causes increases in costs if theft is high and
costs insurance does not recover all the losses; Impacts on ability to deliver
Green energy Decreased consumption and revenue
Tariff regulation Ability to be cost reflective
Theft and Vandalism Increase Outages and non-funded expenditure
Increased cost of sales with no corresponding income
Illegal connections and theft of energy
Increase public fatalities
Social Non-payment of services Insufficient income High
Impact of HIV/AIDS and chronic diseases on the workforce Increased pressure on resources to provide case management and support
Community/customer activism/protests Non-payment, destruction of property, pressure to deliver
Change of technology Additional training and safety requirements
Cost of new technology Limited available funding
Technologically Reliable and safer designs Important impact on City Power although there has been many initiatives
Alternative energy solutions regarding demand supply management and SCADA enhancements
Technological Smart Grid Alternative source of energy Medium
Increase in Demand Additional funding required meeting the demand.
Quality of service: Improve company image
Social media – Facebook, Twitter
Customer satisfaction
Qualified audit reports
High focus as City Power is the provider of electricity to the greater
Corporate Governance/ MFMA/ King III/ NERSA/ Companies
Johannesburg and covers many legal requirements.
ACT/ OSH Act/ ISO/ By –laws.
Court cases not legalizing electricity
Legal Penalties and fines High
Inadequate legislation to deal with cable thieves Increased theft and vandalism/illegal connection; Increase repair &
Legislative framework for smart meters maintenance costs; Loss of revenue
EIA implementation Delay in the implementation of major projects Medium
ISO Accreditation Reduction in DIFR, improve quality of service Medium
Pollution
Due to the impact of the business activities on the environmental this is an
ISO 14001:2004 High
important focus area.
Green and Renewable Energy
Environmental
Disposal of waste/obsolete equipment
Potential pollution due to obsolete equipment (e.g. Vulnerable to prosecution plus poor public image Medium
transformers)
Shift to low carbon, monitoring and reporting Energy purchases high High
Board Approved Page 16City Power Business Plan (2013 - 2016)
SWOT Analysis – Prioritised
Strengths Weaknesses
·ISO accreditation ·Communications
·Good knowledge and understand of the ·Accountability
business ·Poor change management
·Well documented value chains ·Poor contracts management
Internal
·Supportive stakeholder ·When things go wrong we blame each
·New structures based on sound business other/team work at executive level
approach ·Perceived low employee morale
·World class systems ·Operationally inefficient
·Inability to execute projects and follow
through on benefit realisation
·Process leading up to decision-making is
slow
Opportunities Threats
·Green energy/alternative energy sources ·Lack of sufficient funding to fund key
·Community upliftment company initiatives
·Smart Grid ·Loss of revenue – Due to illegal
·Improve company image connections, theft and vandalism
External
·Expand Jhb footprint ·Household ability to pay/reduced
·Carbon Funding/ CEF consumption
·Provide technical training externally and ·Loss of NERSA licence
increase income ·Generation capacity in SA
• Raise funds through the network ·Customer activism/revolution
•Industrial action
Board Approved Page 17City Power Business Plan (2013 - 2016)
Key Driving Forces Impacting City Power’s Strategy
Priorities Internal External
Leverage for competitive advantage
Higher 2 3 4 1
Data Non
Metering
Losses management compliance Clean audit Smart grid
readings low
inaccuracies issues
Low Change
Operationally Energy Blame Quality of
performance management &
inefficient balancing culture supply
acceptance comms reactive
5
Project Revenue
Aging Unions & Labour Aging ICT Quality of
execution collection
infrastructure Issues network service
weak low
Predictability
4 Alternative 3 CoJ Strategy /
Eskom Cost of
sources of energy Smart city
strategy GDS 2040 supply
/ green energy
Expand NERSA
2 Theft and
ISMO Bill
footprint NRS 47/8 vandalism
1
Service
Legal ISO External
Non payment delivery
compliance accreditation image poor
protests
Plan Scenario’s
Impact on Strategic Agenda
Board Approved Page 18City Power Business Plan (2013 - 2016)
SECTION 3: STRATEGY AND SCORECARD
Strategy Map
Mission
CP Strategy Map Business Operating Principles
• Customer-centric organisation
The mission of City Power Johannesburg SOC is
Previous to meet the expectations of our customers and
Aspired • Seamless value chain driven
Getting the stakeholders by:
organisation
Basics Right Values • Providing a sustainable, affordable, safe and
•Zero tolerance for poor performance
• Resourceful reliable electricity supply
City of •Doing business in an ethical manner,
• Resilient • Providing prompt and efficient customer
Johannesburg zero tolerance for fraud and corruption
• Reliable services
•Business case driven investment
Business of • Respectful • Being the preferred equal opportunity employer
Tomorrow decisions
Always with by developing and incentivising our employees
•Maximum technology enablement
Integrity • Undertaking our business in an environmentally
•Doing it right the first time
We are in the business of distributing
acceptable manner Strategic
Strategic People Service Infrastructure Priorities
What Business Are We In?
Perspectives High Performing teams , Social transformation , quality of Network refurb & development, asset
customer centric, SHEQ service , SHEQ maintenance, DSM, alternative energy
sources, infrastruc security, SHEQ
Value Optimise
Propositions Sustainable Surplus
1. Financial Revenue Low
(30%) Increase financial Growth Operating
resilience and Costs
Improve Sustainable
sustainability of the Cash Flow Reduce Capex
Revenue
electricity.
business Promote Losses Spend
Energy Collection Expand
Efficiency Footprint
2. Customer / Improve customer Improved
Stakeholders Influence Key Customer Quality Socio
centricity and ensure Experience Supply and
(30%) Stakeholders Economic
active citizenry CoJ, NERSA, DoE Availability Development
3. Internal Efficient and Manage core
Process effective processes value chains
To be a world-class
(20%) and enabling Asset Data
electricity utility
information systems Management Management ICT Governance, Risk,
Compliance
Maximum employee High Performing
4. Learning Teams
Vision
& Growth productivity whilst
(20%) conducting business Talent Performance Talent Talent Knowledge
Planning Management Development
in an ethical manner Acquisition Management
The 10 STEP Programme
The above priorities have been further broken done to a 10 STEP Programme that has ten
interventions and targets for the next three to five years. STEP is an acronym that stands for:
S – Service Delivery, T – Transformation, E – Excellence, P – Performance
1. Attaining an unqualified audit in a sustainable manner
2. Reduce losses to 10% by December 2015
3. Achieving 98% meter reading by June 2013 (100% Compliance to the by-law)
− 99% Meter Reading AMR LPU customers
− 95% Manual Meter Reading for Domestic customers
− 98% Meter Reading for Domestic AMR
4. Achieving 100% payment level for key and LPU customer by June 2013
5. Achieving 90% data accuracy by 2015
6. Installing 110 000 SWH by December 2016
7. Achieving full compliance to NRS 047 and 048 immediately
8. Achieving 90:10 Planned: Unplanned by December 2015
9. Accelerated Visible Service Delivery (eg.100% compliance to the SLA, electrification,
PL)
10. Innovative Product Pricing (Introduction of Domestic Time of Use and Green Tariffs)
by 2015
The company scorecard is aligned to the company strategy, which is illustrated below:
Board Approved Page 19City Power Business Plan (2013 - 2016)
Scorecard
Segment Financial = 30%
Overall Intent Increase financial resilience and sustainability of the business
Value Base FY Targets
Objectives Measure Units Acc Freq Proj
Proposition 2011/12 2012/13 2013/14 2014/15 2015/16
Optimise
Improve surplus Surplus Rand value Rbn MD 1.4 0.9 0.8 0.9 1.3 M 2,3,4
surplus
Sustain
revenue Increase sales revenue Sales revenue Rbn RS 12.1 12.4 13.3 14.6 15.9 A 2,3,4
growth
Sustain cash
Increase cash levels Net cash position Rbn Fin 2.3 2 2.1 1.5 1.5 M 2,10
flow
Reduce outstanding
Payment levels % RS 92.4 93 96 98 98 M 4
debtors
99% meter reading AMR
Improve
LPU customer
revenue
Meter reading 95% manual meter reading
collection % RS 98 96 96 96 98 M N/a
performance domestic
98% meter reading
domestic AMR
Reduce Reduce non-technical
Non-technical loss % MD 8.2 6 4.5 3 1 M 2
losses losses
Low operating Optimise bulk purchase
Cost per kWh (n1) c/KWh RS 58.5 67 72 74 78.2 M N/a
costs cost
Optimise maintenance
Maintenance as % of opex % EO New 3 4 5 7 M 8
expenditure
Maximise return on
Return on assets % ES 11.5 10.7 10.7 8.9 8.9 M N/a
capital spend
Capex spend
Manage total capex
Total capital spend % ES 100 100 100 100 100 M N/a
spend to business plan
Board Approved Page 20City Power Business Plan (2013 - 2016)
Segment Customer / Stakeholders = 30%
Overall
Improve customer centricity and ensure active citizenry
Intent
Value FY Targets
Objective Measure Units Acc Base Freq Proj
Proposition 2012/13 2013/14 2014/15 2015/16
Solar water heating
GWH ES New New 13 21 24 M SWH
installations
Promote
Reduce energy After Diversity Maximum
energy KvA ES New 0.12 0.3 0.46 0.6 M
consumption Demand (ADMD)
efficiency
Energy
Energy Mix % RS New New Proj 0.01 0.02 Q
Plan
Improved Customer / stakeholder
% RS 65 65 65 65 70 M RS
customer / Improve customer / satisfaction index
stakeholder stakeholder satisfaction Positive company image % MD 44 45 55 65 70 M N/A
experience Meter roll out Number ES New 30000 100000 150000 200000 M
Maintain high quality of NRS047 index % RS 90 90 90 90 90 M 3,7,9
supply levels NRS048 index % ES 97 97 97 97 97 M 7
Quality
CAIDI mins EO 368.67 368 237.87 221.58 204.59 M 7
supply and
Improve overall system CAIFI # EO 0.08 1.12 5.65 4.65 3.65 M 7
availability
reliability SAIDI mins EO 11.37 11.7 1137 1037 937 M 7
SAIFI # EO 3.08 3.08 4.78 4.68 4.58 M 7
Co-
Number in EPWP # ES 2333 3000 5000 5000 5000 M Production
Plan
Increase employment
50% black owned
Socio opportunities % Fin New 5 8 10 12 M
companies
economic 30% black woman owned
development % Fin New 2 5 8 10 M
company
Additional Capacity MW ES New 90 90 120 120 A
Increase basic service
delivery Number of public lights # EO 5126 4200 4400 4600 4800 M N/a
Electrification # ES 5610 3200 3400 3600 3800 M N/a
Board Approved Page 21City Power Business Plan (2013 - 2016)
Segment Internal Processes = 20%
Overall Intent Efficient and effective processes and enabling information systems
Value Targets
Objective Measure Units Acc Base Freq Proj
Proposition 2012/13 2013/14 2014/15 2015/16
Manage core value
Manage core chain processes to ISO accreditation UA with
Index RAC UA with 1 major findings A N/a
value chains maximise business (maintained) minor
value
Asset Improve maintenance Planned maintenance
% EO 62 65 70 75 80 M 8
management planning and execution ratio
Improve network and
IS network availability
ICT applications % IMS 94 97 97 97 97 M N/a
(uptime)
performance
Data Achievement of data
Data Accuracy % RS Proj Proj Proj Proj 90 Proj 5
management accuracy (index)
AG
Governance, Attain an „unqualified
Qualified / unqualified / report War
risk, audit‟ in a sustainable All QA Unqualified Audit A
matter of emphasis out- plan
compliance manner
come
Board Approved Page 22City Power Business Plan (2013 - 2016)
Learning & Growth = 20%
Overall Intent Maximum employee productivity whilst conducting business in an ethical manner
Value Targets
Proposition
Objectives Measure Units Acc Base Freq Proj
2012/13 2013/14 2014/15 2015/16
Filled critical positions as
Continuity of service
Talent Planning per approved and aligned % HR 30 30 50 80 100 Q N/a
delivery
workforce planning
% of individuals who have
Consistent
Performance been through the PM
performance % HR 80 30 80 100 100 BA N/a
Management process, and have
management
submitted scores
Aligned PDP achievement % HR 80 60 70 90 100 BA
Talent Targeted talent Availability of targeted
KM
Development development skills pool – actual vs. % HR 50 40 60 80 100 Q
number of people trained
Achievement of turnaround
Days HR 90 90 90 90 90 Q N/a
time for new recruits
Filling of vacancies aligned
to agreed Affirmative
Action (AA) targets - % HR 79.2 83 83 83 83 Q N/a
supervisory levels and
Talent Effective talent above
Acquisition acquisition Filling of vacancies
aligned to agreed Gender % HR 20.9 23 24 25 26 Q N/a
Equity (GE) targets
Filling of vacancies
aligned to agreed People
% HR 2.9 2 2 2 2 Q N/a
with Disabilities (PWD)
targets
High Performing Satisfaction Survey
Employee satisfaction Mean HR 3 2 3 4 4 A Prod
Teams Results
Board Approved Page 23City Power Business Plan (2013 - 2016)
SECTION 4: DAY–TO–DAY OPERATIONS
City Power Johannesburg (SOC) Ltd is the Electricity Distribution Service Provider to the
Service Authority, Johannesburg Council. The core competency of the business is to
purchase, distribute and sell electricity within its geographical footprint of business. The City
of Johannesburg is the sole Shareowner. The Council, by means of a Service Delivery
Agreement, regulates the service in respect of the following: financial issues (such as tariffs
and capital expenditure), human resource issues (such as skills development), delivery
targets (maintenance of assets and addressing assets), and standards of customer care.
City Power Johannesburg (SOC) Ltd is accountable to provide network services to all its
customers. Network services include:
the purchasing and distribution and sale of electricity
constructing networks
connecting customers
repair and maintenance of networks
installation and maintenance of public lighting
The City of Johannesburg provides retail customer services for all customers, i.e. processing
of applications, customer queries, customer complaints, customer accounts and revenue
management.
Provide Network Infrastructure
City Power Johannesburg (SOC) Ltd projected network infrastructure status is given in the
table below: Network Infrastructure
Measure Indicator Unit 2011 2010 2009 2008
Eskom Supply Points No. 42 42 39 39
High Voltage Substations (Bulk Intake Points) No. 5 5 5 5
Medium Voltage Substations (Major Substations)
No. 87 87 82 82
excl. Bulk Intake Substations
Low Voltage Substations (Devices) No. 18,366 17,964 14, 252 14,252
High Voltage Overhead Transmission Lines >
km 811.37 811.17 811 811.00
44kV
High Voltage Transmission Cables > 44kV km 101.10 101.10 93.68 93.68
Medium Voltage Overhead Lines >20.5kV and <
km 9.6 9.6 11.2 11.20
44kV
Medium Voltage Cables >20.5kV andCity Power Business Plan (2013 - 2016)
Distribute Electricity
City Power Johannesburg (SOC) Ltd comprises of six independent networks. The figure
below gives the schematic representation of City Power Johannesburg (SOC) Ltd.‟s
Johannesburg transmission network and indicates the bulk power intakes from Eskom and
Kelvin Power Station.
DELTA
3*250MVA 88kV Transmission Circuits
Westfield
KELVIN PS
ESKOM 275kV 300 MW
Firm capacity
Rosebank , Ridge,
500 MVA Fort, Parkhurst and MD 200 MVA
MD 404 MVA Roosevelt Park
Marlboro Cydna , Gresswold,
Eskom Observatory, Bellevue,
Orchards, and Alexandra P roposed
ESKOM 275kV Sebenza 275 kV
Alexandra
88kV Transmission Circuits Firm capacity township Intake from
Eskom
750 MVA
MD 676 MVA
Braamfontein, John Ware, 88kV Transmission Circuits
Bree, Mayfair, Selby, and
Central (20kV).
Eldorado , Nancefield, Pritchard, Siemert , Central,
Nirvana, Hursthill, Robertsham, Mondeor
,
Industria , Eikenhof, Mulbarton , Moffat, Cleveland,
FORDSBURG
and Soweto. Kazerne , Wemmer and Van
4*250MVA PROSPECT Beek .
4*250MVA
88kV Transmission Circuits
ORLANDO 88kV
SWITCHYARD ESKOM 275kV
P roposed Firm capacity
P roposed Mondeor 88 kV 750 MVA
Q uattro 275kV Bus MD 827 MVA
ESKOM Intake Lenasia
from
Eskom
Power is received from Eskom at three major bulk intake points (Prospect, Fordsburg and
Delta Substations) at a voltage of 275kV.
At these major Bulk intake stations the voltage is transformed down to 88kV, it is then
transmitted on City Power‟s transmission network to over 30 step-down substations. At these
step down stations the voltage is transformed down to 11kV and from here it is distributed.
In addition, the 88kV transmission network is supplemented by a power input from the
independently operated Kelvin Power Station.
Network Expansion
The electricity demand in City Power areas reached 3GW in 2010. It is predicted that the
future demand, which excludes potential power-saving strategies and efficiency
improvements, will reach 5.4GW in 2030.
During the past few years a detailed analysis was conducted on the network infrastructure in
order to ascertain the capacity to meet current and future demand. This entailed the conduct
of detailed audits in order to ascertain the condition of the network infrastructure and the
development of network and electrification master plans to ascertain short and medium-term
capacity requirements.
Board Approved Page 25City Power Business Plan (2013 - 2016)
The result of the analysis indicated that extensive refurbishment, upgrades and expansion of
the network were needed in order to meet the current and future demand. The average
transmission infrastructure has reached 63 % of accepted useful life, the average installed
infrastructure (lines / cables) is currently utilized at 31.6 % during normal operations, and
substations (transformers) are utilising installed capacity at 54.6 % and firm capacity at
103.1%.
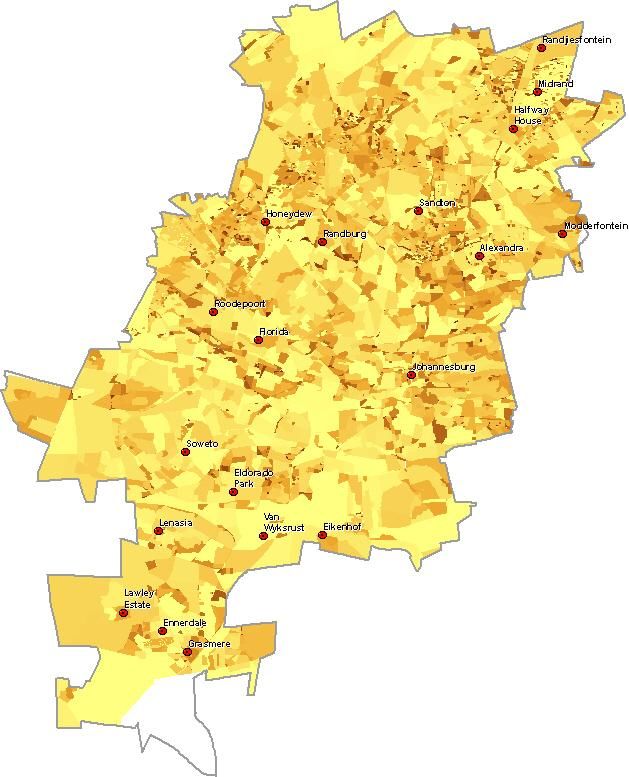
In an effort to proactively plan for the energy needs of the City Power Distribution Area, a
study has been done on how to develop a master plan for energy supply in the areas from
Midrand in the east to Roodepoort in the west and from Randburg in the north to Lenasia in
the south.
The study provided City Power with a clear view and long-term plan on how to develop the
electrical infrastructure required, supporting the envisaged growth in demand. The study
further clearly identified where new infrastructure should be located and what components,
either existing or new, will be required. This has identified and documented expansion and
strengthening projects to ensure the adequate performance of the network within the short-
and longer-term period. The Network Master Plan has been evaluated against a set of
sustainability criteria to ensure that it is a sustainable development.
Focus was placed on the following tasks:
Sufficient information was gathered and reviewed to provide a solid platform on
which the Network Master Plan was to be based.
Geographical load forecast was developed based on regional demographic and
historical load growth patterns, taking into account futuristic economic information,
demographic trends, available land use data and future development initiatives. The
aim of load forecast was to determine the present and future electricity requirements
of electrical end-users and to develop an economic and demographic model which
forecasts the expected population and economic growth in the study area. These
results were then converted into a spatial load forecast applications to produce the
expected electricity needs of the study area. The anticipated long-term load forecast
was directly used as input to the long-term expansion plan.
Review generation-, transmission- and distribution expansion plans with the Network
Master Plan for the region.
Define the network problems by assessing the existing network capability and
analysing the shortcomings in a coordinated manner. In this way all the existing
network problems were identified, along with any potential future problems, within the
study area. Different networks to supply the expected load were identified and
analysed and evaluated properly to ensure that each alternative network complies
with required standards and guidelines. A review on the adequacy of City Power
Sub-transmission network through load flow and contingency analysis was done and
possible new transmission supply stations was also evaluated.
The overall Strategic Environmental Assessment (SEA) approach including the use of a
multi-disciplinary team of experts and specialists that assessed the environmental
consequences of the proposed Network Master Plan on the environment was required.
Alternative plans and strategies were formulated. Emphasis was placed on understanding
the biophysical, social and economic environment and the values there-of. Opportunities,
constraints and values of the study area, including the needs and wants of the relevant
stakeholders, were assessed. This was formulated into a desired state of the environment
that recognises appropriate development options. The Participation Process allowed for all
Board Approved Page 26City Power Business Plan (2013 - 2016)
relevant stakeholders i.e. local authorities, service providers and the property and business
sectors to contribute meaningfully during the development of the Network Master Plan.
The illustration below demonstrates the predicted longer-term demand growth based on
density and location:
Density Density
Load, Load,
To meet current and future demand, City Power has developed a detailed asset
management plan which covers network expansion and the continued maintenance and
refurbishment of network assets over the medium and long term.
The 20 year capital expenditure plan required to ensure the sustainability of the network is
estimated at R26.8bn. in respect of the following infrastructure projects:
In order to support anticipated demand growth, the strengthening and expansion of
the transmission and distribution networks are required.
In order to reduce the failure rate and the average age of network infrastructure,
refurbishment of the transmission and distribution networks are required.
Board Approved Page 27City Power Business Plan (2013 - 2016) The graph below is a graphic representation of the expected capital distribution between the projects. Carbon Emissions A number of renewable energy and DSM initiatives have been developed to align the city with the international requirement to reduce carbon emissions. In 2013/14 financial year City Power will develop a comprehensive Energy Plan to reduce carbon emissions, which will incorporate all the Supply and Demand Side Management projects and how the organisation will measure the impact. Supply Side Management City Power takes the majority of its power from Eskom and a very small contribution from Kelvin Power Station. Almost 98% of this power is produced from coal which is one of the major contributors of CO2 emissions. The country has committed itself to reduce certain amount of emissions and through participation in Integrated Resource Plan 2010 (IRP2010), City Power has to come up with meaningful contribution to the goals of IRP2010. These initiatives will be confined within the useful renewable resources within the City of Johannesburg. The city has embarked on a number of solar projects i.e. solar water heaters, photovoltaic and waste to energy to reduce dependency on coal produced electricity. City Power is also investigating affordable off grid solutions for informal settlements where there are no services installed. Demand Side Management The city has also embarked on a number of energy efficiency initiatives like the replacement of incandescent lights with compact fluorescent lights. This has seen massive savings in residential dwellings and city buildings. City Power is also busy with the replacement of current induction lamps with the energy efficient and LED lights. These technologies are helping tremendously in reducing technical losses and improving the life time of those components. City Power has heavily invested in electrification projects and Demand Side Management initiatives which has seen massive job creation and visible economic activities in those targeted areas. Board Approved Page 28
City Power Business Plan (2013 - 2016)
Electrification
City Power has electrified over 5610 previously-disadvantaged dwellings during the 2011/12
financial year.
Electrification
10,000
9,000
8,000
7,000
6,000
Rm
5,000
4,000
3,000
2,000
1,000
-
2007/08 2008/09 2009/10 2010/11 2011/12 2012/13
Actual 9,057 5,029 6,901 4,369 5,610
Plan 5,800 3,000 3,000 4,000 4,000 4,000
The table below shows the areas that have been electrified during 2010/11:
Number of Political Ward
Project Name
Stands Region Number
Electrification of Pennyville (Zamimpilo) 251 D 68
Electrification of Alexandra ext. 9 Phase1 & 2 2,101 E 32,81
Electrification of Hospital Hills 1,483 G 7
Normalisation of Rabie Ridge 81 A 80
Electrification of Tsepisong West (Ebumnandini 192 C 53
Electrification of Alexandra ext. 10(32,81) 261 E 32
TOTALS 4369
These programmes have positively contributed towards poverty alleviation, as the following
have emerged in the townships:
Establishment of “Spaza” shops
Back yard mechanics
Informal restaurants
Employment of local community during project execution (EPWP)
Community Phones (Cell C, Vodacom and MTN); and
Improved living standards
Board Approved Page 29You can also read