Eastern Reserves Strategic Management Plan 2015-2020 - City of Melville Final
←
→
Page content transcription
If your browser does not render page correctly, please read the page content below
City of Melville

           Eastern Reserves
Strategic Management Plan
                  2015-2020
                        May 2015

          Final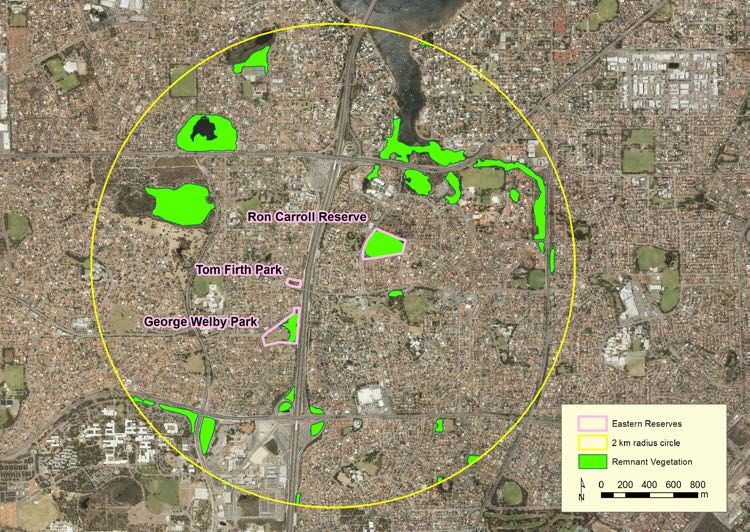
Executive Summary
The Eastern Reserves are located in the suburbs of Bateman and Bullcreek in the east of
the City of Melville. The three reserves (George Welby Park, Tom Firth Park and Ron
Carroll Reserve) include 8.14 hectares of bushland that has been has been moderately
isolated from other terrestrial bushland remnants for approximately 30 years.

These reserves were rated moderately in terms of their overall value in the NAAMP. Of
the four ratings, George Welby Park and Ron Carroll Reserve were in the second highest
tier. Tom Firth Park was in the third highest tier.

Of the 17 assets targeted for monitoring and management, the 3 assets of regional, state
and/or national significance were:
    • 1 ecological community
           • Bassendean Vegetation Complex – Central and South
    • 2 plants
           • Melaleuca thymoides
           • Beaufortia elegans

The vegetation is regionally significant, with less than 30% of the Bassendean Central and
South vegetation complex remaining uncleared.

The 159 native plant species recorded onsite represent approximately one third of the 434
species recorded in the City of Melville. Of these:
   • 1 shrub (Melaleuca thymoides) of regional significance is at moderate risk of local
       extinction as it occurs in low to moderate numbers;
   • 1 shrub (Beaufortia elegans) of regional significance is in low to moderate
       numbers, and is susceptible to local extinction from high frequency fires; and
   • 3 trees (Banksia attenuata, Slender Banksia and Banksia menziesii and Banksia
       ilicifolia, Holly-leaved Banksia) are not regionally significant but in relatively low
       numbers and susceptible to dieback and at moderate risk of local extinction.

The 20 native animal species (3 bats, 2 reptiles and 15 birds) recorded onsite represent
one twelfth of the 240 species recorded in the City of Melville, but the inventory for the
Eastern Reserves is not comprehensive.

Of the 44 threats considered for targeted monitoring and management, the very high
impact threats onsite were:
   • 5 weeds (Asparagus asparagoides Bridal Creeper, Rubus species Blackberry,
       Schinus terebinthifolius Brazilian Pepper, very large tree weeds, and perennial
       clumping grasses);
   • 1 feral animal (Felis catus cats);
   • Dieback (Phytophthora cinnamomi); and
   • climate change (extremely high temperatures and low rainfall).

A discussion is provided on changes in assets and threats between 2005 and 2014, but a
comprehensive audit of key performance indicators, and many leading and lagging
indicators was not possible as quantitative data collection has not been previously
standardised by the City of Melville for bushland management. Between 2005 and 2014:
    • 33 threats were prevented, unchanged, or decreased;
    • 1 threats increased (high temperatures associated with climate change);
    • 10 threats could not be assessed for changes;
    • 15 assets were maintained; and
    • 3 assets could not be assessed for changes.

                                                             Eastern Reserves Strategic Plan page 1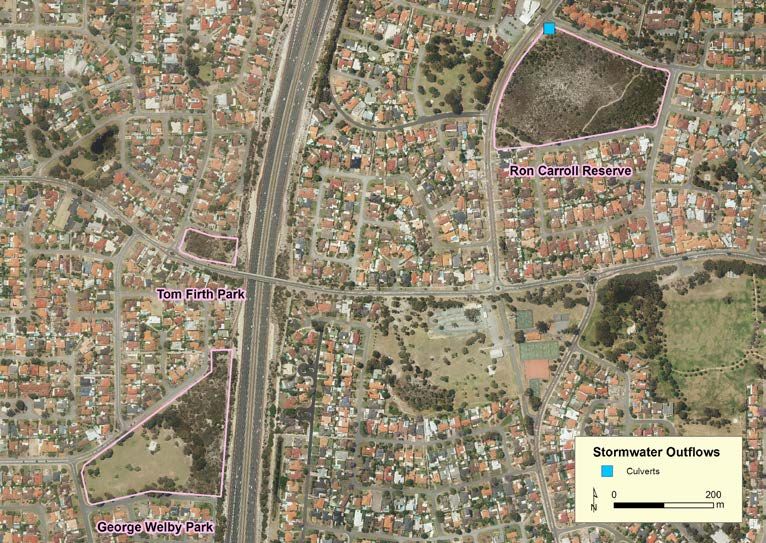
Applying the principles established in the City of Melville’s Natural Areas Asset
Management Plan, this strategic reserve plan establishes 53 objectives for threats in order
to meet the 19 goals for assets for the period 2015-2020. These are to be implemented
through operational reserve plans, guidelines and procedures, and the outcomes and
effectiveness of management reviewed using quantitative data.

The major priorities for management of the bushland in the Eastern Reserves should be:
   • Increasing the numbers of Melaleuca thymoides shrubs (in particular in George
      Welby Park);
   • Increasing the numbers of Banksia attenuata and Banksia ilicifolia trees;
   • Confirming the numbers of Beaufortia elegans shrubs;
   • Reducing the length of informal tracks (particularly in the north-east of Ron Carroll
      Reserve);
   • Eliminating the very high impact weeds in low numbers (Blackberry Rubus
      laudatus, Bridal Creeper Asparagus asparagoides, Brazilian Pepper Schinus
      terebinthifolius, and very large weed trees);
   • Containing non-local plantings (particularly Acacia iteaphylla, Acacia longifolia,
      Acacia podalyriifolia, Banksia prionotes, Grevillea crithmifolia, Grevillea olivacea
      and Melaleuca nesophila); and
   • Managing the impacts of Phytophthora cinnamomi dieback.

The density of very large potentially hollow forming habitat trees in the Eastern Reserves
is less than half the average of 14 habitat trees per hectare recorded across 24 reserves
containing a total of 72.3 hectares of bushland. The additional 19 very large native trees in
the parkland portion of George Welby Park therefore provide significant supplementary
numbers, and whilst outside the scope of bushland management there are opportunities to
further increase the numbers of Melaleuca preissiana (which can develop into very large
trees) in this parkland area.

                                                          Eastern Reserves Strategic Plan page 2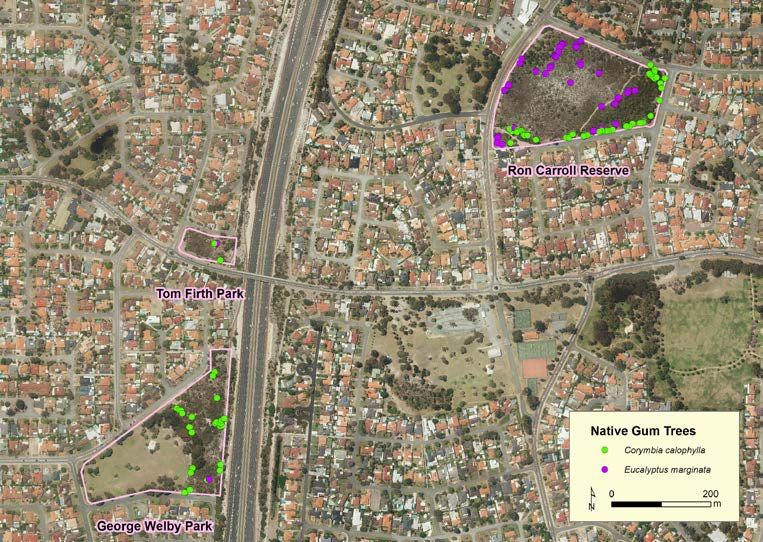
Recommended Reference
The recommended reference for this document is:

Waters, A (2015) Eastern Reserves Strategic Management Plan 2015-2020, Woodgis
Environmental Assessment and Management for the City of Melville, Perth.

Acknowledgements
Woodgis Environmental Assessment and Management would like to acknowledge the
contribution of the following personnel from the City of Melville during preparation of the
strategic management plan:
    • Kellie Motteram, Environmental Officer;
    • Blair Bloomfield, Environmental Maintenance Supervisor; and
    • Errol Allen, Team Leader - Environmental Maintenance.

Acronyms and Definitions
ANZECC                Australian and New Zealand Environment and Conservation Council
DBH                   diameter at breast height
DEC                   (WA) Department of Environment and Conservation
DEP                   (WA) Department of Environmental Protection
DPaW                  (WA) Department of Parks and Wildlife
EPBC Act              Environment Protection and Biodiversity Conservation Act
FCT                   Floristic Community Type
ha                    hectares
Melville              City (rather than suburb) unless specifically stated otherwise
NAAMP                 Natural Areas Asset Management Plan
PEC                   Priority Ecological Community (as defined and listed by DPaW)
WAPC                  Western Australian Planning Commission

                                                         Eastern Reserves Strategic Plan page 3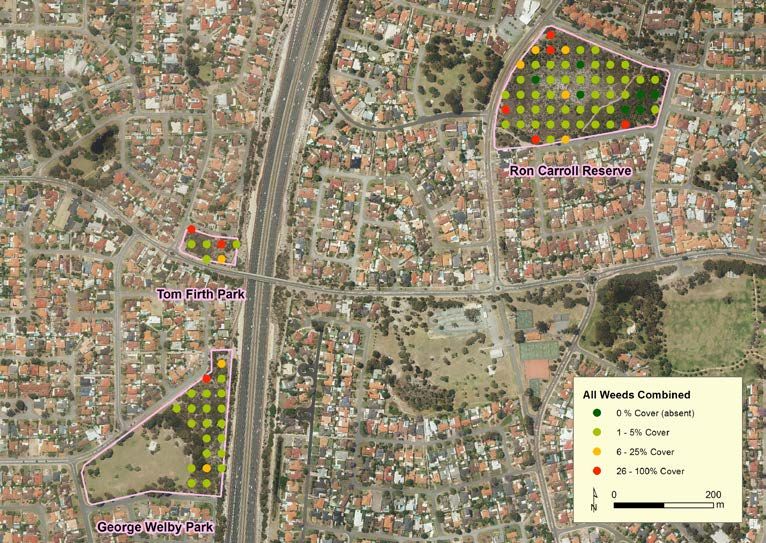
Table of Contents
Executive Summary ............................................................................................................................ 1
Recommended Reference ................................................................................................................ 3
Acknowledgements ........................................................................................................................... 3
Acronyms and Definitions .................................................................................................................. 3
Table of Contents ................................................................................................................................ 4
Figures.................................................................................................................................................. 5
Tables ................................................................................................................................................... 5
1 Introduction ...................................................................................................................................... 7
1.1         Background ............................................................................................................................ 7
1.2 Objectives ................................................................................................................................... 10
1.3 Scope........................................................................................................................................... 10
2 Assets .............................................................................................................................................. 11
2.1 Overview ..................................................................................................................................... 11
2.1 Reserve Assets ............................................................................................................................ 13
2.1.1 Bush Forever ............................................................................................................................. 13
2.1.1 Ecological Linkages ................................................................................................................ 14
2.2 Site Assets .................................................................................................................................... 17
2.2.1 Ecological Communities ......................................................................................................... 17
2.2.2 Fauna Habitat........................................................................................................................... 21
2.2.3 Wetlands ................................................................................................................................... 23
2.2.4 Heritage .................................................................................................................................... 24
2.2.4       Community Interest ............................................................................................................. 24
2.2.5 Reference ................................................................................................................................. 25
2.3 Species ........................................................................................................................................ 26
2.3.1 Native Flora .............................................................................................................................. 26
2.3.1 Native Fauna ............................................................................................................................ 31
3.1 Physical Disturbance .................................................................................................................. 36
3.2 Fire ................................................................................................................................................ 37
3.3 Weeds .......................................................................................................................................... 38
3.4 Habitat Loss ................................................................................................................................. 40
3.5 Feral Animals ............................................................................................................................... 42
3.6 Diseases and Pathogens ............................................................................................................ 44
3.7 Stormwater .................................................................................................................................. 45
3.8 Reticulation ................................................................................................................................. 45
3.10 Climate Change ....................................................................................................................... 46
4 Management ................................................................................................................................. 48
4.1 Review of Management 2005-2014 .......................................................................................... 48
4.1.1 Key Performance Indicators ................................................................................................... 48
4.1.2 Leading Indicators ................................................................................................................... 49

                                                                                               Eastern Reserves Strategic Plan page 4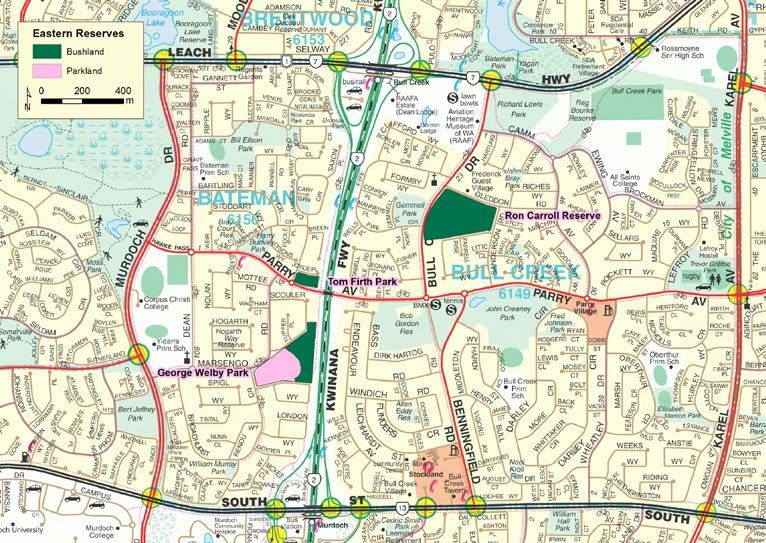
4.1.3 Lagging Indicators ................................................................................................................... 49
4.2 Management Objectives 2015-2020 ........................................................................................ 50
4.2.1 Key Performance Indicators ................................................................................................... 50
4.2.2 Leading Indicators ................................................................................................................... 54
4.2.3 Lagging Indicators ................................................................................................................... 55
References ........................................................................................................................................ 56
Appendix 1 Flora Inventory ............................................................................................................. 60
Appendix 2 Fauna Inventory ........................................................................................................... 65
Appendix 3 Weed Distributions ....................................................................................................... 66
Figures
Figure 1 Context of Strategic Reserve Plans in relation to other documents ............. 7
Figure 2 Documents used to Maintain/Enhance Assets by Managing Threats .......... 8
Figure 3: Location of Reserves included in Plan ......................................................... 10
Figure 4 Assessment of Assets in Natural Areas ........................................................ 11
Figure 5 Aerial Photo of the Eastern Reserves 1974 ................................................... 14
Figure 6 Aerial Photo of the Eastern Reserves 1981 ................................................... 15
Figure 7 Aerial Photo of the Eastern Reserves 1985 ................................................... 15
Figure 8 Remnant Vegetation within 2 km of Eastern Reserves ................................ 16
Figure 9: Vegetation Associations ................................................................................ 17
Figure 10: Historical Clearing of the Eastern Reserves .............................................. 18
Figure 11: Vegetation in 1985 ........................................................................................ 18
Figure 12: Vegetation in 1974 ........................................................................................ 18
Figure 13: Vegetation in 1965 ........................................................................................ 18
Figure 14: Vegetation in 1953 ........................................................................................ 18
Figure 15: Areas of High Native Plant Cover 2014 ....................................................... 20
Figure 16 Changes in Density of Perennial Vegetation 1990-2012 ............................. 20
Figure 17: Distribution of Native Habitat Trees in 2014............................................... 21
Figure 18: Distribution of Jarrah and Marri Trees in 2014 .......................................... 23
Figure 19 Community Interest Sites .............................................................................. 24
Figure 20: Banksia trees Distribution 2014 .................................................................. 27
Figure 21: Melaleuca thymoides Distribution 2014...................................................... 28
Figure 22 Assessment of Threats in Natural Areas ..................................................... 35
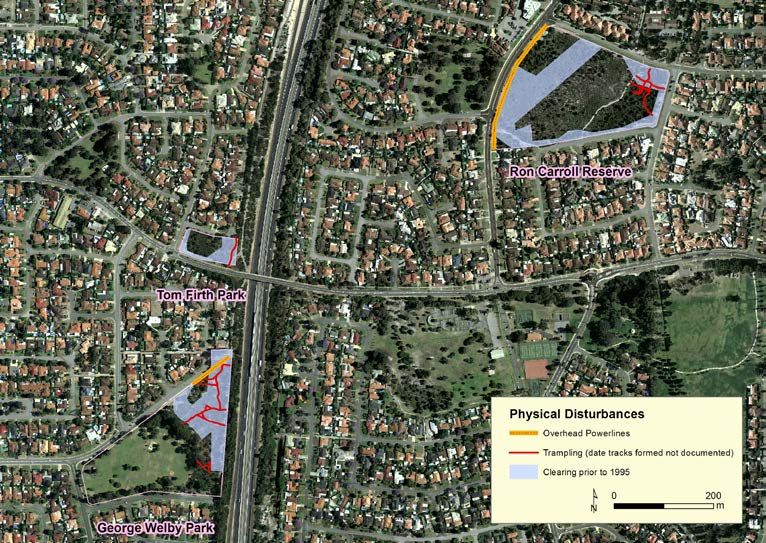
Figure 23 Location of Physical Disturbances .............................................................. 36
Figure 24 Fires 2005 to 2014 .......................................................................................... 37
Figure 25: Cover of All Weeds Combined..................................................................... 40
Figure 26: Bare Ground .................................................................................................. 41
Figure 27 Interpretation of Extent of Dieback Infestation in 2014 .............................. 44
Figure 28: Stormwater Inflows ....................................................................................... 45
Figure 29 Infrastructure Locations 2014 ....................................................................... 48
Figure 30: Very High Impact Weeds (excluding grasses) ........................................... 66
Figure 31: High Impact Weeds (shrubs and trees) ...................................................... 66
Figure 32: High Impact Weeds (geophytes) ................................................................. 66
Figure 33: Very High Impact Perennial Clumping Grasses......................................... 66
Figure 34: High Impact Annual Clumping Grasses ..................................................... 66
Figure 35: High Impact Perennial Running Grasses ................................................... 66
Figure 36: Medium Impact Perennial Weeds ................................................................ 66
Figure 37: Low Impact Annual Weeds .......................................................................... 66
Tables
Table 1: Reserve Extents................................................................................................ 10
Table 2 Groups of Assets generally most susceptible to Threats ............................. 12
Eastern Reserves Strategic Plan page 5
Table 3: Extents of Vegetation Associations ............................................................... 17
Table 4 Ecological Community Sites ............................................................................ 19
Table 5 Ecological Community Indices......................................................................... 21
Table 6 Numbers of Very Large Native Trees by Species ........................................... 22
Table 7 Numbers of Very Large Trees per Hectare in Melville Reserves ................... 22
Table 8 Fauna Habitat Sites Indices .............................................................................. 23
Table 9 Community Interest Sites 2014 ........................................................................ 24
Table 10 Revegetation Objectives ................................................................................. 25
Table 11 Community Interest Site Indices .................................................................... 25
Table 12 Plant Indices..................................................................................................... 26
Table 13: Number of Banksia Trees in City of Melville Reserves ............................... 27
Table 14: Native Coastal Plain plants considered weeds in the Eastern Reserves .. 30
Table 15 Mammal Species Indices ................................................................................ 31
Table 16 Mammal Species to be Monitored .................................................................. 31
Table 17 Mammal Habitat Considerations for Revegetation ....................................... 32
Table 18 Reptile Indices ................................................................................................. 32
Table 19 Reptile Habitat Considerations for Revegetation ......................................... 32
Table 20 Bird Indices ...................................................................................................... 33
Table 21 Minimum Thresholds for Bird Presence in Bushland .................................. 34
Table 22 Bird Habitat Considerations for Revegetation .............................................. 34
Table 23 Physical Disturbance Indices ......................................................................... 36
Table 24 Fire Indices ....................................................................................................... 37
Table 25 Number of Weed Species in Each Impact Category ..................................... 38
Table 26 Weed Indices .................................................................................................... 38
Table 27 Number of Plants in 2014 of Selected Weeds ............................................... 39
Table 28 Cover of All Weeds Combined ....................................................................... 40
Table 29 Bare Ground Cover.......................................................................................... 41
Table 30 Habitat Loss Indices ........................................................................................ 41
Table 31 Feral Animal Records ...................................................................................... 42
Table 32 Feral Animal Indices ........................................................................................ 43
Table 33 Other Feral Animals to be Monitored............................................................. 43
Table 34 Disease and Pathogen Indices ....................................................................... 44
Table 35 Reticulation Indices ......................................................................................... 45
Table 36 Acid Sulfate Soil Indices ................................................................................. 46
Table 37 Average Monthly Maximum Temperatures 2005-2014 ................................. 46
Table 38 Monthly Rainfall 2005-2014 ............................................................................. 47
Table 39 Extreme Weather Events................................................................................. 47
Table 40 Infrastructure Extents / Numbers ................................................................... 48
Table 41 Leading Indicators ........................................................................................... 49
Table 42 Lagging Indicators........................................................................................... 49
Table 43 Application of Bushfire Management Guidelines ......................................... 50
Table 44 Application of Environmental Weed Management Document ..................... 51
Table 45 Application of Revegetation Management Document .................................. 52
Table 46 Application of Management of Feral Animals Document ............................ 53
Table 47 Application of Guidelines for Disease and Pathogens ................................ 53
Table 48 Application of Friends Group Manual............................................................ 53
Table 49 Tiered Objectives for Threats and Associated Leading Indicators ............ 54
Table 50 Objectives for Weed Species in the Eastern Reserves ................................ 54
Table 51 Objectives for all other Threats in the Eastern Reserves ............................ 54
Table 52 Tiered Goals for Assets and Associated Lagging Indicators ...................... 55
Table 53 Goals for Species ............................................................................................ 55
Table 54 Goals for Sites ................................................................................................. 55
Table 55 Native Flora Inventory ..................................................................................... 60
Table 56 Weed Inventory ................................................................................................ 63
Table 57 Fauna Inventory ............................................................................................... 65
Table 58 Feral Animal Inventory .................................................................................... 65
                                                                                Eastern Reserves Strategic Plan page 6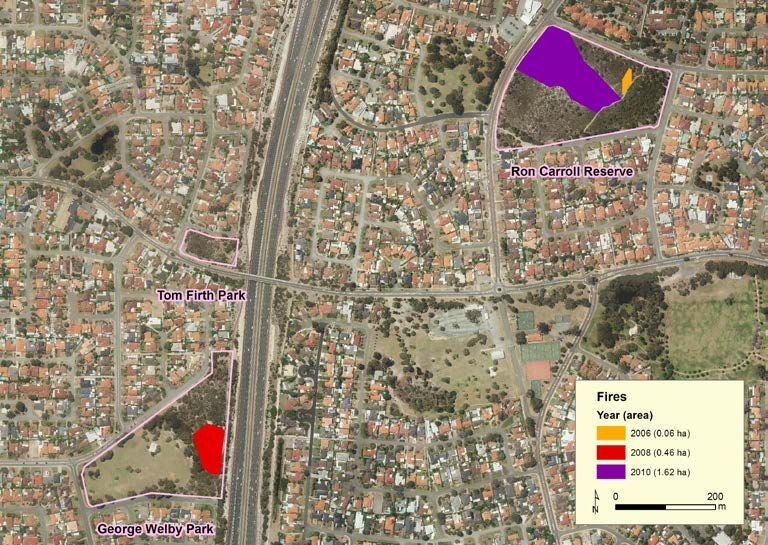
1 Introduction
1.1   Background
The Eastern Reserves Strategic Management Plan updates and expands upon the:
   • George Welby Park Management Plan (City of Melville, 2006).
   • Ron Carroll Reserve Management Plan (City of Melville, 2005)

In accordance with the City of Melville’s Natural Areas Asset Management Plan (NAAMP)
framework, the Strategic Reserve Plan forms part of the integrated set of documents
shown in Figure 1.

       Figure 1 Context of Strategic Reserve Plans in relation to other documents

                                                       Eastern Reserves Strategic Plan page 7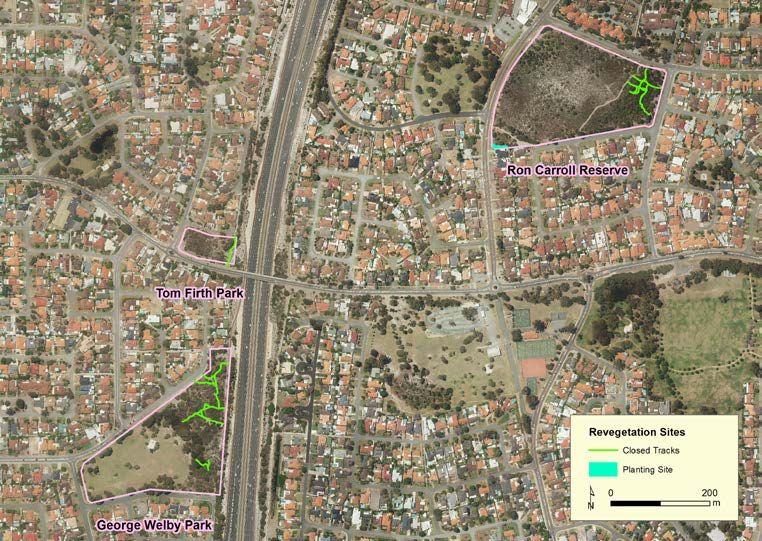
The Strategy Reserve Plan is structured with the major headings of assets and threats in
accordance with the NAAMP framework, whereby assets are maintained or enhanced by
the management of threats (using the strategies and guidelines) as summarised in Figure
2.
Priorities Threats impacting on Techniques
for Protection from Threats assets and therefore for Management of Threats
subject to Management
BIODIVERSITY ASSETS THREATS STRATEGIES AND GUIDELINES
Revegetation Strategy & Guidelines
Diseases and Pathogen Guidelines
Stormwater Management Strategy
Sign, Path and Barrier Guidelines
Acid Sulfate Soils Guidelines
Ecological Community Sites
Feral Animal Strategy and
Community Interest Sites
Weed Control Strategy &
Community Engagement
Bush Forever Reserves
Reticulation Guidelines
Native Fauna Species
Native Flora Species
Bushfire Strategy
Reference Sites
Heritage Sites
Wetland Sites
Guidelines
Guidelines
X X X X X X Physical Disturbance X X X X X X X X X X
X X X X X X Fire X X X X X
X X X X X X X Weeds X X X X X
X X X X Habitat Loss X X X
X X X X Feral Animals X X X
X X X X X X X X Diseases & Pathogens X X X
X X X X X X X Stormwater X X
X Reticulation X
X X X X X X Acid Sulfate Soils X
X X X X X Climate Change X X
Figure 2 Documents used to Maintain/Enhance Assets by Managing Threats
Red = Strategy intended to Prevent, Eliminate, Contain or Manage impacts from threat
Orange = Strategy or Guideline to Manage secondary impacts from threats
Guidelines and procedures were to largely pre-empt strategic reserve plans, to ensure
efficiency and consistency in benchmarking and monitoring expected outcomes. The City
of Melville has begun to develop the guidelines and procedures required but they do not
yet fully apply the framework for ranking/prioritising assets and threats, nor document all
management and monitoring techniques.
Historically management plans have focused on developing flora and fauna inventories to
identify reserves of greatest significance within the City of Melville. Under the NAAMP
framework, the focus is moving to risk assessment and prioritisation of management
objectives within reserves, and it is envisaged that future plans will focus to a greater
degree on reviewing the outcomes and effectiveness of management strategies and
guidelines.
Eastern Reserves Strategic Plan page 8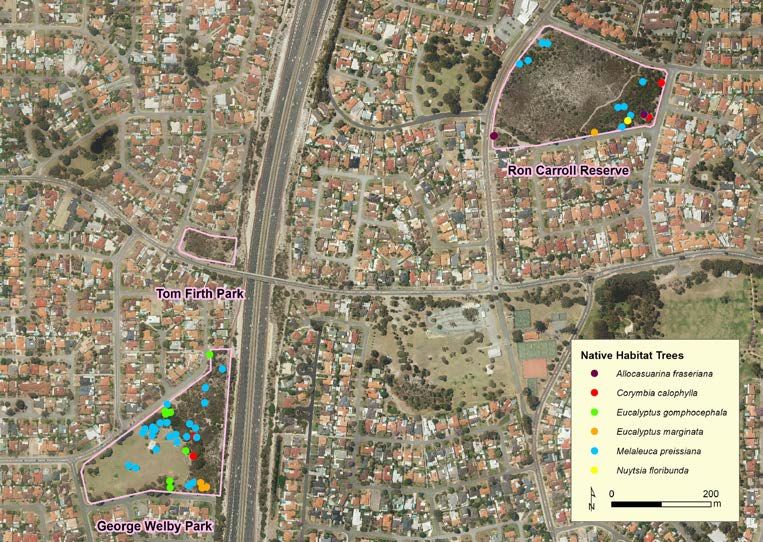
The NAAMP provides a framework for consistently prioritising assets and threats between
reserves, and a format for plans, and that also facilitates community involvement in
managing specific reserves:
   • During the preparation of strategic reserve plans, the community can assist in:
       • the identification and benchmarking of assets and threats; and
       • quantifying objectives for threats and goals for assets (e.g. specific number of
           very high value plants of a species to be established onsite).
   • During the life of strategic plans, the community can assist in:
       • the identification and delineation of additional assets (including revegetation
           sites) and threats;
       • the monitoring of assets and threats; and
       • on-grounds works in the context of specific and measurable goals.

                                                        Eastern Reserves Strategic Plan page 9
1.2 Objectives
Under the framework of the NAAMP, the objectives of this and all City of Melville Strategic
Reserve Plan/s are to:
• document:
• the extent and/or abundance and condition of assets;
• the present and potential level and extent of impacts of threats;
• any changes evident in the assets and threats over time;
• reserve-specific risk-based management priorities;
• management strategies relevant to the specific reserve; and
• discuss:
• reserve-specific application of strategies and make reserve specific
recommendation regarding the implementation of strategies.
1.3 Scope
The scope of this report was the 8.14 ha of bushland in the 11.04 ha of reserves listed in
Table 1.
Table 1: Reserve Extents
Reserve Name Reserves Reserve Area Bushland Area
George Welby Park Reserve 35082 4.90 ha 2.00 ha
Tom Firth Park Reserve 41226 0.56 ha 0.56 ha
Ron Carroll Reserve Reserve 32453 5.58 ha 5.58 ha
These reserves are located in the suburbs of Bateman and Bullcreek in the east of the City
of Melville, as shown in Figure 3.
Figure 3: Location of Reserves included in Plan
These reserves were rated moderately in terms of their overall value in the NAAMP. Of
the four ratings, George Welby Park and Ron Carroll Reserve were in the second highest
tier. Tom Firth Park was in the third highest tier.
Eastern Reserves Strategic Plan page 102 Assets
2.1 Overview
The City of Melville has committed to a strategic goal to ‘contribute to the maintenance and
enhancement of biodiversity for the preservation of our natural flora and fauna’.
The NAAMP documents the regional context for climate, soils, landforms, flora and fauna;
and establishes a framework by which biodiversity is:
• defined as assets at three scales:
• Reserves (usually defined by cadastral boundaries);
• Sites (management units such as a vegetation type that may encompass either
a part or the entirety of a reserve); or
• Species (a group of organisms capable of interbreeding freely with each other
but not with members of other species).
• prioritised for either maintenance and enhancement (or confirmation if its status
onsite is uncertain, or monitoring if a reserve is not critical habitat) in terms of:
• Values (assessed with reference to local regional, state, national and
international significance) as shown in Figure 4.
Figure 4 Assessment of Assets in Natural Areas
The values of assets are reviewed periodically as they will occasionally change (e.g. the
significance of an occurrence of a species may be downgraded if it is recorded in more
reserves over time with additional targeted surveys). A change in the value of an asset is
applicable to that asset in all natural areas in the City of Melville, including in reserves with
current endorsed strategic reserve management plans.
Eastern Reserves Strategic Plan page 11To provide foci for management and monitoring, a strategic risk assessment was
undertaken in the 2013 NAAMP (Waters A. , 2013) to identify assets with elevated
susceptibility to threats.
Assets are used as indices where they are significant and/or vulnerable to loss or
degradation without targeted action. Vulnerable assets were determined on the basis of
the characteristics summarised in Table 2.
Table 2 Groups of Assets generally most susceptible to Threats
Assets
Threats Sites Fauna Species Flora Species
Physical Ground dwelling and/or All shrubs, and
All sites
Disturbance burrowing reptiles herbaceous species
Fire Trees and shrubs that
All ground dwelling species
are killed by fire and
All sites (non-burrowing, non-climbing
regenerate only from
and non-flying species)
seed stored on the plant
Weeds Ground dwelling and/or All shrubs, and
All sites
burrowing reptiles herbaceous species
Habitat Loss Ecological Community Listed as Threatened or Listed as Threatened or
listed as Threatened or Priority by DPaW Priority by DPaW
Priority by DPaW
Present in few reserves or Present in few reserves
Present in few reserves few individuals in a reserve or few individuals in a
reserve
Cannot persist in urban or
‘small’ bushland areas
Hollow dependent species
Feral Animals
Cats and foxes - All species -
Rabbits Revegetation sites - -
Bees - Hollow dependent species All herbaceous species
Diseases &
All sites No species Wide range of species
Pathogens
Stormwater All wetland dependent All wetland dependent
All wetlands
species species
Reticulation Reptiles that are either
All shrubs, and
All sites ground dwelling and/or
herbaceous species
burrowing
Acid Sulfate Soils All wetland dependent All wetland dependent
species species
Climate Change Long-lived shallow rooted
All wetland dependent
All wetlands and associated with
species
saturated soils
Eastern Reserves Strategic Plan page 122.1 Reserve Assets
2.1.1 Bush Forever
Bush Forever Sites are properties listed as containing regionally significant bushland by
the Government of Western Australia (2000). Bush Forever is not subject to ongoing
revision and therefore the Bush Forever status of reserves is expected to remained
unchanged for the foreseeable future. However under the NAAMP, Bush Forever status is
considered in terms of:
• prioritising management resources between reserves, and
• managing sites and species within reserves to ensure reserves continue to meet
the Bush Forever criteria for which they were listed.
None of the Eastern Reserves were listed by the Government of Western Australia (2000)
as Bush Forever Sites using the following criteria:
• Representation of ecological communities
Areas that as a suite represent the range of ecological communities and the places
in which these communities merge
• Diversity
Areas with a high diversity of flora and/or fauna species or communities in close
association
• Rarity
Areas containing rare or threatened communities or species, or species of
restricted distribution
• Maintaining ecological processes or natural systems
Maintenance of ecological processes or natural systems at a regional or national
scale
• Scientific or evolutionary importance
Areas containing evidence of evolutionary processes either as fossilised material or
as relict species and areas containing unusual or important geomorphological or
geological sites; Areas of recognised scientific and educational interest as
reference sites or as examples of the important environmental processes at work
• General criteria for the protection of wetland, steamline and estuarine
fringing vegetation and coastal vegetation
Conservation category wetlands areas including fringing vegetation and associated
upland vegetation. Coastal vegetation within the accepted coastal management
zone
• Criteria not relevant to determination of regional significance, but which may
be applied when evaluating areas having similar values
Attributes which taken alone do not establish regional significance, but which can
add to the value of bushland and enhance it contribution to Bush Forever
Eastern Reserves Strategic Plan page 132.1.1 Ecological Linkages
Ecological linkages can increase the effective size of flora populations, and increase
available habitat for individual animals, and help maintain genetic diversity for animals and
plants by providing connections between groups of animals and plants in isolated
bushland remnants.
The management of linkages is outside of the scope of Strategic Reserve Plans and is
dealt with through processes such as:
• land use planning processes;
• the City of Melville’s Green Plan (Alan Tingay and Associates, 1998);
• the City of Melville Streetscape Strategy; and
• the City of Melville Public Open Space Strategy.
Under the NAAMP, linkages are considered in terms of:
• prioritising management resources between reserves, and
• determining whether species can persist onsite in the long term.
None of the Eastern Reserves were included in any Regional Linkages in Bush Forever
(Government of Western Australia, 2000) or Perth Biodiversity Plan Regional Linkages.
George Welby Park and Tom Firth Park (but not Ron Carroll Reserve) were included in the
north-south ‘Kwinana Freeway’ Regional Greenway 80 (Alan Tingay and Associates,
1998).
The bushland of the Eastern Reserves has been moderately isolated from other terrestrial
bushland remnants for approximately 30 years. The three Eastern Reserves were part of
a single larger continuous bushland area until about 1975, Tom Firth and George Welby
Parks remained linked by continuous remnant vegetation until about 1980 and Ron Carroll
Reserve was reduced to its present size in about 1984. Aerial photography from 1974,
1981 and 1985 is shown in Figure 5, Figure 6 and Figure 7 respectively.
Figure 5 Aerial Photo of the Eastern Reserves 1974
Eastern Reserves Strategic Plan page 14Figure 6 Aerial Photo of the Eastern Reserves 1981
Figure 7 Aerial Photo of the Eastern Reserves 1985
There is approximately 6% native vegetation in the circle extending 2 km out from the
centre of Eastern Reserves as shown, using Department of Agriculture vegetation
boundaries, in Figure 8.
Eastern Reserves Strategic Plan page 15Figure 8 Remnant Vegetation within 2 km of Eastern Reserves
The total of 6% native cover in this area has implications for the long term persistence and
management of some flora and fauna species onsite (see Section 2.3 and Section 4).
Eastern Reserves Strategic Plan page 162.2 Site Assets
2.2.1 Ecological Communities
The four vegetation associations, on which management will be based in the Eastern
Reserves, are detailed in Flora And Vegetation Surveys City of Melville Eastern Reserves
(Waters A. , 2015), and shown in Figure 9.
Figure 9: Vegetation Associations
The flora recorded in each reserve is documented in Appendix 2. The distribution of within
and between reserves in part reflect topography / soil moisture. A general indication of
this pattern is shown in Table 3.
Table 3: Extents of Vegetation Associations
George Ron
Dominant / Typical Tom Firth
Associations Welby Carrol Total
species Park
Park Reserve
Banksia attenuata / Banksia attenuata
Banksia menziesii Banksia menziesii
0.73 1.97 0.56 3.26
woodland Corymbia calophylla
Drier
Eucalyptus marginata
Dasypogon bromeliifolius
Lyginia barbata
Mixed herbland 1.97 1.97
Patersonia occidentalis
Scholtzia involucrata
Melaleuca Hypocalymma angustifolia
thymoides Kunzea glabrescens
0.77 0.77
Wetter
Shrubland Melaleuca thymoides
Xanthorrhoea preissii
Melaleuca
Hypocalymma angustifolia
preissiana 1.23 1.08 2.31
Melaleuca preissiana
woodland
Total 1.95 5.79 0.56 8.30
Eastern Reserves Strategic Plan page 17The vegetation association boundaries have also been influenced by historical clearing.
The areas that were unequivocally cleared in aerial photos at some point between 1953
and 2014 are shown in Figure 10 (noting that additional modification such as grazing and
tree cutting is also likely to have occurred outside these areas). Some of this clearing is
evident in Figure 11, Figure 12, Figure 13 and Figure 14.
Figure 10: Historical Clearing of the Eastern Reserves
Figure 11: Vegetation in 1985 Figure 13: Vegetation in 1965
Figure 12: Vegetation in 1974 Figure 14: Vegetation in 1953
Eastern Reserves Strategic Plan page 18The vegetation association boundaries in Figure 9 should be used as a guide rather than
rigidly applied in the management of the site as:
• vegetation has been significantly modified, over the last 60 years;
• vegetation boundaries changed (e.g. at the southern end of George Welby Park),
over the last 60 years likely due to a combination of earthworks and climate
change;
• the mixed herblands on the slopes either side of the low sand dune of Banksia
woodland in Ron Carroll Reserve exhibit differences in dominant species but a
detailed flora inventory of areas within the herbland would be required to determine
whether significant differences exist between or within the areas (preferably an
analysis would be undertaken based on a number of 100 m2 quadrats, that would
be permanently marked for later use as reference sites); and
• the herblands in Ron Carroll Reserve contain scattered shrubs (such as Scholtzia
involucrata) and with increasing time since fire may transform into low shrublands.
Assets are prioritised on the basis of their highest level of significance when they are
assessed against multiple datasets. The significance of vegetation can be assessed in
terms of several classifications:
• Vegetation Complexes are a regional classification for the Swan Coastal Plain,
Darling Scarp and Darling Plateau mapped by Heddle et al. (1980) on the basis of
combinations of plants communities, soils and landforms. Plant communities may
occur in more than one soil-landform combination but the relative proportions of
plant communities vary between these (Government of Western Australia, 2000).
• Floristic Community Types (FCTs) are a regional classification for the Swan
Coastal Plain and Darling Scarp defined in terms of groups of co-occurring plants
by Gibson et al. (1995) and the DEP (1996). Whilst FCTs are distributed in more of
a mosaic than vegetation complexes, the classifications are equivalent in dividing
the region into a roughly equal number of classes. There are some associations
between FCTs and vegetation complexes (i.e. some FCTs tend to occur in
particular complexes), but there is no hierarchical relationship between them. No
FCTs were inferred for the Eastern Reserves because there were no detailed
reference sites or species inventories to compare species presence/absence
between vegetation associations.
• Vegetation Types are a local classification in the City of Melville mapped by
Ecoscape (2006) in terms of dominant overstorey species. The general
descriptions of vegetation types were applied to avoid issues with minor
discrepancies in interpretation of boundaries and the mixed herbland that was
recorded as a shrubland on shallow soil by Ecoscape (2006) was re-assigned to an
upland Banksia community as was no evidence of shallow limestone.
The ecological communities for which objectives apply are listed in Table 4.
Table 4 Ecological Community Sites
Vegetation Vegetation Floristic
Vegetation Types
Association Complex Community Types
Banksia attenuata / Banksia and Allocasuarina species on
Banksia menziesii upland areas /
woodland Bassendean - Eucalyptus and Banksia species on
Central and upland areas
Mixed herbland South
Low Significance
High Multiple occurrences in Melville
Not Determined Eucalyptus species on upland areas
Significance
Melaleuca thymoides
Vegetation Low Significance
Shrubland
Complex with Multiple occurrences in Melville
10-30% Stout Paperbark woodlands
Melaleuca preissiana uncleared
woodland Low Significance
Multiple occurrences in Melville
Eastern Reserves Strategic Plan page 19The areas of high native plant cover (
Figure 16 is based on changes in the brightness of pixels 25 m x 25 m in satellite images,
and is not diagnostic. The decrease in density in Ron Carroll Reserve is likely to be the
result of fire, and the increase in Tom Firth Park a result of regrowth/plantings after partial
clearing of the park in the mid-1980s.

The ecological communities for which objectives apply are listed in Table 4.

                           Table 5 Ecological Community Indices
                                                                 High Native    High Native
                                                                                                 Assets
Values        Ecological Community Sites                         Plant Cover    Plant Cover
                                                                                                2005-2014
                                                                    2005           2014
              Bassendean – Central and South Vegetation
High          Complex
Vegetation
              •   Banksia attenuata/Banksia menziesii woodland                                  Change Not
Complex                                                            No Data          85%
              •   Mixed herbland                                                                Assessable
with 10-30%
              •   Melaleuca thymoides Shrubland
uncleared
              •   Melaleuca preissiana woodland

2.2.2 Fauna Habitat
Very large trees are important habitat sites for a number of resident and migratory birds
and bats onsite:
   • many birds rely on tree hollows (Birdlife Australia, 2013);
   • roost sites (in tree hollows and under flaking/rough bark) are a critical habitat
       requirement for bats (Hosken, 1996); and
   • The size of trees is one of the critical factors in determining the likelihood of hollow
       formation in trees (Gibbons & Lindenmayer, 2002).

The locations of the very large dead trees and live native trees (trunk diameter at breast
height greater than 50 cm) are shown in Figure 17.

                  Figure 17: Distribution of Native Habitat Trees in 2014

                                                             Eastern Reserves Strategic Plan page 21
The numbers of very large trees by species are listed in Table 6.
Table 6 Numbers of Very Large Native Trees by Species
George George Ron Carrol Tom Firth
Species Welby Park Welby Park Reserve Park Total
(Bushland) (Parkland) (Bushland) (Bushland)
Allocasuarina fraseriana 3 3
Corymbia calophylla 2 2 4
Eucalyptus gomphocephala 4 3 7
Live
Eucalyptus marginata 1 1
Melaleuca preissiana 11 14 9 34
Nuytsia floribunda 1 1
Total Native Habitat Trees 17 19 16 50
Eucalyptus marginata 3 3
Dead
Melaleuca preissiana 1 1
Total Dead Habitat Trees 3 1 4
Total Habitat Trees 20 19 17 54
The density of very large trees per hectare in bushland areas in the Eastern Reserves is
compared to other group of reserves in Table 7.
Table 7 Numbers of Very Large Trees per Hectare in Melville Reserves
Very South- North-
Large Eastern Eastern Bullcreek West Estuarine Heathcote Kings
Trees Reserves1 Reserves1 Reserves1 Reserves1 Reserves1 Reserve1 Park2
Live Native 6 10 12 17 18 4 11
Dead 50 cm (strategic reserve management plans) 2: DBH > 45 cm (Beard, 1967).
The density of habitat trees in the Eastern Reserves is less than half the average of 14
habitat trees per hectare (13 live native and 1 dead tree per hectare) recorded across 24
reserves containing a total of 72.3 hectares of bushland.
The additional 19 very large native trees in the parkland portion of George Welby Park
therefore provide significant supplementary numbers, and whilst outside the scope of
bushland management there are opportunities to further increase the numbers of
Melaleuca preissiana (which can develop into very large trees) in this parkland area.
This low density of habitat trees appears to reflect previous clearing of the reserves as
there are considerable numbers of trees that are capable of attaining a diameter at breast
height greater than 50 cm (but yet to reach sufficient age to be of this size), with 78
Eucalyptus marginata, Jarrah and 46 Corymbia calophylla, Marri onsite. Figure 18 shows
the distribution of Jarrah and Marri trees in 2014, with most of these trees requiring many
decades of additional growth to develop into very large trees and potentially form hollows.
There are opportunities to further increase the number of habitat trees in the long term by
increasing the numbers of Jarrah and Marri trees in the bushland of the Eastern Reserves,
especially:
• for Jarrah trees in George Welby Park (with one live Jarrah Tree);
• for Jarrah and Marri trees in Tom Firth Park (with two live Marri and one live Jarrah
tree); and
• for Jarrah and Marri trees in the eastern mixed herbland in Ron Carroll Reserve.
Eastern Reserves Strategic Plan page 22Figure 18: Distribution of Jarrah and Marri Trees in 2014
The fauna habitat for which objectives apply are listed in Table 8, which reflects that the
number of very large trees was not previously benchmarked for the Eastern Reserves, and
that there was no evidence of significant changes 2005-2014.
Table 8 Fauna Habitat Sites Indices
Trees / Hectare Trees / Hectare Assets
Values Habitat Sites
2005 2014 2005-2014
Live Native Tree 3 Maintained
Medium
No Data (assumed
Very Large Trees Dead Tree2.2.4 Heritage
There are no heritage indices for the Eastern Reserves as there were no heritage sites
listed on:
• The National Heritage List;
• WA Aboriginal Sites Register;
• the WA Heritage Register; or
• the City of Melville’s Municipal Heritage Inventory.
2.2.4 Community Interest
Revegetation sites can be a focus for community interest as these are visible
manifestations of natural area management, and the public is often directly involved their
proposal or implementation. Community interest sites are listed in Table 9 and shown in
Figure 19.
Table 9 Community Interest Sites 2014
George Welby Ron Carroll Tom Firth
Community Interest Sites Total
Park Reserve Park
Local Native Plantings 0.00 ha 0.02 ha 0.00 ha 0.00 ha
Closed Tracks 435 m2 280 m2 65 m2 780 m2
Bird / Bat Boxes 0 0 0 0
Figure 19 Community Interest Sites
Eastern Reserves Strategic Plan page 24Revegetation sites (plantings) are areas in which plantings have been undertaken and are
currently being intensively managed and had not been assessed against the completion
criteria, at which point they stop being treated as revegetation sites. No plantings/closed
tracks in Figure 19 have been assessed against criteria in Table 10.
Table 10 Revegetation Objectives
Revegetation Category Objectives
Establishment of individual • Plants > 5 years old
plants or artificial hollows • Hollows used by target species
• A minimum number of plants or artificial hollows
Rehabilitation • Plants > 5 years old
Reinstating self-sustaining and • Gaps between native plants < 1 m x 1 m
functional ecosystems based on • Weed cover < 25% and bare ground2.3 Species
2.3.1 Native Flora
The Eastern Reserves support 159 native plants, approximately one third of the 434
species recorded in the natural area reserves in the City of Melville. The flora diversity is
53, 141 and 56 native plant species in George Welby Park, Ron Carrol Reserve and Tom
Firth Park respectively.
The flora inventory (which is estimated to include more than 80% of species present) is
included in Table 55 in Appendix 1. The species listed, are characterised in terms of
typical preferred soil conditions (dry, moist and/or wet) as:
• soil moisture is the dominant factor in determining plant distributions across the
Eastern Reserves (with the Banksia attenuata / Banksia menziesii woodlands
being dry sites and the Melaleuca preissiana woodlands being wet);
• there were no detailed reference sites, nor species inventories for vegetation
associations available; and
• the vegetation association boundaries should be used as a guide rather than rigidly
applied in the management of the site, given that the vegetation has been
significantly modified, over the last 60 years.
Plants in the Eastern Reserves are to be managed as meta-populations (disjunct but
nearby stands functioning as a single population due to occasional interbreeding through
dispersal of seed or pollen) not as a series of independent populations:
• nearby populations (within scales of 5-20 km) can contribute to each other’s vigour
through interbreeding for at least for some species (Young, Broadhurst, Byrne,
Coastes, & Yates, 2005); and
• 53% of plants are recorded in at least two of the reserves and 28% of plants are
recorded in all three reserves (and the occurrence of species across multiple sites
is likely to increase with more comprehensive surveys).
As meta-populations:
• consolidation of a plant subpopulation in one of the Eastern Reserves should
contribute to the overall viability of the subpopulations of that species in the other
two reserves.
• a population of a plant species is to be managed as a single asset across the three
reserves, with presence of subpopulations in each reserve monitored.
The indices for plants are listed in Table 12.
Table 12 Plant Indices
Status Status Assets
Values Plants
2005 2014 2005-2014
High Assumed 50 shrubs RC 1 species
Melaleuca thymoides
Population at north/south edge of Present 1 shrub GW Maintained
the natural distribution Appears
Well-represented in Melville Assumed Present 1 species
Beaufortia elegans
reserves Present Moderate Maintained
Numbers
Low 2 trees GW
Banksia attenuata
Well-represented in Melville 9 trees RC
Slender Banksia
reserves, but in low abundance in 17 trees TF
Eastern Reserves 3 trees GW
Banksia ilicifolia Assumed 3 species
11 trees RC
Holly-leaved Banksia Present Maintained
2 trees TF
11 trees GW
Banksia menziesii
110 trees RC
Firewood Banksia
31 trees TF
GW = George Welby Park RC = Ron Carroll Reserve TF = Tom Firth Park
Eastern Reserves Strategic Plan page 26Plants at Moderate Risk of Local Extinction
Banksia trees (Figure 20):
• Banksia ilicifolia, Holly-leaved Banksia:
• is susceptible to dieback; and
• is at significant risk of local extinction in Kings Park due to low abundance
(Crosti, Dixon, Ladd, & Yates, 2007).
• Banksia attenuata, Slender Banksia and Banksia menziesii, Firewood Banksia:
• are both susceptible to dieback;
• have both declined in Kings Park over a 60 year period due to post dispersal
seed predation and seasonal deaths (Crosti, Dixon, Ladd, & Yates, 2007); and
• are both in lower densities in long isolated small urban bushland remnants
(within 30 km of the Perth CBD on Bassendean or Spearwood soils), with high
fire frequencies and declining water tables possibly amongst the contributing
factors (Ramalho, 2012).
Figure 20: Banksia trees Distribution 2014
In comparison to other City of Melville reserves, the number of Banksia menziesii is
relatively high, Banksia attenuata is low, and Banksia ilicifolia is low compared to other
reserves in the Bassendean dunes (the South-Eastern and Bullcreek Reserves) (Table
13).
Table 13: Number of Banksia Trees in City of Melville Reserves
South-Eastern
(24 reserves)
(7 reserves)
(3 reserves)
(7 reserves)
(3 reserves)
(3 reserves)
North-West
(1 reserve)
Heathcote
Estuarine
Bullcreek
Reserves
Reserves
Reserves
Reserves
Reserves
Species
Reserve
Eastern
Total
Banksia attenuata 481 28 22 >26* 98 7 662
Banksia grandis 6 0 5 13 1 0 25
Banksia ilicifolia 129 16 22 1 0 0 168
Banksia littoralis 23 0 0 0 0 0 23
Banksia menziesii 549 152 78 >74* 177 40 1,070
Banksia prionotes 0# 0# 0 0 168 0 168
Total 1,188 196 127 114 444 47 2,116
All trees counted except where * indicates only trees with trunk >30 cm diameter counted
# managed as weeds in these reserves
Eastern Reserves Strategic Plan page 27Melaleuca thymoides (Figure 21):
• is at the northern edge of its recorded distribution on the Swan Coastal Plain in
the City of Melville (with the one record north from 1902 in Claremont in 1902
(DPaW, 2015)) but there are multiple populations in the City of Melville and to the
immediate south Bibra Lake and Yangebup Lake;
• in the City of Melville, is recorded in the Bull Creek Reserves, Douglas Freeman
Reserve, George Welby Park, Ken Hurst Park, Peter Ellis Park, Phillip Jane Park,
Piney Lakes Reserve, Quenda Wetland, Rob Weir Park and Ron Carroll Reserve;
• in Ron Carroll Reserve in 2014, most of the 51 plants confirmed are juvenile
(without any fruit) and most appear to be about 5 years old (having germinated
after the 2010 fire);
• in George Welby Park in 2014, only 1 plant was confirmed;
• prefers sandy soils and generally recorded near the coast, mainly in heathlands
and shrublands but also in woodlands and open forests (Brophy, Craven, &
Doran, 2013);
• can occur in winter-wet depressions (DPaW, 2014);
• resprouts after fire (DPaW, 2015); and
• can be propagated from seed (Wrigley & Fagg, 1993).
Figure 21: Melaleuca thymoides Distribution 2014
Significant Plants Not Mapped
Beaufortia elegans:
• is at the southern edge of its recorded distribution on the Swan Coastal Plain in the
City of Melville, with the three records south being a 2009 record from Bertram
approximately 20 km south, a 1963 record from Thomsons Lake 7 km south, and
1978 and 1996 records from Yangebup Lake 4 km south (DPaW, 2015). The
extent of land clearing in the area reduces the potential for many large populations
to exist south of the Eastern Reserves;
• in the City of Melville, is recorded in the Ken Hurst Park, Piney Lakes Reserve, Rob
Weir Park and Ron Carroll Reserve;
• is susceptible to local extinct from high frequency fires as plants store seeds in
canopy and are killed by 100% fire scorch (Waters A. , 2013);
• requires to be surveyed when in flower to ensure confidence in identifications and
numbers counted;
• occurs on white, grey or yellow sand, often over laterite, and on plains, winter-wet
depressions (DPaW, 2014); and
• is propagated from seed and cutting (Wrigley & Fagg, 1993).
Eastern Reserves Strategic Plan page 28You can also read