The Rescindment of Cash Management in the Swedish Bank Industry
←
→
Page content transcription
If your browser does not render page correctly, please read the page content below
The Rescindment of Cash Management in
the Swedish Bank Industry
- A study of how to maintain the customer satisfaction while
reducing the overall service offer

Johan Sundqvist

Master’s thesis · 30 hec · Advanced level
Agricultural Programme – Economics and Management
Degree thesis No 917 · ISSN 1401-4084
Uppsala 2015
                                  iiii
The Rescindment of Cash Management in the Swedish Bank Industry
 - A study of how to maintain the customer satisfaction while reducing the overall
     service offer

Johan Sundqvist

Supervisor:            Helena Hansson, Swedish University of Agricultural Sciences,
                       Department of Economics

Examiner:              Karin Hakelius, Swedish University of Agricultural Sciences,
                       Department of Economics

Credits: 30 hec
Level: A2E
Course title: Degree Project in Business Administration
Course code: EX0536
Programme/Education: Agricultural Programme – Economics and Management
Faculty: Faculty of Natural Resources and Agricultural Sciences

Place of publication: Uppsala
Year of publication: 2015
Name of Series: Degree project/SLU, Department of Economics
No: 917
ISSN 1401-4084
Online publication: http://stud.epsilon.slu.se

Key words: Customer Satisfaction, Bank, Service

                                    iiii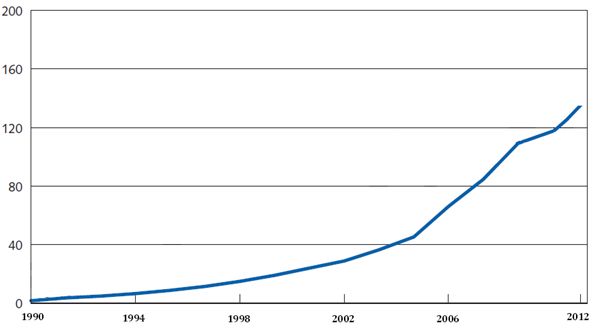
Acknowledgements
I would like to thank Nordea Bank for the co-operation and help they been giving me. With
their openness and valuable input they have been giving me help and guidance to get the best
possible results for my thesis. Thank you to all the offices that helped me with my
questionnaire, especially to Johan Dahl and all of the employees at Nordea in Sandviken that
helped me complete both my focus group, hand out my questionnaires, and told me about
their process in cash rescindment. I would also like to thank Helena Westin and Karin Östman
who have been my contacts and supervisors at Nordea.

I would also like to express my deepest appreciation to Helena Hansson who has been my
supervisor through this thesis and been a great help, giving suggestions and just always being
available when ever I needed help. She has taught me new ways to approach a problem,
analyse data and improve my writing. Last but not least, a thank you to the library that helped
me to get hold of important literature, search for articles, and for providing me with good
article review tools.

                                               iii
Abstract
Sweden is going through big changes within the bank sector. Increasing card usage, decrease
of cash acceptance in the society, an attempt to reduce money laundering, and a possible
increase in profitability has lead to the rescindment of cash management among three of the
four major banks. This has lead to a big debate in the society, a lot of frustration from
customers, and a drop in customer satisfaction for every bank that started the process of
removing cash management.
The purpose of this study is to find out how the banks could keep their customer satisfaction
when removing cash management. When doing the study, the rescindment of cash was a
deduction of a part of the service, compared to the normal adding or starting of a service. The
study was done through a focus group that was the base of a questionnaire that got answered
by 125 respondents. A regression analysis was completed and the answers from it were
thereafter analysed with the theories chosen for this thesis.
The results show that in order to maintain the customer satisfaction after removing cash from
branches, the banks need to focus on five components to compensate and must be proactive
for the rescindment of cash management. The five components affecting customer satisfaction
are Price, Place, Promotion, Participants, and Process. Focusing on these components and
letting the customers be a part of the formation of the new service layup, will give a higher
quality of service. The study also show that components like Product and Physical appearance
are not components that affect the overall customer satisfaction in cases such as this.
The strongest affecting component is Participants, which can be both employees and other
customers being present when the service is being consumed. The employees stand for a
majority of the customer perception of the bank and its service. By moving cash management
from branch to ATM, the customers will experience a new process and less interaction with
the employees.
The study is relevant to companies within the service industry that are taking away parts of
their service but still want to keep their customer satisfaction. Since there are no former
studies within this field this gives indications on what the customer finds important. It also
adds to the overall understanding of customer satisfaction and what affects it within the
service industry. The study opens up the issue for future researchers to dig deeper in order to
see if the five identified components are also adoptable to other service industries or if these
five components are the same for banks in other countries with other set ups.
ivSammanfattning
Sverige går igenom stora förändringar i banksektorn. En ökad kortanvändning, minskad
acceptans för kontanter i samhället, ett försök att minska penningtvätten och en möjlighet till
ökad lönsamhet för företagen har lett till en avveckling av kontanthanteringen på tre av de
fyra största bankerna. Detta har lett till en stor samhällsdebatt, mycket frustration från
kunderna och ett fall i kundnöjdhet för berörda banker.
Denna studie görs för att ta reda på vad banker måste fokusera på för att behålla
kundnöjdheten när de tar bort kontanthanteringen. Denna studie undersöker fenomenet av att
ett företag tar bort en del av en service, istället för det normala då en ny service startas eller en
extra del läggs till. Studien gjordes med hjälp av en fokusgrupp för att ge underlag till ett
frågeformulär. Detta frågeformulär blev sedan besvarat av 125 kunder i banken. En
regressionsanalys gjordes på resultatet av frågeformuläret. Svaren från regressionsanalysen
blev analyserade med hjälp av valda teorier.
För att behålla kundnöjdheten när kontanthanteringen tas bort måste banken fokusera på fem
faktorer. Dessa fem är Pris, Plats, Påverkan, Personer och Process. Genom att fokusera på
dessa faktorer och låta kunderna vara en del av att utforma det nya tillvägagångssättet av den
totala tjänsten så kommer den totala servicen hålla hög kvalitet. Studien visar också att
faktorer som Produkt och Fysiska tillgångar inte är faktorer som påverkar kundnöjdhet i ett
fall som detta.
Den starkaste påverkande faktor är Personer, vilket kan vara på personal och kunder som är
närvarande i servicemomentet. Personalen står för majoriteten av kundens upplevelse av
banken och dess service. Genom att flytta kontanthanteringen från bankkontoren till
uttagsmaskinerna så har processen för kontantuttag ändrats för en del av kunderna och följden
blir mindre interaktion mellan kund och personal på banken.
Studien är relevant för företag inom serviceindustrin som har tagit bort delar av sin service
men som strävar efter lika hög kundnöjdhet. Eftersom det inte finns några tidigare studier
inom detta område ger det indikationer om vad kunderna anser är viktigt vid en sådan här
reform. Arbetet bidrar även till den totala förståelsen av kundnöjdhet och vad som påverkar
det inom serviceindustrin. Studien öppnar upp för ytterligare forskning för att se om de fem
identifierade faktorerna också är anpassade för andra områden inom service industrin. Det går
även undersöka om dessa faktorer är applicerbara i andra länder med andra förhållanden inom
banksektorn.
vTable of Contents
SAMMANFATTNING .........................................................................................................................................V
1 INTRODUCTION .............................................................................................................................................. 1
1.1 PROBLEM BACKGROUND................................................................................................................................ 2
1.2 PROBLEM ....................................................................................................................................................... 4
1.3 AIM AND DELIMITATIONS .............................................................................................................................. 4
2 LITERATURE REVIEW .................................................................................................................................. 6
2.1 DEFINITION OF CUSTOMER SATISFACTION ..................................................................................................... 6
2.2 HOW CUSTOMER SATISFACTION IS BEING MEASURED................................................................................... 8
2.3 FINDINGS IN CUSTOMER SATISFACTION ......................................................................................................... 9
3 THEORETICAL PERSPECTIVE ................................................................................................................. 11
3.1 QUALITY IN NEW SERVICE DEVELOPMENT .................................................................................................. 11
3.1.1 The Service Concept............................................................................................................................. 12
3.1.2 The Service System and the Resource-Structure .................................................................................. 13
3.1.3 The Service Process ............................................................................................................................. 14
3.1.4 Complete Service Development Process .............................................................................................. 14
3.2 THE 4 PS ORIGIN .......................................................................................................................................... 15
3.2.1 The Basic 4 Ps ...................................................................................................................................... 16
3.3 THE 7PS ....................................................................................................................................................... 16
3.3.1 Product ................................................................................................................................................. 17
3.3.2 Price ..................................................................................................................................................... 17
3.3.3 Place .................................................................................................................................................... 17
3.3.4 Promotion............................................................................................................................................. 18
3.3.5 Participants .......................................................................................................................................... 18
3.3.6 Physical Evidence ................................................................................................................................ 18
3.3.7 Process ................................................................................................................................................. 19
3.3.8 The 7P´s Extended Role ....................................................................................................................... 19
4 METHOD ......................................................................................................................................................... 21
4.1 APPROACH ................................................................................................................................................... 21
4.2 QUANTITATIVE RESEARCH APPROACH ........................................................................................................ 22
4.2.1 Focus Group ........................................................................................................................................ 22
4.2.2 Collection of Information ..................................................................................................................... 22
4.2.3 Questionnaire Group and Sample Selection ........................................................................................ 22
4.2.4 Procedure ............................................................................................................................................. 23
4.2.5 The Questionnaire ................................................................................................................................ 23
4.2.6 The Analysis of the Questionnaire ....................................................................................................... 24
5 RESULTS ......................................................................................................................................................... 25
5.1 QUESTIONNAIRE........................................................................................................................................... 25
5.1.1 Statement Measurements ...................................................................................................................... 25
5.1.2 Affecting Satisfaction Components....................................................................................................... 26
6. DISCUSSION .................................................................................................................................................. 28
6.1 THE PRODUCT .............................................................................................................................................. 28
6.2 THE PRICE .................................................................................................................................................... 29
6.3 THE PLACE ................................................................................................................................................... 29
6.4 THE PROMOTION .......................................................................................................................................... 30
6.5 THE PARTICIPANTS ...................................................................................................................................... 31
6.6 THE PHYSICAL EVIDENCE............................................................................................................................. 32
6.7 THE PROCESS ............................................................................................................................................... 32
7 CONCLUSIONS .............................................................................................................................................. 34
viBIBLIOGRAPHY ............................................................................................................................................... 36
Literature and publications .......................................................................................................................... 36
Internet ......................................................................................................................................................... 39
APPENDIX 1 – QUESTIONNAIRE ................................................................................................................. 41
viiviii
1 Introduction
The following chapter will discuss the background of the bank industry as well as where it is
headed and why it is heading that way. The chapter includes an introduction, background to
the problem, and the problem formulation, as well as the aim and the delimitation of the
study.

A banks main purpose is to store money and then lend out the same money in exchange for an
interest rate to other interested parties. This business has been traced far back in history, all
the way back to the renaissance (Hildreth, 1837). The banking system started in cities with
big wealth. Citizens needed to store their excess wealth, usually in the form of gold,
somewhere to make sure that it was kept safe. The safest place, at the beginning of banking,
was usually at ironsmiths or ironworkers, since they made iron gates that were strong enough
to keep intruders out. Whenever someone needed to withdraw any funds, they brought with
them the receipt that they were given when they initially deposited the funds with the
ironsmith. This later developed into modern day banking, where people deposit their salary or
saved up wealth. In modern day banking, the reasons for keeping the money at the bank is far
more than to keep it safe, even though that is still one of the arguments for depositing money.
Today keeping money at the bank gives interest, investment opportunities and it increases the
accessibility to the cash through bank cards.

The modernisation within banks and the way they are operating have been getting more and
more advanced over the last centuries. New products, ways of working, organisational
structures and changes in behavioural patterns have been the result of the technical advances
within the IT sector (Nordea, 2012). The banks’ focus of simply storing money in order to
lend it out has steadily decreased. Instead they use new possibilities of investing. Banks can
offer their customers a wide variety of complex and differentiated products. These products
demand a digital set up in order to keep the transaction cost low and for the investment to be
monitored. Just as investments are handled digitally, loans are handled the same way. Loans
are just as important for today’s society as the possibility of investing money. The payment
gets digitally deposited into an account without any sort of transportation in monetary cash.
The money is just transferred around instead of being fysically withdrawn and deposited.

According to Bergman, Guibourg & Segendorf (2008), the banks need to follow technological
advancements in order to increase profitability as well as to stay competitive. The crash in
2008 once again showed how fragile the market is and effects of it can still be seen in today’s
economy. To prevent future crashes and to create a more stable banking sector, Basel III was
introduced. The goal of Basel III is to lower the overall risk through three major aspects. It is
through increasing the safety barrier in common equity compared to loans, reducing or
slowing down the increasing balance sheets in banks through leverage ratios, and increasing
the pressure on passing a stress test on the liquidity (Slovik, 2012). All of these new goals will
lead to a lowering of the overall profit for banks.

                                                1
Due to these new goals in Basel III and the crisis in Europe, banks need to increase their
profitability as well as increase their stability. This forces banks to find ways to improve
today’s management of businesses, including their cash management.
1.1 Problem Background
Late in September 2012 the institute “Swedish Quality Index” published a report that shows a
big decrease for three out of four big banks in terms of customer satisfaction (Kvalitetsindex,
2012). According to the report, the biggest reason for the decrease in satisfaction comes from
the rescindment of cash service at branches. In a scale from 0-100 where the higher the
number the more positive the customer’s attitude to the bank, Nordea dropped from its
highest average number 71.3 in 2010 to 66.4 in 2012.
A big cost for banks in general is the service of having branches that offer the possibility of
withdrawing cash from a teller (Sveriges riksbank, 2008). The service costs a lot because of
the cash management problem. The security that is needed for the cash itself, the delivery and
collection of the cash, the equipment that is needed to handle the cash, and the need to have
people working with the deposits and withdrawals are all big cost drivers. This service lost a
lot of its value when ATMs were introduced and customers switched to using cards (Sveriges
riksbank, 2004). It was however, still a service that was a “must have” service for banks up
until the last nine years, when online banking started to grow rapidly. According to Statistics
Sweden (2011), the usage of online banking has gone from 38% to 84% during those last nine
years.
With the possibility of handling many transactions online, a big customer group moved their
business there. The result of an increased usage of banks’ online service ended up with a
decreased need for branches managing cash (Sveriges riksbank, 2008). With the online
service, customers just transferred money and used their card instead of going to a bank for
withdrawals. The usage of bank cards and ATMS has grown, as seen on figure 1, and a lot of
the banks have centralized to one or a few branches managing cash in every city.
2Figure 1. The number of card transactions per capita per year in Sweden between 1990-2012. Source: Bergman et al., (2008); own
modification.
The usage of cash in Sweden is still steadily decreasing every year (Daltung & Ericson,
2004). As seen on figure 1, the usage of cards will continue to increase (Bergman et al, 2008).
The usage of cash is at such a low level that the cost of handling cash has reached such a point
where the banks have to look for new solutions. The cost and time involved in cash
management is not paying off and a lot of the bigger banks in Sweden are phasing out the
service (Pers com. Östman). Smaller competitors meanwhile, are gaining ground in cash
services to customers.
One of the solutions is a system of co-operation between some of the bigger organisations
with smaller upcoming banks that focus on cash management. An example is Nordeas and
Swedbanks where costumers are allowed to withdraw and deposit money in exchange
branches. Exchange is thereby gaining an economy of scale, which means that it profits from
handling cash because they can divide the fixed cost on the big amount of products. Because
of exchange business model Nordea and Swedbank are able to give their customers the
service of cash management.
The outsourcing of cash management is leading to a small number of customers wanting to
withdraw cash from branches. With a smaller customer base, that is declining every year,
most of the bigger banks have started the process of going cashless. Swedbank is the bank
that has got furthest in their process of becoming a cashless bank: they have closed down in a
lot of cities and are planning to keep this trend going (DN, 2013). Nordea is also heading in
the same direction but has not got as far. Nordea have only closed down branches in smaller
cities, and have not yet done so in a bigger city.
31.2 Problem
By closing down cash management operations in branch, the structure and focus of
organizations will be different and more clear. The goal is to have a stronger focus on
meetings with the customers than before the rescindment of cash management. By removing
cash management, Nordea will be able to focus more on their core competences, the
outsourcing branches, and ATMs will handle the cash distribution to the Nordea customers.
All the banks that have been closing down cash management operations have been receiving a
lot of negative publicity, and customers have been switching banks. This is a problem that
damaging companies as well as leading to a loss of profit. Nordea needs to have a clear
template on what affects the customers’ view of the bank and what to focus on in order to
keep the customers, while they remove their cash management operations in the bigger cities.
This leads to the question that is the focus of this thesis.
How does a bank keep their customer satisfaction while removing the cash management?
1.3 Aim and Delimitations
The aim of this study is to determine what components are important to focus on in order to
maintain high customer satisfaction during the rescindment of cash. The rescindment of cash
has already been done in some regions and banks, but there are other regions and cities that
have branches with cash management.
In order to increase the knowledge of what to focus on during the rescindment of cash
management this study was made. The study also shows what affects costumers´ satisfaction
in processes such as the one discussed above. It can also help in other cases of a deduction of
service, when a company decides to change its service concept as well as to add a service.
This study is of interest not only for the bank Nordea, but also for stockholders to see how the
bank works to improve its customer satisfaction. Customers are another group that will find
this study of interest in order to see that the bank is actually trying to improve. The reaction of
the study among the participants has been positive because the customers see the study as an
attempt to improve Nordea´s service to the customers. This study is also of interest for the
competitors to some extent, by having the above hypothesis proved.
The research has been done in cooperation with Nordea Bank. The goal is to better understand
what to focus on during the rescindment of cash management in order to maintain higher
customer satisfaction. The reason this is being studied is because of the on-going process of
removing cash management from many of the bigger banks in Sweden and across
Scandinavia. The question of whether the cash management should be removed or not will
4not be a part of this study since the decision has already been made and the process is in full
motion.
The study is based on information from Nordea customers and Nordeas set up and might
therefore limit itself to Nordea Bank and its customers. Due to this, there is a possibility that
the results and recommendations might not fit other banks as well as they will for Nordea
because of the difference in the process of taking away the cash management.
52 Literature Review
The following chapter will present earlier findings in the research of customer satisfaction.
The different definitions of customer satisfaction will be presented,along with the most
common ways to measure it, and the findings in what affects customer satisfaction.
2.1 Definition of Customer Satisfaction
The definition of customer satisfaction is flexible and there is no cross-field definition. It
fluctuates depending on the field of study (Anderson et al, 1997). There are two major ways
of looking at customer satisfaction. They are called transaction specific satisfaction (Jones &
Suh, 2000) and cumulative satisfaction (Danaher & Mattson, 1994). In this paper the best one
to use is the cumulative satisfaction because of the long relations between customer and bank.
Business between the customer and the bank is also based a lot on trust and therefore a long-
term relationship is crucial for a good business relationship.
Depending on whether the research is being done on a short-term basis or long-term basis
between the customer and the company, the definitions vary. With a short-term basis to the
customer, the definition focuses on the exact moment of purchase being made. According to
Carlson and O’Cass (2010) customer satisfaction is “a summary of affective reactions to a
service incident”. The definition from Woodruff and Schumann (1993) also supports a short-
term aspect by stating “satisfaction is an immediate reaction to how much value is received
from using the product in specific use situations”. With these statements the focus is on the
present and does not take the future in to consideration. Transaction specific satisfaction
focuses on one single transaction at one point in time (Gustafsson et al, 1997).
The figure below shows the disconfirmation model that is used to describe transaction
specific satisfaction. The model shows the difference between the performance of a service
compared to the expectations of the service that are being provided.
If the customer expects the service to be greater than it actually is, the result will be negative
in satisfaction. If the service itself is greater than what the customer was expecting the overall
satisfaction will be positive and high. Therefore expectations can both disconfirm customer
satisfaction both positively and negatively (Caruna, 2002).
Figure 2. The relationship between performance, expectations and customer satisfaction in the disconfirmation model. Source: Waligóra &
Waligóra, (2007); own modification.
6A relationship between a bank and its customer generally stretches over a time period of
several years. The definition of satisfaction in transaction specific satisfaction does not
therefore cover all the aspects of satisfaction needed in order to get a good foundation when
measuring customer satisfaction at a bank. In order to measure the satisfaction over this time
period a definition that includes the long-term aspect is more appropriate.
A way to encompass the time aspect in the definition of customer satisfaction is to look at a
long-term perspective definition. By not looking at the single transaction but to the overall
picture of the company or service, the view shows cumulative satisfaction Anderson et al.
(1997) states that customer satisfaction leads to customer loyalty. It is also stated that the
increased loyalty secures long-term revenue, which indicates a long-term relationship between
company and customer. The cumulative satisfaction focuses on the customers’ gathered
opinion after several experiences. The cumulative way of measuring satisfaction is looked at
as a long-term focus that measures the customers’ satisfaction, pre and post-purchase in the
long run (Fu & Mount, 2007). Fu and Mount (2007) also state that the gathered experience
and attitude towards a company weigh heavier than the last encounter.
Below is the performance model that has a cumulative approach to satisfaction. The
performance model looks at performance and expectations differently (Waligóra & Wailgóra,
2007). The performance is viewed more as an image of the service and is based on either
personal experiences or on word of mouth. The expectations cannot have a negative influence
on satisfaction; the stronger they are the more positive an effect they have on the perceived
performance.
Figure 3. The relationship between expectations, performance and customer satisfaction in the performance model. Source: Waligóra &
Waligóra, (2007); own modification.
Both measures are each better suited to certain industries and businesses. The transaction
specific definition of satisfaction would only be adaptable to this case if the single transaction
were so bad that it led to that the customer taking their business away from the bank. Within
the banking sector, due to their long relationships with the customers, a cumulative definition
is therefore going to be used in this thesis. Due to the decision to have a cumulative definition
7of customer satisfaction, the definition used by Giese and Cote (2000) is going to be used in
this thesis.
“A summary affective response of varying intensity, with a time-specific point of
determination and limited duration, directed toward focal aspects of product
acquisition and/or consumption.”
2.2 How Customer Satisfaction is Being Measured
The research within the field of service marketing is vast and has been studied for a long time
(Grönroos, 2006). Depending on what is being measured the method of measuring satisfaction
differs; looking at the goods market, satisfaction with a product can be measured through
malfunctions, durability or product returns. Looking at the service industry however, it is
harder to identify a hard fact to measure (Parasurman et al, 1988).
There are different national units for measuring customer satisfaction and the first country in
the world to start measuring its customer satisfaction nationally was Sweden. Itb was founded
by Claes Fornell in 1989.
Figure 4. Swedish customer satisfaction index, the interaction between the factors. Source: Waligóra & Waligóra, (2007); own modification.
The Customer Satisfaction Index by Fornell has later been developed into a similar customer
satisfaction index structured with extra units of measures and effects. Figure 4 shows what is
being measured and what is affecting what but in order to get answers from these categories a
survey still needs to be done. The idea is that customer loyalty is the end result of the model
above and is gained through customer satisfaction. The customer satisfaction is measured
through perceived performance and customer experience. The customer satisfaction thereafter
leads to either loyalty if the customer is satisfied or to customer complaints if the customer is
dissatisfied. If the company handle the complaints well the complaints result in customer
loyalty because of good handling.
8The most common way to measure customer satisfaction is by using surveys and
questionnaires. To get to the point of a good questionnaire, a lot of pre-work is done in order
to ensure the questionnaire is representative and that it can be generalized (Chan & Chan,
2011). This can take the form of in-depth interviews, pilot tests, analysis of earlier findings,
etc. The work that is done in advance of the questionnaire is done to produce a better
questionnaire that captures the measured group’s point of view. The items in the questionnaire
are usually rated with a Likert scale ranging in different parts of the scale (Ko & Chiu, 2008;
Chan & Chan, 2011; Carlson & O’Cass, 2010).
Depending on what is being measured the tool of analysis differs. When comparing the results
a T-test can be used which helps to test a hypothesis where it is possible to compare the
differences between two normally distributed sets of groups. Another way is to do a
regression analysis, which measures the relationship between variables. With a regression
analysis it is possible to see how one variable affects another (Fu & Mount, 2007). The
regression analysis is more frequently used when measuring satisfaction and will therefore be
used in this study.
According to Bouckaert & Van de Walle (2003) service satisfaction is hard to measure and
very specific. The reason why it is so hard to measure is because satisfaction differs from
customer to customer, while product satisfaction can be partly be measured by looking at
whether the product is either working or not. The measure of satisfaction does not have an
international measure. Without an international measure the same research can have different
results, depending upon the satisfaction definition.
2.3 Findings in Customer Satisfaction
Customer satisfaction is widely studied, in different forms and in different scenarios. There
are studies like Mithas, Krishnan, and Fornell (2005) about customer relationship
management where it is shown that an increase of customer knowledge boosts the customer
satisfaction, or studies about the relationship between customer satisfaction and brand
attitudes (Ko & Chiu, 2008).
Figure 5. Customer satisfactions mediating role in the studies about customer satisfaction. Source: own modification.
9Studies into customer satisfaction show that customer satisfaction works as a centre point that
gets affected by a change in service or a change in perception of the customer. Depending on
whether this is positive or negative, it affects parts of the company in a positive or negative
way. Looking at the picture above, customer satisfaction is not just something that affects the
customers but the company as well.
Customer satisfaction has been connected with elements like brand value, corporate
reputation, and image. These elements are closely related and are all affecting the customer
satisfaction in their own way. A study carried out by Caruana (2002) looks into how service
quality affects service loyalty through customer satisfaction Caruna (2002) sent out a
questionnaire to 1,000 people and then carried out a regression analysis on the answers. The
findings showed that customer satisfaction was a key factor in mediating between service
quality and service loyalty. The service quality was affecting customer satisfaction to 53% of
the variance. The suggestion from Caruna (2002) is that the managers should focus on
customer satisfaction but have in mind that service quality is an important antecedent.
A study carried out by Ko and Chiu (2008) confirms Caruna’s statement that good service is
the prime-affecting factor in terms of customer satisfaction. Good service refers to relaxed
and friendly attitudes, and this contradicts Caruna’s finding that service quality was the
prime-affecting factor. Ko and Chiu did though mention service quality as a big affecting
factor on customer satisfaction Ko and Chiu (2008) also identified customer satisfaction as
having a big influence on brand attitude. The brand image is the strongest factor that affects
the brand attitude. Customer satisfaction works as a mediator, just like it did in Caruna’s
study but this time between brand attitude and revisiting behaviour.
Customer satisfaction is also affected by staff satisfaction, which leads to increased financial
profit (Maddern et al, 2007). There is also proof that both staff satisfaction and customer
satisfaction have a correlation with a higher result and market value in the long run (Edmans,
2011)(Anderson et al, 1994). The importance of achieving enough technical service quality is
also an important factor in order to achieve customer satisfaction. Maddern, Maull, Smart and
Baker (2007) also stated that this is more important than friendly and well informed personnel
in order to attain high customer satisfaction.
Looking at earlier studies shows that customer satisfaction is an important factor and
companies should strive as much as possible to increase the chances of having a successful
company. Fu and Mount (2007) did a study on the effects of losing cumulative customer
satisfaction and the possibility of recovering it through improvement. Their findings were that
it is possible to recover parts of the lost cumulative customer satisfaction, but in all four cases
examined no one reached their former satisfaction level.
103 Theoretical Perspective
This chapter will go through the relative theories about customer satisfaction in the service
industry. The theories that are out of interest are quality in new service development and the
marketing mixes 7Ps for the service industry.
The theory will be used to compare with the result of the study. The quality in new service
development has a focus on how to get a service correct. The focus is on the process of
starting and maintaining a service in high quality. The focus is also very customer centralized
and the most of the approaches is put on how to form the service after what the customers
want.
Looking at the 7 Ps they are also focusing on what is needed to get a good service concept.
With a combination of the 7 Ps, the marketing mixes goal is to reach a good service and
customer satisfaction. The focus on the 7 Ps is partly focused on the customer but also at the
company’s own ability and limitations. The importance and goal of i.e. brand image,
discounts, and physical appearance is brought into the model.
According to each other writer, the other writers models does not cover all the important
factors in order to reach a high customer satisfaction and a good service. The 7 Ps have added
parts like image, discounts and so on but these factors are not a part of the goal of quality in
new service development. Looking at the 7 Ps, the model does not consider the time used to
adopt its recommendations and strategies. Since it is proven that it is hard to get customer
satisfaction back after losing it (Fu & Mount, 2007), even if the company compensate the
customer for the bad experience, the company will still not be able to recover the customer
satisfaction to the same former level. These two theories will therefore complete each other
and using both it will result in a better coverage in discussion and explanation of the findings.
3.1 Quality in New Service Development
When a service is being formed there are a lot of different approaches to shape it to the
customer. To have the customer as a part of the entire process of coming up with through to
executing a service is of key importance (Edvardsson, 1997). When a customer gets service
from the company, what matters is the perceived quality of the service. The customer’s
experience of the service is what makes it a good or a bad service (Brady &Cronin, 2001).
In order to make a service as good as possible, the company needs to focus on quality from
the start. It starts with the company having an idea and it ends at market introduction. The
service should include prerequisites that result in long-term profitability for the company with
the customers (Edvardsson, 1997). In order to make the service development as high quality
as possible, it needs to have prerequisites that make the service attractive to the customer.
Since the service quality is dependent upon the service process and the customer is judging
the service process, a customer focus should be a central point of the service development
(Kelley et al, 1990).
When creating the service, it needs to give the customer opportunities when taking part of the
service to reach the desired or correct outcome. By having the customer evaluate the success
of the service, what the customer does not see or experience of the service does not contribute
11to customer satisfaction (Kelley et al, 1990). The service needs to fit the customer´s
expectations and every new part of the service needs to contribute to the total outcome for the
customer. When building up the expectations of the customers, the marketers often build
expectations too high, which leads to the total outcome of the service not being able to match
the expectations (Cardozo, 1965).
There are three different stages in a development of a new service. In order to get a high
quality service the focus must be on this from the very beginning. The main focus on how to
achieve a high quality service is therefore achieved by making sure that the prerequisites are
formed properly.
The prerequisites are “described in a model with three main concepts” (Edvardsson 1997 p.
35.):
- The service concept
- The service system (resource structure)
- Service process
The correct prerequisites are the goal, in order to reach a long-term quality of service. The
customers, the feedback from their earlier experiences, and the experience in the customer
process shape the prerequisites.
3.1.1 The Service Concept
The service concept is focused on what the customer wants and how to fulfil their needs
(Edvardsson, 1997). A detailed description is given of what the customers want and of what
the customers’ needs and wishes are. All of these needs and wishes are thereafter embedded
into the plan for the company as to how to fulfil these requirements. With this information
they thereafter form a plan on what to offer.
With the knowledge of the customers’ needs, the service is thereby shaped. The service
concepts are decided as to what they should consist of and what they should not consist of.
The customers’ wants and needs are divided into primary needs and secondary needs
(McDougall & Levesque, 2000). These needs are thereafter matched with the service core
offer and supporting offers around the core service as shown in the figure 6.
Figure 6. A model of the service concept and what needs matches the offered service. Source: Edvardsson, (1997); own modification.
123.1.2 The Service System and the Resource-Structure
The service system consists of the resources available in order to bring about the service
concept. These resources are divided into subsystems that need to function by themselves, but
at the same time all together as one big system. The service systems subsystems can be
divided in to four categories:
- Management and staff
- Customers
- Physical/Technical resources
- Organisation structure and system
The employees of a service company are one of the strongest affecting factors of the customer
perception of the company (George, 1990). Based on this, the employees should be looked at
as a part of the service instead of being looked at as a resource. The employees help the
customers’ experience of the service to become more tangible than it would be without the
interaction with such employees. In order to have high performing staff, the service company
needs to have jobs that give the employees motivation and enjoyment. This is achieved
through having good relationships between co-workers and supervisors, as well as a high
work satisfaction. Systematic recruitment and training should be adopted in order to get the
best possible result in achieving high service for the customers through the employees.
Figure 7. Resource categories in the service system. Source: Edvardsson, (1997); own modification.
According to Cermak and File (1994), the customer is part of the process because of the way
they interact with the company and its service. The knowledge of the customer together with
the ability to assimilate information and the equipment that is used by the customer, is what
shapes the service (Alam & Perry, 2002). By being part of the process, the customer does not
simply take part in it but also adds to the process itself. Due to this interaction and service
added by the customer, the technical aspects like computers and systems need to be developed
so they are customer friendly The physical and technical aspects should be driven from a
business perspective but the design should be customer focused.
The four subsystems are partly interactive with the customer and work partly as a back office
service, which is invisible to the customer. Figure 7 shows the line of visibility that acts as the
border that determines which parts of the process the customer is allowed to see. The line of
13visibility is good for defining which parts are okay for the customer to see, in order for them
to get a better experience of service quality. The line of visibility is how much of the service
process the customer can see, for example how much of the cash management process the
customer can see at the bank. If the customer can see the bank employee count the money,
and there end up being a difference between the claimed amount and the counted amount
from the employee. If this is the case, then the line of visibility is not correctly drawn.
3.1.3 The Service Process
The service process is the activity, or several activities, that must function in order for the
service to work. According to Edvardsson (1997) these different activities are problematic to
varying degrees and the ones that are more problematic need to be focused on, in order to
make sure that a customer process is being performed to the right quality. By looking at figure
8 the different processes are identified that need to be considered before setting up the
routines. There are two processes that are the most interesting in the process of services:
customer process and service process. The difference between customer process and the
service process is that the service process is a model of how customer process should be
enacted. When a customer first takes part in a process, is when the service process is
activated.
Figure 8. The service process, from supplier to customer. Source: Edvardsson, (1997); own modification.
The service process has a static system but when activated it is a dynamic process. With this
dynamic process the system sets the limits and depending on what the customer wants, the
process should be able to adapt where possible. With the service process being activated by
the customer, the line of visibility is important.
3.1.4 Complete Service Development Process
The three service focused subjects above form the foundation for the prerequisites. Every new
idea is analysed through these three subjects and compared with one another both financially
and in terms of feasibility. The evaluation of an idea should have an approach of adding value
to the customer, which with a long-term perspective will lead to an increased profit for the
company.
14Figure 9. The service development, prerequisites for the customer outcome and customer process. Source: Edvardsson, (1997); own
modification.
When analysing a service idea an external analysis is done through customer analysis,
competitor analysis and institutional analysis. According to Campell and Cunningham (1983),
the customer analysis should look at the possibility to fulfil the customer´s needs and
expectations. The competitor analysis should identify which companies are competitors and
find their strengths and weaknesses (Piercy & Giles, 1989). The institutional analysis should
focus on legal requirements, regulations, and the political climate (Edvardsson, 1997). After
the external analysis, the internal strength and weaknesses are identified and the resources are
used to adapt the idea to the external analysis as much as possible. When the analysis is done
the formulation of the idea should thereafter be done according to figure 9, with a high quality
foundation which will hopefully lead to an increasing quality in the rest of the process.
The goal of total quality throughout the entire process is of key importance in the process of
new service creation. As seen on figure 9 the service concept, service system and service
process are the foundation to getting good prerequisites. Given this goal, the company needs
to keep in mind that what matters is not the quality experienced from within but the quality
experienced outwardly by the customer. The process is supposed to fit both the customer as
well as the company but with a focus on the customer as the main starting point.
3.2 The 4 Ps Origin
The 7Ps have their origin from what today is known as Kotlers 4Ps. The 4Ps stands for
Product, Price, Place, and Promotion (Kotler, P. & Armstrong, G., 2010). The 4Ps originated
from McCarthy (1960), who melted down an earlier set of twelve elements in the marketing
mix to today’s 4Ps. The 4Ps that are today´s definition of the marketing mix, had their major
breakthrough because of Kotler making them famous.
153.2.1 The Basic 4 Ps
The 4Ps are a grouping of components that are supposed to affect the complete offering of a
product/service. By making a change in any of these Ps, you change the offer and give the
customer a different experience; this should also lead to a new positioning on the market for
the customers (Bradley, 2007). The 4Ps are not just about the Product, Price, Place, and
Promotion; every category has its own sub-mix itself. Due to this, there is a product mix, a
promotion mix and so on (Rafiq & Ahmed, 1995).
The 4Ps are known for their simplicity and coverage but there has been a lot of critique of
their simplicity as they, doesn’t work as well in specific cases (Rafiq & Ahmed, 1995). There
have been several suggestions of extra components to add to the marketing mix, such as
packaging or public relations (Nickels and Jolson, 1976; Rafiq & Ahmed, 1995). There has
even been as many as 7Ps added to the original 4Ps in order to fill the gaps experienced by
other researchers (Blamer & Greysner, 2006). According to Magrath (1986), the 4Ps are not
enough though when doing service marketing.
3.3 The 7Ps
The most popular alternative framework for the service industry is Booms and Bitner’s 7Ps
(Rafiq & Ahmed, 1995). They identified the following three extra Ps: Participants, Physical
evidence, and Process (Booms & Bitner, 1981).
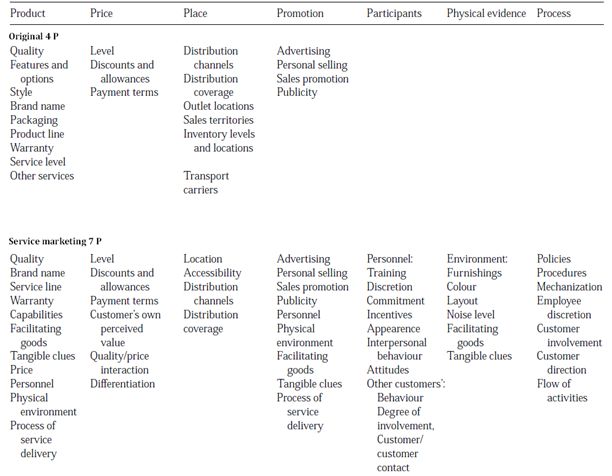
Table 1. The marketing mix in the original and the service adapted version. Source: Rafiq & Pervaiz, (1995); Own modification.
16Looking at table one there are three extra Ps but there is also a change to the original 4 Ps in
order to fit the service sector. The service marketing mix still has common elements with the
goods marketing mix; the change was made to cover the challenges of marketing a service.
The 7 Ps are described below.
3.3.1 Product
A service is a packaged deal for a customer that gets produced in front of the customer. It is
intangible and always needs to be consumed straight away (Booms, & Bitner, 1981). When
marketing a service the original factors that need to be taken in to consideration are still
important, but factors like quality inputs, features and brand name need to be added into the
concept of product (Grönroos, 1993). This leads to the following hypothesis,
H1: Customer satisfaction for a bank is affected by the element of the service marketing mix
component called product.
3.3.2 Price
The price is an indicating component for both product and service (Lichtenstien et al, 1988).
In product marketing the customer can usually feel, try and look at the product before trying
it. When looking at the service industry however, the customer can only look at this indicator
and go on previous experience. According to Anderson (1996), customer satisfaction is
affected by the price but he could also identify that when customer satisfaction increased by
1%, the price elasticity increases by 0.6%. This results in the following hypothesis:
H2: Customer satisfaction for a bank is affected by the element of the service marketing mix
component called price.
The company giving the service therefore needs to be aware of the effects of price
manipulation. The basic idea of how price affects the customers is, the higher the price the
higher the expectations of the service. The company needs to be aware of therefore, who its
customers are and what benefits and earnings the customers experience from the service.
3.3.3 Place
In order to distribute the service to the customers, the location of the company needs to be
highly accessible and this is a prime factor when deciding upon a location. According to
Hankinsson (2001), location has been proven to also have a branding effect for companies.
Looking at the product marketing mix, the goal is usually to have a location where an
economy of scale can be achieved (Booms & Bitner, 1981). From the earlier studies this
hypothesis was derived:
H3: Customer satisfaction for a bank is affected by the element of the service marketing mix
component called place.
Another goal of the location is that it should be convenient for the workers, whilst also being
convenient for the customers in the service marketing mix.
173.3.4 Promotion
Due to the intangibility of service, service promotion has more variables to consider than the
promotion of normal goods (Grönroos, 2006). Fundamentally, just like goods promotion, the
service promotion has factors like publicity, advertising, sales promotion and so on. The
difficult part in service promotion is deciding which message they should send to the
customer. With an intangible product and with benefits that are seen first after the service is
carried out, the message that is promoted is of high importance. According to Berry (1995due
to higher involvement of employees of the company, the service differs and this is also
something that needs to be taken into the consideration when promoting the service. Since the
service is delivered to the customer at the exact moment the customer visits the company,
factors such as the noise level, sign design, the name, interior, appearance of staff and so on,
affect the customer’s perception on the level of quality of service that the company can
provide. This results in the following hypothesis:
H4: Customer satisfaction for a bank is affected by the element of the service marketing mix
component called promotion.
3.3.5 Participants
The participants are looking at how the personnel behave, how they are trained and how they
work in several aspects. This is because the service industry consists of large interaction
between customer and service supplier. The employee itself has a key position in affecting the
customer perception of the quality of the product (Bitner, 1990). Since the product is also a
service the employee is a part of the product. Bad service from an employee directly affects
the product’s quality and it is therefore important to make sure the employee does not vary
too much in performance, since that would result in a unreliable varied quality. From this the
following hypothesis can be derived:
H5: Customer satisfaction for a bank is affected by the element of the service marketing mix
component called participants.
In addition to the employees, customers also usually affect other customers in high contact
services (Booms & Bitner, 1981). The service provider therefore needs to manage the
interaction between customers as well. For example, if some customers were to be loud or
offensive to other guests at a restaurant, they would affect the experience of the meal and thus
should not be allowed to disturb people eating. The interaction between customers therefore
needs to be controlled and analysed
3.3.6 Physical Evidence
Physical evidence refers to the environment the service is being offered in. The more service
intense the product is, the more physical evidence is needed to reinforce good service (Booms
& Bitner, 1981). Investment services are an example of a service that is highly service
focused and the result of the investment itself will not be able to be measured for several
years. The décor, furnishing, and meeting rooms etc. therefore affect the customer´s
instrumental assessment. This leads to the sixth hypothesis:
18You can also read