Reading Traces: Scalable Exploration in Elastic Visualizations of Cultural Heritage Data - Marian Dörk
←
→
Page content transcription
If your browser does not render page correctly, please read the page content below
This is the accepted version of the following article: "Bludau, M.J., Brüggemann, V., Busch, A., & Dörk, M. (2020). Reading Traces: Scalable Exploration in Elastic Visualizations of Cultural Heritage Data. In Computer
 Graphics Forum (Vol. 39, No. 3)", which will be published in final form at http://onlinelibrary.wiley.com. This article may be used for non-commercial purposes in accordance with the Wiley Self-Archiving Policy.

            Eurographics Conference on Visualization (EuroVis) 2020                                                                                                       Volume 39 (2020), Number 3
            M. Gleicher, T. Landesberger von Antburg, and I. Viola
            (Guest Editors)

                                            Reading Traces: Scalable Exploration
                                      in Elastic Visualizations of Cultural Heritage Data

                                                              M.-J. Bludau1          , V. Brüggemann1            , A. Busch2         , and M. Dörk1
                                                                        1   UCLAB, University of Applied Sciences Potsdam, Germany
                                                                         2  Theodor-Fontane-Archiv, University of Potsdam, Germany

            Figure 1: Reading Traces is a visualization of the reference library of Theodor Fontane. The “distribution mode” (left) represents the
            frequency of reading traces along the linear reading order of the books, and the “similarity mode” (right) arranges books and authors based
            on similarity measures. Both modes offer the possibility to navigate between granularity levels (top down and reverse).

                      Abstract
                      Through a design study, we develop an approach to data exploration that utilizes elastic visualizations designed to support
                      varying degrees of detail and abstraction. Examining the notions of scalability and elasticity in interactive visualizations, we
                      introduce a visualization of personal reading traces such as marginalia or markings inside the reference library of German re-
                      alist author Theodor Fontane. To explore such a rich and extensive collection, meaningful visual forms of abstraction and detail
                      are as important as the transitions between those states. Following a growing research interest in the role of fluid interactivity
                      and animations between views, we are particularly interested in the potential of carefully designed transitions and consistent
                      representations across scales. The resulting prototype addresses humanistic research questions about the interplay of distant
                      and close reading with visualization research on continuous navigation along several granularity levels, using scrolling as one
                      of the main interaction mechanisms. In addition to presenting the design process and resulting prototype, we present findings
                      from a qualitative evaluation of the tool, which suggest that bridging between distant and close views can enhance exploration,
                      but that transitions between views need to be crafted very carefully to facilitate comprehension.
                      CCS Concepts
                      • Human-centered computing → Information visualization;

             c 2020 The Author(s)
            Computer Graphics Forum c 2020 The Eurographics Association and John
            Wiley & Sons Ltd. Published by John Wiley & Sons Ltd.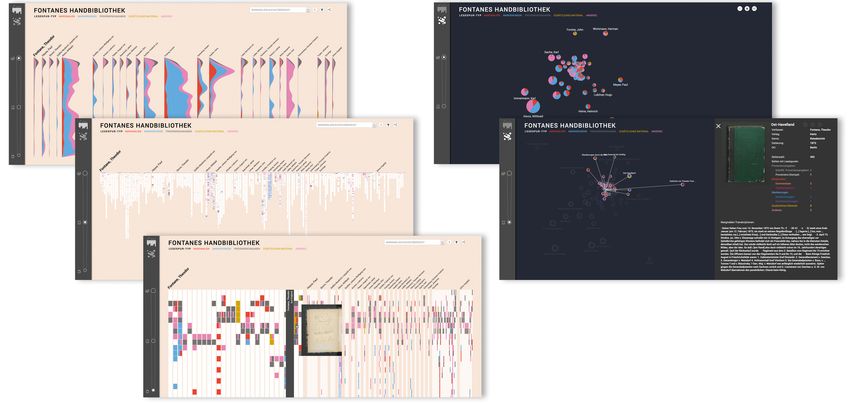
M.-J. Bludau et al. / Reading Traces: Scalable Exploration in Elastic Visualizations of Cultural Heritage Data

1. Introduction
Since the emergence of digital methods in the humanities, there
has been an ongoing debate about the appropriateness and useful-
ness of quantitative techniques such as distant reading compared
to hermeneutic, qualitative approaches [Dru11, Mor13, MLCM15,
HFM15]. While qualitative approaches deal with phenomena on
an individual level and therefore demand a close view on objects,
quantitative methods à la distant reading are used to discern broader
patterns inside a larger corpus through statistical metrics and com-
putational means. Overview visualizations for cultural collections
are becoming as common as detail views of their corresponding ob-
jects, and the combination of these two modes has already proved
valuable for the exploration of cultural heritage data [WFS∗ 19].
Meanwhile, a considerate combination of quantitative and qualita-               Figure 2: Reading traces by Fontane in the form of marginalia and
tive methods is increasing as well [HFM15, JFCS15].                             markings in a book from his reference library.
   While there has been prior work on bridging distant and close
viewing [GPD17, KJW∗ 14, JFCS15], the corresponding transitions
between views of distance, proximity, and multiple abstraction lev-                We make two main contributions: First, we introduce scalable
els have received relatively little theoretical or practical consider-          exploration as a design principle for the creation of coherent infor-
ation. With this research, we examine how the careful design of                 mation visualizations. Second, we present the results from an inter-
interactive transitions and representations could improve the scal-             disciplinary design study with literary scholars in which we devised
ability of a visualization. Here, scalability does not refer to the             elastic visualizations of a reference library. We recount our iterative
algorithmic processing of large data quantities, but rather to the              and collaborative design process and share the results from a qual-
comprehensible scaling of visual representations between different              itative evaluation. While we see promising indicators for the facili-
levels of granularity, complexity, and abstraction in an information            tation of exploration in the use of a scalable interface, the outcome
visualization. The assumption is that such a cognitive scalability of           of the evaluation in fact paints an ambivalent picture. We think of
the exploration fundamentally relies on the elasticity of a visual-             this design study as an interpretative approach to visualization re-
ization. For the purpose of this research, elastic visualization refers         search, applying a novel concept to visualization design in a case
to coherent representations that tightly integrate interactivity and            study and evaluating its merit.
visual encodings with the aim of achieving coherence across mul-
tiple perspectives. In other words, transitions need to be designed             2. Related Work
in parallel with visual encodings, and vice versa. For this we need
                                                                                This work draws from two research areas: the visualization of cul-
to better understand how elastic visualizations can be conceived to
                                                                                tural collections within the digital humanities and, more generally,
support scalable exploration across coherently connected views.
                                                                                prior visualization research on animation, transitions, and fluidity
   In this paper, we pursue these questions and present findings                in service of open-ended exploratory experiences. Despite efforts
from a collaborative prototyping process as part of an interdisci-              to offer interfaces focused on exploration rather than search, the
plinary research project on a cultural heritage visualization. By pre-          promise of open-ended exploration in cultural heritage interfaces
senting a design study on the visualization of Theodor Fontane’s                oftentimes does not hold true; on the contrary, the interfaces tend to
reference library, a digitized collection of 155 books with more                feature dead-ends in their navigation paths [KBD17]. Nevertheless,
than 64,000 pages and approximately 9,600 reading traces includ-                over the last few years, interfaces for cultural heritage collections
ing almost 2,500 marginal notes, we present the concept of scalable             have attracted the interest of researchers and practitioners in par-
exploration and reflect on its potential for scholarly use, but also,           ticular with the aim to enhance “explorability”, “generosity”, and
more generally, for the design of elastic data visualizations.                  “serendipity” [DCW11, THC12, Whi15, WFM∗ 16].
   For this project, the focus of humanistic inquiry is on the vari-               According to Shneiderman’s information seeking mantra
ous reading traces: marginalia, markings, provenience marks, sup-               [Shn96], overviews are oftentimes used to provide an entrance
plemented material, and other signs of usage (e.g., fingerprints).              point to a collection [Whi15, WFM∗ 16]. Nevertheless, interaction
Fontane, a popular German realist author, engaged deeply with the               with overviews of individual data entities based on filtering and
books in his library, which becomes apparent in the numerous an-                zooming comes with difficulties; overviews of datasets of up to
notations and markings that mainly he, but also contemporaries,                 billions of data points are limited by visual, technological, percep-
his family, and others left in them (see Fig. 2 for an example). So             tual and cognitive challenges, making aggregation and grouping in-
far, a detailed study of the entire reference library is pending. The           evitable [Shn08]. On the one hand, “distant reading” [Mor13] is an
digitization of the reference library gives way to this visualization           established overview method in the digital humanities used to gain
project, which seeks to offer a first overview of the collection and            insights in large literary corpora by examining quantitative patterns.
enable access to the single books and annotations. The aim of this              On the other hand, accommodating the transition and interplay be-
research is to facilitate both quantitative and qualitative encounters          tween distant (abstract) and close (detailed) representations still
on multiple levels.                                                             concerns the digital humanities [KJW∗ 14, Wei17, JFCS15].

                                                                                                                                                    c 2020 The Author(s)
                                                                                   Computer Graphics Forum c 2020 The Eurographics Association and John Wiley & Sons Ltd.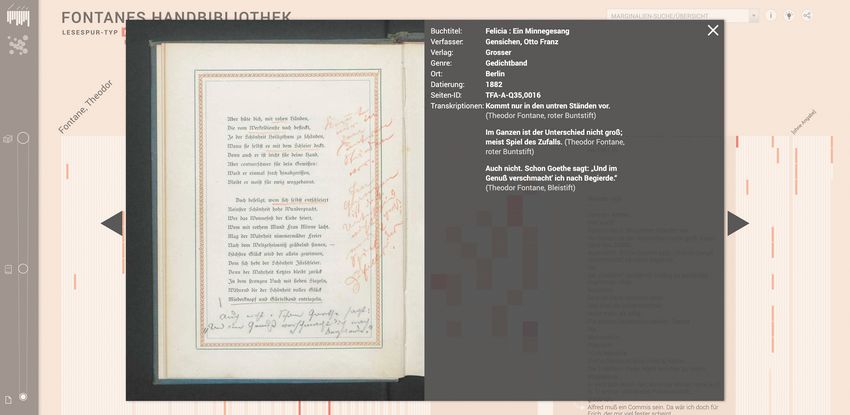
M.-J. Bludau et al. / Reading Traces: Scalable Exploration in Elastic Visualizations of Cultural Heritage Data

   The use of animation to transition between multiple states of                         level, but fail to integrate vertical zoom operations. Furthermore,
a view has been a central concern in HCI and visualization re-                           prior research on animated transitions mainly studies their impacts
search. Animated transitions have become indispensable and are                           and possibilities inside a laboratory setting of isolated visualiza-
used with several intentions, e.g. for “Keeping in Context,” “Teach-                     tions or fixed transition states, limiting the animation design.
ing Aid,” “User Experience,” “Data Encoding,” “Supporting a
narrative,” etc. [CRP∗ 16]. Early on, the technique of semantic                             Building on prior exploration and animation research, this de-
zoom [PF93] and the project pad++ [BH94] built on continu-                               sign study aims to show how to achieve continuity with multiple
ous zoomable information spaces. Approaches such as degree-of-                           arrangements and levels of abstractions, while simultaneously con-
interest, overview+detail or focus+context point to the possibili-                       sidering information structure and representation changes. We in-
ties of user-centered, flexible information spaces [CN02, CKB09,                         troduce the concept of scalable exploration as an analytical activity
vP09]. Especially Focus+Context techniques like accordion draw-                          relying on multiple, connected representations with various levels
ing or fish-eye are often used to allow a more detailed view on                          of granularity. It offers answers to the question of how open ex-
a specific area of interest inside a visualization [e.g., [BLC12,                        ploration can be supported, while context is maintained throughout
CSWP17, MHK∗ 14, RROF18, SHM05]]. One emphasis here is the                               the abstraction processes. Visualizations designed for scalable ex-
facilitation of “flow” in the information seeking process, which in-                     ploration can thus be described as an elastic system, offering mul-
spired researchers early on [Csi90, Pac04]. The concept of visual                        tiple options for interaction, while striving for coherence between
momentum furthermore signified the informational coherence be-                           different states. Elasticity suggests that elements are not cut off and
tween different views [Woo84]. Implementing these theories into                          arrangements are not abruptly changed during the process of inter-
concrete animations, the concept of fluid interaction enables users                      action, but remain intact through forms of stretching and distortion
to navigate through a visualization smoothly [EMJ∗ 11].                                  as well as reduction and expansion. The conceptual approach to the
                                                                                         visualization development is therefore the main quality that differ-
   Regarding “flow” in visual data-driven stories, research indi-                        entiates our design study from other work. One premise here is that
cates that animated transitions can positively influence reader-                         designing for elasticity and scalability requires the joint consider-
engagement. The influence on engagement of discrete scrolling                            ation of encoding, interaction, and the in-between-states early on
navigation compared to continuous scrolling as a form of move-                           in the design process in order to reach and maintain coherence in a
ment between views is still open for further research or at least                        visualization.
may have less impact [MRL∗ 17]. Even though several studies sug-
gest that animated transitions could facilitate comprehension and                           To this purpose, we are devising, using, and evaluating animated
perception of display changes [BB03, HR07, KCH19], it proves                             and viewer-controlled transitions in a prototype, designed to con-
challenging to make the process of large display changes trace-                          vey operations in the context of granularity changes as well as a
able [CDF14]. Tversky and Morrison link the effectiveness of ani-                        form of keeping context between multiple states. We consider and
mations to the principles of “congruence” (form should match un-                         carefully design representational changes on multiple levels while
derlying content and concept) and “apprehension” (possibility to                         at the same time retaining a certain level of coherence. Questions
accurately perceive and comprehend the form), stating that anima-                        that might be asked in the creation of a visualization for the pur-
tions oftentimes are too complex and fast to result in accurate com-                     pose of scalable exploration are: How can integrated transitions be
prehension. The use of animations nevertheless offers the potential                      designed to bridge views using differing forms of abstraction? How
to encode additional information. This is why studies on the effec-                      can they be designed to convey meaning and add to the understand-
tiveness of animations when compared to static graphics oftentimes                       ing of a visualization? How can different visual representations of
do not use equivalent conditions [TMB02]. Exploring the effects                          the data be designed and linked to each other? How do we deal with
of novel staged animated transitions for aggregation operations,                         discontinuity between different states of a visualization?
Kim et al. found that staged animated transitions can contribute
to the comprehension of a performed aggregation. On the other
hand, staged animations sometimes perform worse than static view                         4. Visualizing Reading Traces in an Author’s Library
changes regarding response time. Test participants nonetheless fa-
                                                                                         In the digital humanities, the interplay—and perhaps also tension—
vored staged animations over static or interpolated ones [KCH19].
                                                                                         between distant and close reading resembles the juxtaposition of
                                                                                         overview and detail in information visualization. During an inter-
                                                                                         disciplinary visualization research project on the visual analysis of
3. Towards Scalable Exploration
                                                                                         reading traces in an author’s library, we were faced with questions
With this research, we want to contribute to the ongoing work in                         of representation and animation accordingly. The joint research
information visualization on animation and interaction, and specif-                      with our literary collaborators offers an opportunity to pursue ques-
ically set a focus on designing for scalable exploration. Although                       tions of scalable exploration, linking modes of distance and prox-
the ideas of open-ended exploration and flow are widely recog-                           imity with continuous transitions. They are interested in gaining
nized, methods like animated transitions only serve the facilitation                     new insights into the complete corpus through distant perspectives,
of such states to a certain degree. While semantic zoom supports a                       while also observing the necessity to analyze phenomena on an in-
form of vertical scaling, it is usually limited to zoom and neglects                     dividual level. In the following, we introduce the corpus and de-
the possibility for differing granularity levels of data on the same                     scribe the design considerations and decisions that emerged from a
horizontal plane. Focus-context techniques on the other hand are                         reciprocal cooperation between visualization research and literary
oftentimes used to deal with varying complexities on a horizontal                        studies.

 c 2020 The Author(s)
Computer Graphics Forum c 2020 The Eurographics Association and John Wiley & Sons Ltd.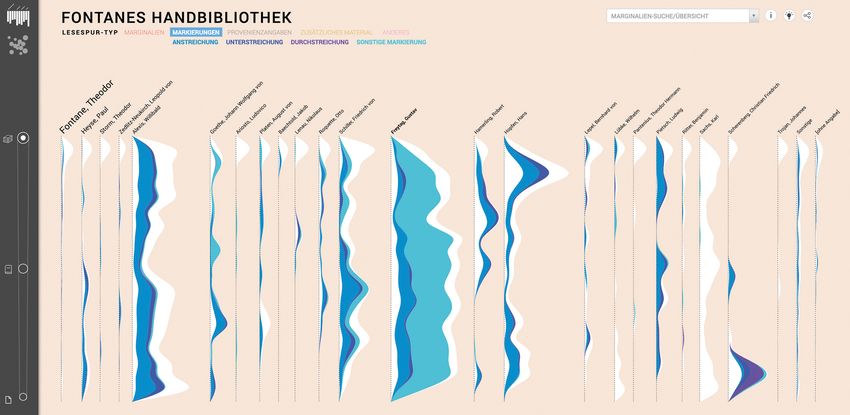
M.-J. Bludau et al. / Reading Traces: Scalable Exploration in Elastic Visualizations of Cultural Heritage Data

4.1. Project Collaboration and Background                                          A particular characteristic of the collaboration was the simul-
                                                                                taneity of data acquisition and the visualization design process,
Reference libraries hold the books an author has read, possessed,               which led to a mutual influence of research and design practices,
or used in the production of their works. In literary studies, there is         e.g. prioritization of some functionalities over others. In initial vi-
growing interest in the digitization and study of reference libraries           sualizations, it became once more apparent that data are inher-
as they provide additional context to make sense of an author’s oeu-            ently subjective: It was partly visible which researcher had anno-
vre [VHVM04]. Today, 155 books from Fontane’s reference library                 tated which books, leading to an accumulation of specific cate-
are (re)stored in the Theodor Fontane Archive in Potsdam. For the               gories. Here, the visualization helped to make such initial inter-
project, they were digitized individually, forming a dataset of ap-             pretations visible, while patterns and findings from the growing
proximately 64,000 pages. The books vary deeply in topic, length,               dataset on the other hand influenced the design of the prototype.
and style, but also in the way Fontane made use of them: Some                   While it was sometimes challenging that the dataset was devel-
show heavy signs of reading and annotating, while others have re-               oping slowly, it reinforced one of the main takeaways from this
mained rather untouched. For the project, the annotations, mark-                research format, which was that visualizations serve not only to
ings, comments and additional material were transcribed and added               transfer knowledge, but—as described by similar interdisciplinary
to the dataset during the digitization. The variety of reading traces           design studies [HFM15]—also contribute to (humanist) research
can open up new perspectives on the author, his works and working               processes themselves.
habits, as well as his personal thoughts and is thus of great interest
to researchers [Bus19].
                                                                                4.2. Design
   The digital presentation of reference libraries has, until now, of-
ten been limited to the provision of digital catalogs that make li-             The visualization of the reference library, developed with the
brary metadata and digital copies available in a specific viewer                JavaScript library D3.js [BOH11], features two modes, each pro-
and/or as a PDF download. While these forms of presentation do                  viding access to multiple granularity levels to help explore the data
provide access to the material for research, they hardly convey the             from different perspectives (see Fig. 1). While the first mode (“dis-
autographical patterns in the book collections, which are distinctly            tribution mode”) arranges and directly visualizes the frequency and
characterized by the reading traces that have been left in them.                types of reading traces along the linear reading order of the books,
While current research practices are based on time-consuming ex-                the second mode (“similarity mode”) displays books and authors
tensive individual book research and oftentimes require applica-                based on similarity measures according to frequencies and types of
tions to get access to the books, we aim to devise modes of access              reading traces left in the books. The purpose of the “distribution
that provide synoptic perspectives on the whole material at once                mode” is to reveal broader patterns in the reading traces over the
as well as detailed views on particular books and pages. This re-               whole corpus at various levels of granularity. On the other hand,
sembles what Wieland calls a diachronic-vertical way of reading                 the aim of the “similarity mode’ is to highlight unexpected sta-
the reference library in addition and distinction from the usual hor-           tistical similarities and features. In coordination with the team at
izontal reading [Wie15]. The goal of the project was not to provide             the Theodor Fontane Archive, we focused on the comparability of
a research tool for close-reading practices, e.g., by developing an             authors, but with the idea to create design concepts that could in
integrated PDF viewer for annotation, but to create a tool that en-             principle be transferred to other types of categorizations and accu-
ables a completely new perspective on the material for exploration,             mulations (e.g., genre).
serving as an entrance point to the formulation of tentative research
questions.                                                                         In both modes, the visualization design focuses on continu-
                                                                                ous navigation that can be zoomed and filtered on several lev-
   In order to link our visualization questions with domain-                    els, along which particular reading traces as well as broader pat-
specific research requirements, we followed a grounded design pro-              terns can be discerned. Scrolling up or down leads to continuous
cess [IZCC08]: the project was conducted in an interdisciplinary                transitions between three levels in the distribution mode—authors,
team with academic expertise in literary studies, interface design,             books, and pages—and two levels in the similarity mode—authors
and visualization research. In a rapid-prototyping process we iter-             and books (see Fig. 1). Akin to semantic zoom [PF93], scrolling
atively generated small prototypes and conceptual sketches to fa-               upwards leads to higher levels of abstraction and downwards to
miliarize ourselves with the collection, to identify first interesting          more detail. Following the principle of apprehension [TMB02], the
patterns and to stimulate discussions with our partners. A joint pre-           goal of scrolling as the main interaction method is to promote user-
sentation at conferences helped identify relevant user-tasks for re-            dependent transition speed that allows for perception and compre-
searchers of author’s libraries. Research questions from our part-              hension of meaning during the process of transitions, while retain-
ners extend over a wide range of questions, such as “which books                ing continuity and context between the various granularity levels.
are annotated extensively?”, “what are common types of margina-                 To arrive at smooth transitions, a user’s scroll position in the web-
lia?”, “are there certain authors whom Fontane is more likely to                site is directly translated to a state in the visualization, which leads
judge than others?” or “did Fontane work differently with his own               to scroll position dependent gradual changes in the visualization.
books than with those of other authors?” Besides finding answers                However, as an alternative to scrolling between the different lev-
to questions, even more important was the desire for a completely               els, there is also a navigation bar on the left that contains buttons
new perspective on the data, potentially opening up completely new              for switching between the modes and a vertical slider indicating the
research questions or possibilities that may not emerge through ex-             current position and offering an animated switch between the levels
tensive individual linear book research.                                        per click selection or by dragging the slider.

                                                                                                                                                    c 2020 The Author(s)
                                                                                   Computer Graphics Forum c 2020 The Eurographics Association and John Wiley & Sons Ltd.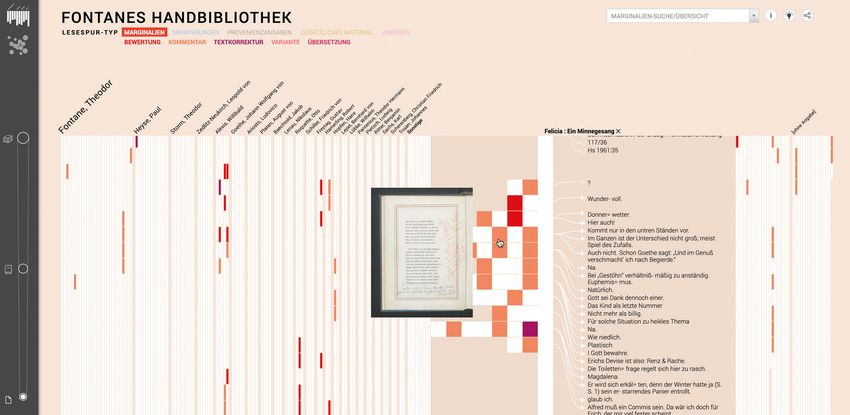
M.-J. Bludau et al. / Reading Traces: Scalable Exploration in Elastic Visualizations of Cultural Heritage Data

Figure 3: Landing page/book level inside the distribution mode                           Figure 4: Author level inside the distribution mode, unfolding the
with overview of all 155 books displayed in form of vertical bars,                       colors of the applied filter “markings” into multiple shades of blue.
ordered by author. Navigation bar on the left side in grey, with but-
tons on the top to switch between the modes and a draggable and
clickable scroll indicator/slider.
                                                                                         ent logic behind both modes, the background color changes from a
                                                                                         brighter beige to a dark blue. Moving between the different levels
                                                                                         and modes of the visualization, the filter selections are maintained
    A filter bar above the visualization in both modes serves as a                       in order to allow for fluent motions between the two visualization
legend for the color coding and offers the possibility to focus on                       modes and the granularity levels. In addition, all selections, filters,
certain reading trace types. To reduce perceptual difficulties caused                    and the zoom level are encoded in the URL, allowing exact link
by too many nominal color categories [Mun14], subcategories (e.g.,                       referencing, bookmarking, and sharing of particular views.
comments) of a main category (e.g., marginalia) are only unfolded
through a click on one category, which also applies the responding                       4.2.1. Distribution of Reading Traces
filter to the visualization. Unfolding of subcategories fans out the
                                                                                         The starting point for exploring the visualization is the book level
color of the selected category into additional nuances of the same
                                                                                         of the distribution mode, which provides an overview of all books
color to allow further differentiation between the respective sub-
                                                                                         in the reference library, sorted by authors (see Fig. 3). Each book
categories, while blending out other categories (see Fig. 4 & 6). In
                                                                                         is represented by a vertical bar, in which one page is represented
general, while white represents the absence of any type of reading
                                                                                         by a rectangular segment, displayed in reading order of the individ-
traces in a page, the five main categories of reading traces are dif-
                                                                                         ual books from top (first page/cover) to bottom (last page/cover).
ferentiated by color that can be seen in both visualization modes.
                                                                                         By assembling each page in the form of individual segments, the
Here, considerations of each category’s importance informed the
                                                                                         book length can be estimated by comparing the length of the bars.
choice of color, which is why marginalia are indicated in red tones
                                                                                         While pages without reading traces are displayed in white (visible
and provenance data assume gray tones:
                                                                                         due to the beige background), pages that contain reading traces are
1. marginalia (red): ratings, comments, text corrections, text vari-                     colored according to the category of their occurrences, creating a
   ants, translations                                                                    kind of bar code that is unique for each book. By displaying all
2. markings (blue): underlinings, highlightings, text cancellations,                     books in “small multiples” [TGB90] next to each other, the juxta-
   other marks                                                                           position is used to enable overall comparison and to expose pat-
3. provenance data (gray): ownership/provenance notes, institu-                          terns [GAW∗ 11]. Hovering over the bars displays respective gen-
   tional stamps                                                                         eral information about the book (title, genre, date of publication).
4. additional material (yellow): glued-in newspaper articles, etc.                       Clicking on a book at the book level unfolds additional information
5. other reading traces (pink): dog-ears, stains, fingerprints, etc.                     (e.g., cover image, title, date of publication, etc.), shows the count
                                                                                         of pages on which reading traces occur, and gives an overview of
   With the intention to reach coherence between the levels, it was
                                                                                         the transcribed marginalia.
important to match the main encodings across all views. In both
modes, the color encoding is consistent across all levels. Another                          Navigating up leads to the author level, where all books of all
constant is the logic behind the placement of elements. While in                         authors are grouped together by presenting the average distribution
the “distribution mode” vertical placement is based on the linear                        of reading traces in the form of an area chart. The decision to use
appearance of reading traces in the books, the horizontal position-                      the abstraction of area charts instead of more concrete forms of
ing of books is based on a grouping by author, ordered by number                         accumulating discrete points, such as bee plots, was informed by
of books by an author. In contrast, the positioning of elements in                       previous prototypes, which suffered from space and performance
the “similarity mode” is based on similarity measures inside an ab-                      issues. The resulting curve shows the average distribution of read-
stract plane, which disregards the linear order of the reading traces                    ing traces within all works of one author from top (book start) to
and dissolves the differentiation between individual pages. While                        bottom (book end). Here, a staged transition between the levels is
the design of a meaningful transition between both modes was a                           used to communicate the basic data operations of normalization
desired goal, we did not arrive at a useful outcome. In addition to                      and accumulation, by first normalizing all book bars to one length.
the break of elastic visualizations, in order to emphasize the differ-                   Thereafter the book-bars for each author merge and an area chart

 c 2020 The Author(s)
Computer Graphics Forum c 2020 The Eurographics Association and John Wiley & Sons Ltd.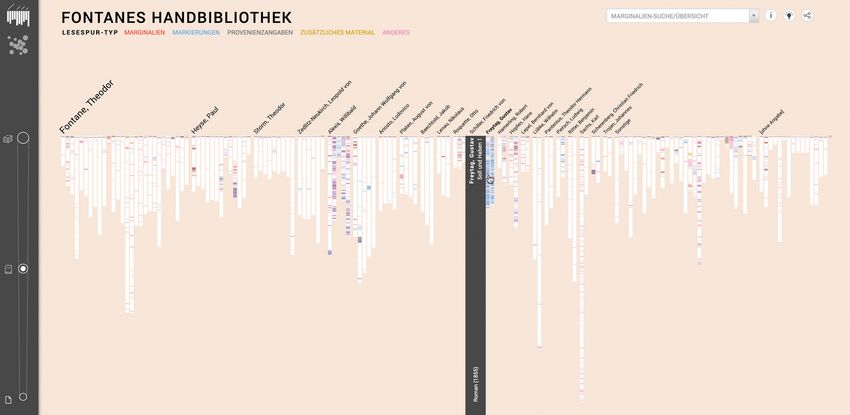
M.-J. Bludau et al. / Reading Traces: Scalable Exploration in Elastic Visualizations of Cultural Heritage Data
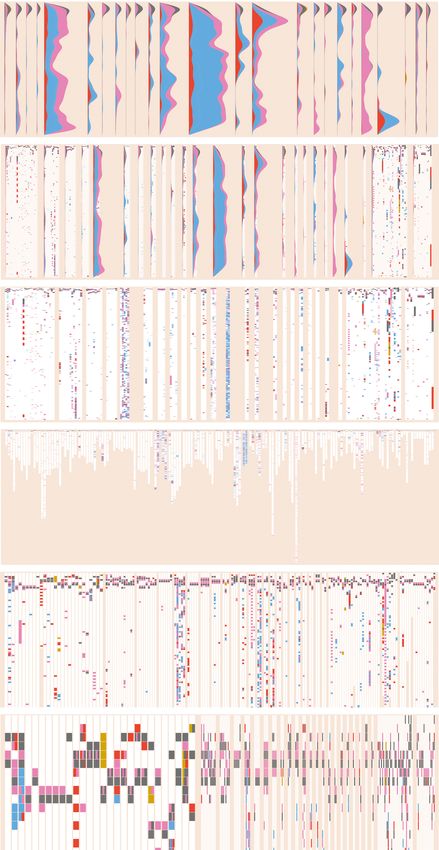
Figure 6: Page level in the distribution mode with a book and
filter selected and hover over an element. Through the selection
of the book, additional details have been unfolded, displaying the
number of reading traces on the page, the transcriptions for the
marginalia of a page and the (assumed) author of marginalia.
Figure 7: Detail view of one page, showing the scan, meta data,
and transcriptions of marginalia.
presses the other books, using a focus+context approach [CKB09]
similar to accordion drawing [SHM05]. After reaching the page
level, further scrolling down makes the visualization fall back to
the browser’s usual scrolling behavior, enabling vertical movement
through the zoomed-in reading traces. Clicking on a book at the
page level offers the selection of individual reading traces and
shows the transcribed marginalia directly next to the correspond-
ing page segments (see Fig. 6), which includes an icon that can be
hovered for a (presumed) identification of the marginalia’s author.
Figure 5: Staged transitions between the author (top), book (cen- Another selection opens a detail view of the page showing the re-
ter), and page (bottom) levels of the distribution mode. spective scan image (see Fig. 7).
Finally, a search field, which serves simultaneously as an
overview list of all marginalia notes (sorted by number of occur-
appears, conceptually linking the previous normalized positions of rences), offers the possibility to search for specific words or phrases
the reading traces to the vertical axis and the number of traces to the such as “good” or “brilliant” and highlight their occurrences di-
horizontal axis in the subsequent chart, which enables the viewer to rectly in the visualization.
make a connection between the displayed states (see Fig. 5).
4.2.2. Similarity Comparison
Navigating down from the starting point (book level) leads to
the page level, enabling a zoomed-in view of individual pages and Through the buttons in the top left corner, the visualization can
reading traces with focus on books of one selected author (see be switched into the “similarity mode”, which arranges books and
Fig. 1 bottom left). Hovering over a page segment displays a scan of authors based on similarity measures by way of multidimensional
the respective page. In addition to the change between granularities scaling (MDS). Here, as an indication of conceptual disruption in
and filtering, clicking on a book unfolds further details and com- contrast to the first mode, the background and text colors (exclud-
c 2020 The Author(s)
Computer Graphics Forum c 2020 The Eurographics Association and John Wiley & Sons Ltd.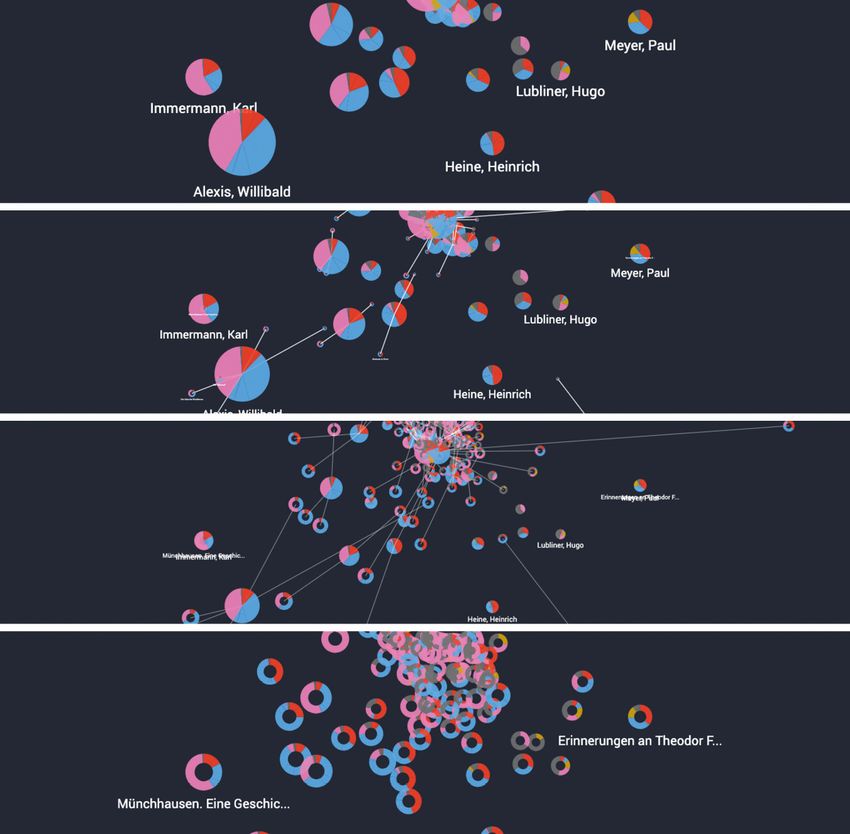
M.-J. Bludau et al. / Reading Traces: Scalable Exploration in Elastic Visualizations of Cultural Heritage Data

Figure 8: Book level of the similarity mode, ordering the books
based on similarity of total number of reading trace occurrences.
Books with comparatively average numbers of total occurrences
are clustered towards the center through the MDS-algorithm.

                                                                                         Figure 10: Gradual transition between the author level (top) and
                                                                                         the book level (bottom) inside the similarity mode.

Figure 9: Selecting an author inside the author level of the simi-                       (total number of types) are positioned close together, which leads
larity mode displays their biography, all covers of their books, and                     to books containing unusual reading trace occurrences being posi-
the number of reading traces inside them.                                                tioned towards the outer edge and books with rather average read-
                                                                                         ing traces tending to accumulate in the center. Pie charts on the
                                                                                         author level and donut charts on the book level mark the position
                                                                                         of a book/author inside the similarity plane. The small pie/donut
ing the category colors) are inverted, changing the appearance into                      charts also act as glyphs that encode the shares of a category of all
a kind of dark mode. This mode also offers the possibility to grad-                      reading traces through the size of the colored slices and the total
ually navigate between two granularity levels through scrolling,                         number of reading traces via the size of the pie/donut chart. Here,
dragging the slider, or selecting the respective elements in the nav-                    the goal is not to provide charts that enable exact reading or com-
igation bar. Here it is possible to move between the book level (see                     parison of shares, but to give a general overview of shares and to
Fig. 8), which arranges all books based on similarity of occurrences                     display overall trends to enable an interpretation about the results
of reading traces, and the author level (see Fig. 9), which arranges                     of the multidimensional scaling.
the authors in the collection by similarity between average num-
                                                                                            At the author level, the average occurrence of reading traces in
bers of occurrences of reading traces in their books. The transi-
                                                                                         all of their books is arranged in a similarity-based view, so that
tion between the granularity levels visualizes the merging of the
                                                                                         authors with similar quantities and types of reading traces are posi-
books into an author average and vice versa (see Fig. 10). Navi-
                                                                                         tioned close to each other. A click on an author opens a detail view
gating from author to book level, donut charts for each book move
                                                                                         on the right side, which gives a tabular overview of the reading
out of the pie charts of their author on a linear path towards their
                                                                                         traces, the covers of all books of the selected author, and a short bi-
similarity-based position. At the same time, the pie charts of the
                                                                                         ography (see Fig. 9). At the book level, a click on a book highlights
authors shrink towards invisibility. During the transition, network
                                                                                         all books of the same author (see Fig. 1 bottom-right), marks the av-
edges connect books with their author, indicating the centroid of
                                                                                         erage value of all their books (position of the author in the matrix)
the network. This encoding aims to strengthen the impression of
                                                                                         through a network graph, and opens a side view with additional
connectivity between books of the same author during transitions.
                                                                                         detailed information for the selected book including all marginal
   For the MDS matrix we used the average count of reading trace                         notes. Here, a click on one transcribed item opens the correspond-
occurrences in each subcategory (including pages without traces)                         ing page where the respective marginalia appear. In both, author
for the authors and the total count of occurrence in each book                           and book levels, further scrolling leads to activation of a common
and calculated the matrix together to be able to link both views                         semantic zoom, giving the possibility to scatter the denser clusters
through transitions. Books or authors with similar reading traces                        in the centers through zooming.

 c 2020 The Author(s)
Computer Graphics Forum c 2020 The Eurographics Association and John Wiley & Sons Ltd.
M.-J. Bludau et al. / Reading Traces: Scalable Exploration in Elastic Visualizations of Cultural Heritage Data
5. Evaluation the beginning of the exploration process—in particular for the un-
derstanding of the similarity mode.
In addition to comments and insights we received from our literary
collaborators, we were interested to get ‘fresh’ feedback on the po-
tential of elastic visualization for scalable exploration. For this pur- 5.2. Levels of representation
pose, we have undertaken a qualitative user study. We conducted
an open-ended “think aloud” study coupled with a short written The participants were all able to navigate between the multiple lev-
questionnaire before and a few specific tasks and questions at the els of representation in the prototype and to recognize them as dif-
end of a session. Eight participants (who were not involved in the ferent aspects of the dataset. The usage of different levels of infor-
project) took part in the study; half had backgrounds in literary mation was mentioned to be especially helpful about the visualiza-
studies, which represented the main group of interest, while the tion by half of participants. The granularity levels were perceived to
others came from varying disciplines. The questionnaire assessed be both complex in the sense that they offered different answers to
previous knowledge about Fontane, literary research, or data vi- different questions, but also that they added a certain complexity to
sualization. Five of the eight participants had none to very little the visualization itself, which could sometimes lead to confusion,
experience with data visualization. but nevertheless interest:
Each study session took approximately 30 minutes. The specifics “[. . . ] what I found interesting about it. So, for instance the dif-
of the prototype such as visual encodings and interaction tech- ferent levels, that it is actually super complex. And that you try to
niques were not explained. After giving a short introduction about make it as understandable as possible.”
the topic and the purpose of the study, participants were asked to in- The interplay of multiple granularity levels and the navigation
teract on their own terms with the prototype, while stating audibly between the various layers was oftentimes used when it came to
what they do, think, interpret, question, and so forth. Afterwards, more specific questions about the data, using them to validate first
we asked the participants to perform three basic tasks: 1) compare impressions or as a starting point for exploration:
two authors and two books, 2) open the scan of a specific margina-
lia type, and 3) scroll up and down between the different granu- “So first of all I see in the initial view that he obviously pos-
larity levels. Finally, we asked them for their personal assessment sessed more of Goethe than of Schiller. However, [...] he made sig-
of the potential of the prototype for literary studies, on the poten- nificantly more comments on Schiller’s works than on Goethe. [. . . ]
tial for visualization research, and for more specific comments on The closer I zoom in, the clearer it can be seen. So in this wave-like
the prototype. Besides the identification of usability issues of the overview it is much better, so now you can see very well in compar-
prototype, the broader focus of the evaluation was to validate our ison that he obviously worked his way through Schiller, especially
approach on coherent, flexibly scalable views, i.e., elastic visual- by adding many markings.”
izations. Accordingly, the following section focuses on the effects Furthermore, we noticed that the use and comparison of the dif-
and descriptions of scaling and transitioning between the varying ferent levels led to peaks of interest and further exploration of al-
zoom and abstraction levels. ready more refined questions regarding the content:
“So I clicked marks and now cancellations as an option [...]. And
5.1. Usability aspects now I see he did not cross out that much, but I’m interested in what
The study participants were able to successfully interact with the he crossed out in his own books.”
prototype in most cases, moving between trial and error to under- The literary scholars stood out as they more often than others
stand its functionality and concrete actions to answer questions. mentioned the value of overviews over the whole collection as the
From the start page of the distribution mode, they started to make main advantage of a visualization of this type. Although it is diffi-
sense of the arrangement first and then either tried filters or be- cult to validate the usefulness of the prototype for the uncovering
gan to navigate between the different levels of the visualization. of completely new research questions, especially the participants
While most participants were able to comprehend and decode the with background in the literary studies nevertheless ascribed the
arrangement of the first mode, a majority could not make sense of prototype domain-specific utility:
the positioning in the more abstract similarity mode:
“Well, I think it is exciting that you can visualize this mess that you
“Here you can now see an overview of similarity,[...]. What I don’t usually have in all these books for the first time. Well, usually I have
understand is the arrangement. If I imagine this as a geographic got a thousand books with small traces and I cannot do anything
map of Germany, for example, I wouldn’t know why Wichmann is with them at first. Here I can see at a glance which authors are
forming Berlin and Freytag Munich, so to speak.” particularly affected and which books.”
Participants were able to navigate between the modes and rec-
ognize a different order criterion, but they were not able to decode
5.3. Interactive control of transitions
the meaning of the arrangement. Accordingly, they described what
they saw and compared the different granularity levels and filter During the interaction with the prototype as well as the questions at
possibilities to the first mode, but did not use it for further inquiries. the end, half of the participants highlighted the movement between
While we discouraged the reading of the “help” page, in order to the different levels as helpful and noteworthy about the visualiza-
provoke user-specific interpretations of encoding and interactions, tion. The interactive transitions were said to make the complexity
many of the participants expressed the wish for a short tutorial at of the collection more graspable:
c 2020 The Author(s)
Computer Graphics Forum c 2020 The Eurographics Association and John Wiley & Sons Ltd.M.-J. Bludau et al. / Reading Traces: Scalable Exploration in Elastic Visualizations of Cultural Heritage Data
“I find the scrolling very interesting in the way that it has such interactive transitions and representations that convey various lev-
a smooth transition in the display. And I think I find it exciting, els of information.
[. . . ], how the transition is and how through this you [. . . ] explain
different levels that are somehow connected with each other.” However, the primary use of scrolling to control transitions has
triggered ambivalent reactions among participants. While six of
Most of the participants referred to the mechanics they saw in the the participants almost exclusively used scrolling for their sense-
display changes as a form of “zoom,” which they oftentimes used making of the visuals (oftentimes perceivable in their interaction
and described effectively, but sometimes had problems to translate by seeing them scroll back and forth), others were confused by
the abstraction process into words: incomplete in-between states or the interaction through scrolling
“Now I’m going up from the middle. [scrolls up back and forth] itself. This could also be explained by the irritations described as
So it feels like I’m zooming in here. [...] Well, then I’ll scroll down “scrolljacking” [Bos14], where usual scrolling behavior of a web-
now, yes, it’s a similar feeling somehow, like zooming in again, but site is interrupted or exchanged with the risk of leading to frustra-
this time in a way that it’s really something that changes in size.” tion caused by unexpected behavior. One of the main insights that
we took from the evaluation is that it is important that transitional
While scrolling is a possibility for navigation and was of spe- and final views are easily distinguishable to avoid misinterpreta-
cial interest to us as a form of gradual, self-operable, and linear tion. For most transitions, the encoding cannot stay true to the data
transition, it was not the only option to navigate between the var- at all steps of a transition, as expressed in the design principle of
ious granularity levels. Here, we noticed that scrolling compared congruence by Heer and Robertson [HR07], but it should be aspired
to switching levels by clicking is more prone to user-specific dif- to avoid invalid data attributions during the transitional states. To
ficulties, e.g., caused by different scrolling speeds or unexpected communicate the distinction between the states, the prototype in-
behavior: cludes a navigation bar with icons for each final state corresponding
to a specific scale (authors, books, pages). Nevertheless, two par-
“I’m confused by the scrolling [. . . ] and that a single scroll seem-
ticipants specifically mentioned problems in finding their position
ingly brings me somewhere else entirely and that I can’t scroll up
and expressed that the scrolling state could be communicated more
and down as on a website.”
effectively. Considering difficulties that resulted from interaction in
Furthermore, the scrolling seems to be more vulnerable to mis- incomplete in-between states, scroll thresholds for main views that
interpretations. While clicking on the navigation always results in automatically snap in might be an approach to solve this problem.
full execution of a transition, some participants did not always
scroll to the end, leading to confusion about mixed encoding of in- We intentionally did not provide a previous introduction into
formation. However, we could often see participants trying to make the functionalities of the tool during the evaluation, because we
sense of the encoding in one granularity level by actively using were specifically interested in the reactions to the transitions and
scrolling, watching closely what happens between the views: scrolling, which uncovered general usability issues as participants
had to explore the functionalities of the prototype on their own.
“The books are contracting. Are they contracting? Ah—and then Some difficulties that participants encountered we ascribe to the
slowly appear [. . . ] beautiful wave diagrams, where the individual limited time to get to know the tool without an introduction. While
authors are marked and no longer the individual books.” [Distribu- five of the eight participants asked for more help or explanation in
tion mode] the beginning, two were specifically interested in more contextual
“The graphic becomes denser or something like that one could say, information or interpretations. The integration of such a narrative or
so there are fewer points. So the number of circles of works are interpretative layer was explicitly excluded from the project, so as
combined.” [Similarity Mode] to leave the interpretation of the data to the viewers or researchers.
Nevertheless, one request of our partners was to enable direct link-
ing to specific views for future referencing in research or narrative
6. Discussion practices, e.g., about specific phenomena or findings for blog posts
or research articles. We see the prototype itself as an explorative
We think of this design study as an interpretative approach to vi- research tool that can and will be connected to more narrative and
sualization research, during which we make sense of the qualita- explanatory content in the future.
tive evaluation results as one possible facet of results [MD20]. As-
pects of observer-dependence make it difficult to investigate effects With the second mode of our prototype, the “similarity mode”,
on explorative characteristics or the usefulness of a visualization we aimed to explore and offer an alternative, more abstract way of
for the development of research questions. Additionally, we do not representing the data, knowing that the abstraction of dimensional-
claim that our evaluation is able to give definite answers about the ity reductions may be difficult to grasp without much explanation.
general usefulness of our approach, since the effectiveness of such Furthermore, our intention of designing useful transitions between
complex design interfaces is dependent on many small factors. An the two modes was not sustainable, because the encoding of each
A/B-testing of a prototype with and without transitions could give mode follows very different logics, leading to a discontinuity in
more conclusive results. Nevertheless, we think that the elastic in- our general approach, visualized through the color change. This
terplay between abstract or compressed views with concrete de- break in consistency manifested itself in the responses towards the
tailed views has proven to be promising to accommodate the com- arrangement in the similarity mode. Our evaluation showed that
plexity of rich cultural heritage datasets. Furthermore, scalable ex- most participants could not make sense of such a representation,
ploration was a useful aspiration to characterize the design space of just knowing that elements are positioned based on similarity.
c 2020 The Author(s)
Computer Graphics Forum c 2020 The Eurographics Association and John Wiley & Sons Ltd.M.-J. Bludau et al. / Reading Traces: Scalable Exploration in Elastic Visualizations of Cultural Heritage Data
Nevertheless, after reading through our help page, which in- 8. Acknowledgments
cludes annotated examples and explanations, participants stated
We would like to express our gratitude to our collaborators at the
that such a visual was interesting in theory, but that they would
Theodor Fontane Archive: Peer Trilcke, Sabine Seifert, Kristina
need more assistance. For similar projects, we would suggest to
Genzel, Luisa Billep, Tabea Klaus, and Anke Reintsch. Further-
consider how unfamiliar visualization techniques could be commu-
more, many thanks to Allyn Heath and the reviewers for feedback
nicated more effectively.
on this paper and to everyone who has tested our prototype. This
Although conceptualized with the notion of elastic data visual- research was funded by the research budget of the Theodor Fontane
izations in support of scalable exploration, in the resulting proto- Archive of the University of Potsdam.
type we arguably break out of this paradigm in some places. E.g.,
while in the first mode scrolling is generally used for changes in References
granularity, at the page level it switches back to conventional view- [BB03] B EDERSON B., B OLTMAN A.: Does animation help users build
port changes. Furthermore, the discrete switch between the distri- mental maps of spatial information? The Craft of Information Visualiza-
bution and similarity modes breaks with the ambition to make dis- tion: Readings and Reflections (2003). 3
play changes gradual and comprehensible. In fact, it can be difficult [BH94] B EDERSON B., H OLLAN J.: Pad++: a zooming graphical inter-
if not impossible to arrive at useful transitions and elastic systems face for exploring alternate interface physics. In UIST 1994: Symposium
that incorporate multiple spatial logics. Nevertheless, we noticed on User Interface Software and Technology (1994), ACM, pp. 17–26. 3
that especially these parts with abrupt breaks of concept led to dif- [BLC12] BAUR D., L EE B., C ARPENDALE S.: Touchwave: kinetic
ficulties in comprehension—which arguably points toward benefits multi-touch manipulation for hierarchical stacked graphs. In Proceed-
ings of the 2012 ACM international conference on Interactive tabletops
of coherent and connected views. and surfaces (2012), ACM, pp. 255–264. 3
More generally, an arguably unavoidable limitation of this re- [BOH11] B OSTOCK M., O GIEVETSKY V., H EER J.: D3: Data-driven
search is that it was pursued in the context of a specific case study. documents. TVCG: Transactions on Visualization and Computer Graph-
ics 17, 6 (2011), 2301–2309. 4
While Fontane’s reference library only contains 155 books, other
collections may include tens of thousands of objects. For more ex- [Bos14] B OSTOCK M.: How to scroll. https://bost.ocks.org/
mike/scroll, 2014. Accessed: 2019-12-27. 9
tensive collections, we see even more necessity for a range of gran-
[Bus19] B USCH A.: Fontane als Leser. Zur Visualisierung von Lek-
ularity levels and continuous navigation between them. We would
türespuren in Fontanes Handbibliothek. Fontane Blätter 107 (2019),
be curious to examine how our ideas of scalable exploration and 104–132. 4
elastic visualization translate to other kinds of cultural collections [CDF14] C HEVALIER F., D RAGICEVIC P., F RANCONERI S.: The Not-
and maybe other domains. so-Staggering Effect of Staggered Animations on Visual Tracking. IEEE
Transactions on Visualization and Computer Graphics 20, 12 (Nov.
2014), 2241–2250. 3
[CKB09] C OCKBURN A., K ARLSON A., B EDERSON B. B.: A review of
7. Conclusion overview+detail, zooming, and focus+context interfaces. ACM Comput.
Surv. 41, 1 (Jan. 2009), 2:1–2:31. 3, 6
Based on the premise that scalable exploration describes the shift
between close and distant reading in digital literary studies, we de- [CN02] C ARD S. K., NATION D.: Degree-of-interest trees. In Proceed-
ings of the Working Conference on Advanced Visual Interfaces (New
scribed our iterative and interdisciplinary research on elastic visu- York, NY, 2002), de Marsico M., (Ed.), ACM, p. 231. 3
alizations designed to bridge different granularity levels. In order
[CRP∗ 16] C HEVALIER F., R ICHE N. H., P LAISANT C., C HALBI A.,
to examine the viability of this approach, we presented a design H URTER C.: Animations 25 years later: New roles and opportunities.
study in collaboration with a team of literary scholars about the In Proceedings of the International Working Conference on Advanced
reading traces in an author’s library. During this collaboration the Visual Interfaces (2016), ACM, pp. 280–287. 3
domain-specific research questions matched and ran in parallel to [Csi90] C SIKSZENTMIHALYI M.: Flow: The psychology of optimal ex-
the visualization research questions and design goals. perience. HarperPerennial, New York, 1990. 3
[CSWP17] C UENCA E., S ALLABERRY A., WANG F., P ONCELET P.: Vi-
In this paper, we described the concept of a visualization de- sualizing hierarchical time series with a focus+ context approach. IEEE
signed to support distant as well as close viewing of reading traces VIS 2017, 2017. Poster. 3
with a conceptual focus on interactive, user-controlled transitions [DCW11] D ÖRK M., C ARPENDALE S., W ILLIAMSON C.: The infor-
between multiple levels of detail. Our exchanges with our col- mation flaneur. In CHI 2011 (New York, NY, 2011), Tan D., Fitzpatrick
laborations and the results from a qualitative evaluation indicate G., Gutwin C., Begole B., Kellogg W. A., (Eds.), ACM, p. 1215. 2
that fluid shifts between multiple levels can support exploration [Dru11] D RUCKER J.: Humanities approaches to graphical display.
and can have positive effects on the level of engagement with DHQ: Digital Humanities Quarterly 5, 1 (2011). 2
the underlying information. Even though we still see potential for [EMJ∗ 11] E LMQVIST N., M OERE A. V., J ETTER H.-C., C ERNEA D.,
user-controlled interactive transitions, at least regarding the use of R EITERER H., JANKUN -K ELLY T.: Fluid interaction for information
visualization. Information Visualization 10, 4 (2011), 327–340. 3
scrolling there are difficulties to overcome potential confusion or
[GAW∗ 11] G LEICHER M., A LBERS D., WALKER R., J USUFI I.,
mis-interpretation. Nevertheless, especially in the field of digital
H ANSEN C. D., ROBERTS J. C.: Visual comparison for information
humanities, where the modes of close and distant reading are long- visualization. Information Visualization 10, 4 (2011), 289–309. 5
debated methodological challenges, we see great potential and ne- [GPD17] G LINKA K., P IETSCH C., D ÖRK M.: Past visions and recon-
cessity for supporting the interplay between multiple abstraction or ciling views: Visualizing time, texture and themes in cultural collections.
granularity levels. DHQ: Digital Humanities Quarterly 11, 2 (March 2017). 2
c 2020 The Author(s)
Computer Graphics Forum c 2020 The Eurographics Association and John Wiley & Sons Ltd.You can also read