Barriers and incentives for transitioning to zero emission vehicles in - NSW DEPARTMENT OF PLANNING, INDUSTRY & ENVIRONMENT
←
→
Page content transcription
If your browser does not render page correctly, please read the page content below
DEPARTMENT OF PLANNING, INDUSTRY & ENVIRONMENT

Barriers and
incentives for
transitioning to zero
emission vehicles in
NSW
Stakeholder perspectives and literature review

environment.nsw.gov.au
© 2021 State of NSW and Department of Planning, Industry and Environment
This report was coordinated by the CRC for Low Carbon Living Ltd on behalf of the Energy
Efficiency Decision Making Node (a node of the Department of Planning, Industry and
Environment Energy Efficiency Research Hub). The Node is a research collaboration
between CSIRO, University of Wollongong, and the University of New South Wales.
With the exception of photographs, the State of NSW and Department of Planning, Industry
and Environment are pleased to allow this material to be reproduced in whole or in part for
educational and non-commercial use, provided the meaning is unchanged and its source,
publisher and authorship are acknowledged. Specific permission is required for the
reproduction of photographs.
The Department of Planning, Industry and Environment (DPIE) has compiled this report in
good faith, exercising all due care and attention. No representation is made about the
accuracy, completeness or suitability of the information in this publication for any particular
purpose. DPIE shall not be liable for any damage which may occur to any person or
organisation taking action or not on the basis of this publication. Readers should seek
appropriate advice when applying the information to their specific needs.
All content in this publication is owned by DPIE and is protected by Crown Copyright, unless
credited otherwise. It is licensed under the Creative Commons Attribution 4.0 International
(CC BY 4.0), subject to the exemptions contained in the licence. The legal code for the
licence is available at Creative Commons.
DPIE asserts the right to be attributed as author of the original material in the following
manner: © State of New South Wales and Department of Planning, Industry and
Environment 2021.
Cover photo: Traffic at the southern entrance to the Domain Tunnel in Sydney, Matt Arkell,
licensed under the Creative Commons Attribution-Share Alike 2.0 Generic

Published by:
Environment, Energy and Science
Department of Planning, Industry and Environment
4 Parramatta Square, 12 Darcy Street, Parramatta NSW 2150
Phone: +61 2 9995 5000 (switchboard)
Phone: 1300 361 967 (Environment, Energy and Science enquiries)
TTY users: phone 133 677, then ask for 1300 361 967
Speak and listen users: phone 1300 555 727, then ask for 1300 361 967
Email: info@environment.nsw.gov.au
Website: www.environment.nsw.gov.au
Report pollution and environmental incidents
Environment Line: 131 555 (NSW only) or info@environment.nsw.gov.au
See also www.environment.nsw.gov.au
ISBN 978-1-922558-94-7
EES 2021/0227
June 2021

Find out more about your environment at:

www.environment.nsw.gov.au
Contents
List of figures                                              iv
List of tables                                                v
Executive summary                                            vi
List of shortened forms                                     viii
Introduction                                                  1
    Background                                                1
    Report objectives                                         1
Drivers of zero emission vehicle uptake                       2
    Availability of vehicle models and costs                 2
    Infrastructure drivers                                   7
    Disruptive business model drivers                        9
    Policy drivers                                          10
    Market trends in zero emission vehicles                 14
    Charging infrastructure and electricity grid            17
    Consumer preferences                                    20
Stakeholder perspectives                                    23
    Introduction                                            23
    Stakeholder mapping                                     23
    Current barriers to increased adoption of ZEVs in NSW   30
    Uncertainties on the adoption pathway for ZEVs in NSW   33
    Priority interventions                                  35
Appendix A      Stakeholder mapping methodology             37
References                                                  38

                                          iii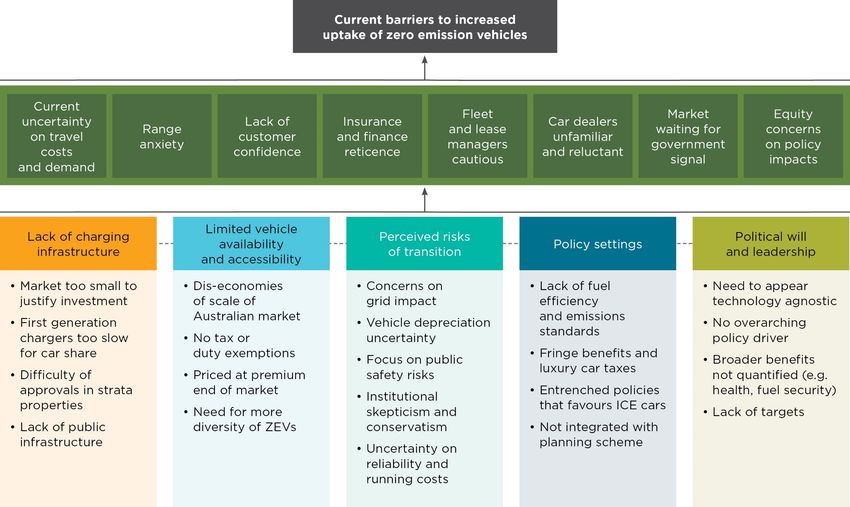
List of figures
Figure 1    Hyundai Nexo HFCV                                                       3
Figure 2    Projected future costs of electric vehicles                             4
Figure 3    Index of motor vehicle prices in Australia                              5
Figure 4    Passenger vehicle fuel consumption by year of manufacture               6
Figure 5    Standard hydrogen refuelling station configuration                      8
Figure 6    Electric vehicle sales in Australia (2011–2017)                        15
Figure 7    Electric vehicles sold by state and territory                          15
Figure 8    EV adoption per country (2011–2017)                                    16
Figure 9    Electric vehicle uptake by scenario, Australia                         16
Figure 10   Comparison of per-kilometre vehicle emissions in NSW in the year
            shown, for a new ICE, hybrid or electric vehicle                       19
Figure 11   Electricity consumption from electric vehicle charging                 20
Figure 12   Victorian consumer attitudes to EV prices                              21
Figure 13   Sydney households’ stated likelihood of next car being an EV, online
            survey of 568 households in Greater Sydney, 2018                       22
Figure 14   Overview of interview methodology                                      23
Figure 15   Stakeholder typology                                                   24
Figure 16   Public charging stations                                               27
Figure 17   Research collaboration on hydrogen fuel cell vehicles                  28
Figure 18   Direct and indirect influencers of ZEV adoption                        29
Figure 19   Customer interaction funnel                                            29
Figure 20   Innovation adoption curve                                              30
Figure 21   Summary of barriers to increased adoption of ZEVs in NSW               32
Figure 22   Future uncertainties on the adoption pathway for ZEVs in NSW           34
Figure 23   Priority interventions to increase ZEV uptake in NSW, as identified in
            stakeholder interviews                                                 36

                                         iv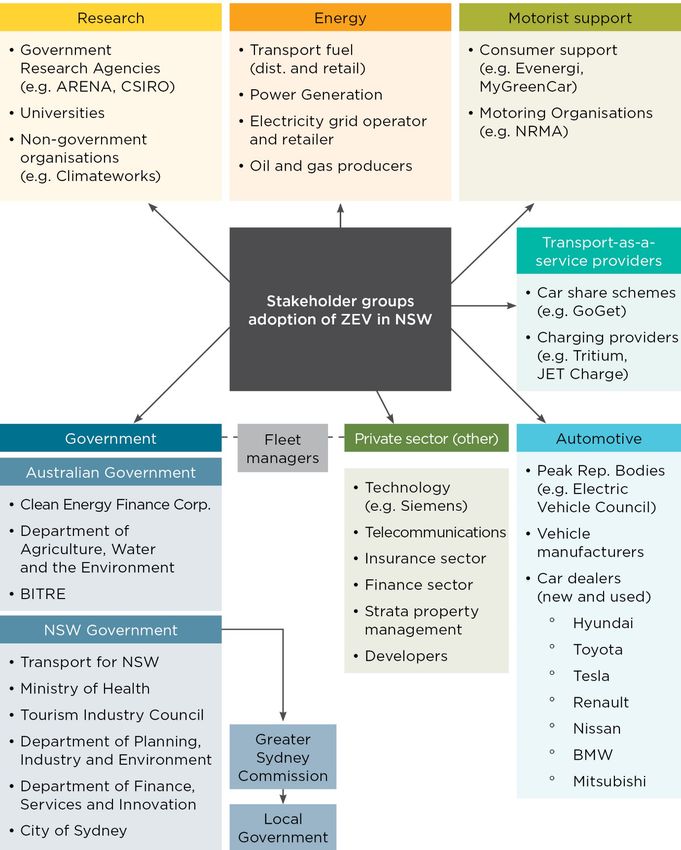
List of tables
Table 1   Recent, current and expected battery electric vehicle models
          available in Australia                                                    2
Table 2   Estimated home charging infrastructure costs                              7
Table 3   Emerging or potential disruptive business models to support electric
          vehicle adoption                                                          9
Table 4   Financial incentives for ZEVs – Commonwealth, state and territory
          governments                                                               10
Table 5   Key policy levers and expected impact on adoption rates                   12
Table 6   Local policies and programs to support EV uptake                          12
Table 7   Overview of support policies for electric vehicles in the Nordic region
          2017                                                                      13
Table 8   Overview of electric vehicle supply equipment policies in Nordic
          countries                                                                 13
Table 9   Overview of EV charger characteristics in different regions               18

                                       v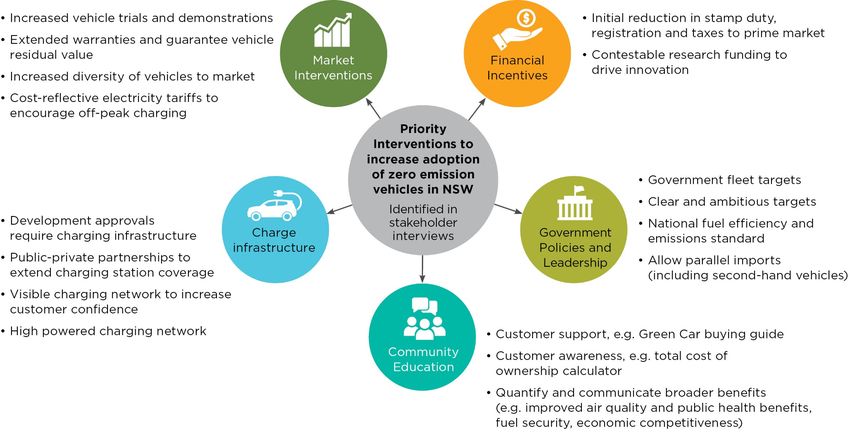
Barriers and incentives for transitioning to zero emission vehicles in NSW: Stakeholder perspectives & literature review

Executive summary
The adoption of low or zero emission vehicles can provide a cost-effective approach to
reducing greenhouse gas emissions in New South Wales, while also achieving other
benefits such as improved local air quality. Manufacturers are increasingly shifting to zero
emission vehicles (ZEVs) that have increased range and performance compared to earlier
generations of ZEVs. There has been a marked shift in the uptake of electric vehicles
globally, particularly in China and Norway, where financial and non-financial incentives have
driven rapid adoption. However, in New South Wales and the rest of Australia the market
share of ZEVs lags behind other developed economies.
This report, based on a literature review and stakeholder interviews, identifies the factors
that are likely to influence householders’ decisions on ZEVs when purchasing a new vehicle.
This provides insights for policy-makers on the barriers and incentives for NSW
householders when considering the purchase of a ZEV, such as an electric vehicle (battery
and plug-in hybrid) or hydrogen fuel cell vehicle.
Access to a wide choice of vehicle models is a strong expectation of vehicle consumers, but
is a challenge for new vehicle technologies to achieve. Australia currently only has a limited
number of ZEVs available for consumers at price points that are mostly higher than
comparable internal combustion engine (ICE) vehicles. The diversity of ZEVs will increase in
coming years, and appears to be associated with maturing markets in terms of sales, which
helps to drive customer demand and further sales.
ZEV costs are projected to decline, but price parity with ICE vehicles is likely to lag behind
international markets due to a lack of fuel efficiency and emissions standards in Australia.
Projections estimate that cost parity could be reached by 2025. The market for hydrogen fuel
cell vehicles is less developed than battery and plug-in hybrid electric vehicles; however,
they have the potential to be cost competitive with electric vehicles (EVs), particularly if the
hydrogen fuel becomes more widely used in the electricity sector or as an export industry,
and there is investment in refuelling infrastructure.
The accessibility of infrastructure is important to support the uptake of ZEVs, with people
preferring to charge primarily at home and work, but also needing the confidence that they
can access fast charging infrastructure for travel outside of the metropolitan area. The shift
to apartment dwelling in Sydney, where it might be more difficult to access a private charging
station, highlights the need for public charging stations in these more densely populated
areas where off-street parking can be limited.
The review also highlighted the need to plan for electricity distribution capacity in parts of the
network that are likely to experience high uptake of EVs. The impact of EVs on the daily load
profile and maximum demand depends on how and when they are charged. Charging is
likely to be influenced by the availability of public infrastructure, tariff structures, any energy
management systems, and the driver’s routine.
There is the potential for existing economic and infrastructure constraints on the increased
adoption of ZEVs to be disrupted by new business models that change the conditions under
which a customer might consider adopting a new technology. For example, businesses
could offer daytime parking with low cost charging in areas of the network with high solar
uptake. This would help to overcome the constraint that EV charging will likely be primarily at
home and overnight, which is poorly matched with solar generation, limiting the value of
electric vehicle charging to the grid.
Experiences in overseas jurisdictions highlight the importance of financial and non-financial
incentives in increasing adoption of ZEVs. In the Nordic countries, policy support has
significantly influenced EV adoption. Measures that reduce the purchase price of EVs are
the main driver.

                                                           vi
Barriers and incentives for transitioning to zero emission vehicles in NSW: Stakeholder perspectives & literature review
Currently in New South Wales only small and medium-sized EVs have a lower greenhouse
gas intensity per kilometre than the equivalent ICE vehicle; however, modelling of a selected
scenarios where the grid decarbonises over time demonstrated that over time the
greenhouse intensity of EVs is also likely to decline below that of ICE vehicles.
Consumer surveys in Australia have shown that a majority of households would be willing to
consider the purchase of an EV; however, for at least half of these households this
willingness is contingent on a reduction in the purchase price to closer to comparable petrol
and diesel cars.
The interviews with NSW stakeholders highlighted how different organisation types are
enabling the transition to ZEVs. It was highlighted that many of the current barriers can be
considered secondary to the primary barrier that the ZEV market in New South Wales is
immature and has diseconomies of scale, which leads to uncertainties and risk aversion.
Therefore, interviewees emphasised the importance of encouraging actions that enable the
ZEV market to reach a minimum threshold where the process for purchasing and operating a
ZEV can be normalised, and there is sufficient information to assess risks.
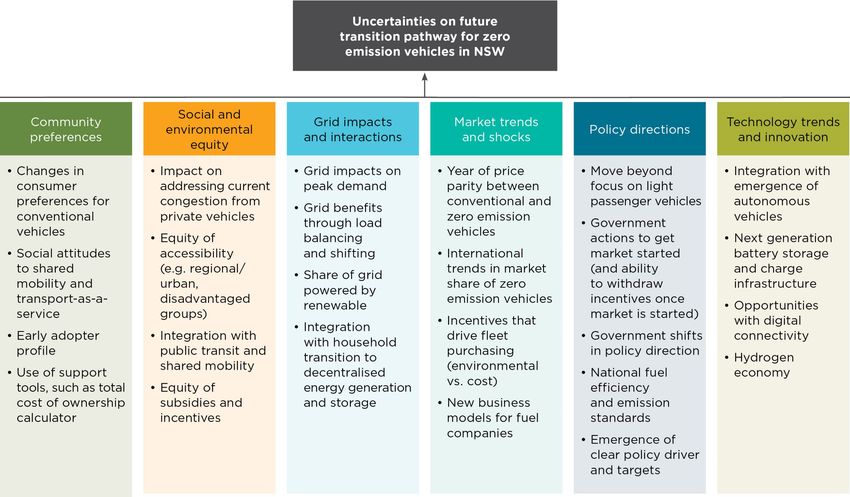
Stakeholders were also asked to identify future uncertainties that might influence the
adoption pathway for zero emission vehicles in New South Wales. It was noted that once
ZEVs reach cost parity there are still uncertainties around the potential customer demand,
and the willingness to give up petrol vehicles. Interviewees also noted that understanding of
the characteristics and motivations of the early adopters is still developing. It was highlighted
that future changes in governments’ policies and overall support for ZEVs is likely to
influence the adoption trajectory.
The need for a clear policy driver was highlighted, as at the moment there are a range of
policy drivers for ZEVs, but a policy driver needs to reach a point where it becomes a
preeminent priority that drives decisive government action. New South Wales and the rest of
Australia being relatively slow adopters of ZEVs provides an opportunity to learn from
implementation experiences in other countries, and also take advantage of second
generation technology, such as improved batteries and charging systems.
Stakeholders were also asked to identify priority actions to accelerate the adoption of ZEVs
in New South Wales. A number of interviewees highlighted that the setting of a clear vision
and aspirational targets can help increase adoption even without financial incentives that
subsidise the market. This government leadership would send a clear signal to the market
that would build the confidence of manufacturers in importing a greater number and diversity
of ZEVs, and investment in charging infrastructure. Another approach put forward to enable
the ZEV market in New South Wales, without direct government subsidies, was through the
support of research and community education programs. Other common suggestions on
priority actions for NSW Government leadership included the setting of ambitious ZEV
targets for department fleets, and supporting changes in the national vehicle fuel efficiency
standards and the removal of restrictions on parallel imports of second-hand vehicles.
vii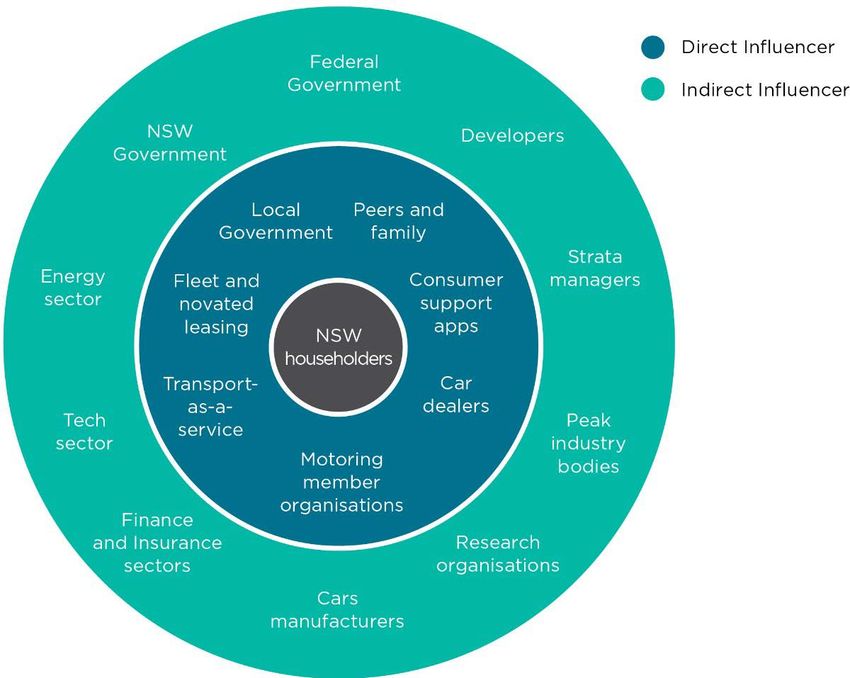
Barriers and incentives for transitioning to zero emission vehicles in NSW: Stakeholder perspectives & literature review

List of shortened forms
AC                 alternating current

AEMO               Australian Energy Market Operator

ARENA              Australian Renewable Energy Agency

BEV                battery electric vehicle

CO2-e              carbon-dioxide equivalent

CSIRO              Commonwealth Scientific and Industrial Research Organisation

DC                 direct current

EV                 electric vehicle

EVC                Electric Vehicle Council

FCEV               fuel cell electric vehicle

GHG                greenhouse gas

GWh                gigawatt hour

HFCV               hydrogen fuel cell vehicle

HMA                Hydrogen Mobility Australia
ICCT               International Council on Clean Transportation

ICE                internal combustion engine

IEA                International Energy Agency
km                 kilometre

kW                 kilowatt

kWh                kilowatt hour

NSW                New South Wales

PHEV               plug-in hybrid electric vehicle

ZEV                zero emission vehicle

                                                          viii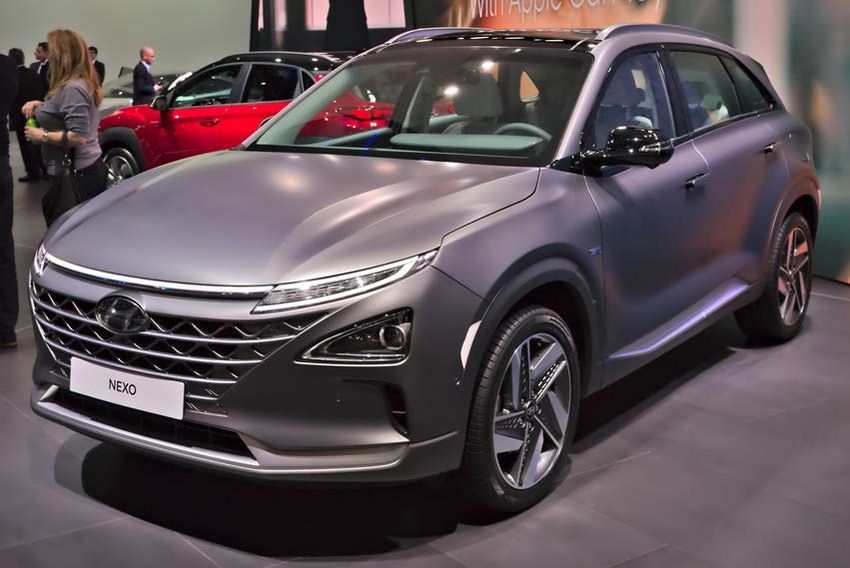
Barriers and incentives for transitioning to zero emission vehicles in NSW: Stakeholder perspectives & literature review

Introduction
Background
In 2016 the NSW Government released the Climate Change Fund Draft Strategic Plan
2017–2022 for public consultation. The Plan includes a number of potential actions to reduce
vehicle emissions, as it is recognised that improved vehicle fuel efficiency and a shift to
alternative low emission fuels are some of the lowest cost emission reduction opportunities
in New South Wales. Car manufacturers are increasingly producing alternative drivetrain
(e.g. hybrid or electric) and/or alternative fuel vehicles, while in overseas jurisdictions
ambitious targets have been set for transitioning to low emission vehicles. However, in New
South Wales and the rest of Australia, adoption of these vehicles is lagging behind other
countries. The design of more effective policies and market incentives to encourage the
adoption of energy efficient vehicles is impeded by a lack of understanding of the factors that
influence household vehicle purchasing behaviour.
To address this need, the NSW Department of Planning, Industry and Environment (DPIE;
former Office for Environment and Heritage), in partnership with the CRC for Low Carbon
Living, commissioned a project to improve understanding of incentives and barriers for the
adoption of zero emission vehicles. This project aims to better understand NSW householder
behaviour with respect to vehicle purchasing decisions to more accurately anticipate
responses to government interventions for zero emission vehicles.
The study will focus on vehicle purchasing decisions made by NSW households, and in
particular the factors that currently impede the adoption of zero emission vehicles and
potential incentives to overcome these barriers. The emphasis is on zero emission vehicles
(ZEVs) 1, in particular electric vehicles (EVs), which includes battery powered vehicles and
hydrogen fuel cell vehicles (HFCVs). More efficient vehicles that use conventional fuels,
including hybrids, are an important component of transitioning to lower emissions in New
South Wales; however, ZEVs represent a transformative change where there is greater
householder uncertainty around vehicle purchasing decisions, and a need to understand
effective policy incentives that could increase adoption and reduce road transport emissions
in New South Wales.

Report objectives
This report has the following objectives:
1. Undertake a thematic analysis of incentives and barriers for increased adoption of zero
   emission vehicles based on a literature review.
2. Based on interviews, represent stakeholders’ perspectives on barriers and incentives for
   NSW householders transitioning to zero emission vehicles.

1   Zero emission vehicles are defined as vehicles that have zero pollutant emissions from the tailpipe.

                                                           1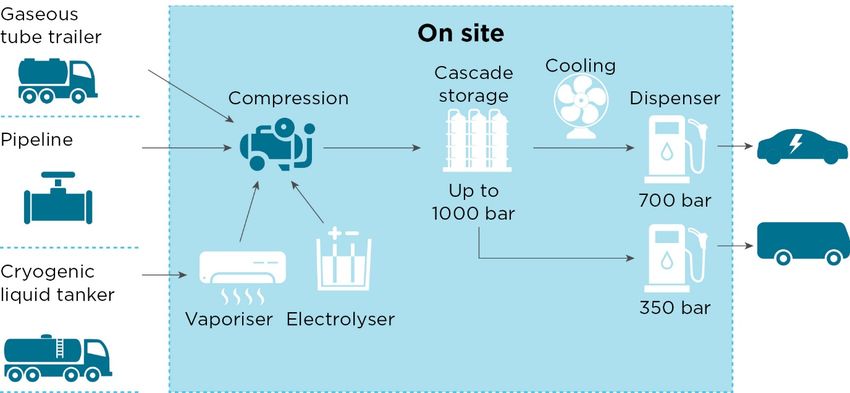
Barriers and incentives for transitioning to zero emission vehicles in NSW: Stakeholder perspectives & literature review

Drivers of zero emission vehicle uptake
Availability of vehicle models and costs
Model availability
Access to a wide choice of vehicle models is a strong expectation of vehicle consumers but
is a challenge for new vehicle technologies to achieve. Electric vehicle manufactures must
attract customers to a new type of vehicle but also simultaneously achieve economies of
scale in manufacturing so the unit cost of the vehicle is not too high. Finding such a balance
is difficult but research shows it is necessary. In the comprehensive review by Slowik and
Lutsey (2017) of electric vehicle adoption in the United States they conclude:
   We find a link between electric vehicle model availability and uptake. The five leading electric
   vehicle markets by volume, representing nearly half of all U.S. electric vehicle sales, each had
   at least 24 available electric vehicle models in 2016. Yet across the major U.S. markets, about
   half of the population has access to 10 or fewer electric models, and many dealerships have
   very low inventories of those models. Availability of more models across vehicle types, offered
   at a range of price points and passenger capacities, is an essential precursor to more
   substantial market development.
While clearly important for electric vehicle adoption, from a policy perspective it is not clear
how the NSW Government could directly target the availability of electric vehicle model
diversity. It appears to be associated with maturing markets in terms of sales, which helps to
drive customer demand and further sales.

Current costs of available ZEVs
Australia has only a limited number of electric vehicles currently available for sale. The
Nissan Leaf that was previously available for sale was removed from the new vehicle
market. Nissan intended to bring back a new model in around 2019 at significantly lower cost
(Table 1). Tesla and Renault will also have other models available within a year or so. Of
those that have been available it can be observed that longer range models were more
costly; however, it is difficult to establish whether this was due to additional batteries, as the
longer range models also tended to be marketed as sports vehicles, which attract a
premium. Certainly, where additional range is an option it has to be paid for.

Table 1       Recent, current and expected battery electric vehicle models available in Australia

 Model                                                         Range                     Approximate cost
 BMW i3                                                        190 km                    A$75,000
 Tesla Model S                                                 480 km                    A$105,000–207,000
 Tesla Model X                                                 489 km                    A$119,000–218,000
 Tesla Model 3                                                 350–500 km                NA
 Renault Zoe                                                   300 km                    A$45,000
 Renault Kangoo Maxi ZE (coming to market)                     120–200 km                A$46,000
 Nissan Leaf (previously available)                            Up to 240 km              A$55,000
 Nissan Leaf (coming to market)                                400 km                    NA
 Mitsubishi Miev                                               Up to 150 km              A$52,000
 Jaguar I-PACE (late 2018)                                     500 km                    A$120,000
 Hyundai EV Ioniq                                              280 km                    A$43,000
Sources: https://myelectriccar.com.au/evs-in-australia/; https://www.renault.com.au/electric;
https://www.tesla.com/en_AU/model3; https://www.carsguide.com.au/tesla/model-s/price;
https://www.carsguide.com.au/tesla/model-x/price

                                                           2
Barriers and incentives for transitioning to zero emission vehicles in NSW: Stakeholder perspectives & literature review
HFCVs are currently not available for purchase in Australia due to the lack of infrastructure
for refuelling; however, the ACT Government has ordered a fleet of 20 HFCVs (Hyundai
Nexo), along with a hydrogen refuelling station and service centre, which will provide a
demonstration of the hydrogen economy. The expected range for the Hyundai Nexo is
around 800 kilometres, but the pricing is uncertain at this stage.
Figure 1 Hyundai Nexo HFCV
Photo: Alexander Migl, CC BY-SA 4.0, via Wikimedia Commons
Future costs of ZEVs
Electric vehicles
To form a view about the likely change in the costs of electric vehicles several global
projection studies were compared. The most detailed projections available were from the
International Energy Agency (IEA) and the International Council on Clean Transport (ICCT)
(IEA 2017; Slowik and Lutsey 2016). They examined electric vehicles of different range
capabilities and in different global markets. The ICCT data shown in Figure 2 is a global
average. This source assumes the cost of internal combustion engine (ICE) vehicles will rise
in the European and United States vehicle markets due to emissions standards forcing
improved energy efficiency measures to be added to ICE vehicles. ICCT projects electric
vehicles will reach parity with ICE vehicles in 2025 or slightly sooner for 160–240 kilometre
(km) range vehicles (noting that this is only financial parity, not equivalent vehicle range).
Vehicles with a 320 km range or larger will reach financial parity later. This is a view well
aligned with Bloomberg New Energy Finance (BNEF 2017) who project parity between
electric and ICE vehicles between 2025 and 2029. The IEA (2017) is slightly less positive
with parity for 200 km range vehicles reached by 2030 but 350 km range vehicles reaching
that point some years after 2030.
3Barriers and incentives for transitioning to zero emission vehicles in NSW: Stakeholder perspectives & literature review
Figure 2 Projected future costs of electric vehicles
Our understanding of these global projections is that they are in the context of a comparison
to ICE vehicle costs that are increasing due to tightening vehicle fuel and emissions
standards that are in place in most developed countries outside Australia 2. In contrast,
Australian vehicle prices have been falling in real terms (Figure 3). The cost reductions in
Australia since the mid-1990s have been largely due to reductions in tariffs that began in the
mid-1980s and the subsequent greater competition as a result. For both commercial and
passenger vehicles import duties are currently 5% (or zero where we have a bilateral
agreement with specific countries). Luxury vehicles over a given threshold still pay 33%
import duty (the threshold is $75,000 for fuel efficient vehicles and $64,000 for all others). If
we assume these competitive import pressures are already at full force (particularly with
domestic manufacturing winding up), a flat Australian vehicle price is most likely in the
future. One driver of potentially higher prices is that the efforts to improve fuel efficiency in
overseas markets spills over into the cost of similar models in Australia. When the Climate
Change Authority (2014) studied the impact of international vehicle emissions standards it
did not consider this likely, arguing that manufacturers have shown already that they can
offer the same vehicle model but with different parts to achieve a less efficient lower cost
vehicle for Australia:
Australia imports 90 per cent of its new vehicles…, and almost 75 per cent of new vehicles come
from countries with mandatory standards in place. Nevertheless, the efficiency of Australian light
vehicles remains well behind most other markets. These differences in emissions intensity of the
Australian and other fleets are explained in part by the differences in the mix of models. Australia
has more large passenger vehicles than some countries… Even so, the variants of models
offered in Australia are often less efficient than the same model sold in other markets. The most
efficient variants of some models available in Australia consume about 20 per cent more fuel on
average than the most efficient variant of the same make and model available in the UK.
2 In practice, achieving fuel efficiency improvements in ICE vehicles requires manufacturers to install additional or
substitute items from a range of alternative vehicle parts that deliver higher fuel efficiency. The options for
improving fuel efficiency are already known (do not require significant new research) and range from a few
hundred dollars to a few thousand dollars. See, for example, Table 14 in ABMARC (2016).
4Barriers and incentives for transitioning to zero emission vehicles in NSW: Stakeholder perspectives & literature review
If we plot a flat Australian ICE vehicle price, the timing for electric and ICE vehicle cost parity
in Australia will be delayed by a number of years, compared to international markets,
depending on the vehicle range type. As part of Australia’s national transport projections
DoEE (2016) assumed electric and ICE vehicle cost parity in Australia 2025. The DoEE
(2016) assumption for Australian parity only aligns with the international projections for the
shortest range electric vehicles (160 km), which no longer appear to be popular models (see
previous section), with most new Australian models adding more range.
Figure 3 Index of motor vehicle prices in Australia
Source: ABS (2018)
Fuel cell hydrogen vehicle costs
A number of sources have previously identified that FCHVs are likely to converge towards
the cost of long range electric vehicles (e.g. EIA 2016). At present while long range electric
vehicles are in the market, there are relatively limited fuel cell vehicles available, especially
in Australia. Consequently, in order for their costs to converge, FCHVs will need a period of
faster cost reduction over the next decade to catch up. They may achieve that in part
because they can use the same electric drivetrain as a long range electric vehicle. Any cost
reductions achieved in that part of the vehicle will automatically be available to FCHVs.
Like batteries, hydrogen fuel cells have broader applications in the electricity sector,
providing grid reliability services that may partly drive improvements in the cost of hydrogen
(e.g. through wider application of electrolysers and fuel cell system costs).
It is likely that fuel cell vehicles are able to compete with long range electric vehicles in the
long run, particularly if hydrogen fuel becomes more widely used such as in the electricity
sector or as an export industry 3.
3 A pilot project is underway in Victoria to explore this opportunity.
5Barriers and incentives for transitioning to zero emission vehicles in NSW: Stakeholder perspectives & literature review
Fuel costs
Although the fuel efficiency of new ICE light vehicles has improved at 2–3% per annum
under the current test cycle, average fleet performance data indicates that the real on-road
fuel efficiency improvement has been closer to 1% per annum. Figure 4 shows the change in
fuel efficiency for the Australian passenger fleet for vehicles manufactured from 1994–2000,
2001–2010 and 2011 onwards. This shows that for petrol-fuelled vehicles, which make up
more than 85% of the passenger fleet, there has only been a marginal reduction in average
fuel consumption. The diesel-fuelled passenger fleet, which has increased rapidly with 52%
of vehicles added after 2010, has become more fuel efficient.
Figure 4 Passenger vehicle fuel consumption by year of manufacture
Source: ABS (2017) Survey of Motor Vehicle Use, Australia, 12 months ended
30 June 2016.
Additional fuel efficiency is achieved through adoption of electric and fuel cell vehicles. Both
electricity and liquid fuels have upstream energy losses. In liquid fuels it is in the transport of
liquids and their conversion from crude products into refined fuels, while for electricity, it is in
the conversion of fossil fuels or renewable resources into electricity and in transmission and
distribution losses. In the case of liquid fuels the energy losses are far greater in-vehicle with
low final conversion efficiencies of around 20%, while for electricity, the least efficient parts
of the energy conversion processes occur upstream and in-vehicle energy conversion is high
(e.g. electric motor efficiency is around 90%). Because of this difference in the location of the
energy conversion losses, electricity displaces around three times the amount of refined
liquid fuel for each joule of energy required in-vehicle. This translates to significant
reductions in fuel costs compared to ICE vehicles.
Compared to electric vehicles, fuel cell vehicles have additional losses in the hydrogen
production and fuel cell energy conversion process compared to batteries (with significant
variation depending on the hydrogen primary energy source). As a consequence, assuming
electrolysis as the hydrogen source, fuel cell vehicles require around 50% more watt hours
of electricity per kilometre.
Other vehicle costs
Besides the fuel and upfront costs of a vehicle there are a number of other ongoing costs
that contribute to the whole cost of travel by light vehicle. In New South Wales, the light
vehicle annual registration fee for private use is $66 with additional motor vehicle tax based
6Barriers and incentives for transitioning to zero emission vehicles in NSW: Stakeholder perspectives & literature review
on the vehicle weight, which ranges from $211/year for small vehicles (up to 975 kilograms
(kg)) to $457/year for extra-large vehicles (1505–2504 kg). The NSW motor vehicle tax is
reduced by around $20–30 (depending on weight) if the vehicle meets the following criteria:
Manufacturer designated petrol-electric hybrid, diesel-electric hybrid, plug-in hybrid, or electric
vehicles with CO2 emissions no higher than 150 grams/kilometre (g/km) in the ‘combined’
driving cycle.
Eligible lower taxed vehicles based on Green Vehicle Guide rating of 4½ or 5 stars (rating
scheme now discontinued) are eligible for the lower tax.
For internal combustion maintenance costs, ATAP (2016) advises 6.1c/km, 7.1c/km and
5.7c/km for small, medium and large light vehicles, respectively. These include repairs and
maintenance which in modern vehicles is not high in the first five years of life and repairs
may be covered under warranty. Electric vehicle maintenance costs are assumed to be half
that of ICE vehicles 4. Electric vehicles will incur tyre and other minor costs but will save on
some oils, brakes (due to regenerative brake) and on scheduled vehicle parts checks given
the much smaller part count 5. Alternative drivetrain repairs or accident costs would be dealt
with under warranty and insurance.
Infrastructure drivers
For electric vehicles the key infrastructure drivers are:
• convenient location for a charging terminal in the home garage or a frequently used
daytime parking area for passenger vehicles and at parking or loading areas for
business vehicles such as light commercial vehicles, trucks and buses. Use of this
location may or may not require significant electric works
• whether the residence or business has ownership or other extended tenancy of the
building or site and intention to stay at that location to get a longer-term payoff from the
upfront costs of installing the charger
• convenient access to highway recharging for owners without access to extended range
capability (or other options, see below)
• access to different models of electric vehicles (e.g. fully electric limited range, fully
electric long range, electric drivetrain with fuel cell/hydrogen electric storage) with
different driving ranges to suit diverse customer travel needs
• convenient access to other means of transport such as a second car in the household,
car/ride sharing, train station, airport and hire vehicles for longer range journeys.
Table 2 provides indicative costs of purchasing and installing in-home charging
infrastructure.
Table 2 Estimated home charging infrastructure costs
Charger type Purchase Installation Electricity Approx.
cost cost costs charge cost
per 100 km
16A (3.6kW) single phase $1,320 ~$800 ~$0.25 kWh $3.88
Type 2 $1,760 ~$1,000 ~$0.25 kWh $3.88
(3 phase, 32A, 22kWh)
Source: Cost of charging your electric car; assumes 2019 Nissan Leaf
4 AEMO and Energeia (2016) assume 51%.
5 VACC (2018) reports a ratio of 17 to 2000 moving parts in electric vehicles compared to ICE vehicles.
7Barriers and incentives for transitioning to zero emission vehicles in NSW: Stakeholder perspectives & literature review
Sufficient electricity distribution network capacity to meet coincident charging requirements
of parts of the network with a high share of electric vehicles could also be an infrastructure
constraint if not well planned for. However, networks are obligated to expand capacity to
meet load where needed, so any such constraints would only be temporary.
Sydney, like other Australian cities, is generally observing a trend towards apartments rather
than separate dwellings. This is expected to result in a lower share of customers with access
to their own garage space (but perhaps ameliorated by older more established households
being more likely to live in separate dwellings). There has also been recent evidence of a fall
in home ownership, especially amongst younger age groups. For electric vehicles these
trends might also work towards lower adoption as denser cities tend to encourage greater
uptake of non-passenger car transport options and car/ride sharing services which result in
fewer vehicles.
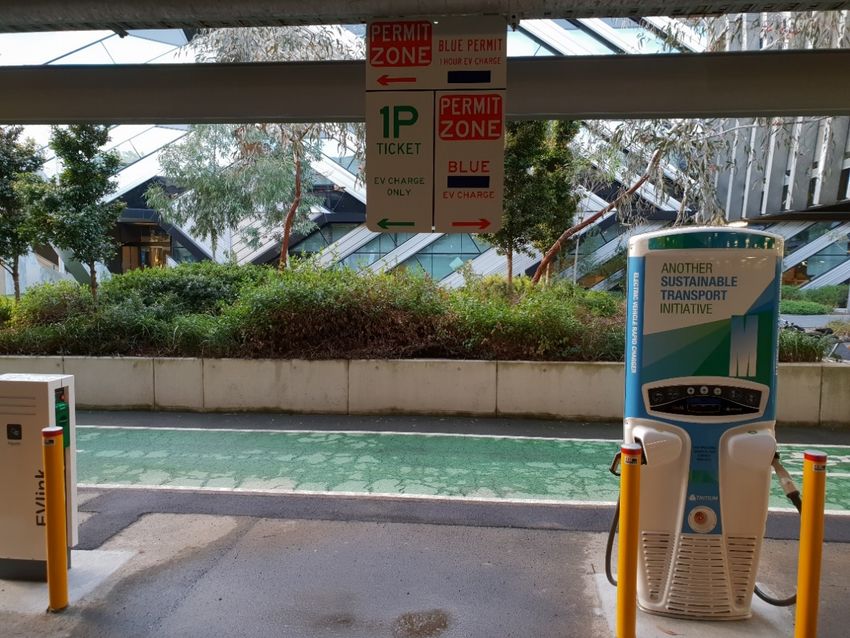
CSIRO’s National Hydrogen Roadmap detailed the opportunities for hydrogen fuel cell
electric vehicles (FCEVs) as a complementary technology to battery electric vehicles (BEVs)
(Bruce et al. 2018). FCEVs may be more suited to consumers who travel longer distances as
the expected range of an FCEV with a 6 kg tank is 500–800 km. Also, FCEVs may be suited
to consumers who don’t have access to BEV charging infrastructure (e.g. apartment
dwellers) or require shorter refuelling times. However, hydrogen refuelling infrastructure is
critical for the uptake of FCEVs in Australia. In the United States investment in hydrogen
fuelling infrastructure has mostly been from government agencies, with the costs of
developing stations varying from $1.8 to $5.9 million.9 Figure 5 shows a standard
configuration for a hydrogen refuelling station, with the key difference being the hydrogen
delivery method, dispenser pressure and capacity. The high operating pressures at which
hydrogen is delivered require additional equipment considerations. To enable a fast fill the
hydrogen needs to be pre-cooled to –40°C prior to dispensing, which increases the
electricity demand. Also, due to the precise temperature range required, control systems are
needed to monitor the volume, temperature, flow rate and pressure (Bruce et al. 2018).
The rollout of hydrogen refuelling stations is likely to require a high degree of coordination
between vehicle manufacturers and infrastructure providers to ensure the provision and
location of stations supports a developing market. The first refuelling stations are likely to be
co-located with existing petrol stations, and clustered in areas where there are likely to be
early adopters, to build customer confidence. Once the refuelling infrastructure is sufficient to
service metropolitan areas, the next focus would be on supporting inter-city travel by
investing in hydrogen fuelling stations along major highways (Bruce et al. 2018).
Figure 5 Standard hydrogen refuelling station configuration
Source: Bruce et al. (2018), p.40.
8Barriers and incentives for transitioning to zero emission vehicles in NSW: Stakeholder perspectives & literature review
Disruptive business model drivers
New business models can disrupt economic and infrastructure constraints by changing the
conditions under which a customer might consider adopting a technology. The business
models that are relevant could address either the cost and availability of charging the electric
vehicle, or the cost of the vehicle. Table 3 explores some emerging and potential business
models that could drive higher adoption of electric vehicles and our rating of how soon we
expect them to emerge.
Table 3 Emerging or potential disruptive business models to support electric vehicle
adoption
Business model name Business model description Constraint reduced
Reasonable cost public Some businesses may offer public Access to electric vehicle charging
charging on-street charging facilities as an will be primarily at the home or
additional amenity to encourage business owner’s premises,
patronage of their core business or limiting the ability of people without
as a business on its own off-street parking to adopt EVs
Rating: near-term
Solar matched public Businesses offer daytime parking Electric vehicle charging will be
charging with low cost-controlled charging primarily at home and overnight,
and provide voltage control poorly matched with solar, limiting
services to the network in high the value of electric vehicle
solar uptake areas charging to the grid
Rating: medium-term
Electric vehicle battery Electric vehicle batteries are sold Electric vehicle batteries are costly
second life as low cost home batteries as a to replace
second life application
Rating: medium-term
Car/ride sharing and Car/ride sharing and vehicle Electric vehicles will be
automation1 automation could lead to electric predominantly used for private
vehicle investment being led by purposes by the vehicle owner and
businesses that will achieve very the return on their investment will
high vehicle utilisation and lower be governed by that user’s travel
whole of life transport costs per patterns
kilometre
Rating: medium-term
Electric vehicles as a Home energy management Using the battery capacity in your
home energy service service companies supply and electric vehicle for home energy
package operate integrated electric vehicle, management would be
rooftop solar, battery storage, and complicated to set up and may
HVAC and water heating home void equipment warranties that
management packages were designed for isolated
Rating: long-term operation
1While increasing the kilometres travelled via electric vehicles, this may potentially reduce the number of electric
vehicles overall since this business model involves fewer cars but with each car delivering more kilometres.
It should be noted that even the best business model innovations still require that the cost of
the service can be fully recovered through direct price or indirectly through sale of a co-
product (e.g. the parking space itself or other services available at the location). For example,
highway electric vehicle fast charging that may have a cost of over $100,000 to install will
struggle to pay back that investment without charging a premium for electricity if there are too
few customers on that highway route 6. As such it would be reasonable to expect that nearly
6 The premium per fuelling increases from $8 per fill for a charger with five customers a day to $40 for a charger
receiving only one customer per day on average throughout the year. Assumptions: 10-year financing period at
7% per annum.
9Barriers and incentives for transitioning to zero emission vehicles in NSW: Stakeholder perspectives & literature review
all charging infrastructure is initially uneconomic before electric vehicles increase their fleet
share (existing private sector charging infrastructure should be considered examples of
advertising rather than of future business models). However, even once electric vehicles
reach higher market shares, there may remain parts of the road transport system where
businesses cannot deliver economically viable charging infrastructure.
Policy drivers
Current incentives for ZEVs in NSW
As noted previously, New South Wales provides a minor reduction (~$20–30) in annual
motor vehicle tax if the vehicle has CO2 emissions of less than 150 g/km in the combined
driving cycle. The City of Sydney offers a discount for residential parking permits based on
the Green Vehicle Rating based on tailpipe CO2 g/km for the combined driving cycle. For
vehicles with emissions less than 112 CO2 g/km the annual parking permit cost is $41, which
goes up to $159 for vehicles that emit 260 CO2 g/km.
Incentives for ZEVs in other Australian jurisdictions
Victoria and the Australian Capital Territory provide incentives for ZEVs. Victoria provides a
$100 discount on annual registration fees for electric vehicles. This represents an ongoing
subsidy of electric vehicles relative to other vehicle types. Other states offer similar policies
including stamp duty discounts (Parliament of Victoria 2018, p.51). The Australian Capital
Territory’s policy offers the greatest financial incentive. Average environmental performance
vehicles 7 at or below $45,000 are normally subject to a 3% stamp duty. A 5% stamp duty is
applicable for each dollar above $45,000. Electric vehicles registered for the first time are
exempt from this stamp duty. This application of different stamp duty rates to new vehicles is
an approach unique to the Australian Capital Territory. It amounts to an upfront subsidy of
$1350 on a $45,000 electric vehicle or $2110 on a $60,000 electric vehicle. Table 4 provides
an overview of financial incentives for ZEVs across Australian jurisdictions, which highlights
that reductions in stamp duty and registration are the most commonly applied incentives.
Table 4 Financial incentives for ZEVs – Commonwealth, state and territory
governments
ACT NSW NT QLD SA TAS VIC WA Cwth
EV sales per 10,000 21 10 1 6 22 3 10 8 7
vehicles (2017)
Stamp duty, registration
& tax discounts
Financial incentives
Direct vehicle subsidy
Fleet incentive
Charging infrastructure
incentive
Toll and parking
discounts
Key: – policy in place; – policy under consideration.
Source: ClimateWorks Australia (2018).
7The corresponding rates for below and above average performance vehicles (but not fully electric) are 4% with
a step up to 6% and 1% with a step up to 2% for every dollar above $45,000; see Duty payable upon registration
or transfer of a motor vehicle. See also Australian Capital Territory (2018).
10Barriers and incentives for transitioning to zero emission vehicles in NSW: Stakeholder perspectives & literature review
Development of a national vehicle emissions intensity standard
Since 2015 the Ministerial Forum on Vehicle Emissions has been established to work on the
goal of addressing emissions from vehicles. The process has so far concluded, through a
draft regulatory impact statement, that standards to improve fuel efficiency and reduce
greenhouse gas (GHG) emissions would likely lead to lower costs of travel for consumers.
The work of the forum continues and is focusing on policy design issues. This process could
eventually result in a legislated vehicle emissions standard. Depending on the exact policy
mechanism and the stringency of the standard that is set, such a policy could provide
incentives for vehicle suppliers to produce more electric vehicles to meet the regulated
standard.
In other countries, and being considered in Australia, a multiplier is applied to electric
vehicles such that sale of one electric vehicle counts as more than one vehicle for
compliance calculation purposes. This encourages suppliers to cross-subsidise electric
vehicles over other ways of meeting the targets.
The precise impact of any emissions standards depends on the reduction target and the
relative costs of different vehicle types in meeting the standard. A weak standard could
potentially be met by low cost improvements in ICE vehicles alone for a significant period,
particularly given our ICE fleet is starting from a position of relatively poor fuel efficiency.
However, as the global costs of electric vehicles approach that of ICEs, thus discouraging
manufacturers from pursuing further improvements in ICEs, electric vehicles might become
the main means of meeting any emissions standard and their sales might exceed that
required by the standard.
Policy incentives in international jurisdictions
The following describes some examples of policy incentives from overseas that have been
used to influence the uptake of ZEVs. The successful adoption of a policy often relies upon
the confluence of technology breakthrough, policy imperative and political will. The 2015
United Nations Climate Change Conference in Paris led to a number of countries
announcing more ambitious goals to reduce vehicle emissions. Norway, the Netherlands,
France, Germany, the United Kingdom, China and India have all made announcements
indicating an ambition to eventually phase out the production and sale of fossil fuel vehicles
(World Economic Forum 2018).
Greene et al. (2014) highlighted the difficulty of developing policies to support the transition
to ZEVs while there are still considerable market and technological uncertainties. They
argued for an adaptive approach to policy-making with regular policy reviews to ensure they
incorporate improving knowledge on both the market and technology. ClimateWorks (2018)
highlighted that policy makers should consider availability of ZEVs for both the new and
second-hand car markets. The second-hand car market will emerge as ZEV uptake
increases, which will offer a broader range of price points for potential purchasers, but a
current impediment for consumers to adopt ZEVs is uncertainty around residual values.
Energeia (2018) undertook a benchmarking of international markets to identify the influence
of financial and non-financial incentives in encouraging the adoption of plug-in hybrid electric
vehicles (PHEVs). While this analysis of incentives focused on PHEVs, the findings are
relevant for considering more broadly, policy levers that might drive increased adoption of
ZEVs in New South Wales. Table 5 highlights the outcomes of this international
benchmarking study.
11Barriers and incentives for transitioning to zero emission vehicles in NSW: Stakeholder perspectives & literature review
Table 5 Key policy levers and expected impact on adoption rates
Policy lever Description Estimated impacts
Vehicle efficiency regulations Implementation of 105 g/km 200–300% increase based on
CO2-e fuel efficiency standard US experience
Parallel import regulations Allowing third party imports of 200% increase in model
EVs to increase model availability, 800% increase in
availability uptake based on New Zealand
experience
Purchase incentives Direct financial incentives to ~$4000 incentive increases
reduce purchase price model availability by 20%, and
increases uptake
Government fleet targets Fleet targets to provide initial 1 new vehicle introduced to the
economies of scale to bring market per 500 EVs added to
vehicles to market fleets
Public charging infrastructure Investment in public charging Investment in public charging is
availability infrastructure (DC fast correlated with high levels of
chargers) EV market share
Source: Energeia (2018)
The ICCT noted that EV uptake is disproportionally concentrated in a relatively small number
of cities, with 14 metropolitan areas accounting for almost a third of global EV sales. This
highlights the importance of local policies and programs for supporting the transition to ZEV,
which are targeted to the local context. Table 6 provides some examples of programs
implemented in cities with high uptake of EVs. It was highlighted that in these cities there
were often supporting actions across a range of areas (e.g. fleet targets, financial incentives,
charging infrastructure, etc.) that helped to drive adoption.
Table 6 Local policies and programs to support EV uptake
Local policies or programs Example city Details
City fleet goal Los Angeles Half of city fleet electric as of
2017
Electric car share program Paris Share car program had 4000
vehicles and 6000 charging
points
Free public charging Oslo Free charging with renewable
energy
EV friendly building and London 20% of new parking spots have
parking codes EV charging
Priority lane access San Francisco EVs can use carpool lanes and
reduced bridge tolls
Parking benefits Amsterdam EVs access to free public
parking and priority for permits
Public bus electrification Shenzhen All buses zero emission by
2017
Source: ICCT (2017)15
In the Nordic countries, policy support has significantly influenced electric car adoption.
Measures that reduce the purchase price of electric vehicles are the main driver. Other
important measures are reduced circulation taxes and local incentives, including waivers or
12Barriers and incentives for transitioning to zero emission vehicles in NSW: Stakeholder perspectives & literature review
partial exemptions on road use charges, free parking or access to bus lanes. Table 7 and
Table 8 summarise various support policies in place in Denmark, Finland, Iceland, Norway
and Sweden.
Table 7 Overview of support policies for electric vehicles in the Nordic region 2017
Waivers on
EV use and circulation access
EV purchase incentives incentives restrictions
(e.g. tolls, parking,
Registration tax/
Waivers on fees
Registration tax
(company cars)
VAT exemption
Free/dedicated
Circulation tax
Circulation tax
Access to bus
sale rebates
Tax credits
Tax credits
(excl. VAT)
exemption
exemption
parking
rebates
ferries)
lanes
Country
Denmark
Finland
Iceland
Norway
Sweden
Legend: ■ No policy ■ Local council policy ■ National policy
Table 8 Overview of electric vehicle supply equipment policies in Nordic countries
Regulations Direct investment Fiscal advantages
development
Deployment
Research &
regulations
accessible
accessible
chargers
chargers
chargers
chargers
Building
Publicly
Publicly
Private
Private
target
Country
Denmark
Finland
Iceland
Norway
Sweden
Legend: ■ No policy ■ Local council policy ■ National policy
There have been three main policy developments in China that are expected to have a
positive impact on the uptake of EVs. First, in late 2017 China’s government issued a new
energy vehicle (NEV) credit mandate that commenced in 2018. The mandate sets a
minimum requirement for the car industry for the production of ‘new energy vehicles’
(PHEVs, BEVs and FCEVs), with some flexibility offered through a credit trading
mechanism. Annual mandatory minimum requirements on the number of NEV credits that
need to be earned are set for car manufacturers, and these credits can be traded (i.e.
13Barriers and incentives for transitioning to zero emission vehicles in NSW: Stakeholder perspectives & literature review
manufacturers with excess credits can sell to manufacturers in deficit). NEV credits can only
be earned if the vehicle meets minimum range requirements, and depend on the vehicle’s
range and energy efficiency level. The number of credits allocated is also capped at a
maximum for each vehicle type.
Second, the National Electric Vehicle Subsidy Program grants subsidies for the purchase of
electric cars. The level of subsidy allocated depends on three characteristics: the vehicle
range in kilometres; energy efficiency in kilowatt hours per 100 km (kWh/100 km); and
battery pack energy density in watt hours per kilogram (Wh/kg).
Third, in late 2017 China also reportedly considered a national ban on the production and
sales of ICE cars running on gasoline and diesel, although the announcement did not specify
details on the timeline of such a ban (IEA 2018).
Closer to Australia, the New Zealand Government announced its Electric Vehicles
Programme in late 2016. This included measures to increase the number of electric vehicles
in New Zealand and has a goal of reaching approximately 64,000 electric vehicles by the
end of 2021. The Electric Vehicles Programme includes a number of initiatives:
• extending the road user charges (RUC) exemption on light vehicles until they make up
2% of the light vehicles fleet (saves the average electric vehicle driver approximately
$600 per vehicle each year)
• RUC exemption for heavy electric vehicles until they make up 2% of the heavy vehicle
fleet (saving is significant but dependent on the type of vehicle and the distance it
travels in a year)
• government and the private sector to investigate the bulk purchase of electric vehicles
(New Zealand Government Procurement (NZGP) added 15 new electric vehicle models
to the government vehicles contract to support the uptake of electric vehicles)
• New Zealand Transport Agency (NZTA) to work closely with local and central
government agencies, power companies, technology providers and the motor industry to
produce guidance on public charging infrastructure for electric vehicles
• $1 million annually for a nationwide electric vehicle information and promotion campaign
over five years
• contestable fund of up to $6 million per year to encourage and support innovative ZEV
projects
• allow electric vehicles into special vehicle lanes on the state highway network and local
roads
• review of tax depreciation rates and the method for calculating fringe benefits tax for
electric vehicles, to ensure electric vehicles are not being unfairly disadvantaged
• review levies for plug-in hybrid electric and electric vehicles
• established the Electric Vehicles Programme Leadership Group to champion the
program and proactively promote the initiatives within it. It will share information
between central and local government and industry, and provide feedback to test ideas
and decisions before they are put into practice.
Market trends in zero emission vehicles
Market share of zero emission vehicles in NSW and Australia
Figure 6 shows the sale of PHEVs and EVs in Australia over the period 2011 to 2017
(ClimateWorks Australia 2018). This shows there was a marked increase in PHEV and EV
sales in Australia from 2016 to 2017; however, Figure 7 shows the market share of EVs in
overall vehicle sales is still very low. In New South Wales only 10 cars in every 10,000 sold
(2011–2017) were EVs.
14Barriers and incentives for transitioning to zero emission vehicles in NSW: Stakeholder perspectives & literature review
Figure 6 Electric vehicle sales in Australia (2011–2017)
Source: ClimateWorks Australia (2018)
Figure 7 Electric vehicles sold by state and territory
Source: ClimateWorks Australia (2018)
Global trends in the zero emission market
In 2017, global sales of electric cars crossed the threshold of 1 million units (1.1 million). The
rate of growth of sales picked up in 2017, registering a year-on-year increase of 54%,
compared with 38% in 2016 (IEA 2018). Figure 8 shows trends in EV adoption by country,
showing there has been a significant shift in two markets – China and Norway. Norway has
the highest per capita share of EVs with 40% of new vehicle sales now being EVs (see
previous summary). China now accounts for around half of the global EV stock, which is
being driven through a range of incentives and mandated policies.
15Barriers and incentives for transitioning to zero emission vehicles in NSW: Stakeholder perspectives & literature review
Figure 8 EV adoption per country (2011–2017)
Source: International Energy Agency (2018)
Zero emission vehicle outlook
The most recent zero emission vehicle outlook for Australia was work completed by CSIRO
(Graham et al. 2018) for the Australian Energy Market Operator (AEMO) as part of the recent
Electricity Statement of Opportunities. This work focused on EVs and PHEVs and modelled
slow, moderate and fast scenarios that differ based on assumptions about future costs of
electric vehicles, saturation rates of EVs as a proportion of sales, adoption of car/ride sharing,
and other assumptions about economic, household income and population growth.
Under these scenarios (Figure 9), the uptake of EVs accelerates between 2025 and 2030
with the timing dependent on the scenario.
Figure 9 Electric vehicle uptake by scenario, Australia
Source: Graham et al. (2018)
16Barriers and incentives for transitioning to zero emission vehicles in NSW: Stakeholder perspectives & literature review
Charging infrastructure and electricity grid
Charging infrastructure
Charging technology for EVs has evolved over time. The three main characteristics that
differentiate chargers from one another include:
• level – the power output range of the electric vehicle supply equipment (EVSE) outlet
• type – the socket and connector used for charging
• mode – the communication protocol between the vehicle and the charger.
Table 9 provides an overview of the most prevalent charging standards (with details on level,
current, power rating and types, i.e. sockets and connectors) for various global regions.
In general, Level 3 public charging infrastructure has been moving towards direct current
(DC) to reduce the amount of charging time for an EV. For example, the NRMA network
being rolled out in New South Wales (more discussion below) has 50 kW chargers that can
charge an EV to 80% of its capacity in 30 minutes. The current focus for Tritium is high
powered charging in the 350–500 kW range to charge an EV to 80% of its capacity in 7–8
minutes. These power ranges are likely to result in higher grid connection costs for
infrastructure providers that may vary significantly depending on location.
In New South Wales, the NRMA is currently establishing a regional network of 40 fast
charging stations. This network will double the number of fast chargers in the state and when
completed will be able to cover more than 95% of NRMA member road trips. This fast
charging network is designed to support the transition to ZEVs by helping to address the
barrier around range anxiety, where people are concerned they will not be able to complete
their normal trips in a fully electric vehicle, especially outside of the metropolitan area.
Zero vehicles and the electricity grid
Comparing the GHG emissions of new light vehicles offered for sale in Australia (e.g. the
Green Vehicle Guide) is usually done on the combined test results from the ADR 81/02 test
cycle. This comparison is usually made on tailpipe CO2 emissions. Accordingly, EVs and
HFCVs are zero emission vehicles using this approach.
For a better understanding of the broader GHG emission implications of ZEVs 8 relative to
ICEs, we can amend electric vehicle emission intensity to include indirect emissions from
electricity generation. The calculation of per-kilometre new vehicle emissions for ICEs and
EVs over the projection period requires a number of assumptions:
• selection of comparable models for ICE, hybrids and electric vehicles
• the fuel efficiency of new ICE, hybrids and electric vehicles and how that will change
over time
• the emission intensity of grid electricity and how that will change over time.
The grid intensity of electricity in New South Wales is calculated from the neutral scenario
from the Integrated System Plan (AEMO 2018b). It only includes direct combustion
emissions from electricity, not those associated with extraction of fuels for electricity supply.
Fugitive emissions from coal and gas extraction are one example of indirect emissions;
however, these are small and declining over time as the generation mix changes.
8For this comparison we use an EV as the ZEV example due to a lack of current HFCV models in New South
Wales.
17You can also read