Summary of Natural Catastrophe Events 2018 - Willis Re eVENTTM Update Insured losses and economic impact due to natural disasters Volume 7 ...
←
→
Page content transcription
If your browser does not render page correctly, please read the page content below

Summary of Natural
Catastrophe Events 2018
Willis Re eVENTTM Update
Insured losses and economic impact due to
natural disasters
Volume 7
Natural Catastrophes in 2018 i
Table of contents
Map of major natural catastrophes in 2018 ................................................................................................... iii
Contact us .....................................................................................................................................................iv
Introduction.................................................................................................................................................... 1
1. In focus ...................................................................................................................................................... 2
            California: A year of wildfires ........................................................................................................... 2
            Hurricane Michael: Could losses have been larger? ....................................................................... 3
            An active but not unexpected year of natural catastrophes in Japan .............................................. 4
            Latin America and the Caribbean: 2018 losses not a patch on 2017 .............................................. 5
            The strongest tropical cyclone to hit the Arabian Peninsula ............................................................ 6
2. Major natural catastrophes in 2018 .......................................................................................................... 7
3. Other natural catastrophe events by peril and location .......................................................................... 42
Abbreviations .............................................................................................................................................. 52
Sources ....................................................................................................................................................... 52

Natural Catastrophes in 2018                                                     ii
Major natural catastrophes in 2018 per region based on insured losses

Natural Catastrophes in 2018                                            iii
Contact us

For further information, please contact:

John E. Alarcon, Ph.D., M.Sc.                    Prasad Gunturi, M.Sc.
Executive Director                               Executive Vice President
Catastrophe Analytics, Willis Re International   Catastrophe Analytics, Willis Re North America

Willis Re                                        Willis Re
Willis Ltd I 51 Lime Street I London EC3M 7DQ    8400 Normandale Lake Blvd, Suite 1700 I
D +44 (0) 20 3124 8678                           Bloomington, MN 55437
                                                 D +1 952 841 6641
john.alarcon@willistowerswatson.com              prasad.gunturi@willistowerswatson.com

Karl Jones                                       Vaughn Jensen
Managing Director                                Executive Vice President
Catastrophe Analytics, Willis Re International   Catastrophe Analytics, Willis Re North America

Willis Re                                        Willis Re
Willis Ltd I 51 Lime Street I London EC3M 7DQ    8400 Normandale Lake Blvd, Suite 1700 I
D +44 (0) 20 3124 7488                           Bloomington, MN 55437
                                                 D +1 952 841 6641
karl.jones@willistowerswatson.com                vaughn.jensen@willistowerswatson.com

With special thanks to the eVENT™ summary response team:

Alexander Saunders (EMEA W/S London) | Bethany Young (LAC London) | Natasha Denn (APAC
Ipswich) | Ryan Vesledahl (NA Minneapolis) | Thomas Perkins (EMEA W/S London) | Alexander Paul
(EMEA N/E Ipswich) | Charlotte Miller (EMEA W/S London) | Thomas Kiessling (EMEA N/E Munich) |
Roy Cloutier (NA Minneapolis)

willistowerswatson.com I willisre.com
January 2019

Natural Catastrophes in 2018                      iv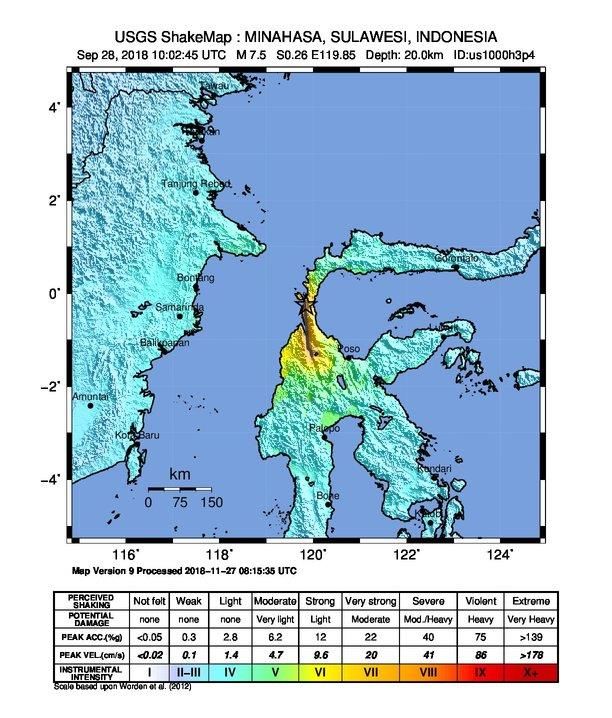
Introduction
This report summarizes economic and insured losses from the most relevant natural catastrophe
events that occurred during 2018. The loss values presented herein include those reported by
Willis Re, catastrophe model vendors, reinsurance companies and third-party organizations. Loss
estimates are presented in USD, for which rates of exchange at December 1, 2018, have been
used.

Our insured loss estimates from major natural catastrophes in 2018 of about USD 71.5 billion are one
of the highest since the 2011 annual market losses of USD 120 billion. However, the insured losses in
2018 are slightly less than half of those from 2017, and are marginally above the average annual losses
over the last eight years (see table below). Contrasting the previous peak years where one or a couple of
natural disasters represented a large percentage of the insured losses during that given year (e.g., HIM
hurricanes in the North Atlantic in 2017, Superstorm Sandy impacting New York in 2012, or the Tohoku,
Japan, Earthquake in 2011), for 2018 there is no such major event(s) concentrating a large proportion of
the losses. So what is observed for 2018 are losses coming from minor and medium-sized loss events.

In the U.S., the largest hurricane single insured loss came by the end of the hurricane season when
Hurricane Michael impacted Florida, Georgia and the Carolinas between October 10 and 12, producing
circa USD 6 to 10 billion of insured losses. In addition, the wildfires in Carr, Mendocino, Camp and
Woolsey, CA, produced a combined loss of about USD 15 billion. In Japan, Tropical Cyclone Jebi in early
September caused USD 8.5 billion of insured losses, representing the largest loss from a tropical cyclone
in Japan. In spite of this, Jebi hit Japan with an intensity very much expected from a scientific point of
view and at a location well embedded into commercial risk vendor models. Europe saw lower insured
losses from natural disasters during 2018 than in recent previous years, with Winter Storm Friederike
(called David in France) being the largest event. It impacted mainly Germany, the Netherlands and
Belgium, with insured losses circa USD 2 billion. In the Middle East, Tropical Cyclone Mekunu, the
hurricane with the highest intensity to hit Oman on record, caused over USD 400 million of insured
losses, while in Latin America and the Caribbean, the highlight of 2018 is the occurrence of no single
major insured loss from natural disasters.

The aforementioned events, along with others having lower insured losses, are described in detail in the
second part of this report, listed in chronological order, while a summary of events is provided in the
tables at the end of the document, organized by peril/region affected in chronological order.

Insured losses from natural catastrophes since 2011 (Willis Re estimates)

Natural Catastrophes in 2018                        1
1. In focus
New for 2018, In focus highlights some of the key themes for the year framed in the context of past
observations and historical losses. The traditional detailed description of natural events follows in the next
section.
California: A year of wildfires
In the summer and fall of 2018, the U.S. suffered a series of catastrophic wildfires. These events
have broken state records and resulted in significant insured losses. In particular, the Camp Fire became
the deadliest and most destructive wildfire in California on record.
There have been four major American wildfires in
2018:
Carr Fire in Shasta County, Northern California
Mendocino Fire in Northern California
Woolsey Fire in Southern California, near Los
Angeles
Camp Fire in Northern California, near
Paradise
The Carr, Mendocino, Woolsey and Camp wildfires
have contributed significantly to the overall insured
losses across the U.S., with an estimated combined
insured loss of USD 15.0 – 17.0 billion.
Many different factors contributed to the 2018 California
Aerial Extent of the Carr, Camp and Woolsey
wildfire season becoming the worst on record, including
wildfires, via SpatialKey
an increased amount of natural fuel and compounding
atmospheric conditions linked to global warming, according to the University of California, Berkley Center
for Catastrophic Risk Management. The rating agency, Fitch, believes the wildfires will have a modest
impact on year-end P&C results.
Natural Catastrophes in 2018 2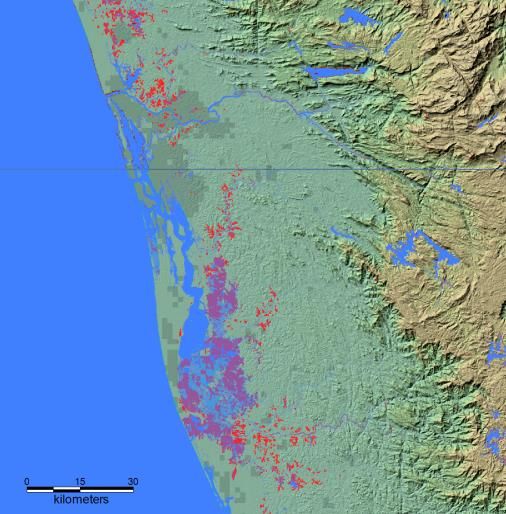
Hurricane Michael: Could losses have been larger?

Michael, the thirteenth named Atlantic storm of 2018, made landfall in the Florida Panhandle as a
Category 4 storm. Michael was the third most intense storm to make landfall in the U.S. on record,
behind the 1935 Labor Day Hurricane and Hurricane Camille of 1969, producing the year’s largest
hurricane insured loss with estimates between USD 6 and 10 billion. The storm’s damage path was very
narrow; however, had the wind field extent mirrored last year's Hurricane Irma, the insurance industry
would have seen a much larger loss.

                                                            The Willis Re damage reconnaissance
                                                            team assessed Michael’s damage in the
                                                            October 2018 Willis Re Damage Survey to
                                                            a collection of properties and determined
                                                            that the wind speed in the surveyed cities
                                                            was above the 1-in-700-year return
                                                            period.

                                                            Most damage was limited to the Florida
                                                            Panhandle and southern Georgia, sparing
                                                            both North and South Carolina from further
                                                            loss after Hurricane Florence made landfall
                                                            there earlier in September.
Hurricane Michael's track, via SpatialKey

Michael was the region’s first Category 4 hurricane on record, and building codes were not designed to
protect against such an intense storm — highlighting the importance of continued examination of
hurricane risk and risk mitigation in the region.

Natural Catastrophes in 2018                        3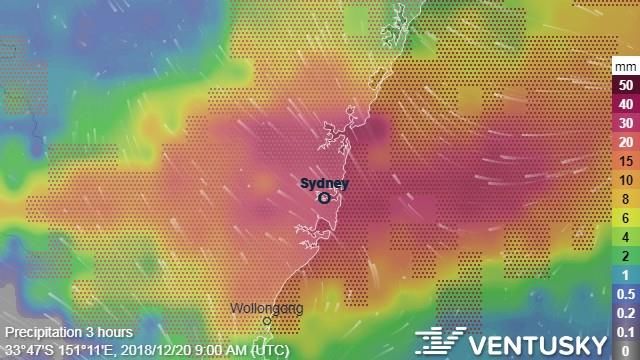
An active but not unexpected year of natural catastrophes in Japan
In the summer of 2018, Japan suffered a series of back-to-back natural disasters including
typhoons, a flood and earthquakes. Many of these events resulted in significant insured losses,
primarily driven by atmospheric perils. In particular, Typhoon Jebi is the strongest storm, by wind speed,
to have affected Japan in the past 25 years.
Japan has seen five landfalling wind events this year, out of which four were above Category 1 on
the equivalent Saffir-Simpson hurricane wind scale:
Two Category 3 typhoons: Jebi and Trami
Two Category 2 typhoons: Jongdari and Cimaron
Tropical Depression Leepi: made landfall with negligible losses
Typhoons Jebi, Trami, Cimaron and Jongdari have
contributed significantly to the overall insured
losses across the Asia Pacific region, with an
estimated combined insured loss of about USD
10.5 billion (GIAJ included as source of the
losses).
Despite these high losses, 2018 tropical cyclone
activity in Japan is within expectations from a
landfall location, frequency and severity
perspective, with only one landfalling typhoon
above the yearly average.
Other major events to impact the country were the
earthquakes in Osaka and Hokkaido, and the
Storm tracks of the five landfalling wind events in extreme floods in July. Although many natural
2018 over Japan, via SpatialKey catastrophes have occurred across Asia Pacific in
2018, Japan remains the most impacted in terms of
insured losses.
Natural Catastrophes in 2018 4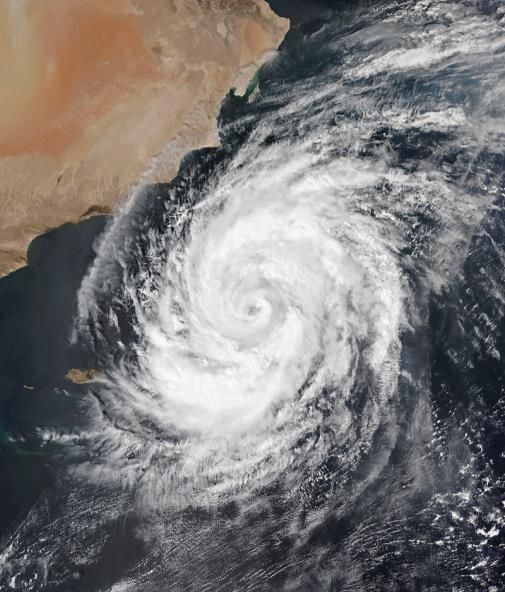
Latin America and the Caribbean: 2018 losses not a patch on 2017

The Caribbean and Latin America have seen notably lower impacts from natural catastrophes in
2018 compared with losses from the HIM hurricanes and the devastating Mexico earthquakes in
2017.

Multiple factors appear to have driven this year’s modest hurricane losses in the region. For one, 2018
has been a year of abundant dry air in areas of the Caribbean and tropical Atlantic: Because hurricane
formation requires moisture in the atmosphere, the ability of tropical waves to produce persistent stormy
weather has been hindered throughout the 2018 Atlantic hurricane season.

Relatively cold sea-surface temperatures in the Caribbean basin, between 0.5 and 1 degree Celsius
cooler than 2017, have also played a crucial role in 2018’s relative quiescence. Cooler waters deter the
development of tropical storms and hurricanes, which are reliant on the evaporation of warm seawater.
Hurricane development also reduced atmospheric wind shear, and 2018’s wind shear has been stronger
than average for the Gulf of Mexico, the Caribbean and the tropical Atlantic (source: NOAA).

In September, Hurricane Florence, which made landfall in the U.S., swept through the Atlantic basin
taking a steep northwesterly turn guided by the prevailing atmospheric and ocean conditions at the time,
not causing any significant impact in the Caribbean.

                         11/09/2017                       10/09/2018

Sea-surface temperatures in the Atlantic basin around the times of Hurricane Irma/Maria (left) and Hurricane
Florence (middle). Hurricane Florence’s path through the Atlantic basin (right) (source: NOAA)

Natural Catastrophes in 2018                         5
The strongest tropical cyclone to hit the Arabian Peninsula
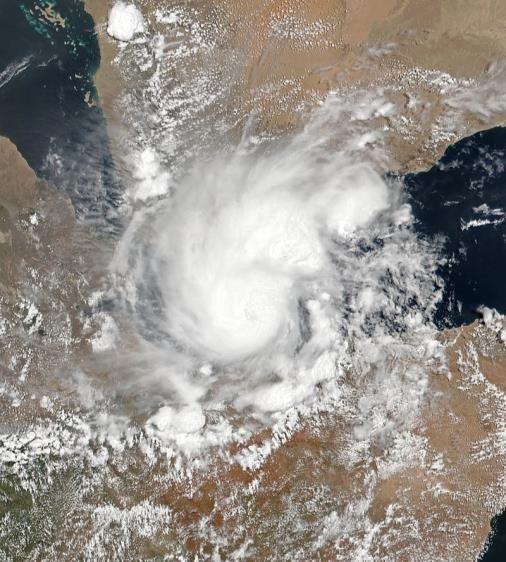
2018 saw the Arabian Peninsula experience its most
intense tropical cyclone on record. Cyclone Mekunu
made landfall on May 25 near Salalah, Oman’s third-largest
city. With peak one-minute sustained wind speeds of 185
km/h, the Category 3 storm (on the Saffir-Simpson scale)
caused widespread damage in parts of southern Oman and
Yemen.
Not only was Mekunu the most intense cyclone recorded on
the Arabian Peninsula, it was also the first hurricane-
equivalent storm to hit Oman’s southern Dhofar
Governorate since May 1959.
Like the storm of 1959, much of the damage caused by
Mekunu resulted from the vast precipitation accompanying
its movement over the Arabian Peninsula. In five days,
Mekunu had deposited over 600 mm of rainfall in Salalah,
the equivalent of over four times the annual average.
Data from the Capital Market Authority of Oman puts the
resulting insured impact from Mekunu at USD 403 million,
a loss not unprecedented in the region’s history despite the
record-setting event. Cyclone Gonu of 2007 (which, until
Mekunu, held the record for the strongest storm to strike
the Arabian Peninsula), is still considered Oman’s most
costly natural disaster after it affected USD 650 million in
insured losses (EM-DAT).
Mekunu was accompanied by a total of six other tropical
cyclones in the North Indian Ocean in 2018, making it the
most active season since 1992. And, while the total
impact is still being fully realized, this year highlights some
crucial considerations for cyclone risk in the region —
primarily the potential for record-breaking wind and
rainfall intensities, as well as the possibility of successive
storms bringing damage to already hard-hit areas.
The occurrence of damaging and deadly landfalls like
Cyclone Mekunu stresses the need for adequate loss
Cyclone Mekunu approaching Salalah, quantification methodologies, better preparedness and
Oman on May 25 (source: MODIS, NASA) adequate risk-transfer mechanisms to support the
communities and economies within the region.
Natural Catastrophes in 2018 62. Major natural catastrophes in 2018
DR South America November 2017 to March 2018
Argentina, Uruguay During the southern hemisphere summer
of 2017/2018, southern South America
experienced a severe lack of rainfall
leading to the worst drought in decades
across parts of Argentina and Uruguay.
La Niña conditions contributed toward
Economic losses the below average precipitation.
(in USD millions) Argentina’s soy production is estimated
to decline 31% and corn by 20%
3,400 in
compared to the prior growing season
Argentina, 500 in
(U.S. Foreign Agricultural Service). Drought conditions across South America
Uruguay
Food prices have been impacted, with on March 26 (source: PCA)
(Insurance
corn and soybean prices in the U.S.
Journal)
seeing 14% and 8% increases,
respectively.
Fatalities: Unknown The global price of food, measured by
the U.N.'s FAO Food Price Index,
increased by roughly 1% between
January and February 2018 as a result
of the drought.
Argentina's GDP this year is predicted to
decrease by 0.7% (VOA News).
WS Burglind/Eleanor January 2 to 3, 2018
Austria, Belgium, Burglind formed as a secondary low of
France, Germany, depression system Alja, ultimately
Ireland, Netherlands, reaching a minimum central pressure of
Switzerland, U.K. 966 hPa.
Peak gust values of 201 km/h in
Guetsch, Switzerland, 196 km/h in Cap
Corse, France, 175 km/h in Zugspitze,
Germany and 161 km/h in Great Dun
Fell, U.K.
Insured losses 9 recorded fatalities: 3 in Switzerland
Low pressure system Burglind (Eleanor)
(in USD millions) during forest clean-up work; 6 in
on January 3 (source: PERILS)
France.
1,245–1,811 (AIR)
Flight cancellations affected airports in
1,020 (Munich Re)
Zurich, Frankfurt, Paris, Basel-
856 (PERILS)
Mulhouse, London and Amsterdam.
Widespread power disruption to
Economic losses >400,000 households and businesses,
(in USD millions) of which over 200,000 were in France.
1,090 (Munich Re) Localized flooding in Germany and
Ireland; roof damage in Austria, France,
U.K.; widespread tree windfall.
Fatalities: 9
Natural Catastrophes in 2018 7BL U.S. January 3 to 6, 2018
Northeast and Eastern A low-pressure system combined with
U.S. below-average temperatures allowed for
a wintry mix along the southeast coast.
Snow, sleet and freezing rain impacted
Florida and spread northward through
Georgia and the Carolinas, and
significant coastal flooding occurred in
Insured losses Maine and New Hampshire.
(in USD millions) >100 damaged by flood.
Close to 200,000 properties were
WS Friederike
January 17 to 18, 2018
(David)
Belgium, France, A strong Atlantic extra-tropical cyclone,
Germany, U.K., named Friederike in Germany and David
Netherlands, Central in France, crossed northwest Europe,
Europe, Italy significantly impacting Germany, the
Netherlands and Belgium.
Gusts of up to 140 km/h were recorded
in the Dutch port of Hoek van Holland;
the German states of North Rhine-
Westphalia and Lower Saxony were also
Insured losses affected by the strongest winds (RMS).
(in USD millions) 13 fatalities, including 8 in Germany, 3 in
the Netherlands, 1 in Belgium and 1 in
2,100 (Swiss Re)
Italy.
2,100 (Munich
Widespread minor damage was reported
Re) Maximum wind gusts from Winter Storm
across Germany and the Netherlands,
1,896 (PERILS) Friederike (David) (source: PERILS)
with some instances of structural
1,471–2,942
damage.
(AIR)
Notable roof damage occurred at
1,132–1,358 in
Amsterdam Schiphol airport, which
Germany (Willis resulted in 2 of 3 departure halls closing.
Re) In total, >500 flights were canceled
1,132 in Germany across the affected regions (RMS).
(GDV) >250,000 power outages.
792–1,132
(CoreLogic)
Economic losses
(in USD millions)
2,700 (Swiss Re,
Munich Re)
Fatalities: 13
ST Midwest U.S. February 24 to 26, 2018
Midwest U.S. An outbreak of heavy rain and snow
moved through the Southern and Central
Plains resulting in flash flooding.
Over 400 properties were damaged by
flood and more than 40 suffered wind
damage.
Insured losses An EF-2 and EF-1 scale tornado, with
(in USD millions) maximum winds of 215 km/h touched
down in Tennessee, Kentucky and
“Beast From the
East” and Storm February 25 to March 5, 2018
Emma
France, Portugal, The initial event, later to become the
Spain, U.K., Ireland “Beast From the East”, was an arctic
outbreak from a disordered polar vortex.
The event was characterized by an
anticyclone (named Hartmut) centered
on Scandinavia, ultimately developing
into an anticyclonic storm.
Insured losses Peak gust value of 187 km/h was
(in USD millions) recorded in Ovre Dividal National Park,
Norway.
638–765
Hartmut and Winter Storm Emma
(Insurance Day)
(minimum central pressure of 963 hPa)
collided from March 1, leading to a peak
Fatalities: 77 (Munich gust value of 228 km/h on Mount
Re) Aigoual, France.
49 cm of snow was deposited in
Drumalbin, U.K.
94 recorded fatalities, including 17 in the Maximum temperature in the U.K. on
U.K., predominantly from the cold wave. March 1 (source: U.K. Met Office).
Flight cancellations at Glasgow airport;
widespread travel disruption in Ireland
and U.K.
BL U.S. March 1 to 3, 2018
Eastern U.S. A strong winter storm carried winds and
coastal flooding into the Northeast U.S.
causing widespread property damage
and power outages in Alabama,
Tennessee, Texas and Kentucky.
Gusts of 150 km/h were reported in MA
Insured losses and NH, while gusts up to 145 km/h were
(in USD millions) experienced in Boston.
Total storm rainfall on March 3. Dark red
Onshore winds caused coastal flooding
>1,000 (PCS) indicates highest snowfall amounts
in New England, especially in Boston. (source: NOAA)
Parts of New York and Pennsylvania
Fatalities: 9 saw between 25 and 50 cm of snow.
9 fatalities resulted from the severe
weather.
Millions lost power in the mid-Atlantic,
Northeast, and Great Lakes regions.
Natural Catastrophes in 2018 10ST U.S. March 18 to 21, 2018
Southern U.S. Severe thunderstorms developed in the
southern plains and eastern Gulf Coast,
producing large hail and damaging
winds, including tornados as well as
flash floods.
Hail up to 51 mm in diameter fell in
Insured losses Daytona Beach, Florida; Bastrop County
(in USD millions) Texas; Beaufort County, South Carolina;
Tishomingo County, Mississippi; and
>1,000 (PCS)
Terrebonne Parish, Louisiana.
A round of severe storms that included Thunderstorm report on March 19
Fatalities: 0 tornadoes swept through several towns (source: SPC, NOAA)
in the south and left behind a trail of
destruction and at least 3 injured
persons.
Significant damage was recorded to
homes, roofs, mobile homes, a nursing
home and vehicles, due to the hail.
ST Southern U.S. April 6 to 7, 2018
Southern U.S. A band of strong thunderstorms moved
across Texas and into the Southern
U.S., bringing hail and tornados.
Hail up to 70 mm in diameter was
reported throughout Texas.
Hailstones caused significant damage to
Insured losses cars, as well as roof, siding, window and
(in USD millions) skylight damage to buildings.
ST Midwest U.S. April 28 to May 5, 2018
Midwest U.S. Several days of severe storms produced
tornadoes, strong winds, hail and
flooding across the Central and Midwest
U.S. causing damage to properties.
Approximately 400 National Weather
Service (NWS) reports of severe weather
Insured losses were issued over the event time span.
(in USD millions) An EF-3 tornado with estimated winds of
224 km/h tracked for more than 23.4 km
>1,000 (PCS)
in Kansas.
Hail up to 100 mm in diameter fell in Thunderstorm report on May 2 (source:
Fatalities: 0 northern Kansas. SPC, NOAA)
Significant roof damage from high winds
and toppled trees was the major driver of
property damage.
ST Western Europe May to June, 2018
11 countries Throughout late May and into mid-June,
affected including: a series of severe, slow-moving
Austria, Belgium, thunderstorms developed across central
France, Germany, Europe, affecting Belgium, France and
Netherlands, Germany most significantly.
Switzerland The thunderstorms generated intense
and localized wind, hail and flood
damage.
During the storms on May 22, up to 50
cm of hail accumulated in Kaisersesch,
Germany. In northwest Paris, some
Insured losses areas observed 50 to 70 mm of rainfall
Infrared satellite image at 15:00 UTC on
(in USD millions) within one hour (FloodList). May 22 showing thunderstorm
1,000 (Munich Further violent thunderstorms occurred development (source: EUMETSAT via
Re) from May 31 to June 1, which also Metcheck)
affected Austria where flash flooding was
reported in Grafenschachen and
Economic losses Loipersdorf (FloodList).
(in USD millions) Storms continued to develop into mid-
1,700 (Munich June. On June 12, Lausanne,
Re) Switzerland, recorded nearly 79 mm of
rain in 24 hours causing flooding
(FloodList).
Fatalities: >5
>5 fatalities.
Damage from the storms mainly arose
from floodwaters and some hail activity,
with property and motor claims being
reported.
Significant travel disruption occurred in
the affected areas due to flooded roads,
downed trees and power outages.
Natural Catastrophes in 2018 12FL Hobart, Australia May 10 to 11, 2018
Hobart, Australia Intense thunderstorms in the Australian
state of Tasmania on May 10 and 11 led
to flash flooding across the region, with
the state capital of Hobart severely
impacted.
24-hour rain accumulations reached 129
Insured losses mm in the early hours of May 11
(In USD millions) (FloodList).
The suburbs of Kingston, Sandy Bay and Three-hour rainfall accumulation at 02:00
73 (Insurance local time on May 11 (source: Ventusky)
Council of Blackmans Bay were most significantly
Australia) affected (ICA).
There were no reported fatalities;
however, a number of people were
Fatalities: 0 rescued after becoming trapped in
floodwaters.
Properties were inundated with water
and cars were washed down the streets.
There were also reports of roof wind
damage and downed trees (The
Guardian).
At the peak of the storms, 14,000 homes
were without power (FloodList).
Transport was severely affected with
major roads blocked by floodwaters and
debris (FloodList).
WS U.S. May 12 to May 16, 2018
Northeast, Midwest, Severe storms shuffled across the
Southern U.S. Northeast, the Midwest, the South, as
well as Colorado in the U.S., causing
widespread damage, power outages and
travel disruption.
Wind gusts of up to 130 km/h were
reported with wind damage seen in 19
Insured losses states.
(in USD millions) Significant roof damage was seen from
wind gusts and hail as well as trees
>1,000 (PCS) Thunderstorm report on May 15 (source:
falling on houses, power lines and roads.
A flash flood emergency was also SPC, NOAA)
Fatalities: 5 reported in Maryland after streets and
basements were flooded.
Hundreds of properties experienced
wind, hail and/or flood damage.
Natural Catastrophes in 2018 13TC Sagar May 21, 2018
Somalia, Djibouti, Cyclone Sagar, the first named cyclone
Yemen, Ethiopia of the 2018 North Indian Ocean cyclone
season, made landfall in Somalia on May
Max. Cyclonic Storm 21, becoming the most intense tropical
cyclone to hit the country since records
began (JTWC).
Having formed on May 16, the storm
intensified and traversed west through
the Gulf of Aden before making the
westernmost landfall ever recorded in Track and intensity of Cyclone Sagar
Economic losses (source: JTWC via WikiProject Tropical
the North Indian Ocean (Wunderground).
(in USD millions) Sagar impacted Yemen, Somalia, cyclones/Tracks)
30 in Djibouti Djibouti and Ethiopia on its rare course
(UNICEF) through the Gulf of Aden.
In Somalia, 1-minute sustained peak
Fatalities: 57 (plus a wind speeds of 97 km/h were observed
further 32 from (JTWC). Sagar also brought to Somalia
secondary landslides) the equivalent of 1 year’s worth of
rainfall, resulting in deadly flash-floods
(OCHA).
55 fatalities in Somalia and 2 in Djibouti.
Rainfall from Sagar also caused
landslides in Ethiopia responsible for the
deaths of 32 people (Ethiopian GCAO).
Approximately 170,000 people are
thought to have been affected in Somalia
and a further 25,000 in Djibouti.
Agriculture in northern Somalia was
severely impacted, with estimated 277
ha of arable land destroyed and
thousands of livestock killed (NADFOR). MODIS satellite image of Cyclone Sagar
Flooding in Djibouti damaged about over the Gulf of Aden on May 18 (source:
10,000 houses, with total costs to NASA Earth Observatory)
infrastructure in the country estimated at
USD 30 million (UNICEF).
Natural Catastrophes in 2018 14TC Mekunu May 25 to 26, 2018
Yemen, Oman Cyclone Mekunu made landfall on May
25 near Salalah, Oman’s third-largest
Max. and landfall city.
Category 3 Boasting peak 1-minute sustained wind
speeds of up to 185 km/h, the Category
3 storm was the most intense to hit the
Arabian Peninsula on record (IMD).
In 5 days Mekunu deposited
approximately 617 mm of rainfall in
Track and intensity of Cyclone Mekunu
Salalah, the equivalent of over 4 times (source: JTWC via WikiProject Tropical
Insured losses
the annual average (MRMWR). cyclones/Tracks)
(in USD millions) 24 fatalities in Yemen and 6 fatalities in
403 (Capital Oman (EM-DAT).
Market Authority A state of emergency was declared on
Oman via the Yemeni island of Socotra after 40
Reinsurance people were reported missing. 1,000
News) households were evacuated and
floodwaters inundated the roads
Fatalities: 30 (EM- connecting Socotra airport (OCHA). Two
DAT) ships capsized in Al-Gaydah (IFRC).
On Yemeni mainland, the Al Mahrah and
Hadhramaut governorates were worst
affected, with widespread power
outages.
In Salalah, sustained winds of 97 km/h
damaged houses, cars and boats.
Storm rains flooded normally very dry
regions such as at the desert area of
Rub’ al Khali, which saw its first lakes in
20 years (NASA Earth Observatory).
Data from the Capital Market Authority in
Oman confirmed that 20 insurance firms
had received 1,123 claims, with losses
totaling over USD 403 million (via
MODIS satellite image of Cyclone
Reinsurance News). Property and Mekunu approaching Salalah, Oman on
Engineering claims make up USD 243 May 25 (source: NASA Earth
million and USD 79 million, respectively. Observatory)
Mekunu made landfall in Oman less than
a week after Cyclone Sagar had caused
damage in Somalia and Yemen.
Natural Catastrophes in 2018 15Subtropical Storm
May 28 to May 31, 2018
Alberto
Florida, Southern Subtropical Storm Alberto brought strong
U.S. winds, storm surge and flash flooding to
the Southeast U.S., mainly affecting
Tropical Storm at Florida and Alabama.
landfall The storm formed off the Yucatan
Peninsula and traveled northward into
the eastern Gulf of Mexico.
Alberto made landfall in Laguna Beach,
Florida, on May 28, with maximum
sustained winds of 75 km/h, equivalent Subtropical Storm Alberto path as of
to tropical storm strength winds on the May 28 (source: NOAA)
Insured losses
Saffir-Simpson Hurricane Wind Scale.
(in USD millions) The storm was downgraded to a
WF Sweden May to August, 2018
Sweden From May to August 2018, a series of
wildfires ignited throughout Sweden,
ranging from north of the Arctic Circle to
the southern county of Scania.
The areas worse affected were
Gävleborg and Jämtland.
Insured Losses During their peak in July 23, the fires
(in USD millions) covered an area of 250 km2 (Swedish
Forest Agency).
>87 (Svensk
May and July, respectively, were the MODIS satellite image of wildfires near
Försäkring via
warmest months in Sweden on record Ljusdal on July 17 (source: NASA Earth
Insurance Insider)
making conditions susceptible to wildfire Observatory)
(NASA Earth Observatory).
Economic Losses While many of the affected areas were
(in USD millions) sparsely populated, hundreds of people
>100 (Swedish were evacuated from their homes over
Forest Agency via the course of the wildfires.
Insurance Rainfall in late July, aided by intense
Journal) firefighting efforts, led to the wildfires
being brought under control by early
August.
Fatalities: 0
VE Mount Kilauea May 3 to August 23, 2018
Big Island, Hawaii Mt. Kilauea, located on the Big Island of
Hawaii, erupted on May 3.
The Pu’u ‘O’o crater floor collapsed on
May 1, causing earthquakes and magma
to drain into a new vent system along the
East Rift Zone.
Insured losses On May 4, a moment magnitude (Mw)
(in USD millions) 6.9 earthquake struck offshore Hawaii’s
Big Island, the strongest to occur on the
600 buildings are reported to have been
destroyed and major power plants were
forced to shut down and evacuated.
The lava flows were estimated to cover
about 2,300 ha.
Natural Catastrophes in 2018 17HL Southwest U.S. June 3 to 6, 2018
Southwest U.S. Unstable weather patterns aided in
developing severe thunderstorms across
western Texas and parts of central New
Mexico.
Large hail up to 64–76 mm diameter was
seen in Loving, New Mexico, and the
Insured losses Dallas-Fort Worth area of Texas, with
(in USD millions) wind gusts up to 119 km/h in Eunice as
well as several reports of a tornado.
EQ Osaka June 18, 2018
Japan On June 18 at 07:58, Japan local time
(22:58 UTC, previous day), a Mw 5.3
Magnitude 5.3 earthquake struck the city of Osaka,
Japan (USGS).
Its epicenter was approximately 25 km
Max. Intensity: northeast from the coast of Osaka Bay,
VIII – Severe (MMI) at a shallow depth of 15.4 km.
The earthquake is thought to have
resulted from activity along 3 fault zones:
Arima-Takatsuki, Ikoma and Uemachi.
The areas around Osaka may be subject
to increased likelihood of major
Insured losses earthquakes due to this recent event
(in USD millions) (Headquarters for Earthquake Research
27–124 (AIR) Promotion).
195 (RMS) A total of 766 structures were found by
910 (GIAJ, in government surveys to have sustained
claims paid as of partial damage. >120 schools in Osaka
prefecture were also damaged. Intensity map of the affected area
Dec 11) (source: USGS)
82 flights were canceled.
Fatalities: 5 450 people remained in public shelters a
week after the earthquake.
170,000 homes were affected by
electricity outages and 112,000 by loss
of gas during the day.
Shinkansen and other train services
were suspended for the day.
HL Midwest U.S. June 18 to 20, 2018
Midwest U.S. Powerful storm systems pushed through
northern Colorado producing large hail
and strong winds.
Hail up to 76 mm damaged cars and
homes in the Boulder area before
wreaking havoc on Morgan County.
Insured losses Wind gusts up to 114 km/h were
(in USD millions) reported at Fort Morgan Airport.
The storm also affected several parts of
>1,000 (PCS)
Utah as hail and rain poured down
across northern parts of the state. Thunderstorm report on June 19 (source:
Fatalities: 0 Extensive damage to residential and SPC, NOAA)
commercial buildings was reported.
Natural Catastrophes in 2018 19ST Midwest U.S. June 24 to 26, 2018
Midwest U.S. Severe convective storms broke out
across the Midwest and caused
significant property damage in south-
central Kansas.
Most reported damage was caused by a
tornado in the city of Eureka, Kansas.
Insured losses Large hail up to 70 mm and wind gusts
(in USD millions) of 161 km/h were also reported in
Kansas.
100 structures were reported to be
completely destroyed.
WF Greece July, 2018
Attica, Greece The July 2018 Greece wildfires were the
second-deadliest wildfire event of the
21st century, globally.
Starting on July 23, a series of 3 wildfires
ignited across central-southern mainland
Greece in the Attica region. The wildfires
Insured losses were focused around Zemeno, Kineta
(in USD millions) and Rafina.
The cause of the wildfires is unknown;
38.1 (Greece
however, local officials suspect arson
Association of
and a damaged utility cable could have Wildfire footprint at 23:10 on July 24
Insurance
played a role. (source: Global Kinetic Wildfire via
Companies)
A summer heatwave, in addition to an SpatialKey)
abnormally dry winter, made conditions
Fatalities: 99 susceptible for wildfire. Strong wind
gusts of up to 97 km/h exacerbated the
fires (RMS).
99 fatalities, >172 injured, with the
majority associated with the Rafina
wildfire.
>700 residents were evacuated, mainly
from coastal settlements around Rafina.
Approximately 2,500 homes destroyed,
with a further 4,000 severely damaged
(RMS).
Some flights were disrupted at Athens
airport on July 23 due to smoke causing
poor visibility, with the Athens-Corinth
motorway also being closed (RMS).
Natural Catastrophes in 2018 21FL Japan July 3 to 9, 2018
Japan The July 2018 Japan floods were the
most deadly weather disaster in Japan
since 1982.
Heavy rainfall from a low pressure
system driven by the remnants of
Typhoon Prapiroon caused extensive
Insured losses flooding across Japan between July 3
(in USD millions) and 9.
1,675 (GIAJ, in During the most intense rainfall, the 3-
claims paid as of hour rainfall rate peaked at 26.3 cm in
Dec 11) Kochi prefecture, the highest since
2,501–3,725 records began in 1976 (DW).
(AIR) Southwestern Japan bore the brunt of
the flooding, with 31 prefectures affected
in total. Rainfall accumulation from 03:00 local
Fatalities: >225 Landslides and mudslides occurred time on July 2 to 03:00 on July 9 (source:
NASA Earth Observatory)
across many of the saturated slopes
causing large-scale structural damage to
property.
In Mabi, Okayama prefecture, the levees
of the Odagawa were breached, causing
flooding of up to 4.8 m depth in
residential areas (Reuters).
>225 fatalities were reported as a result
of rain-related incidents across Japan.
>8 million people were placed under
evacuation orders during the course of
the flooding (FloodList).
>46,000 buildings were reported as
being damaged across the affected
regions (FDMA).
The commercial sector was also heavily
affected with Mazda Motor, Teijin and
Asahi Shuzo suspending operations for a
period (RMS).
The July 2018 flooding highlighted the
need for greater flood prevention and
awareness throughout Japan. 21
reservoirs overflowed during the
flooding, yet only 4 were previously
designated as priority area for disaster
mitigation. Furthermore, many residents
were not aware of the flood risk their
properties faced due to flood hazard
maps being released only relatively
recently (Japan Times).
Natural Catastrophes in 2018 22ST Midwest, South
July 19 to 22, 2018
U.S.
Midwest and Severe storms in Minnesota and Iowa
Southern U.S. brought at least 5 tornadoes causing
damage to buildings, power lines and
vehicles.
The Iowa towns of Marshalltown, Pella,
and Bondurant were the worst affected
areas.
Insured losses Large hail and wind gusts of 105 km/h
(in USD millions) were reported.
Roofs were removed from buildings and Thunderstorm report on July 19 (source:
>1,000 (PCS) SPC, NOAA)
vehicles were overturned.
A factory in Pella was completely
Fatalities: 0 destroyed, with a second plant receiving
significant structural damage.
A tornado destroyed or severely
damaged an estimated 12 houses in
Bondurant.
17 people were reported to have been
injured.
WF Northern
July 23 to August 15, 2018
California
Northern California, A number of wildfires in Northern
U.S. California, including the destructive Carr
and Mendocino Fire, developed at the
end of July and were fueled by high
winds, low humidity and very dry
conditions.
The Carr Fire was the result of a spark
Insured losses from a car.
(in USD millions) The fire destroyed 1,884 structures and
burned nearly 280,000 ha.
>1,000 (PCS)
The Carr Fire became the most Carr Fire (source: Willis Re via SpatialKey)
destructive fire in Shasta County history.
Fatalities: 15 2,198 structures reported being
damaged or destroyed from the 3 fires.
Natural Catastrophes in 2018 23ST Midwest U.S. July 26 to 29, 2018
Midwest U.S. A cluster of severe storms developed
over the upper Rockies and stretched
from Idaho into the central plains.
Winds exceeding 148 km/h brought
widespread damage to trees, power lines
and exterior buildings across Wyoming
Insured losses and Colorado.
(in USD millions) Hail up to 89 mm was reported
throughout the region, producing
FL Kerala August 8 to 16, 2018
India The August 2018 floods were the most
damaging to Kerala in the last century.
Between August 8 and 16, heavy rainfall
during an active southwest monsoon
season led to extensive flooding across
Kerala in southwest India.
Insured losses Average rainfall across the state for the
(In USD millions) period was 350 mm, 255% above
330 (Willis Re) expected (RMS).
Flooding impacted all districts of Kerala,
with Idukki, Thrissur, Chengannur,
Economic losses Ernakulam and Kuttand worst affected.
(In USD millions) Widespread mudslides and landslides
3,000 (Willis Re) occurred, particularly in the northern hilly
3,593 (World districts where the situation was
Bank via Times of exacerbated by the opening of dams and Maximum observed flooding area from
India) reservoirs. Copernicus Sentinel-1 SAR data. Areas in
>480 fatalities were reported due to rain- red and purple show present flooding with
areas in blue displaying the reference
related incidents (The Indian Express).
Fatalities: >480 normal water extent (source: European
>1 million people were estimated to be Space Agency via NASA Earth Science
displaced due to the flooding (BBC). Disasters Program)
Thousands of homes and >10,000 km of
roads were destroyed or damaged by the
floodwaters (RMS).
Cochin International Airport, the largest
in the state, was forced to close for 14
days after floodwaters inundated
runways and damaged equipment
(Times of India).
Significant agricultural losses occurred in
the district of Idukki, where financial
losses from damage to tea plantations
alone was estimated at USD 129 million,
though the vast majority of this was not
insured (Business Today).
Natural Catastrophes in 2018 25HU Lane August 23 to 28, 2018
Hawaii, U.S. Hurricane Lane barely missed landfall on
Hawaii as it avoided bringing
catastrophic hurricane force winds to the
island.
The storm reached Category 3 strength
before downgrading to a tropical storm
Insured losses as it slid underneath the Hawaiian
(in USD millions) Islands.
Continuous rainfall associated with the
200 structures were damaged on the
eastern side of the Big Island.
Wildfires driven by the strong gusts
associated with Hurricane Lane
damaged several dozen structures and
vehicles in West Maui.
Natural Catastrophes in 2018 26TC Jebi August 27 to September 5, 2018
Japan Typhoon Jebi was the strongest storm to
hit Japan’s mainland in 25 years.
Max. Category 5 Having formed in the Pacific on August
27, Jebi reached Category 5 within 3
Category 3 at
days and dissipated on September 5.
landfall
At just after 11:00, Japan local time
(03:00 UTC), on September 4, Jebi
made landfall as a Category 3 typhoon
on the island of Shikoku, then made a
second landfall near Kobe City a few
hours later.
Insured losses Wind gusts up to 200 km/h were Wind speeds and track of Typhoon Jebi
(in USD millions) recorded in the cities of Kobe, Osaka over Japan (source: ERCC via GDACS)
8,500 (Willis Re) and Kyoto.
6,585 (GIAJ, in Osaka registered a record storm tide of
claims paid as of 3.29 m.
Dec 11) In Kyoto, a record of over 100 mm
7,261–10,248 rainfall fell in one hour. In other areas, up
(AIR) to 500 mm of total rain was observed.
3,011–5,490 >11 fatalities, 400 injured and evacuation
(RMS) advisories for more than a million people.
Jebi caused significant damage to
Fatalities: >11 infrastructure as well as major business
interruption, particularly to manufacturing
and tourism industries. Shipping and
transport were also severely affected.
1,138 buildings were damaged across 32
prefectures.
Many crops were destroyed prior to their
harvest, adding to the devastation
caused by Typhoon Cimaron.
Overnight on September 4, >1.6 million
households remained without power in
Osaka, Kyoto, and 4 nearby prefectures.
The closure of Kansai International
Airport in Osaka for 10 days due to
flooding resulted in >700 domestic and
international flight cancellations.
Bullet train services and schools were
suspended for one day.
Significant drop in Osaka’s tourism
economy, with a fall in restaurant and
retail sales of up to 80% in the days
following the event.
Natural Catastrophes in 2018 27FL Nigeria September to October, 2018
Nigeria Total flooded area of 67,392 ha.
Thousands of residents displaced.
Nigerian National Emergency
Management Agency (NEMA) declared a
state of emergency across 15 states.
Economic losses
(in USD millions)
>1.13 (ERCC)
Flooded area in Lokoja, Nigeria as of
Fatalities: >299 September 20 (source: Copernicus via
(GDACS, ERCC) Tropical Tidbits)
HU Florence September 13 to 19, 2018
North Carolina, Hurricane Florence caused catastrophic
South Carolina, and record-breaking rainfall across the
Virginia Southeast U.S.
Florence formed as a tropical storm on
Max. Category 4 September 1. It slowly strengthened as it
moved westward to the U.S., reaching its
Category 1 at
peak strength at Category 4 intensity on
landfall
September 5.
The storm eventually weakened to a
Category 1 intensity as it approached the
Carolina coastline; making landfall near Wind speed and path of Hurricane
Wrightsville Beach, North Carolina, at Florence (source: NASA, NHC)
11:15 UTC on September 14.
Insured losses During the next 48 hours post-landfall,
(in USD billions) Florence moved slowly inland across the
2.8–5 (US, RMS) Carolinas causing hurricane-force wind
1.7–4.6 (US, AIR) gusts, significant storm surge, and
2.5 (US, KCC) widespread intense and prolonged
>1.0 (US, PCS) rainfall.
The Carolinas experienced up to 914
mm of rain, causing catastrophic and life-
Economic losses
threatening flooding. Florence set
(in USD billions) records for the highest tropical cyclone
6–11 (RMS) rainfall in both North Carolina and South
17–22 (Moody’s Carolina.
Analytics) Hurricane Florence’s path as of
Multiple tornadoes were reported in the September 14 (source: NOAA)
central and eastern Carolinas.
Fatalities: 53 30 confirmed direct and 23 indirect
fatalities in the U.S.
Hundreds of thousands of customers
throughout the Carolinas lost power for
multiple days.
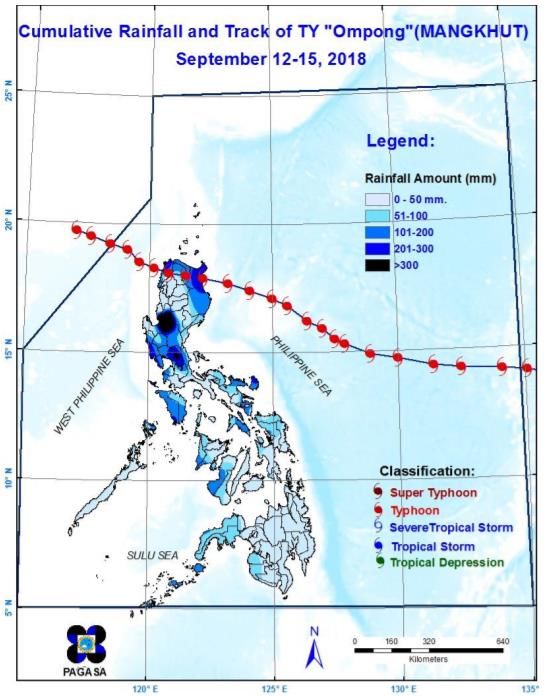
Natural Catastrophes in 2018 28TC Mangkhut September 7 to 17, 2018
China, Philippines Typhoon Mangkhut formed in the
Northwest Pacific on September 7 and
Max. Category 5 developed into equivalent of a Category
1 hurricane on September 9 before
Category 4
tracking toward Guam.
(Philippines), 2
Mangkhut made landfall over Cagayan in
(China) at landfall
Philippines at 18:00 UTC on September
14 as a Category 4 typhoon. It then
made a second landfall over Guangdong
Province, China on September 16 at
09:00 UTC.
Record-breaking storm surge of 2.35 m
Insured losses at Quarry Bay and 3.38 m at Tai Po Kau
(in USD millions) was recorded in Hong Kong (RMS).
1,000-2,000 in Philippines
China (AIR) 210,361 houses were damaged, 325
road sections and 8 bridges were
Economic losses affected.
283 domestic and international flights
(in USD millions)
canceled. 198 regions were affected by Cumulative rainfall and track of Typhoon
648 in power outages. Mangkhut in the Philippines (source:
Philippines Classes were suspended in 968 PAGASA)
(NDRRMC) municipalities.
About 3 million people were affected in
Fatalities: 83 the worst-hit parts of the Philippines, and
another 11 million further south faced
flooding.
As of September 17, 192,840 people
were sheltering in nearly 2,000
evacuation centers.
China
Up to 2.4 million people were reportedly
evacuated from Guangdong.
>5,500 structures were impacted across
southern China, with 1,200 destroyed
across 5 provinces.
Wind speeds and track of Typhoon
Yangjiang was the worst-impacted city in
Mangkhut at landfall in China (source:
Guangdong. World Food Programme)
>500 residential and high-rise buildings
were severely damaged in Hong Kong
(RMS).
As of November 23, parts of Hong Kong
remained without water or electricity.
Natural Catastrophes in 2018 29TC Trami September 20 to October 1, 2018
Japan Typhoon Trami made landfall near
Tanabe City, Wakayama prefecture,
Max. Category 5 Japan, on September 30 as a borderline
Category 2/3 at Category 2/3 typhoon.
landfall Having initially formed on September 20,
the storm strengthened as it moved
westward, peaking on September 24 as
a Category 5 super typhoon.
After moving northeastward, the storm
slowly deteriorated, making landfall as a
borderline Category 2/3. Track and intensity of Typhoon Trami
Insured losses
Prior to landfalling in mainland Japan, (source: NASA, NOAA)
(In USD millions) Okinawa Island was impacted, with
2,000 (Munich sustained winds of 166 km/h (gusts at
Re) over 212 km/h) recorded at Kadena Air
634–4,069 (AIR) Base (RMS).
2,094 (GIAJ, in 24-hour rainfall totals, ending September
claims paid as of 30, reached 400 mm in some parts of
Dec 11) Miyazaki, Kochi and Ehime prefectures.
Typhoon Trami led to 4 fatalities and
Economic losses >200 people were injured (Anadolu
Agency).
(In USD millions)
Over 6,000 buildings were reported
2,600 (Munich damaged across 33 prefectures, with the Typhoon Trami approaching Okinawa on
Re) September 28 (source: NASA Earth
worst affected regions including
Observatory)
Kagoshima, Tokyo and Shizuoka. Most
Fatalities: 4 of the damage arose from the strong
winds; however, significant flood damage
was also reported in Kagoshima and
Miyazaki prefectures (FDMA, RMS).
Power outages affected more than one
million people due to downed power
lines and trees (AccuWeather).
Widespread travel disruption occurred
with thousands of flights canceled and
rail services disrupted (RMS).
Typhoon Trami was the eighth named
storm of the 2018 season to directly
impact Japan following Typhoon Jebi
less than a month earlier, which was the
strongest to hit mainland Japan in 25
years (CNN).
Natural Catastrophes in 2018 30EQ Sulawesi September 28, 2018
Indonesia On September 28 at 18:02 local time, a
Mw 7.5 earthquake occurred in
Magnitude 7.5 Sulawesi, Indonesia, as a result of a slip
along the Palu-Koro strike slip fault.
Its epicenter was located 70 km north of
Max. Intensity: Palu at a depth of 20km (USGS).
IX – Violent (MMI) There were 4 foreshocks >Mw 4.9 over
several hours preceding the main
earthquake as well as 40 aftershocks
>Mw 4.4 within 5 days following the
earthquake (USGS).
The earthquake triggered a tsunami with
Economic losses estimated wave heights of up to 6 m.
(in USD millions) Tsunamis are not typically associated
966 (BNPB) with strike slip faulting due to the lack of
vertical displacement. Recent studies
suggest that the tsunami resulted from a
Fatalities: 2,256 large submarine landslide in Palu Bay Intensity (MMI) map of affected area
triggered by the quake. (source: USGS)
There were 2,256 fatalities, making it the
deadliest earthquake to strike the
country since the 2006 Yogyakarta
earthquake, which killed over 5,700
people.
It is also the deadliest earthquake of
2018, surpassing the Mw 6.9 earthquake
that struck Lombok a few months earlier
causing over 400 fatalities.
Over 12,500 people were injured,
223,000 internally displaced, 1,309
missing and 1.5 million people in Central
Sulawesi were affected.
Over 68,000 houses were damaged.
There was critical damage to Palu’s
hospital, closure of the airport and the
collapse of many large structures
including hotels and bridges.
The earthquake also caused liquefaction,
subsidence and landslides, which
contributed significantly toward the
fatalities and damage.
Economic losses are just shy of USD 1
billion; however, insured losses are
limited due to low insurance penetration.
Natural Catastrophes in 2018 31HU Michael October 10 to 12, 2018
Alabama, Florida, Hurricane Michael was the thirteenth
Georgia, Maryland, named storm of the 2018 North Atlantic
North Carolina, hurricane season and was fueled by
South Carolina, uncharacteristically high sea surface
Virginia temperatures in the Gulf of Mexico.
Michael formed as a broad area of low
Max. Category 4 pressure over the southwestern
Caribbean Sea and slowly morphed into
Category 4, 3, 2 at
a tropical storm as it drifted toward the
landfall
Yucatan Peninsula. The storm began to
rapidly intensify as it passed through the Wind speed and path of Hurricane Michael
Yucatán Channel into the warm waters (source: NASA, NHC)
of the Gulf of Mexico.
Michael collided with western Cuba as a
tropical storm causing flash floods and
Insured losses mudslides. Rapid strengthening
(in USD billions) continued as it neared landfall along the
6.8–10 (RMS) Florida Panhandle.
6–10 (AIR) Michael made landfall at 17:15 UTC on
8 (KCC) October 10 near Mexico Beach as a
Category 4 hurricane with maximum
sustained winds of 250 km/h.
Economic losses
After bringing disastrous wind and storm
(in USD billions) surge to the Florida coastline the storm
25 (Enki) promptly moved through Florida into
Georgia, maintaining hurricane intensity
Fatalities: 60 over land for more than 11 hours before
weakening to a tropical storm.
Michael tracked into Georgia as a Hurricane Michael’s path as of October 9
Category 3 hurricane, making it the first (source: NOAA)
Category 3 storm in Georgia on record.
Michael was the most intense hurricane
to make landfall in the continental U.S.
since Hurricane Andrew in 1992.
Most wind damage was limited to the
Florida Panhandle and southern
Georgia; since Michael was a rapidly
moving storm, precipitation accumulation
was much less than for Florence.
Storm surges between 8 and 10 feet
along the Florida coast.
Hundreds of thousands of residents had
to evacuate up and down the Gulf Coast.
Significant damage to single-family and
manufactured homes’ roofs, hotels,
hospitals and schools, as well as heavy
damage to piers and boats that were
tossed into each other.
Michael also affected parts of Central
America including Honduras, Nicaragua
and El Salvador.
Drenching rains and winds of up to 129
km/h were reported in western Cuba and
on Mexico’s Yucatan Peninsula.
Natural Catastrophes in 2018 32HU Leslie October 13 to 16, 2018
France, Italy, Ex-hurricane Leslie was the strongest
Portugal cyclone of tropical origin to hit the Iberian
Peninsula since 1842.
Max. Category 1 First monitored on September 19 as a
non-tropical low pressure system
southwest of the Azores, Leslie
oscillated between being a subtropical
and extra-tropical storm over several
weeks, reaching peak hurricane intensity Track and intensity of Ex-hurricane
on October 12. Leslie (source: Wunderground)
Insured losses
Leslie transitioned into an extra-tropical
(in USD millions) cyclone late on October 13, before
277 (Portuguese making landfall three hours later in
Association of Figueira da Foz, with wind speeds up to
Insurers and 113 km/h.
French The remnants of Leslie reached France
Federation of by October 15.
Insurance) Leslie resulted in Madeira Island’s first
tropical storm warning on record.
Economic losses 16 fatalities: 14 in France from flash
(in USD millions) flooding, 2 in Portugal and 28 injuries.
324,000 houses lost power and >1,000
>440 (Portuguese
trees were uprooted.
Association of
Insurers) Satellite image of Ex-hurricane Leslie
(source: NOAA)
Fatalities: 16 (SAPO
in Portugal, AFP in
France)
Natural Catastrophes in 2018 33TC Luban October 14 to 15, 2018
Yemen, Oman, The third tropical cyclone to hit the
Somalia Arabian Peninsula, Cyclone Luban,
made landfall on October 14 in eastern
Max. Category 1 Yemen.
Prior to landfall, Luban reached the
Cyclonic Storm at
equivalent of Category 1 hurricane status
landfall
with peak 1-minute sustained wind
speeds of 137 km/h (JTWC).
Developing initially on October 6, in the
central Arabian Sea, Luban followed a Track and intensity of Cyclone Luban
steady northwest trajectory until making (source: JTWC via WikiProject Tropical
landfall 30 km south of Al Gaydah with cyclones/Tracks)
Economic losses 72 km/h wind speeds (IMD).
(in USD millions) Oman, Dalkout and Salalah registered
2.55 in Al 145 mm and 138 mm of precipitation in
Mahrah 24 hours, respectively, leading to flash
Governorate, flooding (MRMWR).
Yemen (Yemen 25 fatalities in Yemen.
Prime Minister via 8,000 people were made homeless in
Debriefer) Yemen (Yemen Prime Minister via
Associated Press).
Among the worst affected areas was the
Fatalities: 25
Al Mahrah Governorate, in which 70% to
90% of infrastructure was damaged
(OCHA). The Governorate assigned
USD 2.55 million to repairing public
utilities and restoring basic services.
Agriculture was also affected with
thousands of livestock washed away.
The occurrence of Luban in the Arabian
Sea, and another storm Titli in the Bay of
Bengal, marks the first time in recorded Cyclone Luban northeast of Socotra on
history that two storms were active at the October 10 (source: NOAA)
same time in these basins.
Natural Catastrophes in 2018 34EQ Greece October 26, 2018
Zakynthos, Greece On October 26 at 01:54 (local time), a
Mw 6.8 earthquake occurred in the
Magnitude 6.8 Ionian Sea, its epicenter located 28 km
southwest of Zakynthos, Greece
(USGS).
Max. Intensity:
The earthquake resulted from oblique
VII – Very Strong
thrust faulting at 14 km depth, producing
(MMI)
shaking of up to MMI VII (very strong)
across most of Zakynthos Island
(USGS), with shaking also reported as
far away as Italy and Albania.
The main earthquake was followed by
multiple aftershocks, the largest of which
Insured losses was a Mw 5.6 on the same day.
(in USD millions) A small tsunami of approximately 20 cm
2.3–9.1 (Willis Re was generated by the earthquake.
at October 2018) Despite the magnitude of the event,
there were no reported casualties, with 3 Intensity (MMI) map of affected area
people suffering minor injuries. (source: USGS)
Economic losses
Zakynthos Island was most significantly
(in USD millions) affected, with power being lost
1–10 (with 35% immediately after the quake. 120
probability, buildings were later classified as
USGS) uninhabitable and the town itself was
found to have shifted laterally by 5 cm
Fatalities: 0 (Greek Reporter).
A 15th century monastery on the nearby
island of Strofades was also damaged
(Reuters).
Islands in the Ionian Sea observe
stringent building codes following an
earthquake sequence in 1953, which
caused approximately 450 deaths; this
may account for the present day building
stock quality.
The event took place in one of Greece’s
most seismically active regions, where
there is thought to be potential for a Mw
7.1 earthquake within a human lifetime
(Temblor).
Natural Catastrophes in 2018 35You can also read