Summary of Natural Catastrophe Events 2019 - Willis Re eVENTTM Update Insured losses and economic impact due to natural disasters Volume 8
←
→
Page content transcription
If your browser does not render page correctly, please read the page content below

Summary of Natural
Catastrophe Events 2019
Willis Re eVENTTM Update
Insured losses and economic impact due to
natural disasters

Volume 8
Natural Catastrophes in 2019 i
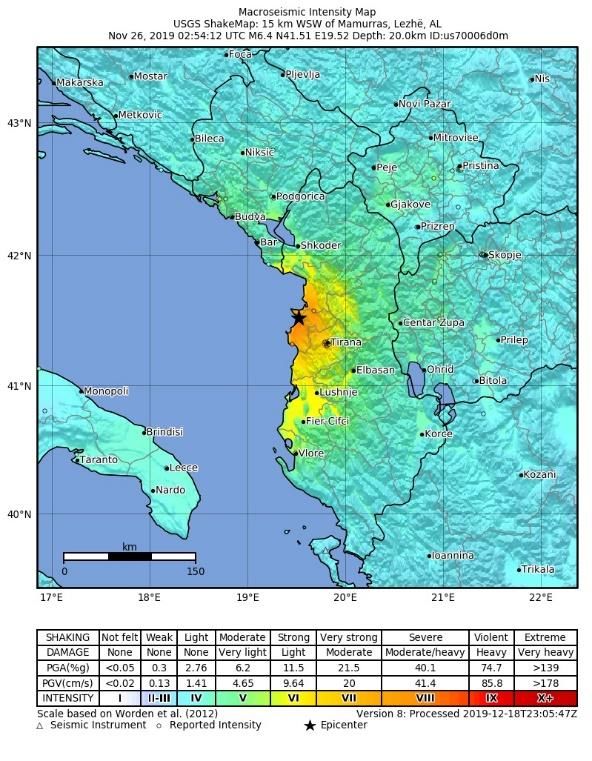
Table of contents

Major natural catastrophes in 2019 per region based on insured losses ..................................................... iii
Contact us .....................................................................................................................................................iv
Introduction.................................................................................................................................................... 1
1.    In focus .................................................................................................................................................. 3
2.    Major natural catastrophes in 2019 ....................................................................................................... 8
3.    Other natural catastrophe events by peril and location ....................................................................... 42
Abbreviations .............................................................................................................................................. 52
Sources ....................................................................................................................................................... 52

Natural Catastrophes in 2019                                                    ii
Major natural catastrophes in 2019 per region based on insured losses

Natural Catastrophes in 2019                                            iii
Contact us

 For further information, please contact:
 John E. Alarcon, Ph.D., M.Sc.                    Prasad Gunturi, M.Sc.
 Executive Director                               Executive Vice President
 Catastrophe Analytics, Willis Re International   Catastrophe Analytics, Willis Re North America

 Willis Re                                        Willis Re
 Willis Ltd I 51 Lime Street I London EC3M 7DQ    8400 Normandale Lake Blvd, Suite 1700 I
 +44 (0) 20 3124 8678                             Bloomington, MN 55437
                                                  +1 952 841 6641
 john.alarcon@willistowerswatson.com              prasad.gunturi@willistowerswatson.com

 Karl Jones                                       Vaughn Jensen
 Managing Director                                Executive Vice President
 Catastrophe Analytics, Willis Re International   Catastrophe Analytics, Willis Re North America

 Willis Re                                        Willis Re
 Willis Ltd I 51 Lime Street I London EC3M 7DQ    8400 Normandale Lake Blvd, Suite 1700 I
 +44 (0) 20 3124 7488                             Bloomington, MN 55437
                                                  +1 952 841 6641
 karl.jones@willistowerswatson.com                vaughn.jensen@willistowerswatson.com

With special thanks to the eVENT summary response team:

Charlotte Miller (EMEA W/S London) | Rebecca Stepanian (EMEA N/E London) | Natasha Denn
(APAC Ipswich) | Charlie Mariner (APAC Ipswich) | Alexander Saunders (EMEA W/S London) | Sarah
Lochhead (EMEA W/S London) | Matt Day (EMEA W/S London) | Ed Spurling (EMEA W/S Ipswich) |
Alexander Paul (EMEA N/E Ipswich) | Alex Wilkerson (EMEA N/E London) | Bethany Young (LAC
London) | Nikil Pujari (NA Mumbai) | Roy Cloutier (NA Minneapolis)
willistowerswatson.com I willisre.com
January 2019

Natural Catastrophes in 2019                      iv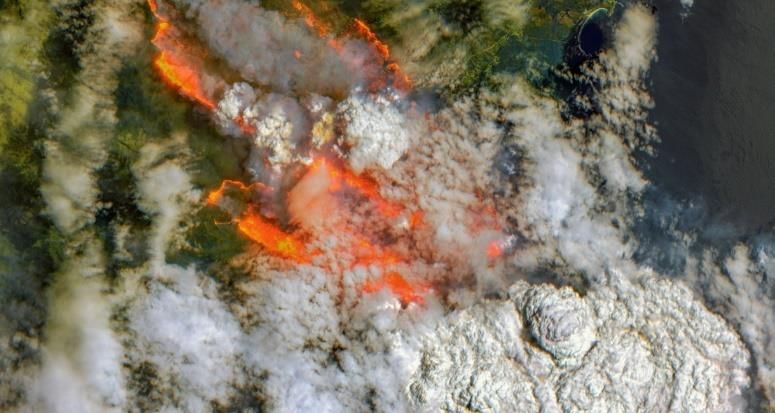
Introduction
This report summarizes economic and insured losses from the most relevant natural catastrophe
events that occurred during 2019. The loss values presented herein include those reported by
Willis Re, catastrophe model vendors, reinsurance companies and third-party organizations. Loss
estimates are presented in USD, for which rates of exchange at December 1, 2019, have been
used.

Our insured loss estimates from major natural catastrophes in 2019 of about USD 53 billion are in the
same order of magnitude as those observed in 2012 and keeps to the trend of reduction in natural
catastrophe losses seen since 2017, when the annual market losses reached USD 143 billion. The
insured losses in 2019 are about 18% lower than the average annual losses since 2011, which stand at
USD 65.2 billion (see table below). Similarly to what was observed in 2018, for 2019 the losses are
coming from minor and midsized loss events rather than from one or a couple of natural disasters that
concentrated a large percentage of the insured losses during that given year (e.g., HIM hurricanes in the
North Atlantic in 2017 or the Tohoku Earthquake in Japan in 2011).

During 2019 in the U.S., the largest single insured loss came by end of May when a severe thunderstorm
affecting the High and Central Plains and eastern parts of the country produced circa USD 3 to 4 billion of
insured losses. In addition, the severe thunderstorm between March 23 to 25 that affected the Central
and Low Plains produced more than USD 1 billion loss. In Japan, Tropical Cyclones Faxai in September
and Hagibis in October had insured losses of circa USD 7 billion and USD 8 billion, respectively, while
Australia has been affected by bushfires that so far have produced more than USD 900 million. Europe
saw lower insured losses from natural disasters during 2019 than in recent previous years: Winter Storm
Dragi-Eberhard in March produced circa USD 850 million losses mainly from Belgium, France, the UK,
Germany, Netherlands and Luxembourg. This level of losses in Europe is similar to the USD 830 million
caused by the hailstorms in June affecting Germany, Poland, Slovenia and the Czech Republic. In the
Middle East and Africa region, Tropical Cyclone Idai hit Mozambique in March with circa USD 150
million insured losses and caused more than 1,000 fatalities. Finally, in Latin America and the
Caribbean, the highlight of 2019 is the impact of Hurricane Dorian with insured losses in the Caribbean
that could range between USD .75 billion and 2.5 billion.

The aforementioned events, along with others having lower insured losses, are described in detail in the
second part of this report, listed in chronological order. Additionally, a summary of events is provided in
the tables at the end of this document, organized by peril/region affected and in chronological order.

 Insured losses from natural catastrophes since 2011 (Willis Re estimates). Note that the 2018 estimates differ to those reported in
                                        our previous document due to loss creep of events

Natural Catastrophes in 2019                                     1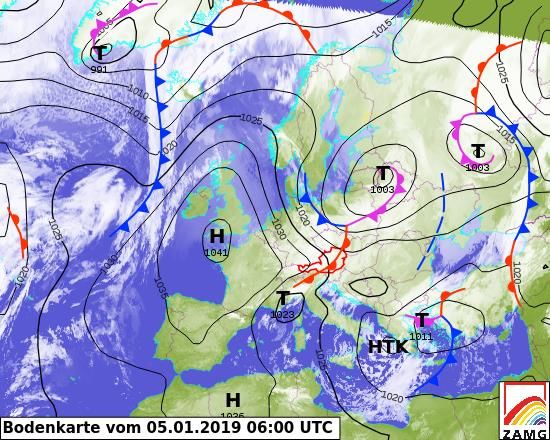
A couple of visualizations showing both the regional and per peril distribution of loss estimates is
presented in the figures below.
For regionalization purposes we have divided the globe into Asia Pacific (APAC), Europe, the Middle East
and Africa (MEA), North America, and Latin America and the Caribbean (LAC). For 2019, North America
had the largest insured losses with around 46% of the total, closely followed by APAC with 37%. In a
distant third position, we see LAC with about 10% of the total insured losses (driven by Hurricane Dorian
and a significant number of flood events), followed by Europe with circa 6% and the MEA region with
under 1%.
By peril, severe weather (hail, tornado, straight wind) had 40% of the total losses followed by tropical
cyclones (hurricanes) in the Northwestern Pacific with 32%, and tropical cyclones in the Atlantic with 12%.

Natural Catastrophes in 2019                          2
1. In focus

The 2019 Australian bushfire season
Record low rainfall and warmer than average temperatures in 2019 resulted in the highest ever fire
weather risk across Australia as measured by the Forest Fire Danger Index (FFDI), with record high values
observed in areas across all states and territories (Figure 1).

Climate processes: Australia's climate was impacted
by a positive Indian Ocean Dipole in 2019, exerting
a drying influence over many parts of the country. A
prolonged negative phase of the Southern Annular
Mode enhanced the warm and dry conditions in areas
of eastern Australia, and a sudden stratospheric
warming in September shifted the westerly winds
further north over New South Wales and Queensland
in October and November.
The combination of dry, hot and windy conditions
provides the perfect environment for bushfires to                  Figure 1. Accumulated-FFDI deciles for spring 2019
                                                                   (based on all years since 1950). Source: Special
ignite and spread rapidly.
                                                                   Climate Statement 72-dangerous bushfire weather in
                                                                   spring 2019 (Australian Bureau of Meteorology)

Catastrophic fire danger ratings have been issued in New South Wales (NSW), Western Australia (WA), South
Australia (SA) and Victoria (VIC). Impacts include the loss of human lives and damage to property, as well as
extensive loss of wildlife and environmental heritage. (Further details on impacts can be found on page 27.)

Almost all major fires that continue to burn into 2020 are beyond a suppressible size and will only be
extinguished through a significant rainfall event or a deficit of consumable fuel. Elevated fire conditions are
expected to persist across eastern Australia into February, despite an increased chance of rainfall suggested
by local weather conditions.

 Figure 2. Firefighters tackle the Gospers Mountain fire       Figure 3. Satellite image of Batemans Bay, Australia, on
   in the Greater Blue Mountains World Heritage Area            December 31, 2019. (Copernicus EMS; Sentinel 2/ESA)
     outside Sydney. Photograph: Dean Lewins/EPA

  Natural Catastrophes in 2019                             3
Latin America and the Caribbean – was nat cat the main loss driver
for the region in 2019?
In the Latin America and Caribbean
region, the losses and impacts of natural
catastrophes have been particularly low
in 2019. The largest insured losses for
2019 may not be from natural
catastrophes but from political risks
generating significant losses to local
cedants as cover is included in many
property programs.

Hurricane Dorian was the only notable
cyclone of the season to impact the Latin
America and Caribbean region. The
Category 5 hurricane hit the Bahamas with       Figure 4. Hurricane Dorian’s path across the Bahamas (Source:
                                                USAID)
maximum sustained wind speeds of 185
mph. Due to the atmospheric steering conditions, Hurricane Dorian stalled over the Bahamian islands of
Abaco and Grand Bahama for 36 hours, prolonging the storm’s interaction with the islands and causing
extensive damage. PMLs on the affected islands were high, but insured losses were contained as the
impacted area only accounts for ~20% of the overall exposure in the Bahamas – the main commercial
area of New Providence/Nassau being mainly unaffected by the event.

With no notable earthquake loss in the region and a quieter Atlantic hurricane season, from a natural
catastrophe perspective, Hurricane Dorian produced the highest insured losses. However, political risk in
Chile is emerging as the dominant driver of loss for regional cedants.

In the lead-up to January 1, 2020, renewals,
one of the main discussion points in the
industry, has been the reinsurance market’s
reaction to emerging political risk losses.
Rioting in Chile in 2019 may end up producing
the largest losses for the region and bring
notable changes to the market. Chile has
been a very stable country for the past 20
years; however, on October 18, 2019, a rise in
metro fares sparked widespread civil unrest in
areas of Santiago and other cities. This unrest
produced looting and damage to property, with
large retail units bearing the worst of the
                                                   Figure 5. The riots in Santiago, Chile (Source: Insurer Insider)
damage. While most of the damage was
produced in the first week of the unrest, demonstrations continued for more than a month. The Chilean
Government estimate the insured losses from the riots could reach ~$3 billion.

As losses increase, insurers and reinsurers are now looking to implement new underwriting measures in
reaction to how strikes, riots and civil commotion (SRCC) cover is written and protected.

Natural Catastrophes in 2019                              4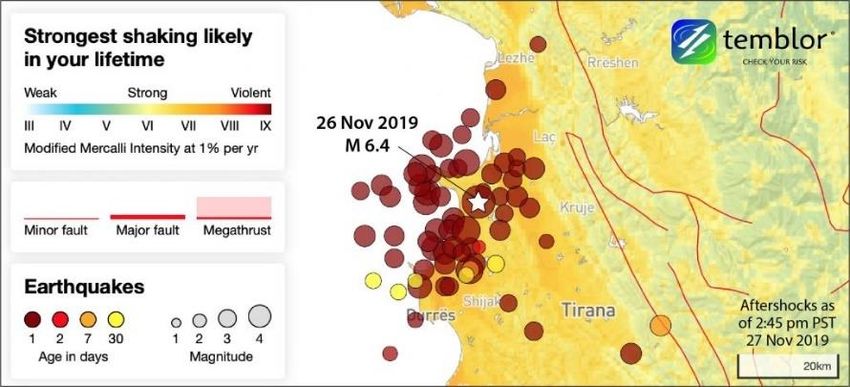
Climate change, anomaly or a new norm for Europe?
Climate change has become a pressing topic for the insurance industry. In 2019, the Prudential
Regulatory Authority (PRA) in the UK became the first regulator to ask insurers to quantitatively
assess the tangible impact of climate-related financial risks. With other regulatory bodies looking
to follow, it will fall upon a wider group of insurers in Europe and beyond to determine both the
financial impact of climate change and how to adapt their view of risk accordingly.
It is widely recognized that
climate change plays a part in
varying the frequency and
severity of catastrophic disasters
(according to the
Intergovernmental Panel on
Climate Change [IPCC]). For
example, based on IPCC climate
scenarios (Figure 6) the
European Environment Agency
(EEA) forecasts both an                  Figure 6. Forest fire danger in the present climate and projected
increase in the danger of wildfire       changes under IPCC climate scenarios (Source: EEA)
across Central and Southern Europe due to rising temperatures and an increase in the likelihood of storm
surge and tidal flood events, as seen in Venice this November, due to rising sea levels.
Event experience has shown a general trend of increasing numbers of catastrophic events and
catastrophe-related losses (Figure 7). Whether these increased losses are indicative of long-term
anthropogenic climate change, a shorter-term natural variability or a combination of both, remains to be
seen. This is due to both uncertainty in the leading driving mechanisms of catastrophic events and
external human factors, including increased insured value. Taking European windstorms as an example,
2019’s largest event, Eberhard, caused insured losses of USD $851 million – over half of total European
windstorm losses, which were significantly lower than previous years . This highlights the variability of
European windstorms, for which there are three
recognized competing mechanisms that are
affected by climate change:

    1. Arctic warming decreasing the equator
       to pole temperature gradient, generally
       associated with weakening windstorms
    2. Atmospheric warming increasing latent
       heat release, which is thought to
       strengthen windstorms
    3. Northward migration of the jet stream
       changing windstorm tracks

It is still unknown how the combination of these
competing mechanisms will impact the future of
windstorm intensity, frequency, track and,
ultimately, losses. However, challenges such as
these present a unique opportunity for the
insurance industry to liaise with the wider
scientific community and develop new climate-        Figure 7. Number of weather-related catastrophic events and
based risk frameworks to better project future       resultant losses from 1980 to 2018 (Source: Munich Re)
losses.

Natural Catastrophes in 2019                        5
The US in 2019 – a year which could have been big
In the US, 2019 industry losses were fairly benign relative to recent years, with only three events
exceeding USD 1 billion and none exceeding USD 5 billion. In contrast, 2018 and 2017 both saw
multiple events exceeding USD 5 billion in insured loss.
The year’s most significant insured loss event was a severe
thunderstorm outbreak across the Rockies, Central and
Northeastern regions of the US between May 26 to 29 (Figure
8). This outbreak produced 189 tornado reports, 355 hail
reports and 606 straight-line wind reports. Of note, was an EF-4
tornado that produced heavy damage near the city of Dayton,
Ohio, on May 27. Economic losses for this event are estimated
to be between USD 2.7 to 3.9 billion (NOAA).
Figure 8. Thunderstorm reported on May 26
(Source: SPC, NOAA)
Also among the year’s most significant insured loss events are
Hurricane Dorian (August 28 to September 6) and Tropical
Storm Imelda (September 16 to 21). Total insured losses for
these two events exceeded USD 1 billion. Hurricane Dorian
made landfall on the Outer Banks of North Carolina as a slow-
moving category 1 hurricane, after devastating the northern
Bahama Islands with category 5 intensity (see Latin American
and Caribbean section). Dorian weakened as it tracked
offshore parallel to the Florida, Georgia and South Carolina
coastlines before making landfall in North Carolina (Figure 9),
bringing a destructive sea-side surge that inundated many
coastal properties and isolated residents that did not
evacuate. Significant flood damage to many homes and
businesses occurred on the Outer Banks of North Carolina, in Figure 9. Hurricane Dorian’s path as of
September 1 (Source: NOAA)
addition to severe storm and tornado damage. Tropical Storm
Imelda and its remnants brought 24 to 36 inches of rainfall over a three-day period across a large area
between Houston and Beaumont, Texas. The largest storm total of 43.39 inches was reported at North
Fork Taylors Bayou, Texas. Many thousands of homes, cars and businesses were impacted by flood
water due to extraordinarily heavy rainfall. Imelda now represents the fifth 500-year flood that has
impacted a portion of southeast Texas over the last five years (NOAA).
The 2019 wildfire season was not as active as 2018. However,
October saw two significant wildfires in California with
combined insured loss estimate less than USD 1 billion. The
Saddle Ridge Fire, October 10 to 23, started near Sylmar, Los
Angeles, and burned more than 8,000 acres while destroying
19 structures and damaging 88. The Kincade Fire, October 23
to November 6, started northeast of Geyserville, Sonoma
county, and burned more than 77,000 acres – an area more
than twice the size of city of San Francisco (Figure 10).
According to CalFire, 374 structures were destroyed and 60 Figure 10. GeoMAC Kincade Fire Extent issued
more were damaged by the Kincade Fire. on November 8, 2019 (Source: SpatialKey)
Natural Catastrophes in 2019 6Europe and the Middle East – a stark reminder of pan-European
earthquake risk
Throughout 2019, a series of earthquakes across Europe have served as a reminder that
damaging and life-threatening earthquakes can occur across the continent.
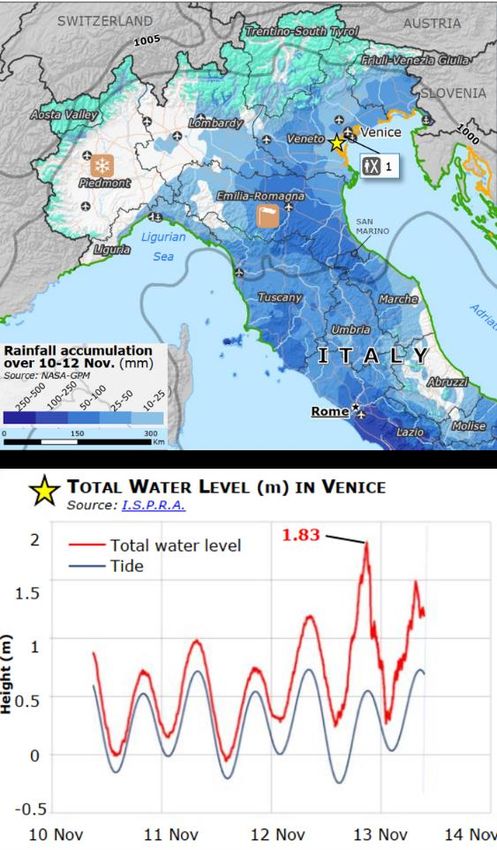
In the late stages of 2019, Albania suffered a series of moderate to strong earthquakes. Initially, a
Mw 5.6 event on September 21, near the port city of Durrës, led to hundreds of damaged buildings. The
main shock in the sequence was a Mw 6.4 and occurred two months later on November 26,
approximately 15 km north from the first. This resulted in 52 fatalities, which is one of the highest
worldwide from an earthquake in 2019. Thousands of buildings were damaged, including several multi-
story apartment buildings that collapsed, with the event resulting in significant local economic losses.
Albania is no stranger to earthquakes, with relatively large events also occurring in 1988, 1982 and 1979.
This earthquake hazard arises from tectonic compression across the Balkan region, which extends from
Croatia down through the Adriatic Sea into Greece, and has given rise to significant earthquake activity in
the region throughout history. Local geology may have also played a role in the violent nature of the
November 2019 event, with shaking intensified by weak soil conditions in the region surrounding Durrës
(Temblor).
Elsewhere in 2019, a Mw 5.7
earthquake occurred in the Marmara
Sea, Turkey, on September 26 and
was felt widely across Istanbul. While
damages were not significant, the
event is a reminder of the risk
earthquakes pose to Istanbul.
An unusually shallow Mw 4.8
earthquake also struck
southwestern France on November
Figure 11: Epicenter of the Mw 6.4 Albania event and subsequent
11. While damage was localized and aftershock sequence, via Temblor
very limited in extent, the event stresses
the risk posed by earthquakes in regions not typically associated with active seismicity.
2019 seismic activity, particularly within Albania, highlights both the importance of appropriate
quantification of seismic hazard across Europe and the imposition/regulation of stringent building
standards in regions prone to seismic shaking. While the events discussed have not produced very
significant insured losses, the potential does exist in Europe – particularly in seismically active regions
such as Italy, Greece, the Balkans and Turkey – and an appropriate risk management is advised.
Natural Catastrophes in 2019 72. Major natural catastrophes in 2019
Winter weather January 1 to 15, 2019
Northern Europe,
Central and Eastern Timeline and meteorology
Europe (mainly ▪ Heavy snowfall first occurred in the early days of
Austria), Northern January, caused by a blocking high over the
Greece British Isles as well as several low-pressure
areas in Scandinavia, pushing wind masses
toward the Northern Alps (FU Berlin, ZAMG,
meteoschweiz).
▪ The severe weather led to storms, flooding and
heavy snow in Scandinavia, snow pressure
Insured losses losses and avalanches, as well as heavy
(in USD millions) precipitation and freeze in Central and Eastern
Europe and Northern Greece (ORF, SMHI).
▪ 150 (Willis Re)
Impact
▪ Due to high amounts of fresh snow (up to 300cm Weather map at 06:00 UCT on January 5
Fatalities within a few days in AT (ZAMG) there was an (source: ZAMG)
▪ >26 (The increased risk of avalanches, while snow in
Weather combination with rainfall and warmer
Channel) temperatures was a source of snow pressure
losses.
▪ Multiple fatalities in avalanches and snow
pressure-related accidents (The Weather
Channel).
▪ Damage to hotels in Austria and Switzerland that
were buried by avalanches.
▪ Evacuation of villages in Austria and Norway due
to avalanche risk.
▪ Temporary shut-down of skiing areas in Austria.
▪ Roads and rail tracks blocked by snow and fallen
trees (ORF).
▪ Cancellation of flights in Innsbruck (AT), Munich
(DE) and Thessaloniki (GR) (ORF).
Natural Catastrophes in 2019 8BL Northwestern
January 5 to 6, 2019
U.S.
Northwestern U.S.
Timeline and meteorology
▪ An upper-level trough along with rain showers
over the Pacific Northwest generated intensified
isolated thunderstorms.
▪ The frontal system and onshore flow brought
Insured losses strong wind gusts that caused tree and structure
(in USD millions) damage in the evening and overnight, resulting
in widespread power outages.
▪BL Northeastern
January 20 to 23, 2019
U.S.
Northeastern U.S.
Timeline and meteorology
▪ An area of low pressure at the surface, along
with high pressure originating in southern
Canada moved toward the Northeastern U.S.
▪ The upper-level trough and southern position of
Insured losses the jet stream caused cold air to flow southward
(in USD millions) over the Great Lakes.
▪ Relatively dry conditions and extremely cold
▪ST Midwest U.S. February 23 to 26, 2019
Midwest and
Northeast U.S. Timeline and meteorology
▪ A low-pressure system along with the associated
frontal boundary brought scattered hail and
strong wind gusts to the region.
▪ Multiple tornados were reported across northern
Mississippi and Alabama, reaching up to EF-3
strength.
Insured losses ▪ Gusty winds and very cold temperatures
(in USD millions) remained on the Northeast as high pressure
▪WS Storm Dragi- March 9 to 10, 2019
Eberhard
Belgium, France,
UK, Germany, Eberhard was the largest windstorm of the 2018-2019
Switzerland, Czech European winter storm season.
Republic, Poland,
Slovakia, Timeline and meteorology
Netherlands, ▪ Due to frequent prevailing westerly winds in the
Luxembourg early parts of 2019, Europe was repeatedly
impacted by unstable weather conditions and
thunderstorms (DWD).
▪ The weaker low-pressure storm system, Dragi,
was the one to hit first on March 9, followed by
Eberhard just a day later (PERILS).
Insured losses ▪ Eberhard commenced over the UK and moved
(in USD millions) across Belgium and the Netherlands. The storm European weather forecast for Saturday,
then continued toward Central Germany and the
▪ 851 (PERILS) Czech Republic with average wind speeds of
March 9 at 12:00 UTC (source: DWD via FU
▪ 550-660 for Berlin)
around 100 km/h (DWD).
Germany ▪ Gale-force winds were measured in parts of
(Willis Re) Germany (DWD).
▪ < 550 for
Germany Impact
(GDV) ▪ A village in East Germany was cut off by fallen
trees, residents were temporarily unable to
▪ 1,000 to 1,650 return to their homes, and power outages were
(AIR) reported (DW).
▪ Emergency services attended to 900 storm-
Fatalities related incidents in Bavaria.
▪ 3 (PERILS) ▪ German Rail (Deutsche Bahn) stopped their train
service in the state of North-Rhine Westphalia,
also affecting international trains.
▪ Austrian Federal Rail (ÖBB) canceled all
services on March 10.
▪ Several flights were delayed or cancelled in Eberhard Maximum Wind Speeds (source:
Germany. EuroTempest via SpatialKey)
▪ The loss return period was calculated to be 1.5
years Europe-wide and 10 years for Belgium
(PERILS).
Natural Catastrophes in 2019 12Cyclone Idai March 9 to 17, 2019
Mozambique
Cyclone Idai was the deadliest natural catastrophe in
the first half of the calendar year.
Max. Category 3
Timeline and meteorology
▪ Tropical Cyclone Idai developed on March 9 in
the Southern Indian Ocean, more specifically, in
the Mozambique Channel.
Insured losses ▪ It attained cyclone status on March 10, located
around 307 miles north-northeast of Europa
(in USD Millions)
Island.
▪ 140 (Swiss Re) ▪ On March 15, Idai made landfall near Beira,
Mozambique, with maximum sustained wind
speeds near to 103.6 mph.
Economic losses
(in USD millions) Impact
▪ 2,000 (Swiss Re) ▪ The accumulated rainfall was more than 600mm
affecting several areas of Mozambique.
▪ Idai caused an extended storm surge along the
coastal area of Sofala province. Beira city was
Fatalities the worst affected with a maximum storm surge
of 4.4m near Beira on the March 14.
▪ 1,013 (Munich ▪ The number of fatalities reported was 1,013 Cyclone Idai Track (source: Meteofrance)
Re)
(Munich Re), and the total number injured was
1,641.
▪ 160,297 people were displaced, and 1.85 million
people were in need of humanitarian services.
▪ Over 223,000 homes were destroyed and over
715,378 hectares of crop damage.
Natural Catastrophes in 2019 13BL Midwest U.S. March 12 to 17, 2019
Midwest U.S.
Timeline and meteorology
▪ A strong weather system developed over the
Central and Southern Plains, followed by severe
thunderstorms bringing heavy rainfall.
▪ The heavy rain resulted in flash flooding across
the region.
Insured losses ▪ Gusty wind and large hail also impacted western
(in USD millions) Texas.
▪ 6 to 12+ inches of snow impacted the Rockies
▪Iran Floods March 17 to April 9, 2019
Iran
Timeline and meteorology
▪ Heavy rainfall in the last two weeks of March,
coupled with the nature of the terrain caused
severe flash flooding across Iran. Since the start
of the flooding at least 28 of the 31 provinces in
Insured losses Iran were impacted. To a lesser extent, Syria
and Iraq were also affected.
(in USD millions)
▪ In the worst affected areas such as Golestan
▪ >15 agricultural province, 70% of the annual average rainfall fell
losses (Agro in the first 24 hours.
Insurance) ▪ This intense rainfall followed a very wet winter,
which was significantly above the five-year
average, consequently leading to high
Economic losses antecedent ground conditions. Accumulated rainfall for Iran for the period
18 to 31 March 2019 (JBA)
(in USD millions) ▪ Heavy rainfall continued throughout late March
▪ 4,100 (OCHA) and the start of April, which led to further flash
▪ 2,500 (Munich flood events (GEOGLAM Crop Monitor).
Re) ▪ The rainfall from late December to early April
was 44% higher than the average precipitation
over the last 50 years (OCHA).
Fatalities
▪ >78 (OCHA) Impact
▪ The worst affected provinces were Golestan,
Ilam and Lorestan.
▪ At least 78 people lost their lives, with
approximately 1,140 injured across Iran (OCHA).
▪ At least 500,000 people were displaced, with
over 10 million affected and 2 million of those in
need of humanitarian assistance.
▪ Around 65,000 houses were destroyed,
>114,000 damaged and >14,000 km of roads
were affected. Infrastructure networks were also
damaged, which, in turn, cut off smaller towns
and villages. Additionally, water and sewer
systems were destroyed and heavily affected, as
well as health facilities and schools (OCHA).
▪ The heavy rain also resulted in landslides.
▪ There are >USD$15m agricultural insured
losses, however, overall insured losses are
uncertain.
Natural Catastrophes in 2019 15ST Southern U.S. March 23 to 25, 2019
Southern U.S.
Timeline and meteorology
▪ A low-pressure system was moving across the
Central and Southern Plains throughout the day,
with an associated cold front situated over
western Texas.
▪ Throughout the morning and afternoon, the
Insured losses system brought scattered showers and locally
(in USD millions) heavy rainfall to the region, with some isolated
▪ >1,000 (PCS) thunderstorms resulting in gusty winds.
▪ Reports of hail greater than 2 inches came from
north of Dallas.
Impact Thunderstorm reported on March 24 (source:
▪ Damage to roofs and roof shingles was SPC, NOAA)
observed .
▪ Many vehicles were reported to have been
damaged due to hailstorm.
Thunderstorm hail size. Pink indicates
largest hail size (source: NOAA)
ST Northeast U.S. April 12 to 15, 2019
Northeast U.S.
Timeline and meteorology
▪ An upper-level trough and associated surface
low-pressure system set the stage for a multi-
day severe weather outbreak causing strong to
severe thunderstorms.
▪ This outbreak brought high wind speeds, large
Insured losses hail and multiple tornadoes, some of which were
(in USD millions) very strong.
▪ST Southern U.S. April 23 to 25, 2019
Southern U.S.
Timeline and meteorology
▪ An area of low pressure moved into
western Texas, with an associated cold front
extending from the Mid-Mississippi Valley into
the region.
▪ The moist air mass ahead of the front initiated
Insured losses severe thunderstorms, which led to heavy rainfall
(in USD millions) and flash flooding as well as very large
▪ST Midwest U.S. May 16 to 17, 2019
Midwest U.S.
Timeline and meteorology
▪ According to reports, a frontal boundary
stretched from the Great Basin through the
Great Lakes region.
▪ Very large hail was a consequence of the storms
and impacted the region, with reports of
Insured losses hailstones greater than 2 inches, in some areas.
(in USD millions)
▪ 1,000 (PCS) multiple damaging tornadoes across the
Midwest.
Fatalities: 1 ▪ Large hailstones reportedly impacted an area
from Illinois through Ohio.
▪ Heavy rains over the central parts of the U.S. Thunderstorm reported on May 26 (source:
caused extensive flooding before moving on SPC, NOAA)
toward the Northeast.
▪ Hailstone diameters of more than 2 inches were
reported in Oklahoma, Colorado, Illinois,
Nebraska, Pennsylvania and Indiana.
▪ Wind gusts of more than 90 mph were reported
in these regions.
Impact
▪ Close to 100,000 properties were affected by
power outages.
Thunderstorm reported on May 28 (source:
SPC, NOAA)
Natural Catastrophes in 2019 18ST Central/Western
June 4 to 5, 2019
Europe
Netherlands,
Germany Timeline and meteorology
▪ Two days of sustained heavy rain, strong winds,
and thunder resulting in widespread disruption
and damage.
▪ Wind gusts of 127 km were recorded in Utrecht
(Weer).
▪ 60,000 lightning flashes were recorded as the
Insured losses storm passed (DWD).
(in USD millions) ▪ The North-West German town of Bocholt saw
wind speeds of 181 to 253 km and a F2 tornado
▪ >10
touchdown (DWD).
Fatalities Impact
▪ 0 ▪ 71 people were hospitalized at the ‘Rock am
Ring’ music festival due to lightning strikes. Radar image of area affected, June 4, 9:00
▪ Amsterdam airport temporarily stopped p.m. (UTC) (source: Ventusky)
departures.
▪ The Dutch Association of Insurers has estimated
tens of millions of losses for the Netherlands.
ST Southern U.S. June 9 to 10, 2019
Southern U.S.
Timeline and meteorology
▪ A cold front and an unstable air mass resulted in
severe storms across Texas and Oklahoma.
▪ A series of storms moved through central
Oklahoma, resulting in strong wind gusts of up to
70mph and large hail near Oklahoma City.
Insured losses ▪ The severe thunderstorms brought very large
(in USD millions) hail to central Texas, from San Antonio and
northward through Dallas, with multiple reports
▪European
Hailstorms (Storm June 10 to 13, 2019
Jörn)
Germany, Poland,
Slovenia, Czech The main event was a hailstorm that hit the city of
Republic Munich on June 10 and became the most loss-
intense severe weather to hit Germany in 2019.
Timeline and meteorology
▪ After a series of severe weather occurrences in
Central Europe in early June, the German city of
Insured losses Munich was hit by a supercell on June10,
(in USD millions) bringing about heavy rainfall of 10l/sqm in 9
▪ 830 (Munich Re) minutes, strong winds of up to 118 km/h and
hailstones with diameters of up to 6.5cm. The
▪ 770 – 990 for
storm then moved on toward Eastern Europe
Germany
(DWD, Artemis).
(Willis Re) European weather forecast for Monday, June
▪ Additional flooding occurred in Eastern Germany 10 at 12:00 UTC (source: DWD via FU Berlin)
due to heavy rainfall (merkur).
Economic losses ▪ Hailstorms affected the Czech Republic and
Poland where hailstones of diameters 3-4cm
(in USD)
caused minor damage (ESWD).
▪ 1.1bn (Munich ▪ Severe hailstones with diameters of up to 11cm
Re) were measured in Southern Slovenia, damaging
properties and vehicles (ESWD).
Fatalities Impact
▪ 0 ▪ No fatalities, but several people were injured
(merkur).
▪ Extensive property damage to house fronts,
window blinds and attic windows.
▪ Motor damage due to broken car windows, as
well as dents and holes in vehicle bodies European weather forecast for Tuesday,
(merkur). June 11 at 12:00 UTC (source: DWD via FU
▪ Damage to photovoltaic power plants (ESWD). Berlin)
▪ Disruption of rail services due to fallen trees on
rail tracks (merkur).
▪ Disruption of air traffic in Berlin (RMS).
▪ Economic damages are higher than insured
damages due to low insurance penetration
(GDV). About three-fourths of losses arising from
the German storms were insured (Munich Re).
▪ Losses in Munich could have been much higher
had the hail hit the city center and had it
occurred a day later – due to the Pentecost bank
holiday, the city was rather empty (Artemis).
Natural Catastrophes in 2019 20WS Italy June 20 to 23, 2019
Italy
Timeline and meteorology
▪ Severe winds and hail occurred across Northern
Italy, most significant in the regions of Reggio-
Emilia, Modena and Bologna.
▪ Wind speeds of up to 120km/h and 100mm of
Insured losses rainfall were recorded in the worst affected
regions (MeteoWeb).
(in USD millions)
▪ Hail stones measuring up to 6cm in diameter
▪ 277 (Willis Re) were observed in some areas (ESWD).
Fatalities Impact Severe convective storm over Modena
▪ 1 (MeteoWeb) ▪ Significant damage to late season fruit crops and (MeteoWeb)
plants (Agro Insurance).
▪ Hail caused damage to vehicles and property
including smashed windshields and damaged
windows and roofs (MeteoWeb).
▪ 30 people reported injured (ESWD).
▪ Damage was also caused by fallen trees and
power lines.
ST Colorado U.S. July 4 to 5, 2019
Colorado, U.S.
Timeline and meteorology
▪ A shortwave trough progressing eastward
toward an area of low pressure developed over
eastern Colorado. High temperatures and
regional instability produced isolated
thunderstorms throughout central-eastern
Insured losses Colorado.
(in USD millions) ▪ A tornado was reported in the northeastern part
of Colorado.
▪EQ California U.S. July 4 to 6, 2019
California, U.S.
Timeline and seismology
▪ California was struck by two large earthquakes
Magnitude:
near Ridgecrest, California. The first earthquake
July 4 - Mw 6.4 occurred on July 4, Mw 6.4 around 18.2 NE of
July 6 - Mw 7.1 Ridgecrest. This was followed by another event
on July 6, Mw7.1 1 7.9 km NE of Ridgecrest
Max. intensity: (USGS).
July 4 - ▪ Reports indicate there were more than 80,000
aftershocks recorded in the Ridgecrest area after
VIII – Severe (MMI) July 4.
July 6 - ▪ The 6.4 magnitude earthquake was later
IX – Violent (MMI) reclassified as a foreshock by the US Geological
Survey (USGS).
Impact
▪ The 7.1 earthquake is reported to have caused
damages to foundations and walls in both
Insured losses residential homes and commercial property.
(in USD millions) ▪ Natural gas leaks and multiple fires were
▪HU Barry July 10 to 18, 2019
South and Midwest
U.S. ▪ Hurricane Barry was the second named storm of the
▪ 2019 North Atlantic hurricane season. The system
Category 1 at ▪ developed into a tropical depression and later
landfall Tropical Storm Barry.
Timeline and meteorology
▪ Barry formed following a trough of low pressure
over the Southeast, eventually triggering a low-
pressure area over the Gulf of Mexico.
Insured losses ▪ On July 13, Barry strengthened into a category 1
(in USD millions) hurricane and made landfall along the south-
central coast of Louisiana. Wind speed and path of Hurricane Barry
▪ST Northeast and
July 19 to 23, 2019
Midwest U.S.
Northeast and
Midwest U.S. Timeline and meteorology
▪ Scattered thunderstorms produced heavy rainfall
and high wind gusts in Wisconsin and Michigan,
leading to localized flash flooding in this area.
▪ The system continued to move east toward
Michigan during the late hours of July 20,
bringing severe thunderstorms, wind gusts and
Insured losses heavy rainfall.
(in USD millions) ▪ A tornado with wind speeds of 110 mph was
reported in Massachusetts.
▪ST Montana U.S. August 10 to 11, 2019
Minnesota and
Wisconsin, U.S. Timeline and meteorology
▪ An upper-level trough and area of low pressure
brought scattered showers and severe
thunderstorms to the region
▪ Heavy rains were observed in many parts of the
region.
▪ Large hailstones with diameters of 2-3 inches
Insured losses and wind gusts of 60+ mph were observed in
(in USD millions) parts of southern-central Montana.
▪Hurricane Dorian August 26 to September 7, 2019
▪
Eastern and Central
Caribbean, ▪ Major Hurricane Dorian was the strongest hurricane
Northern Bahamas, ever recorded in the open Atlantic.
US and Canada ▪
Timeline and meteorology
▪ Dorian formed on August 23 as a low-pressure
Max. Category 5
system. It slowly strengthened as it tracked north
Category 5 at west through the Caribbean, reaching its peak
landfall in the strength at Category 5 intensity as it curved
Bahamas westward toward the northern Bahamas.
▪ On September 1, Dorian made landfall at Elbow
Cay on the Abaco Islands as a Category 5
hurricane with maximum sustained wind speeds
of 185 mph (NHC).
▪ The storm proceeded to make a second and
third landfall in Marsh Harbour and over the east
Insured losses coast of Grand Bahama Island. Wind speed and path of Hurricane Dorian
(in USD billions) ▪ During the next 36 hours, Dorian remained (source: NASA, NHC)
▪ 4.0 – 8.5 stationary over Grand Bahama and Abaco
(RMS US) Islands due to the atmospheric steering
▪ 1.5 – 3.0 conditions being offset. During that time, wind
(AIR US) gusts in excess of 150 mph and a storm surge of
up to 15 ft impacted the island, causing
catastrophic damage.
Economic losses ▪ After impacting the Bahamas, the storm slowly
tracked along the east coast of Florida and the
(in USD billions) southeastern U.S. coastline. On September 6,
▪ 3.5 – 6.5 Dorian made landfall over Cape Hatteras, North
(Moody’s Carolina as a Category 1, bringing strong winds,
Analytics) storm surge, heavy rainfall, and localized flash
flooding to the region. The storm then tracked
offshore of the New England coastline toward
Fatalities eastern Canada as a post-tropical cyclone.
▪ ~70 (IMC) Hurricane Dorian’s path as of August 30
▪ ~300 missing Impact
(source: NOAA)
(IMC) ▪ Hurricane Dorian caused widespread and
catastrophic wind and storm surge damage in
the Bahamas, particularly on the islands of
Abaco and Grand Bahama.
▪ Structural damage was significant in Abaco with
a high proportion of buildings being completely
destroyed by a combination of wind and storm
surge.
▪ RMS used satellite imagery to determine the
level of damage in Marsh Harbour and Elbow
Cay and found at least 80% of buildings were
destroyed or partially damaged.
▪ The international airport near Freeport was
inundated with 6 ft of water (RMS). Most
buildings, including the terminal building, were
severely damaged.
Natural Catastrophes in 2019 26Australian bushfires September 2019 to present (ongoing event)
Timeline of bushfire catastrophes declared by the
Insurance Council of Australia (ICA)
▪ September 7, 2019: Catastrophe CAT193 event
declared as up to 70 bushfires across southern
Location QLD and 70 in NSW resulted to numerous
New South Wales property losses over September 5 to 9 (ICA).
(NSW), Queensland ▪ October 10, 2019: Catastrophe CAT194 event
(QLD), Victoria (VIC), declared as severe bushfires impacted regions
South Australia (SA), around Drake, Tabulam, Coongbar and Rappville
Western Australia (Northern NSW) (ICA).
(WA), Tasmania (TAS) ▪ November 8, 2019: Catastrophe CAT195 event
and Northern Territory declared as a series of fires continue to impact
(NT) NSW, QLD, VIC and SA.
CAT195 event remains open as the bushfire
Insured loss estimate emergency continues (ICA).
(in USD millions) ▪ During the final week of 2019, multiple new fires
broke out across NSW, VIC, SA and WA while
Ongoing event several fires merged into a megafire complex in MODIS/VIIRS fire activity October 1, 2019,
▪ ~ 910 (ICA, as at East Gippsland VIC, impacting towns across East to January 7, 2020, shown in red for
January 14) Gippsland, the Alpine region and southeast NSW southern and eastern Australia.
(Willis Re Event Response).
▪ January 3,2020: The Ravine Fire on Kangaroo
island SA broke containment lines, burning 35%
of the Island. This resulted in the death of two
people and the destruction of 56 houses and
several tourist lodges. Significant additional
losses were incurred across NSW, VIC and SA
between December 30 and January 4.
▪ January 8, 2020: Over 100 fires remain active in
NSW, while more than 30 are still active in VIC as
part of large fire complexes (Willis Re Event
Response).
Impact (as of January 14, 2020)
▪ A total property loss of 1,994 domestic homes
have been confirmed: 1,687 (NSW), 110 (VIC),
144 (SA), 45 (QLD), 1 (WA), 2 (TAS) and 5 (NT). Buildings and property lost as bushfires
(ICA, RFS. ICA loss estimates are currently at impact Failford (NSW) on November 24,
473 million USD).
2019.
▪ The total burnt area across all of Australia is
currently 8 million hectares: 4.9 million ha
(NSW), 1.2 million ha (VIC), 270,000 ha (SA),
250,000 ha (QLD), 1.7 million ha (WA) and
32,000 ha (TAS). (ICA)
Loss numbers are expected to rise significantly,
particularly in NSW and VIC as assessment teams
gain access to the fire grounds.
Natural Catastrophes in 2019 27Typhoon Faxai September 8, 2019
Timeline and meteorology Best track map (top) and central pressure
▪ September 5: Tropical storm Faxai formed north of chart (bottom, time zone = UTC) for
the Northern Mariana Islands, approximately 2,500 Typhoon Faxai from Digital Typhoon
km southeast of Japan before tracking north-
Location westward (Willis Re Event Advisory).
Japan ▪ September 6: As of 06:00 UTC, Tropical Storm
Faxai gradually intensified, featuring an estimated
Category minimum central pressure of 996 hPa and 10-
minute sustained wind speeds of approximately 90
Maximum: 4
km/h (Willis Re Event Advisory).
At landfall: 2 ▪ September 8: Typhoon Faxai made landfall on the
Miura Peninsula in Kanagawa at approximately
Insured loss 04:00 local time (18:00 UTC) before tracking
estimate across Tokyo Bay to make a second landfall by
(in USD billions) Chiba City, 20 miles (32 km) east of Tokyo (Willis
▪ ~ 7 (Swiss Re) Re Event Response).
The Japan Meteorological Agency (JMA) reported
through their automated weather station group
Fatalities (AMEDAS) observed 10-minute sustained wind
speeds of up to 35.9 m/s (129 km/h) and minimum
3 (Insider)
recorded central pressure of 968.3, equivalent to a
Category 2 (Willis Re Event Response).
▪ September 10 to 11: Typhoon Faxai tracks
northeast, away from Japan and dissipates (Digital
Typhoon).
Impact
▪ Around 864,000 houses lost power, including the
entire city of Kamogawa, east of Tokyo (National
Broadcaster NH).
▪ The local fishery industry suffered an estimated
430 million yen in losses as of September 17
(Prefectural Government).
▪ On Monday, September 9, airlines cancelled more
than 100 flights, which left more than 13,300
people stranded at the airport (Airport spokesmen,
CNN).
▪ This came at the time of the 2019 Rugby World
Cup being held in Japan – the storm caused
disruptions to the England and Australian teams’
arrivals into Japan (Reuters).
▪ As well as fatalities, it is estimated that more than
30 people were injured, and many thousands of
evacuations took place (Firstpost.com).
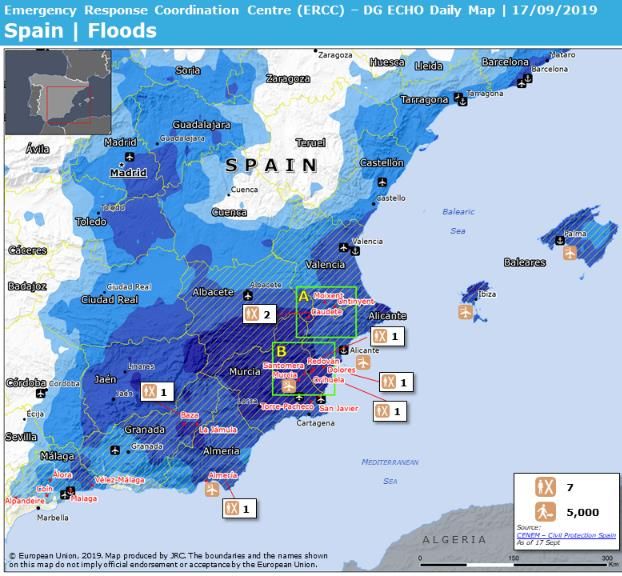
Natural Catastrophes in 2019 28Spain Floods September 11 to 14, 2019
Spain Timeline and meteorology
▪ On September 11, torrential rain began in
southwest Spain.
▪ The average rainfall per day was 100 l/m²
between September 11 and 14.
▪ Rainfall peaked at 300l/m² per day (Spanish
Insured losses environment agency).
▪ The total flooded area was 4,263 ha (42.63 km²)
(in USD millions)
(Copernicus).
▪ 317 (CCS and
Agroseguro) Impact
▪ 3,500 people were evacuated, including 2,000
Economic losses residents of the town of Santomean in Murcia
(in USD millions) (FloodList).
▪ >1,660 ▪ 700,000 students were affected due to the
Valencia only closure of a number of schools (GDACS).
(Local Valencian ▪ Almería and Murcia airports were closed
Government) (GDACS).
▪ Property and motor insured losses are USD Map showing flooding extent and fatalities
Fatalities $224 million (Spanish Insurance Consortium – per area (Source: ERCC)
▪ 6 (OCHO) CCS)
▪ Agriculture insured losses are USD $93 million
(Spanish Agricultural Insurance Association
Agroseguro)
▪ The Spanish Government scheme (CCS)
expected 30,000 claims.
▪ Economic losses for other regions have not yet
been announced.
▪ This is the highest payout recorded for flood
events (CCS).
▪ AEMET recorded this event as having the
highest flood damage since 1879.
Natural Catastrophes in 2019 29Tropical Storm
September 16 to 21, 2019
Imelda
Louisiana and ▪
Texas, U.S. Timeline and meteorology
▪ Tropical Storm Imelda formed on Friday,
September 15 over the Gulf of Mexico.
▪ The storm got upgraded from being labelled a
tropical depression eleven when it reached
maximum sustained wind speeds of 35 mph on
Insured losses September 16.
(in USD billions) ▪ It was again downgraded to tropical depression
as it was moving inland over the greater
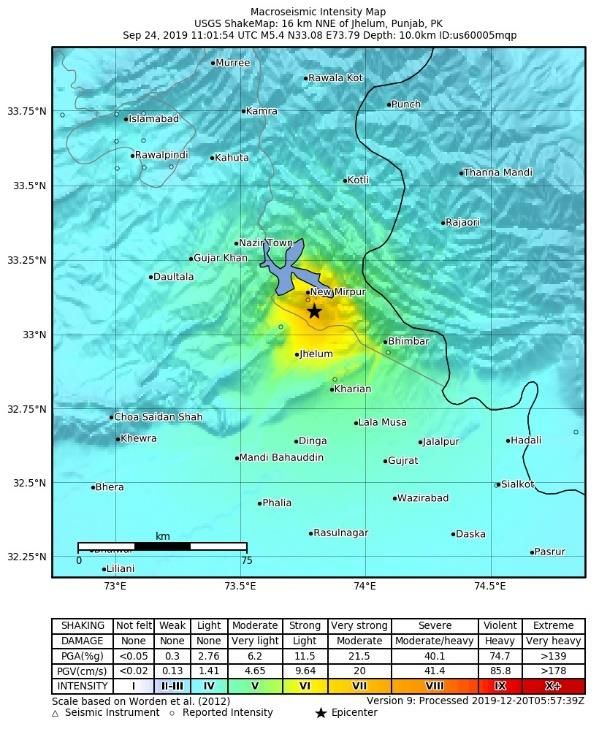
▪EQ Pakistan September 24, 2019
Pakistan, New
Mirpur Timeline and seismology
▪ On September 24, at 16:02 (local time), a Mw 5.4
earthquake occurred in New Mirpur, Pakistan, as
Magnitude: Mw 5.4
a result of shallow reverse faulting near the
convergent boundary between the Indian and
Max. intensity: VII – Eurasian plates.
moderate (MMI) ▪ The epicenter was located 7 km southeast of
New Mirpur City, at a depth of 10 km (USGS).
Depth: 10 km ▪ The earthquake originated along the Samwal-
Jharik Kass fault, which is the same fault line
responsible for the highly damaging 2005
Kashmir earthquake.
▪ There was one significant aftershock measuring
4.7 Mw two days after the main earthquake
(USGS).
Economic losses
(in USD millions) Impact
▪ 34% probability ▪ There were 38 fatalities, with a further 665
between 100 injured (GoAJ&K).
and 1000 ▪ 500 to 3,000 properties were reported as fully ShakeMap (source: USGS)
(USGS) damaged, 4,000 to 10,000 partially damaged
and 50 to 200 vehicles damaged (NDMA
Pakistan, GoAJK).
Fatalities ▪ Four bridges and five roads were damaged
▪ 38 (GoAJ&K) (NDMA Pakistan).
▪ Electric power supply, mobile and landline
telephone services were severely disrupted in
Mirpur and Bhimber districts (IFRC).
▪ Ex-Gratia assistance of approximately USD
$14,000 was provided to next of kin of deceased
persons jointly by the Government of Pakistan
and the Government of Azad Jammu and
Kashmir (NDMA).
Natural Catastrophes in 2019 31EQ Marmara Sea September 26, 2019
Turkey
Timeline and seismology
Magnitude: 5.7
▪ On September 28 at 13:59 local time, a Mw 5.7
earthquake occurred in the Marmara Sea. Its
Depth: 8 km epicenter was located 20 km southeast of
Marmaraereğlisi (USGS).
▪ The earthquake occurred on the North Anatolian
fault at a depth of 8 km (USGS).
▪ The event was preceded by a Mw 4.9 foreshock
on September 24.
Insured losses
▪ Two aftershocks > Mw 4 followed the main
(in USD millions) event.
▪ Not significant
Impact
▪ No fatalities were reported.
Fatalities ▪ More than 473 buildings were damaged; no
▪ 0 buildings were reported destroyed (AFAD).
▪ 55 schools and two minarets were damaged.
▪ The earthquake occurred within a seismic gap,
which is a portion of the fault that has not yet
Intensity (MMI) map of affected area
ruptured. Due to the relatively low magnitude of
(source: USGS)
the event, it is likely this gap still exists and,
hence, the potential for larger events in the same
region along the fault.
Natural Catastrophes in 2019 32Hurricane Lorenzo October 2 to 4, 2019
North America,
Azores, Ireland, UK Timeline and meteorology
▪ Lorenzo formed from a tropical wave off the west
coast of Africa on September 22 (NOAA).
Max. category: 5
▪ At 00:00 UTC, September 23, the storm had
Category 1 at strengthened into Tropical Depression Thirteen.
landfall ▪ Six hours later, the storm strengthened and
formed Hurricane Lorenzo.
▪ On September 25, the storm intensified to
Category 1 on the Saffir-Simpson Hurricane
Scale with 90mph winds.
▪ 48 hours later it had further intensified into a
Economic losses Category 4 and one of the strongest hurricanes
ever to form in the eastern Atlantic.
(in USD millions)
▪ As the storm turned north, it weakened to a
▪ 367 in Azores Category 3.
(Scientific ▪ Lorenzo then re-strengthened to a Category 5 on Tropical-storm-force wind speed probabilities
American) September 29 at 00:00 UTC, only staying at this (Source: National Hurricane Center)
peak for 15 hours.
▪ Rapid weakening occurred before Lorenzo
Fatalities passed the western side of Flores Island as a
▪ 19 (NOAA) Category 1 hurricane.
▪ Lorenzo became extra-tropical at 12:00 UTC on
October 2.
Impact
▪ Lorenzo was the costliest hurricane in Azores
history.
▪ 11 fatalities were caused when a ship sank near
the eyewall of the hurricane on September 26.
There were also eight fatalities along the US
east coast, due to hazardous surf conditions
(NOAA).
▪ 100 people were evacuated from homes in
Azores (NHC) and 53 people were left homeless
(Regional Civil Protection and Fire Service of the
Azores).
▪ Azores declared an “energy crisis situation” in
Corvo and Flores due to the difficulty getting fuel
to these islands (Azores Regional Government).
▪ 20,000 people lost electricity in Ireland (NHC).
▪ Flights were cancelled in Ireland (NHC).
▪ 50 to 100mm of rain fell between October 2 to 3,
causing flooding in Ireland (Met Éireann).
Natural Catastrophes in 2019 33Saddleridge
October 10 to 23, 2019
Wildfire
California, U.S.
Timeline
▪ California was battered by several wildfires in the
time period of October to early November of this
year.
▪ The fires first broke out in Southern California on
October 10.
Insured losses ▪ This included the Saddleridge Fire, which started
(in USD millions) near Sylmar, Los Angeles, and the Sandalwood
▪Typhoon Hagibis October 12 2019
Timeline and meteorology
▪ October 5: Typhoon Hagibis formed as a
depression to the west of the Mariana Islands
Location and began tracking westward (Willis Re Event
Japan Advisory).
▪ October 7 to 10: Typhoon Hagibis developed
Category into a category 5 equivalent hurricane and began
tracking toward Japan (Digital Typhoon).
Maximum: 5
▪ October 12: Typhoon Hagibis made landfall just
At landfall: 2 before 10:00 UTC (19:00 JST) on the Izu
Peninsula in Shizuoka Prefecture as an
Insured loss equivalent category 2 (10-minute sustained wind
estimate speeds of 88 km/h and gusts of 132 km/h).
(in USD billions) Hagibis then tracked northeast through Japan, DG ECHO Daily Map | 14/10/2019 Emergency
▪ ~ 8 (Swiss Re) with the highest recorded 10-minute sustained Response Coordination Center (ERCC)
wind speeds of 125 km/h at Haneda Airport at
21:00 JST (MLIT).
Fatalities ▪ October 13 to 14: Typhoon Hagibis tracks away
from Japan and becomes extra-tropical (Digital
85 (NHK)
Typhoon).
▪ The large radius of the storm, combined with
higher-than-average sea surface temperatures
led to a large amount of precipitation in Japan
causing widespread flooding, with over 200
rivers overflowing (NHK).
Impact
▪ As of October 13, approximately 424,000 homes
were without power (reliefweb.int) and 153,000
without running water (Ministry of Economy,
Trade and Industry).
▪ Approximately 13,000 houses were inundated
and 900 completely or partially destroyed (JBA).
▪ Industrial sites were significantly flooded along
the Chikuma river in Nagano Prefecture and in
Koriyama city in Fukushima Prefecture (JBA).
▪ Large residential areas experienced flooding in
Nagano and Chiba Prefectures (JBA).
▪ The shinkansen (bullet train) maintenance yard
in Nagano was inundated and 10 trains are due
to be scrapped.
▪ Two dominant Japanese airlines cancelled a
total of 558 (ANA) and 540 (JLA) flights (JBA).
DG ECHO Daily Map | 14/10/2019 Emergency
Response Coordination Center (ERCC)
Natural Catastrophes in 2019 35Tropical Storm
October 18 to 20, 2019
Nestor
Southern U.S.
Timeline and meteorology
▪ On October 18, a disturbance over the western
Gulf of Mexico began to organize and intensify
into a tropical system.
▪ Initially, the minimum central pressure for the low
Insured losses remained around 1007mb, with maximum
(in USD millions) sustained winds around 35 mph.
▪Kincade Wildfire October 23 to November 6, 2019
California, U.S.
Timeline
▪ The Kincade Fire, northeast of Geyserville,
Sonoma County, California, ignited on
Wednesday, October 23.
▪ 77,758 acres, an area more than twice the size
of San Francisco, were burned in Sonoma
Insured losses County per updated information from CalFire
(in USD millions) and media sources.
▪Tropical Storm
October 25 to 26, 2019
Olga
Southern U.S.
Timeline
▪ Tropical Storm Olga formed on Friday, October
25 over the Gulf of Mexico after getting
upgraded from a tropical depression seventeen.
▪ It was declared a post-tropical storm by the
Insured losses evening hours of October 26 before making
(in USD millions) landfall, bringing high winds and heavy rainfall to
▪UK Floods November 7, 2019
United Kingdom
Timeline and meteorology
▪ A slow-moving weather front caused persistent
and heavy rainfall over Derbyshire, Lincolnshire,
Nottinghamshire and South Yorkshire between
03:00 November 7 to 03:00 November 8.
Insured losses ▪ 50 to 100 mm of rainfall was recorded over the
24-hour period, equivalent to 122% of the
(in USD millions)
average monthly rainfall for November (Met
▪ 100 – 155 (PWC) Office, CEH).
▪ 143 (ABI) ▪ Saturated soil, following a succession of wet
months in northern, central and eastern England
Fatalities prior to the event, exacerbated run-off and
▪ 1 (Met Office) flooding.
▪ Provisional estimates of peak flow gauge data
suggest peak river flows equivalent to a one in
50-year event, with some locations equivalent to
a one in 250-year event (CEH).
Impact
▪ There was severe flooding of both the River
Derwent and River Don.
▪ One fatality occurred, because a woman was
swept away by flood waters in Derbyshire (Met Rain-radar image of persistent front taken at
Office). 12:00 November 7, 2019 (top) hourly rainfall
▪ Initial estimates indicate 4,000 flood claims at Sheffield and Gringley-on-Hill over a 24-
hour period (bottom) (source: Met Office)
relating to 2,250 homes and businesses and
1,788 damaged vehicles (ABI).
▪ Damages resulted in insured losses estimated at
USD 143 million, with USD 58 million covering
residential buildings and contents, USD 75
million for commercial buildings and contents,
and USD 10 million for vehicle damages (ABI).
▪ Rail services between Matlock, Derby and
Nottingham were cancelled.
▪ Schools, utilities and health care institutions
were affected.
Natural Catastrophes in 2019 39Italy and Venice
Severe weather and November 10 to 12, 2019
floods
Northeast Italy
Timeline and meteorology
▪ A combination of heavy rain, strong winds and
storm surge caused flooding in much of North-
East Italy.
▪ A high spring tide combined with a
meteorological storm surge caused the worst
Economic losses flooding for 50 years in Venice where flood
waters covered 80% of the city and reached up
(in USD millions)
to 1.87m in height (FloodList).
▪ >1,100 (Local
Venetian Impact
Government) ▪ Significant damage to historical buildings in
Venice’s city center.
▪ Low insured losses in Venice due to the
Fatalities exclusion of tidal flood in many policies.
▪ 2 (ECHO) ▪ Economic losses of at least USD$1.1billion are
estimated by the Mayor of Venice (Local
Venetian Government).
▪ Italian government promised individuals could
claim up to €5,000 ($5,500), and businesses up
to €20,000 ($22,000) in compensation (BBC
news).
▪ Elsewhere in Italy maximum red alerts where in
place for windstorms and floods, with 10,000
residents in Emilia-Romagna suffering gas and
power cuts and 11,000 left without power in
Bolzano (thelocal IT).
▪ These storms and floods have also caused
significant damage to Italy's agriculture and Accumulated rainfall over Italy between
fishing industries. November 10-12, 2019 (top), and total water
level in Venice from November 2019 10-14
Natural Catastrophes in 2019 40You can also read