Atmospheric blocking induced by the strengthened Siberian High led to drying in west Asia during the 4.2 ka BP event - a hypothesis
←
→
Page content transcription
If your browser does not render page correctly, please read the page content below
Clim. Past, 15, 781–793, 2019
https://doi.org/10.5194/cp-15-781-2019
© Author(s) 2019. This work is distributed under
the Creative Commons Attribution 4.0 License.

Atmospheric blocking induced by the strengthened Siberian
High led to drying in west Asia during the 4.2 ka BP event
– a hypothesis
Aurel Perşoiu1,2 , Monica Ionita3 , and Harvey Weiss4
1 Emil Racoviţă Institute of Speleology, Romanian Academy, Cluj Napoca, 400006, Romania
2 Stable Isotope Laboratory, Ştefan cel Mare University, Suceava, 720229, Romania
3 Alfred Wegener Institute, Helmholtz Center for Polar and Marine Research, 27570 Bremerhaven, Germany
4 School of Forestry and Environmental Studies, Yale University, New Haven, CT, USA

Correspondence: Aurel Perşoiu (aurel.persoiu@gmail.com)

Received: 25 November 2018 – Discussion started: 6 December 2018
Revised: 27 March 2019 – Accepted: 29 March 2019 – Published: 11 April 2019

Abstract. Causal explanations for the 4.2 ka BP event are         of Eurasia the 4.2 ka BP event was a century-scale winter
based on the amalgamation of seasonal and annual records          phenomenon, in the monsoon-dominated regions it may have
of climate variability that was manifest across global re-        been a feature of summer climate conditions.
gions dominated by different climatic regimes. However, in-
strumental and paleoclimate data indicate that seasonal cli-
mate variability is not always sequential in some regions.        1   Introduction
The present study investigates the spatial manifestation of the
4.2 ka BP event during the boreal winter season in Eurasia,       The 4.2 ka BP climate event was a ca. 200–300-year period
where climate variability is a function of the spatiotemporal     of synchronous abrupt megadrought, cold temperatures, and
dynamics of the westerly winds. We present a multi-proxy          windiness that were manifest globally (Walker et al., 2018).
reconstruction of winter climate conditions in Europe, west       Coincident societal collapses and habitat tracking, particu-
Asia, and northern Africa between 4.3 and 3.8 ka. Our results     larly in regions where archaeological data are both extensive
show that, while winter temperatures were cold throughout         and high resolution, have attracted the attention of many pa-
the region, precipitation amounts had a heterogeneous distri-     leoclimatologists and archaeologists since the event’s first
bution, with regionally significant low values in W Asia, SE      observation (Gasse and van Campo, 1994; Weiss et al.,
Europe, and N Europe and local high values in the N Balkan        1993; Dalfes et al., 1997). Numerous attempts have there-
Peninsula, the Carpathian Mountains, and E and NE Europe.         fore been made to characterize and quantify the event’s na-
Further, strong northerly winds were dominating in the Mid-       ture and to identify its causes at several levels of explana-
dle East and E and NE Europe. Analyzing the relationships         tion. These studies have first defined the spatial extent and
between these climatic conditions, we hypothesize that in the     variability of the event. Megadrought developed abruptly at
extratropical Northern Hemisphere, the 4.2 ka BP event was        ca. 4.2 ka cal BP across North America, Andean South Amer-
caused by the strengthening and expansion of the Siberian         ica, the Mediterranean basin from Spain to Turkey (except
High, which effectively blocked the moisture-carrying west-       for a few records from N Morocco and S Spain that indi-
erlies from reaching W Asia and enhanced outbreaks of cold        cate wetter conditions), Iran, India, Tibet, and north China
and dry winds in that region. The behavior of the winter and      and Australia (Booth et al., 2005; Staubwasser and Weiss,
summer monsoons suggests that when parts of Asia and Eu-          2006; Arz et al., 2006; Berkelhammer et al., 2013; Cheng
rope were experiencing winter droughts, SE Asia was experi-       et al., 2015; Weiss, 2016; Kathayat et al., 2018). In south-
encing similar summer droughts, resulting from failed and/or      ern Asia, failure of the monsoon (Wang et al., 2005) caused
reduced monsoons. Thus, while in the extratropical regions        widespread droughts (Staubwasser et al., 2003; Berkelham-

Published by Copernicus Publications on behalf of the European Geosciences Union.
782                                       A. Perşoiu et al.: Atmospheric blocking induced by the strengthened Siberian High

mer et al., 2013). Abrupt cold conditions, however, appeared       Africa between 4.3 and 3.8 ka cal BP. From examination of
at ca. 4.2 ka cal BP in the northern North Atlantic (Geirs-        the spatial distribution of temperature and precipitation ex-
dóttir et al., 2019), the midlatitudes of the northern Eurasia     cursions during this period, we hypothesize that, in the re-
(Hughes et al., 2000; Mayewski et al., 2004; Andresen and          gions around the Eurasian landmass, the 4.2 ka BP event was
Björck, 2005; Mischke and Zhang, 2010; Larsen et al., 2012;        caused by the strengthening and expansion of the Siberian
Baker et al., 2017), and Antarctica (Peck et al., 2015) and        high-pressure cell centered over western Asia that caused
surrounding oceans (Moros et al., 2009).                           widespread cooling at midlatitudes in the Northern Hemi-
   These descriptive data have encouraged numerous causal          sphere and aridification in the Middle East. We further dis-
hypotheses at both a regional and, to a lesser extent, global      cuss the possible causes and mechanisms leading to this phe-
level for the event’s spatiotemporal distribution and quali-       nomenon in a global perspective.
ties. Possible thermohaline circulation weakening or shut-
down due to freshwater release in the North Atlantic (similar
to the 8.2 ka event; Alley et al., 1997), changes in the loading   2   Methods
of the Earth’s atmosphere with aerosols or CO2 (Walker et
al., 2012), and volcanic forcing (Kobashi et al., 2017) have       For our analysis, we have selected proxy records from Eu-
been rejected as causes (Walker et al., 2012). At regional ex-     rope, the Middle East, northern Africa, and the Atlantic
planatory levels, cooling of the southern oceans (Moros et         Ocean that cumulatively fulfilled a set of five criteria on in-
al., 2009) could have resulted in stronger and more frequent       terpretation, chronology, resolution, and nature of climatic
El Niño events that would have weakened (or led to the fail-       variability. We have selected only records of winter climate
ure of) the southern Asian monsoons (Morrill et al., 2003;         variability, either precipitation amount (the vast majority) or
Walker et al., 2012).                                              air temperature, as indicated by the authors. Where no sea-
   The abrupt century-scale wet event recorded at very high        son was indicated we assumed that the proxy is recording an-
resolution in North America at Mt. Logan, Yukon (Fisher et         nual climatic changes and we excluded it from our analysis.
al., 2008), suggests an interval of massive advection of trop-     We have selected records with at least two absolute age de-
ical air to NW North America linked to El Niño emergence           terminations for the millennium encompassing the 4.2 ka BP
at ca. 4.2 ka (Shulmeister and Lees, 1995). A southward shift      event and for which measurement uncertainties were less
of the Intertropical Convergence Zone (ITCZ) could result          than 50 years. A few high-resolution records from the fringes
in the observed cooling at high latitudes and stronger west-       of the core study area (mainland continental Europe, the Mid-
erlies in the Northern Hemisphere and widespread drought           dle East, and the Mediterranean basin) with age uncertainties
in the tropics (Gasse and Van Campo, 1994; Mayewski et             up to 80 years were nevertheless used to refine the spatial
al., 2004). However, the widespread droughts both at the           interpretation of the results. To allow for chronological un-
northern and southern margins of the ITCZ suggest that             certainties, we have selected records that showed the onset of
rather than migrating, the ITCZ was narrowing, resulting in        the local event within ±100 years of the accepted onset of the
megadrought affecting the tropics both south and north of          4.2 ka BP event (Walker et al., 2018) and a duration between
the Equator (Weiss, 2016). Combining the above observa-            50 and 300 years. Further, we have considered only records
tions, it seems that while some of the climate variability at      that showed both an abrupt onset and termination (arbitrarily
ca. 4.2 ka cal BP can be attributed to regionally observable       set to 15 % against the preceding 100 years), matching the
causes, explanations do not yet account for the global nature      widely distributed 4.2 ka BP event onset, and for which at
of the event, which includes the disruption of the westerlies      least five data points exist for the 4300–3800 cal BP interval.
and reduction of moisture advection to continents.                    The response of European temperatures and precipitation
   Hypothesized causal explanations for the 4.2 ka BP event        to the variability of the Siberian High (SH) (Fig. 1) is based
are based on the amalgamation of winter, summer, and an-           on the Climatic Research Unit Timeseries (CRU TS) 4.01
nual records of climate variability that was manifest in re-       dataset (Harris et al., 2014). The relationship between the
gions dominated by different climatic regimes (e.g., west-         SH intensity, sea level pressure (SLP), and 10 m wind has
erly dominated vs. monsoon dominated). However, both               been analyzed within composite maps for the years when the
instrumental (Balling et al., 1998) and paleoclimate data          SH index was greater (high) and lower (low) than a value of
(Perşoiu et al., 2017) indicate that, on scales ranging from      1 standard deviation. We have computed composite maps in-
annual to millennial, seasonal climate variability was not         stead of correlation maps because the former considers the
always sequential; i.e., warm (cold) summers were not al-          nonlinearities included in the analyzed data. The SH index
ways followed by warm (cold) winters. To address this co-          has been obtained by averaging the SLP over the key regions
nundrum, we have investigated the spatial manifestation of         between 40 and 65◦ N and between 80 and 120◦ E (Pana-
the 4.2 ka BP event during winter in a region dominated by         giotopoulos et al., 2005). The SLP and 10 m zonal and merid-
climate variability induced by the strength and dynamics           ional wind data were extracted from the ERA 20C dataset
of westerly winds. We present a reconstruction of winter           (Poli et al., 2016). Our analysis has shown that the results are
climate conditions in Europe, the Near East, and northern          not sensitive to the exact threshold value used for our com-

Clim. Past, 15, 781–793, 2019                                                                  www.clim-past.net/15/781/2019/
A. Perşoiu et al.: Atmospheric blocking induced by the strengthened Siberian High                                                  783

                                                                         temperature-sensitive proxies are from central and northern
                                                                         Europe and SW Asia, while the precipitation-sensitive prox-
                                                                         ies cover the entire study area (between 30◦ W and 80◦ E and
                                                                         between 20 and 78◦ N), with a concentration in Europe, the
                                                                         Middle East, and northern Africa (Fig. 1). Both temperature-
                                                                         and precipitation-sensitive proxies were plotted against the
                                                                         map depicting the correlation between winter (December–
                                                                         January–February, DJF) climate (temperature and precipita-
                                                                         tion) and a stronger than usual Siberian High (Fig. 1).

                                                                         3.1   Cold Europe and southwest Asia

                                                                         The 4.2 ka BP event appears generally as cold during win-
                                                                         ter throughout Europe, from the Urals to the Atlantic Ocean
                                                                         (Fig. 1a). The highest amplitude of cooling is seen in the Ural
                                                                         Mountains (Baker et al., 2017) and at high altitude in the
                                                                         Alps (Fohlmeister et al., 2013), both recorded by speleothem
                                                                         δ 18 O, as well as in central Asia (Wolff et al., 2017) recorded
                                                                         by speleothem δ 13 C. Other records show only a moderate to
                                                                         weak cooling (Daley et al., 2010; Nesje et al., 2001; Muschi-
                                                                         tiello et al., 2013). The general picture that emerges from the
                                                                         data is that of westward decreasing cooling with increased
                                                                         distance from eastern Europe and western Asia. We did not
                                                                         find winter temperature proxies for SW Europe and the Mid-
                                                                         dle East to fulfill our selection criteria; the majority of the
                                                                         proxies from this region are usually sensitive to precipitation
                                                                         amount changes.
                                                                            Cold winters in Europe are associated with either block-
                                                                         ing conditions over central Europe or westward expansion of
Figure 1. Climatic conditions at 4.2 ka cal BP in Europe and west-
ern Asia. The background map in (a) shows the correlation between        the high-pressure cell – the Siberian High – centered over
the winter SH index and the winter mean temperature (December–           Asia (Cohen et al., 2001; Rîmbu et al., 2014; Ionita et al.,
January–February, DJF), with blue (red) shading indicating cold          2018). In the Northern Hemisphere (NH), during the winter
(warm) winters. The dots indicate winter climatic conditions at          season, three semipermanent and quasi-stationary systems
4.2 ka cal BP. The background map in (b) shows the correlation be-       prevail over the middle to high latitudes: the Icelandic Low
tween the winter SH index and winter precipitation (DJF), with           (over the Atlantic Ocean), the Aleutian Low (over the Pacific
green (brown) indicating wet (dry) winters. Green (brown) dots           Ocean), and the Siberian High (SH). The SH is a semiper-
in (b) indicate wet (dry) conditions at 4.2 ka cal BP. The hatched ar-   manent anticyclone centered over Eurasia and is associated
eas in (a) and (b) indicate correlations significant at the 95 % level   with cold and dense air masses in the NH and extreme cold
based on a Student’s t test. The numbers in (a) and (b) correspond
                                                                         winters over Europe and Asia (Cohen et al., 2001). The com-
to the archives listed in Table 1.
                                                                         posite maps of the SH index, SLP, and 10 m wind are shown
                                                                         in Fig. 2. As expected, in the case of a positive SH index
posite analysis (i.e., varying the standard deviation between            (HIGH years, Fig. 2a) an extensive area of strong and pos-
0.5 and 1.5). To isolate the interannual variations, the linear          itive SLP anomalies prevails over the whole Eurasian land-
trend has been removed prior to the analysis from the SH                 mass, with the highest anomalies over Siberia. The positive
index as well as from the analyzed fields.                               anomalies in Fig. 2 were found to be statistically significant
                                                                         at the 5 % level using a two-sample t test. This SLP struc-
                                                                         ture is associated with enhanced easterlies and advection of
3   Results and discussion                                               cold air towards Europe (blue background in Fig. 1a). For
                                                                         the years with a low index of the SH (Fig. 2b), negative SLP
The list of records with information on the type of proxy                anomalies prevail over Siberia, while positive SLP anoma-
used and its climatic interpretation, chronology, and reso-              lies are found over the central part of Europe. This kind of
lution is presented in Table 1 and plotted in Fig. 1. Of the             dipole-like structure in the SLP field associated with low SH
30 selected proxies, 11 register winter (or cold season) tem-            years leads to the advection of warm air from the Atlantic
perature and 19 register winter precipitation amount. The                Ocean basin towards the eastern part of Europe.

www.clim-past.net/15/781/2019/                                                                         Clim. Past, 15, 781–793, 2019
784 A. Perşoiu et al.: Atmospheric blocking induced by the strengthened Siberian High
Table 1. List of proxies used and their interpretation. Numbers in the first column correspond to numbers in Fig. 1.
No. Name Proxy Indicator of Proxy interpretation Years per sample Reference
1 Kinderlinskaya Speleothem δ 18 O TW Low values: cold 12.5 Baker et al. (2017)
2 Spannagel Cave Speleothem δ 18 O TW High values: cold, 5 Fohlmeister et al. (2013)
NAO−
3 Scărişoara Ice δ 18 O TW Low values: cold 10 Perşoiu et al. (2017)
d-excess Msource High values:
Mediterranean PP
4 Asiul Cave Speleothem δ 18 O PPw Low values: 1–28 Smith et al. (2016)
high precipitation
5 Gulf of Gaeta G. ruberδ 18 O PPw Low values: 55 Di Rita et al. (2018)
high water inflow
Globigerinoides % Tw High values: cold
6 Tăul Muced Sphagnumδ 13 C PPw High values: wet 8 Panait et al. (2017)
7 Mavri Trypa Speleothem δ 18 O PPw High values: dry 5 Finné et al. (2017)
8 Shkodra Lake Carbonate δ 18 O PPw High values: < 50 Zanchetta et al. (2012)
low precipitation
9 Lake Bjarstrask Gastropod δ 18 O + δ 13 C PPw High values: 80 Muschitiello et al. (2013)
wet winters
10 Buca della Renella Speleothem δ 18 O PPw High values: dry 37 Drysdale et al. (2006)
11 Sidi Ali Lake CaCO3 content PPw Low values: 40 Zielhofer et al. (2017)
high lake level
Ostracod δ 18 O PPw Low values: 130
high % of pp
12 Grotte de Piste Speleothem δ 18 O PPw Low values: wet 15 Wassenburg et al. (2016)
13 Walton Moss Sphagnumδ 18 O TW Low values: cold 80 Daley et al. (2010)
Multi-proxy PPw Low values: dry
14 Hyltemossen Minerogenic content Wind Low values: Björck and Clemmensen (2004)
weak winds
15 Neor Lake Al, Zr, Ti, Si content Dryness High values: dry 3.6 Sharifi et al. (2015)
16 Uluu Cave Speleothem δ 13 C PPw Low values: 38 Wolff et al. (2017)
wet–cold
17 Jostedalsbreen Grain size variations PPw Low values: 21 Nesje et al. (2001)
dry winters
18 Refugio Stalagmite density PPw Low values: 5 Walczak et al. (2015)
dry winters
19 Nattmasvatn Minerogenic input PPw Low values: dry – Janbu et al. (2011)
20 Nar Gölü Lake Diatom δ 18 O PPw Low values: 5 Dean et al. (2018)
more winter rainfall
21 Jeita Cave Speleothem δ 18 O PPw High values: dry 7 Cheng et al. (2015)
22 Bunker Cave Speleothem Mg/Ca PPw High values: dry – Wassenburg et al. (2016)
23 Nuudsaku Lake Carbonate δ 18 O PPw High values: 13 Stansell et al. (2017)
dry winters
24 Gueldaman Cave Speleothem δ 18 O PPw High values: dry – Ruan et al. (2016)
25 Lake Petit Detrital input PPw High values: wet – Cartier et al. (2019)
Clim. Past, 15, 781–793, 2019 www.clim-past.net/15/781/2019/A. Perşoiu et al.: Atmospheric blocking induced by the strengthened Siberian High 785 Figure 2. The composite map of the winter (DJF) sea level pressure (SLP) and wind at 10 m for the years when the SH index > 1 standard deviation (a) and the composite map of the winter (DJF) sea level pressure (SLP) and wind at 10 m for the years when the SH index < −1 standard deviation (b). The hatching highlights significant SLP anomalies at a confidence level of 95 % based on a Student’s t test. The SLP units are in hectopascals (hPa). The robust association between the instrumental-based re- mate data from Asia further indicate the strengthening of the sponse of European and Asian temperatures to a strong SH EAWM at 4.2 ka cal BP (e.g., Hao et al., 2017; Giosan et al., (base map in Fig. 1) and the proxy-based reconstructions of 2018), likely linked to stronger and more frequent outbreaks winter air temperatures (blue dots in Fig. 1a) supports the of cold air from the core of the SH. Similarly, paleoclimate hypothesis that a strengthened SH was active at the time of records from the outer limits of the region impacted by the the 4.2 ka BP event (the possible mechanisms are described SH have documented significant increases in the strength of below). The seasonality of the SH implies its onset in mid- the local winds, frequently a local diagnostic signature of autumn, likely linked to diabatic heating anomalies initiated the 4.2 ka BP event. Various proxies in different sedimentary by snow cover development in NE Siberia (Foster et al., archives across west Asia have documented strong northerly 1983; Cohen et al., 2001). The cooling resulting from the winds at 4.2 ka cal BP: soil micromorphology at Tell Leilan expanding snow cover leads to anomalously high SLP in (NE Syria; Weiss et al., 1993), detrital dolomite and calcite NE Asia, which in turn results in more snowfall and fur- in Gulf of Oman (Cullen et al., 2000) and Red Sea (Arz et ther strengthening of the SLP anomaly. The rapidly devel- al., 2006) marine cores, high Ti counts in Lake Neor on the oping high-pressure and cold anomaly extends westwards, Iranian plateau (Sharifi et al., 2015), S/Ti ratios in Lake Kin- being limited towards the north and east by the warm ocean neret, Israel (Vossel et al., 2018), and lake bed sediments in SSTs (Cohen et al., 2001). The end result of an enhanced SH the UAE (Parker et al., 2006). is a westward-rolling high-pressure system that also brings The strengthened EAWM and high windiness in SW Asia cold air, heavy snowfall, and strong winds towards both Eu- are consistent with the climatology of the SH, with a strong rope and central Asia (Ding and Krishnamurti, 1987; Gong clockwise flow of anomalously cold air from its center of and Ho, 2002; Panagiotopoulos et al., 2005). The develop- action, located in north–central Asia (Fig. 2a). Paleoclimate ment of the SH also leads to strengthening of the subtropical records from Europe also document 4.2 ka BP-related in- jet stream over SE China (Panagiotopoulous et al., 2005), creases in wind strength and/or storminess, such as at the a characteristic feature of the East Asian winter monsoon raised bogs in SW Sweden (linked to cold temperatures and (EAWM; Cheang, 1987), and instrumental data (Wu and possible increased sea ice; Björck and Clemmensen, 2004), Wang, 2002; Jhun and Lee, 2004) show that strengthening of aeolian sandbanks in coastal Denmark (Clemmensen et al., the SH results in a stronger than average EAWM. Paleocli- 2003; Goslin et al., 2018), and Gotland, Baltic Sea (Muschi- www.clim-past.net/15/781/2019/ Clim. Past, 15, 781–793, 2019
786 A. Perşoiu et al.: Atmospheric blocking induced by the strengthened Siberian High
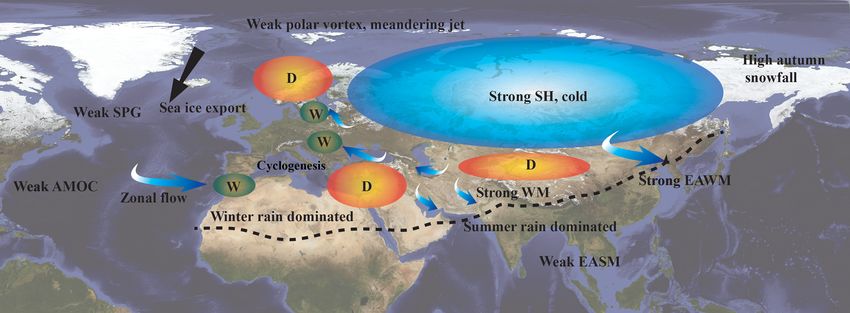
Figure 3. Inferred winter climatic conditions between ∼ 4.3 ka and 3.9 ka cal BP. The position of the polar vortex is only indicative. The
base map shows the Earth’s surface conditions during November (Reto Stöckli, NASA Earth Observatory).
tiello et al., 2013) (Fig. 3), where strong winter winds and Mediterranean, in two regions an increase in winter precipi-
high precipitation, the product of Baltic Sea moisture deliv- tation amounts was registered (Fig. 1b), most notably in NW
ered by intense easterly winds, indicate the reinforcement Africa and SW Europe (Walczak et al., 2015; Wassenburg
and westwards expansion of the Siberian High. These data et al., 2016; Zielhofer et al., 2017) as well as in the central
suggest that a belt of strong winds extended around the core Balkans and Carpathian Mountains (Zanchetta et al., 2012;
region of the SH, from East Asia through west Asia and SE Panait et al., 2017; Perşoiu et al., 2017). Multiple records
Europe up to the Baltic and North Sea (Fig. 3). and different proxies (speleothem and lake sediment δ 18 O,
Summarizing the above information, at ca. 4.2 ka a cold peat bog δ 13 C, cave ice d-excess and growth rate) indicate
temperature anomaly settled over most of Europe from the similarly wet conditions, clearly underscoring the wet nature
Ural Mountains to the Atlantic Ocean, including Scandi- of the climate at that time in these two regions. The high win-
navia, and extending to the region south and east of the ter precipitation amounts registered by records in the Balkan
Caspian Sea, likely the result of a deeper than average Peninsula and the Carpathian Mountains (Fig. 1b) occurred
Siberian High. Further, anomalously high SLP over this re- during periods of intense cold (Fig. 1a). Winter precipitation
gion resulted in the strengthening of winter winds in eastern, in the Carpathian Mountains is the result of either eastward
southern, and southwestern Asia and eastern and northeast- advection of wet air masses of Atlantic origin or precipita-
ern Europe, linked to the clockwise and outward movement tion from northward-traveling Mediterranean cyclones en-
of cold air from the core of the SH-impacted region. countering the NE winds induced by a strong SH. The δ 18 O
and d-excess records from Scărişoara Ice Cave (Perşoiu et
al., 2017) indicate that at 4.3 ka cal BP, late autumn through
3.2 Inconsistent winter precipitation patterns across
early winters were cold and the moisture source was shifted
Europe and southwest Asia
to an area of high evaporation (as indicated by the high d-
Data from winter precipitation records at the time of the excess values). Modern monitoring of stable isotopes in pre-
4.2 ka BP event suggest a far more complex image of precip- cipitation in the region (Drăguşin et al., 2017; Ersek et al.,
itation distribution across our study area (Fig. 1b) compared 2018; Bădăluţă et al., 2019) indicates that high d-excess val-
with the simpler temperature distribution dipole (Fig. 1a). ues occur when the source of moisture is either the eastern
The SE Mediterranean and the wider Middle East were dry Mediterranean Sea or the Black Sea. A Black Sea source for
(Bini et al., 2018), with most of the droughts occurring rather the moisture leading to high precipitation in the Carpathian
abruptly (Cheng et al., 2015; Sharifi et al., 2015; Dean et Mountains is consistent with the information of prevailing
al., 2018). In the wider Mediterranean basin, winter drought northeasterly winds at 4.2 ka (see Sect. 3.1. above), but it
was also recorded in S Greece (Finné et al., 2017), north– would not fully explain the possibly wet conditions on the
central Italy (Drysdale et al., 2006; Regattieri et al., 2014; Adriatic coast at 4.3 ka cal BP (Fig. 1b, Zanchetta et al.,
Isola et al., 2019), N Algeria (Ruan et al., 2016), and cen- 2012), where high winter precipitation is the result of mois-
tral Spain (Smith et al., 2016), with all records pointing ture originating in the Adriatic Sea (Ulbrich et al., 2012). We
towards an abrupt onset and a ca. 150–200-year duration. note, however, that the Adriatic coast could also have been
Against this background of generalized megadrought in the dry at 4.2 ka, as suggested by a spike in the carbonate δ 18 O
Clim. Past, 15, 781–793, 2019 www.clim-past.net/15/781/2019/A. Perşoiu et al.: Atmospheric blocking induced by the strengthened Siberian High 787
record of Shkodra Lake (Zanchetta et al., 2012). Interest- reconstructions of the NAO index (Olsen et al., 2012) indi-
ingly, the response of present-day climatic conditions in Eu- cate a brief negative mode at 4.2 ka cal BP, but contradictory
rope to a stronger than usual Siberian High is low SLP in the evidence from speleothem and pollen data from the central
central Mediterranean Sea (centered on Italy, Fig. 2a), which Mediterranean region (e.g., Bini et al., 2019, and references
in turns results in enhanced cyclogenesis in the area. Thus, therein) suggests that a combination of different mechanisms
in the case of strong SH conditions at 4.2 ka, enhanced cy- (including NAO− conditions) could have been responsible
clogenesis would have resulted in more frequent NW move- for the winter climatic conditions at 4.2 ka in Europe.
ment of moisture-bearing weather systems, further leading
to higher than average precipitation on the Adriatic coast and 3.3 The Siberian High in the global context at 4.2 ka
the Carpathian Mountains (Fig. 1b). Apart from the high d-
excess in the Scărişoara Ice Cave record (Perşoiu et al., 2017) The paleoclimate evidence we have compiled collectively
at 4.3 ka, indicative of Mediterranean moisture, the ice accu- suggests cold winter conditions in N Asia and Europe, likely
mulation rate also reached a maximum at that time, suggest- induced by cold air outbreaks from high-pressure fields lo-
ing high precipitation amounts and the early onset of freezing cated over Siberia, conditions that in modern climates are as-
conditions in the cave, both favorable for the rapid growth of sociated with a strong Siberian High. The sole reconstruction
ice (Perşoiu et al., 2011). of the past behavior of the Siberian High is based on an anal-
Apart from SW Europe, the Balkans, and the Carpathian ysis of the continental-sourced nss K+ (non-sea-salt potas-
Mountains, high precipitation at 4.2 ka in Europe was also sium) in Greenland ice cores (Mayewski et al., 1994; O’Brien
registered in a lake at the foothills of the Alps (Cartier et et al., 1995). Meeker and Mayewski (2002) have shown that
al., 2019) and in Gotland, the Baltic Sea (Muschitiello et al., in years with high nss K+ deposits in Greenland, the SLP
2013). In the Alps, high flooding activity at 4.2 ka was linked over N Asia in spring (indicator of the strength of the SH) is
to increased autumn precipitation (Cartier et al., 2019), while higher than average, thus providing a possible proxy for the
in the Baltic, high winter precipitation is consistent with strength of the Siberian High. The reconstructed values for
strong easterly winds picking up local moisture form the the strength of the SH (using the original data of Mayewski
Baltic Sea (Muschitiello et al., 2013, as well as the discus- et al., 1997) on the GICC05modelext timescale (Seierstad et
sion in Sect. 3.1 above). al., 2014) show a maximum at around 4.3 ka, in agreement
The winter precipitation record in Europe and the Middle within dating uncertainties with the paleoclimate data pre-
East can now be summarized as follows (Fig. 1b). sented in Fig. 1.
Previous studies based on instrumental, tree ring, and ice
1. Regionally significant dry conditions occurred during core impurity content have shown a clear link between a
winter in the Middle East, southern Europe (Italy and strong SH and a cold and dry climate in Europe (Meeker
Greece), northern Africa, and on a band stretching from and Mayewski, 2002; D’Arrigo et al., 2005). The close match
the Atlantic Ocean, through the north European plains, between the impact of the SH on temperature and precipita-
towards eastern Europe, including Scandinavia. tion amounts and the reconstructed climate (Fig. 1) suggests
2. Regionally significant wet conditions occurred during that at 4.2 ka there was a stronger than usual SH, leading to
winter around the Strait of Gibraltar (northern Morocco cooling in Asia and Europe, disruption of the westerlies, and
and southern Spain) and in the northern Balkan Penin- drought in the Middle East (Fig. 3). The possible causes of
sula (including the Carpathian Mountains). this chain of events remains, however, elusive. Some possi-
ble forcings behind climate changes do not appear abruptly
The distribution of precipitation minima and maxima on the at 4.2 ka. Orbital forcing resulted in low winter insolation in
western (Atlantic) side of Europe is similar to that occur- the Northern Hemisphere and comparably high, but decreas-
ring during the negative phase of the North Atlantic Oscil- ing, summer insulation, while radiative forcing was going
lation (NAO), one of the main modes of climate variability through a remarkably long state of stable, albeit high, values
in Europe (Hurrell et al., 2013) that is mainly active during (Steinhilber et al., 2009). Volcanic and greenhouse forcing
winter. The NAO is defined as the difference in atmospheric were both low and stable at 4.2 ka, with no abrupt changes
pressure between the Icelandic Low and the Azores High. A (e.g., Wanner et al., 2011). The high contrast between sum-
below average difference between the two pressure systems mer and winter insolation would have resulted in a weak po-
(negative NAO, or NAO−) results in weaker than usual and lar vortex (Orme et al., 2017) and thus more meridional po-
southward-deflected westerly winds, carrying more moisture lar vortex and associated southward-displaced storm tracks
towards southern Europe. As precipitation amounts are nega- in the Atlantic. The same meridionally displaced polar vor-
tively correlated with the NAO phase in the western Mediter- tex could have led to cold air advection to N Asia and the
ranean (i.e., NAO− results in high precipitation; Lionello et early onset of winter, with earlier formation of snow cover.
al., 2006), the reconstructed distribution of precipitation at The early presence and persistence of snow in NE Asia
4.2 ka (Fig. 1b) partly supports the hypothesis of prevailing is one of the most important triggers of a strong SH (Cohen
NAO− conditions during the 4.2 ka BP event. Proxy-based et al., 2001; Wu and Wang, 2002). The causes and mech-
www.clim-past.net/15/781/2019/ Clim. Past, 15, 781–793, 2019788 A. Perşoiu et al.: Atmospheric blocking induced by the strengthened Siberian High
anisms by which snow accumulates in early winter in NE 4 Conclusions
Asia are elusive; possible causes include a positive feedback
from the NAO, with NAO− conditions in late winter–early We have gathered records of changes in winter tempera-
spring leading to an early beginning of snow accumulation ture, precipitation amount, and associated climatic condi-
in the following winter and subsequent onset of a strong SH tions in the wider Eurasian region during the 4.2 ka BP event.
(Bojariu and Gimeno, 2003). The NAO index (Olsen et al., The data show that 4200 years ago cold winter temperature
2012) shows a continuous change from NAO+ to NAO− anomalies dominated western Asia and most of Europe. The
conditions after 4.5 ka, with a distinct negative excursion strength of winter winds in eastern and southern Asia was
at 4.2 ka. A weak NAO would have resulted in low wind strongly enhanced, while those in western Europe weakened.
stress and associated enhancement of the salinity stratifica- Regionally significant droughts settled over the Middle East,
tion in the North Atlantic, initiating the slowdown of the At- southern and northern Europe, and western Asia, while lo-
lantic Meridional Overturning Circulation (AMOC; Yang et cally significant increases in precipitation were reconstructed
al., 2016). Thornalley et al. (2009) have documented a rapid in the Balkan Peninsula, the Carpathian Mountains, around
and abrupt reduction in salinity at 4.2 ka that could have trig- the Baltic Sea, and in NW Africa and southern Spain.
gered the weakening of the AMOC. Reduced strength of We propose a multi-causal hypothesis of partially mutual
the AMOC could have further led to the southward expan- reinforcing vectors and mechanisms to explain the region-
sion of sea ice and thus a further decrease in salinity and ally coherent north Eurasian and adjacent region 4.2 ka phe-
weakening of the AMOC (Yang et al., 2016). Further, neg- nomena. Thus, we hypothesize that before and at 4.2 ka, the
ative NAO conditions are also linked to a weakening of the orbitally induced high insolation gradient between summer
subpolar gyre (Eden and Jung, 2001; Häkkinen and Rhines, and winter in the high latitudes of the Northern Hemisphere
2004) and thereby a reduced contribution of freshwater to led to a weakening of the polar vortex, resulting in a me-
the AMOC and further cooling in the Nordic Seas. Similarly, andering jet that promoted an early onset of winter in NE
weak NAO conditions result in stronger northeastern winds Siberia. In turn, this resulted in decreasing temperatures and
and increase in the strength of the East Greenland current an early and stronger Siberian High that expanded south and
and associated sea ice export, further leading to the weaken- westwards, bringing cold and dry conditions across Eura-
ing of the thermohaline circulation (Orme et al., 2018) and sia. The same circulation pattern led to more sea ice export
subsequent cooling of the North Atlantic, as seen in both pa- in the North Atlantic and weakening of the subpolar gyre,
leodata and models (e.g., Rîmbu et al., 2003; Renssen et al., resulting in the slowdown of the thermohaline circulation
2005; Berner et al., 2008; Sejrup et al., 2016; Orme et al., and a decrease in sea level pressure around Iceland, thus
2018). In turn, these conditions led to reduced SLP around possibly leading to a shift towards a negative phase of the
Iceland and a reinforcement of the negative NAO. North Atlantic Oscillation. In turn, these changes resulted in
The above inferences suggest that at ca. 4.2 ka, orbital and weaker and southward-displaced westerly winds across Eu-
solar forcing led to a chain of atmospheric changes, trans- rope. However, the high-pressure systems in Europe effec-
mitted and amplified by ocean circulation, which caused tively blocked these weakened westerlies, causing reduced
abrupt cold and dry climatic conditions in northern Eura- winter precipitation and drought conditions across the east-
sia. These atmospheric changes included the weakening of ern Mediterranean and western Asia. Clockwise circulation
the polar vortex and southward advection of cold air over around the Asia-centered high-pressure field induced strong
N Asia. The enhanced meridional transport generated earlier northerly winds in southern and western Asia and in east-
and more persistent autumn snow cover. In turn, this led to ern Europe. Further, the strong thermal pressure gradient
the onset of a stronger than usual Siberian High that lowered between central and northern Asia and the Indian and Pa-
Eurasian surface temperatures with strong outbreaks of cold cific oceans determined the strengthening of the East Asian
and dry northerly winds in a belt stretching from eastern Asia and Indian winter monsoons. However, given the drought in
through portions of west Asia and central and northern Eu- the source regions of the winter monsoon, these strength-
rope. The above average SLP associated with the strength- ened winds did not result in increased moisture advection.
ened SH resulted in the blocking of the moisture-bearing Nevertheless, several regions experienced a slight increase in
westerlies in Europe. Megadrought across the Mediterranean winter precipitation due to strong winds picking up moisture
and west Asia may have also been enhanced by the weak and from local sources (NW Africa, N Balkan Peninsula and the
southward-displaced Atlantic storm track that resulted from Carpathian Mountains, the Baltic region).
lower than average NAO conditions. The conditions associ- In the context of the above data and description, we
ated with a weak polar vortex strengthened sea ice towards suggest that, in the extratropical regions of Eurasia, the
the Nordic Seas, further contributing to the weakening of the 4.2 ka BP event was an abrupt century-scale boreal winter
thermohaline circulation and reduction in the strength of the phenomenon. While not the subject of our study, we note
NAO and the westerlies. that a clear antiphase behavior of the winter and summer
monsoons has been evidenced (Kang et al., 2018), suggest-
ing that at the times when parts of Asia and Europe were
Clim. Past, 15, 781–793, 2019 www.clim-past.net/15/781/2019/A. Perşoiu et al.: Atmospheric blocking induced by the strengthened Siberian High 789
experiencing winter droughts related to strong, dry, winter Review statement. This paper was edited by Giovanni Zanchetta
monsoons, SE Asia was experiencing similar abrupt sum- and reviewed by two anonymous referees.
mer megadroughts resulting from failed and/or reduced mon-
soons. Whether these were caused by the same orbitally
induced changes and/or teleconnections transmitted via the
References
weakened AMOC are questions to be investigated within fu-
ture proxy-based and modeling studies. Especially impor- Alley, R. B., Mayewski, P. A., Sowers, T., Stuiver, M., Taylor, K.
tant would be winter precipitation records from western Asia C., and Clark, P. U.: Holocene climatic instability: A prominent,
and eastern Europe, as well winter temperature records from widespread event 8200 yr ago, Geology, 25, 483–486, 1997.
southern Europe and the wider Middle East, where such data Andresen, C. and Björck, S.: Holocene climate variability in the
are scarce. Further, most of the winter records are of low Denmark Strait region – a land-sea correlation of new and exist-
resolution and/or with poor chronological control such that ing climate proxy records, Geogr. Ann. A, 87, 159–174, 2005.
improvements in these fields are required to further test our Arz, H. W., Lamy, F., and Pätzold, J.: A pronounced dry event
hypothesis. recorded around 4.2 ka in brine sediments from the Northern Red
Sea, Quaternary Res., 66, 432–441, 2006.
Baker, J. L., Lachniet, M. S., Chervyatsova, O., Asmerom, Y., and
Polyak, V. J.: Holocene warming in western continental Eurasia
Data availability. All data in this study have been obtained from
driven by glacial retreat and greenhouse forcing, Nat. Geosci.,
the cited references.
10, 430–435, 2017.
Balling, R., Michaels, P. J., and Knappenberger, P. C.: Analysis of
winter and summer warming rates in gridded temperature time
Author contributions. AP designed the hypothesis, AP and HW series, Clim. Res., 9, 175–181, 1998.
collected, reviewed, and analyzed the paleoclimate data, AP and Bădăluţă, C.-A., Perşoiu, A., Ioniţă, M., Nagavciuc, V., and
MI discussed the climatology of the SH, and AP synthesized the Bistricean, P.-I.: Stable H and O isotope-based investiga-
evidence and wrote the text with input from HW and MI. MI drew tion of moisture sources and their role in river and ground-
the base maps in Fig. 1 and created Fig. 2. water recharge in the NE Carpathian Mountains, East-
Central Europe, Isot. Environ. Healt. S., 55, 161–178,
https://doi.org/10.1080/10256016.2019.1588895, 2019.
Competing interests. The authors declare that they have no con- Berkelhammer, M., Sinha, A., Stott, L., Cheng, H., Pausata, F. S. R.,
flict of interest. and Yoshimura, K.: An abrupt shift in the Indian Monsoon 4000
years ago, in: Climates, Landscapes, and Civilizations, edited by:
Giosan, L., Fuller, D. Q., Nicoll, K., Flad, R. K., and Clift, P. D.,
Special issue statement. This article is part of the special is- American Geophysical Union, Washington, DC, 75–87, 2013.
sue “The 4.2 ka BP climatic event”. It is a result of “The 4.2 ka BP Berner, K. S., Koç, N., Divine, D., Godtliebsen, F., and Moros, M.:
Event: An International Workshop”, Pisa, Italy, 10–12 January A decadal-scale Holocene sea surface temperature record from
2018. the subpolar North Atlantic constructed using diatoms and statis-
tics and its relation to other climate parameters, Paleoceanogra-
phy, 23, PA2210, https://doi.org/10.1029/2006PA001339, 2008.
Acknowledgements. The Scărişoara ice core analyses in Roma- Bini, M., Zanchetta, G., Persoiu, A., Cartier, R., Català, A., Ca-
nia were partially supported by UEFISCDI Romania through grant cho, I., Dean, J. R., Di Rita, F., Drysdale, R. N., Finné, M.,
nos. PN-III-P1-1.1-TE-2016-2210 and PNII-RU-TE-2014-4-1993 Isola, I., Jalali, B., Lirer, F., Magri, D., Masi, A., Marks, L.,
awarded to Aurel Perşoiu, ELAC2014/DCC-0178/FP7, and con- Mercuri, A. M., Peyron, O., Sadori, L., Sicre, M.-A., Welc,
tract 18PFE/16.10.2018 funded by the Ministry of Research and F., Zielhofer, C., and Brisset, E.: The 4.2 ka BP Event in the
Innovation in Romania within Program 1 – Development of na- Mediterranean region: an overview, Clim. Past, 15, 555–577,
tional research and development system, Subprogram 1.2 – Institu- https://doi.org/10.5194/cp-15-555-2019, 2019.
tional Performance-RDI excellence funding projects. Aurel Perşoiu Björck, S. and Clemmensen, L. B.: Aeolian sediment in raised bog
further acknowledges support from SP-PANA-W1010. The Asso- deposits, Halland, SW Sweden: a new proxy record of Holocene
ciazione Italiana per lo studio del Quaternario and the organizers winter storminess variation in southern Scandinavia?, Holocene,
of the “4.2 ka BP Event: An International Workshop” (Pisa, Italy) 14, 677–688, 2004.
financially supported Aurel Perşoiu for attendance at the work- Bojariu, R. and Gimeno, L.: The role of snow cover fluctuations
shop where some of the ideas presented here were born. Mon- in multiannual NAO persistence, Geophys. Res. Lett., 30, 1156,
ica Ionita was funded by the Helmholtz Climate Initiative REK- https://doi.org/10.1029/2002GL015651, 2003.
LIM and by the Polar Regions and Coasts in the Changing Earth Booth, R. K., Jackson, S. T., Forman, S. L., Kutzbach, J. E., Bettis
System (PACES) program of the AWI. We thank the editor, Gio- III, E. A., Kreigs, J., and Wright, D. K.: A severe centennial-
vanni Zanchetta, and two anonymous referees for their comments. scale drought in midcontinental North America 4200 years ago
and apparent global linkages, Holocene, 15, 321–328, 2005.
Cartier, R., Sylvestre, F., Paillès, C., Sonzogni, C., Couapel, M.,
Alexandre, A., Mazur, J.-C., Brisset, E., Miramont, C., and
Guiter, F.: Diatom-oxygen isotope record from high-altitude
www.clim-past.net/15/781/2019/ Clim. Past, 15, 781–793, 2019790 A. Perşoiu et al.: Atmospheric blocking induced by the strengthened Siberian High Lake Petit (2200 m a.s.l.) in the Mediterranean Alps: shedding Eden, C. and Jung, T.: North Atlantic interdecadal variability: light on a climatic pulse at 4.2 ka, Clim. Past, 15, 253–263, oceanic response to the north Atlantic oscillation (1865–1997), https://doi.org/10.5194/cp-15-253-2019, 2019. J. Climate, 14, 676–691, 2001. Cheang, B.-K.: Short- and long-range monsoon prediction in South- Ersek, V., Onac, B. P., and Perşoiu, A.: Kinetic processes and sta- east Asia, in: Monsoons, edited by: Fein, J. S. and Stephens, P. ble isotopes in cave dripwaters as indicators of winter severity, L., John Wiley, New York, 579–606, 1987. Hydrol. Process., 32, 2856–2862, 2018. Cheng, H., Sinha, A., Verheyden, S., Nader, F. H., Li, X. L., Zhang, Finné, M., Holmgren, K., Shen, C.-C., Hu, H.-M., Boyd, M., and P. Z., Yin, J. J., Yi, L., Peng, Y. B., Rao, Z. G., Ning, Y. F., Stocker, S.: Late Bronze Age climate change and the destruction and Edwards, R. L.: The climate variability in northern Levant of the Mycenaean Palace of Nestor at Pylos, PLOS ONE, 12, over the past 20,000 years, Geophys. Res. Lett., 42, 8641–8650, e0189447, https://doi.org/10.1371/journal.pone.0189447, 2017. https://doi.org/10.1002/2015gl065397, 2015. Fisher, D., Osterberg, E., Dyke, A., Dahl-Jensen, D., Demuth, M., Clemmensen, L. B., Andreasen, F., Heinemeier, J., and Murray, A.: Zdanowicz, C., Bourgeois, J., Koerner, R. M., Mayewski, P., A Holocene coastal aeolian system, Vejers, Denmark: landscape Wake, C., Kreutz, K., Steig, E., Zheng, J., Yalcin, K., Goto- evolution and sequence stratigraphy, Terra Nova, 13, 129–134, Azuma, K., Luckman, B., and Rupper, S.: The Mt Logan 2003. Holocene – late Wisconsinan isotope record: tropical Pacific– Cohen, J., Saito, K., and Entekhabi, D.: The role of the Siberian high Yukon connections, Holocene, 18, 667–677, 2008. in northern hemisphere climate variability, Geophys. Res. Lett., Fohlmeister, J., Vollweiler, N., Spötl, C., and Mangini, A.: COM- 28, 299–302, https://doi.org/10.1029/2000GL011927, 2001. NISPA II: Update of a mid-European isotope climate record, Cullen, H. M., deMonecal, P. B., Hemming, S., Hemming, G., 11 ka to present, Holocene, 23, 749–754, 2013. Brown, F. H., Guilderson, T., and Sirocko, F.: Climate change Foster, J., Owe, M., and Rango, A.: Snow cover and temperature and the collapse of the Akkadian empire: Evidence from the deep relationships in North America and Eurasia, J. Appl. Meteorol. sea, Geology, 28, 379–382, 2000. Clim., 22, 460–469, 1983. Daley, T. J., Barber, K. E., Street-Perrott, F. A., Loader, N. J., Mar- Gasse, F. and Van Campo, E.: Abrupt post-glacial climate events in shall, J. D., Crowley, S. F., and Fisher, E. H.: Holocene climate West Asia and North Africa monsoon domains, Earth Planet. Sc. variability revealed by oxygen isotope analysis of Sphagnum Lett., 126, 435–456, 1994. cellulose from Walton Moss, northern England, Quaternary Sci. Geirsdóttir, Á., Miller, G. H., Andrews, J. T., Harning, D. J., An- Rev., 29, 1590–1601, 2010. derson, L. S., Florian, C., Larsen, D. J., and Thordarson, T.: The Dalfes, H. N., Kukla, G., and Weiss, H. (Eds.): Third millennium onset of neoglaciation in Iceland and the 4.2 ka event, Clim. Past, BC climate change and Old World collapse, NATO ASI Series, 15, 25–40, https://doi.org/10.5194/cp-15-25-2019, 2019. Springer Verlag, Berlin Heidelberg, Germany, 1997. Giosan, L., Orsi, W. D., Coolen, M., Wuchter, C., Dunlea, A. D’Arrigo, R., Jacoby, G., Wilson, R., and Panagiotopoulos, F.: A re- G., Thirumalai, K., Munoz, S. E., Clift, P. D., Donnelly, J. constructed Siberian High index since A.D. 1599 from Eurasian P., Galy, V., and Fuller, D. Q.: Neoglacial climate anomalies and North American tree rings, Geophys. Res. Lett., 32, L05705, and the Harappan metamorphosis, Clim. Past, 14, 1669–1686, https://doi.org/10.1029/2004GL022271, 2005. https://doi.org/10.5194/cp-14-1669-2018, 2018. Dean, J. R., Jones, M. D., Leng, M. J., Metcalfe, S. E., Sloane, H. Gong, D.-Y. and Ho, C.-H.: The Siberian High and climate change J., Eastwood, W. J., and Roberts, C. N.: Seasonality of Holocene over middle to high latitude Asia, Theor. Appl. Climatol., 72, 1– hydroclimate in the Eastern Mediterranean reconstructed using 9, 2002. the oxygen isotope composition of carbonates and diatoms from Goslin, J., Fruergaard, M., Sander, L., Gałka, M., Men- Lake Nar, central Turkey, Holocene, 28, 267–276, 2018. viel, L., Monkenbusch, J., Thibault, N., and Clemmensen, Di Rita, F., Lirer, F., Bonomo, S., Cascella, A., Ferraro, L., Florindo, L. B.: Holocene centennial to millennial shifts in North- F., Insinga, D. D., Lurcock, P. C., Margaritelli, G., Petrosino, P., Atlantic storminess and ocean dynamics, Sci. Rep., 8, 12778, Rettori, R., Vallefuoco, M., and Magri, D.: Late Holocene forest https://doi.org/10.1038/s41598-018-29949-8, 2018. dynamics in the Gulf of Gaeta (central Mediterranean) in relation Häkkinen, S. and Rhines, P. B.: Decline of subpolar north Atlantic to NAO variability and human impact, Quaternary Sci. Rev., 179, circulation during the 1990s, Science, 304, 555–559, 2004. 137–152, 2018. Hao, T., Liu, X., Ogg, J., Liang, Z., Xiang, R., Zhang, X., Zhang, D., Ding, Y. and Krishnamurti, T. N.: Heat Budget of the Siberian High Zhang, C., Liu, Q., and Li, X.: Intensified episodes of East Asian and the Winter Monsoon, Mon. Weather Rev., 115, 2428–2449, Winter Monsoon during the middle through late Holocene driven 1987. by North Atlantic cooling events: High-resolution lignin records Drăguşin, V., Balan, S., Blamart, D., Forray, F. L., Marin, C., Mirea, from the South Yellow Sea, China, Earth Planet. Sc. Lett., 479, I., Nagavciuc, V., Orăşeanu, I., Perşoiu, A., Tîrlă, L., Tudorache, 144–155, 2017. A., and Vlaicu, M.: Transfer of environmental signals from the Harris, I., Jones, P. D., Osborn, T. J., and Lister, D. H.: Updated surface to the underground at Ascunsa Cave, Romania, Hydrol. high-resolution grids of monthly climatic observations – the Earth Syst. Sci., 21, 5357–5373, https://doi.org/10.5194/hess-21- CRU TS3.10 Dataset, Int. J. Climatol., 34, 623–642, 2014. 5357-2017, 2017. Hughes, P. D. M., Mauquoy, D., Barber, K. E., and Langdon, P. G.: Drysdale, R., Zanchetta, G., Hellstrom, J., Maas, R., Fallick, Mire-development pathways and palaeoclimatic records from a A., Pickett, M., Cartwright, I., and Piccini, L.: Late Holocene full Holocene peat archive at Walton Moss, Cumbria, England, drought responsible for the collapse of Old World civilizations Holocene, 10, 465–479, 2000. is recorded in an Italian cave flowstone, Geology, 34, 101–104, Hurrell, J. W., Kushnir, Y., Ottersen, G., and Visbeck, M.: An https://doi.org/10.1130/G22103.1, 2006. Overview of the North Atlantic Oscillation, in: The North At- Clim. Past, 15, 781–793, 2019 www.clim-past.net/15/781/2019/
A. Perşoiu et al.: Atmospheric blocking induced by the strengthened Siberian High                                                      791

   lantic Oscillation: Climatic Significance and Environmental Im-       wasser, M., Schneider, R. R., and Steig, E. J.: Holocene Climate
   pact, American Geophysical Union, Washington D.C., 1–35,              Variability, Quaternary Res., 62, 243–255, 2004.
   2013.                                                               Meeker, L. D. and Mayewski, P. A.: A 1400-year high-resolution
Ionita, M., Bădăluţă, C.-A., Scholz, P., and Chelcea, S.: Van-       record of atmospheric circulation over the North Atlantic and
   ishing river ice cover in the lower part of the Danube                Asia, Holocene, 12, 257–266, 2002.
   basin – signs of a changing climate, Sci. Rep., 8, 7948,            Mischke, S. and Zhang, C.: Holocene cold events on the Tibetan
   https://doi.org/10.1038/s41598-018-26357-w, 2018.                     Plateau, Global Planet. Change, 72, 155–163, 2010.
Isola, I., Zanchetta, G., Drysdale, R. N., Regattieri, E., Bini, M.,   Moros, M., De Deckker, P., Jansen, E., Perner, K., and Telford, R.
   Bajo, P., Hellstrom, J. C., Baneschi, I., Lionello, P., Wood-         J.: Holocene climate variability in the Southern Ocean recorded
   head, J., and Greig, A.: The 4.2 ka event in the central Mediter-     in a deep-sea sediment core off South Australia, Quaternary Sci.
   ranean: new data from a Corchia speleothem (Apuan Alps, cen-          Rev., 28, 1932–1940, 2009.
   tral Italy), Clim. Past, 15, 135–151, https://doi.org/10.5194/cp-   Morrill, C., Overpeck, J. T., and Cole, J. E.: A synthesis of abrupt
   15-135-2019, 2019.                                                    changes in the Asian summer monsoon since the last deglacia-
Janbu, A. D., Paasche, Ø., and Talbot, M. R.: Paleoclimate changes       tion, Holocene, 13, 465–476, 2003.
   inferred from stable isotopes and magnetic properties of organic-   Muschitiello, F., Schwark, L., Wohlfarth, B., Sturm, C., and Ham-
   rich lake sediments in Arctic Norway, J. Paleolimnol., 46, 29,        marlund, D.: New evidence of Holocene atmospheric circulation
   https://doi.org/10.1007/s10933-011-9512-2, 2011.                      dynamics based on lake sediments from southern Sweden: a link
Jhun, J. G. and Lee, E. J.: A new East Asian winter monsoon index        to the Siberian High, Quaternary Sci. Rev., 77, 113–124, 2013.
   and associated characteristics of the winter monsoon, J. Climate,   Nesje, A., Matthews, J. A., Dahl, S. O., Berrisford, M. S., and
   17, 711–726, 2004.                                                    Andersson, C.: Holocene glacier fluctuations of Flatebreen
Kang, S., Wang, X., Roberts, H. M., Duller, G. A. T., Cheng, P.,         and winter-precipitation changes in the Jostedalsbreen region,
   Lu, Y., and An, Z.: Late Holocene anti-phase change in the East       western Norway, based on glaciolacustrine sediment records,
   Asian summer and winter monsoons, Quaternary Sci. Rev., 188,          Holocene, 11, 267–280, 2001.
   28–36, 2018.                                                        O’Brien, S. R., Mayewski, P. A., Meeker, L. D., Meese, D. A.,
Kathayat, G., Cheng, H., Sinha, A., Berkelhammer, M., Zhang,             Twickler, M. S., and Whitlow, S. I.: Complexity of Holocene cli-
   H., Duan, P., Li, H., Li, X., Ning, Y., and Edwards, R. L.:           mate as reconstructed from a Greenland ice core, Science, 270,
   Evaluating the timing and structure of the 4.2 ka event in the        1962–1964, 1995.
   Indian summer monsoon domain from an annually resolved              Olsen, J., Anderson, N. J., and Knudsen, M. F.: Variability of
   speleothem record from Northeast India, Clim. Past, 14, 1869–         the North Atlantic Oscillation over the past 5,200 years, Nat.
   1879, https://doi.org/10.5194/cp-14-1869-2018, 2018.                  Geosci., 5, 808–812, 2012.
Kobashi, T., Menviel, L., Jeltsch-Thömmes, A., Vinther, B. M.,         Orme, L. C., Charman, D. J., Reinhardt, L., Jones, R. T., Mitchell, F.
   Box, J. E., Muscheler, R., Nakaegawa, T., Pfister, P. L., Döring,     J. G., Stefanini, B. S., Barkwith, A., Ellis, M. A., and Grosvenor,
   M., Leuenberger, M., Wanner, H., and Ohmura, A.: Volcanic in-         M.: Past changes in the North Atlantic storm track driven by in-
   fluence on centennial to millennial Holocene Greenland temper-        solation and sea-ice forcing, Geology, 45, 335–338, 2017.
   ature change, Sci. Rep., 7, 1441, https://doi.org/10.1038/s41598-   Orme, L. C., Miettinen, A., Divine, D., Husum, K., Pearce, C., Van
   017-01451-7, 2017.                                                    Nieuwenhove, N., Born, A., Mohan, R., and Seidenkrantz, M.-S.:
Larsen, D. J., Miller, G. H., Geirsdóttir, Á., and Ólafsdóttir, S.:      Subpolar North Atlantic sea surface temperature since 6 ka BP:
   Non-linear Holocene climate evolution in the North Atlantic: a        Indications of anomalous ocean-atmosphere interactions at 4-
   high-resolution, multi-proxy record of glacier activity and envi-     2 ka BP, Quaternary Sci. Rev., 194, 128–142, 2018.
   ronmental change from Hvítárvatn, central Iceland, Quaternary       Panagiotopoulos, F., Shahgedanova, M., Hannachi, A., and
   Sci. Rev., 39, 14–25, 2012.                                           Stephenson, D. B.: Observed Trends and Teleconnections of the
Lionello, P., Malanotte-Rizzoli, P., and Boscolo, R.: The Mediter-       Siberian High: A Recently Declining Center of Action, J. Cli-
   ranean Climate: An Overview of the Main Characteristics and           mate, 18, 1411–1422, 2005.
   Issues, Elsevier, the Netherlands, 2006.                            Panait, A., Diaconu, A., Galka, M., Grindean, R., Hutchinson, S.
Mayewski, P. A., Meeker, L. D., Whitlow, S., Twickler, M. S., Mor-       M., Hickler, T., Lamentowicz, M., Mulch, A., Tanţău, I., Werner,
   rison, M. C., Bloomeld, P., Bond, G. C., Alley, R. B., Gow, A.        C., and Feurdean, A.: Hydrological conditions and carbon accu-
   J., Grootes, P. M., Meese, D. A., Ram, M., Taylor, K. C., and         mulation rates reconstructed from a mountain raised bog in the
   Wumkes, W.: Changes in atmospheric circulation and ocean ice          Carpathians: A multi-proxy approach, Catena, 152, 57–68, 2017.
   cover over the North Atlantic during the last 41,000 years, Sci-    Parker, A. G., Goudie, A. S., Stokes S., and Kennett, D.: A record
   ence, 263, 1747–1751, 1994.                                           of Holocene climate change from lake geochemical analyses in
Mayewski, P. A., Meeker, L. D., Twickler, M. S., Whitlow, S. I.,         southeastern Arabia, Quaternary Res., 66, 465–476, 2006.
   Yang, Q., Lyons, W. B., and Prentice, M.: Major features and        Peck, V. L., Allen, C. S., Kender, S., McClymont, E. L., and Hodg-
   forcing of high-latitude northern hemisphere atmospheric circu-       son, D. A.: Oceanographic variability on the West Antarctic
   lation using a 110,000-year-long glaciochemical series, J. Geo-       Peninsula during the Holocene and the influence of upper cir-
   phys. Res., 102, 26345–26366, 1997.                                   cumpolar deep water, Quaternary Sci. Rev., 119, 54–65, 2015.
Mayewski, P. A., Rohling, E. J., Stager, J. C., Karlén, W., Maasch,    Perşoiu, A., Onac, B. P., and Perşoiu, I.: The interplay between air
   K. A., Meeker, L. D., Meyerson, E. A., Gasse, F., Van Kreveld,        temperature and ice dynamics in Scărişoara Ice Cave, Romania,
   S., Holmgren, K., Lee-Thorp, K., Rosqvist, G., Rack, F., Staub-       Acta Carsologica, 40, 445–456, 2011.

www.clim-past.net/15/781/2019/                                                                          Clim. Past, 15, 781–793, 2019
You can also read