TREES AND HYDROLOGY IN URBAN LANDSCAPES - Toward integrated water quality and ecological benefit evaluation: San ...
←
→
Page content transcription
If your browser does not render page correctly, please read the page content below
Toward integrated water quality
and ecological benefit evaluation:
             TREES AND
         HYDROLOGY IN
     URBAN LANDSCAPES

        A PRODUCT OF HEALTHY WATERSHEDS • RESILIENT BAYLANDS
                                        APRIL 2021
                    SAN FRANCISCO ESTUARY INSTITUTE PUBLICATION #1034
PREPARED BY
Tan Zi
Alison Whipple
Pete Kauhanen
Erica Spotswood
Letitia Grenier
Robin Grossinger
Ruth Askevold

SUGGESTED CITATION
San Francisco Estuary Institute. 2021. Toward integrated water quality and
ecological benefit evaluation: Trees and hydrology in urban landscapes. A product
of the Healthy Watersheds, Resilient Baylands project. Funded by the San
Francisco Bay Water Quality Improvement Fund, EPA Region IX. SFEI Publication
#1034, San Francisco Estuary Institute, Richmond, CA.

VERSION v1.0 (April 2021)

REPORT AVAILABILITY
Report is available online at www.sfei.org/projects/healthy-watersheds-resilient-
baylands

IMAGE PERMISSION
Permissions rights for images used in this publication have been specifically
acquired for one-time use in this publication only. Further use or reproduction is
prohibited without express written permission from the individual or institution
credited. For permissions and reproductions inquiries, please contact the
responsible source directly.

COVER IMAGE CREDITS
Cover photographs by Robin Grossinger, SFEI.
CONTENTS

ACKNOWLEDGEMENTS.....................................................................................................................................................iv

HIGHLIGHTS......................................................................................................................................................................................1

INTRODUCTION...........................................................................................................................................................................3

TOOL DEVELOPMENT............................................................................................................................................................5

HYDROLOGIC EVALUATION OF TREE TYPES AND STORM EVENTS..................................10

TREES AT THE LANDSCAPE SCALE........................................................................................................................17

EXPLORING FUTURE ANALYSIS DIRECTIONS ..........................................................................................24

TOWARD AN INTEGRATIVE MULTI-BENEFIT APPROACH ............................................................33

REFERENCES ..............................................................................................................................................................................40
Acknowledgements
This document is part of the Healthy Watersheds, Resilient Baylands grant project, which is
funded by a grant to the San Francisco Estuary Partnership from the San Francisco Bay Water
Quality Improvement Fund of the US Environmental Protection Agency, Region IX. We thank
the members of the Technical Advisory Committee (TAC) for their technical guidance and re-
view, thoughtful insights into the relevance and implications of this work, and ideas for future
investigations. TAC members included: Jill Bicknell (EOA/SCVURPPP), Theodore Endreny
(SUNY ESF), Matt Fabry (C/CAG of San Mateo County), Nupur Hiremath (City of Sunnyvale),
Joanne Le (City of Richmond), John Leys (Sherwood Design Engineers), Keith Lichten (San
Francisco Bay Regional Water Quality Control Board), Brian Mendenhall (Valley Water), Peter
Schultze-Allen (EOA/SCVURPPP), Kirsten Struve (Valley Water), Melody Tovar (City of Sunny-
vale). We also thank Luisa Valiela (US EPA) and Darcie Luce (San Francisco Estuary Partnership)
for their guidance over the course of the project. Finally, we are grateful to SFEI staff who
contributed at various points over the course of this project, including Micaela Bazo, Matthew
Benjamin, Gloria Desanker, Alicia Gilbreath, Steve Hagerty, Jen Hunt, Lester McKee, Megan
Wheeler, and Jing Wu.

                          Trees and Hydrology in Urban Landscapes • Page iv
HIGHLIGHTS
                       This effort expands the capacity to
                       evaluate integrated benefits of urban
overview               trees within a stormwater modeling
                       framework in the local watersheds of
                       the San Francisco Bay.

KEY FINDINGS
  • Both engineered GSI and non-engineered greening activities provide multiple
    benefits, but approaches are typically siloed, with engineered GSI used for
    stormwater management and non-engineered urban greening used to support
    other ecosystem services. (page 3)

  • Adding a canopy module to the US Environmental Protection Agency Storm
    Water Management Model (SWMM) improves quantitative assessments of tree
    contributions to runoff reduction. (page 5)

  • Evergreen trees in the model intercept more rainfall than deciduous trees in
    Northern California climates. (page 12)

  • Increasing the tree well size for street trees substantially increases runoff
    reduction benefits. (page 13)

  •   Due to associated tree well replacement of impervious surface, street trees have
      larger runoff benefits compared to park of yard trees (of the same size). (page 14)

  • Runoff reduction benefits of trees decline slightly with more extreme storm
    events, suggesting that more trees and green stormwater infrastructure (GSI)
    will be needed in a future climate to provide the same level of runoff reduction
    benefits as today. (page 16)

  •   At the landscape scale, current trees in the City of Sunnyvale are estimated to
      reduce runoff by ~5% of annual rainfall. (page 16)

  • The newly updated SWMM can quantify stormwater benefits of trees in the same
    way as green stormwater infrastructure, allowing trees to be evaluated with the
    sizing criteria for GSI from the Municipal Regional Stormwater Permit. (page 16)

                         Trees and Hydrology in Urban Landscapes • Page 1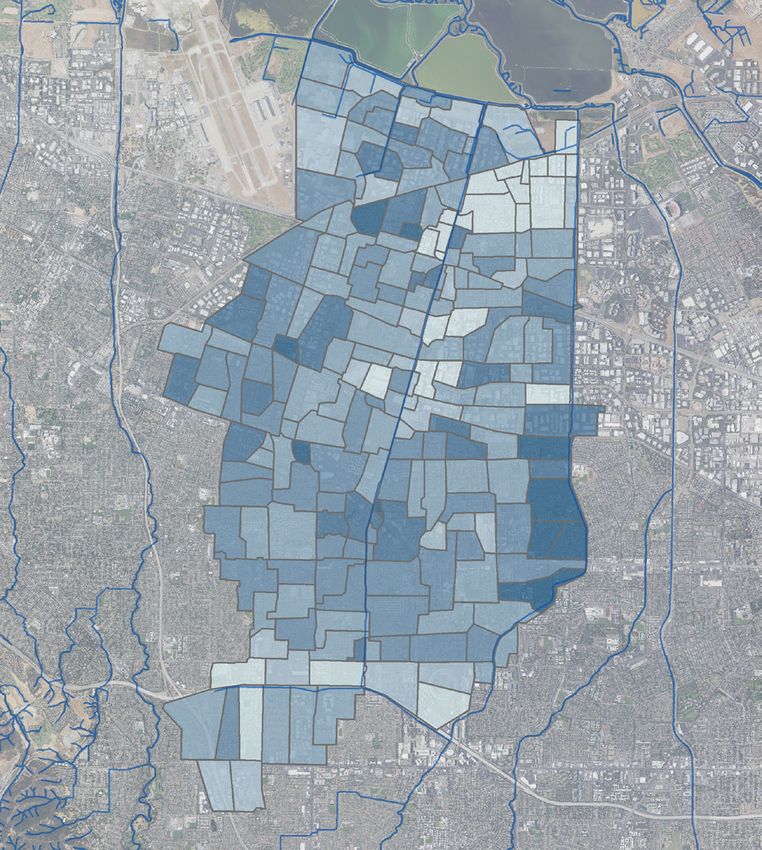
VERVIEW

                                                                Photograph by Laura Camp, courtesy of Creative Commons.

      CONCLUSIONS
          Urban trees and engineered GSI can be seen
          as complementary strategies, where trees can
          reduce the amount of runoff needing to be treated by
          engineered GSI. (page 32)

          Trees within the urban landscape could be
          part of a portfolio approach and multi-benefit
          assessment framework to achieve runoff and
          load-reduction goals, while also providing additional
          ecosystem services, such as wildlife habitat, healthy
          soils, heat reduction, air quality improvement, and
          carbon storage. (page 24, page 33)

                        Trees and Hydrology in Urban Landscapes • Page 2
Introduction
Rapid implementation of effective urban greening strategies is needed to address legacies of landscape
change and environmental degradation, ongoing development pressures, and the urgency of the climate
crisis. With limited space and resources, these challenges will not be met through single-issue or individual-
sector management and planning. Increasingly, local governments, regulatory agencies, and other urban
planning organizations in the San Francisco Bay Area are expanding holistic, portfolio-based, and multi-benefit
approaches.

A promising area of integration lies with stormwater
management and urban planning, where both engineered green
stormwater infrastructure (GSI) and non-engineered greening               Both engineered GSI and
activities, such as the expansion of and improvements to the
                                                                          non-engineered greening
urban forest, provide multiple benefits. However, approaches
are typically siloed, with engineered GSI used for reducing
                                                                          activities provide multiple
stormwater pollutant loads and non-engineered urban greening              benefits, but approaches
undertaken to support other ecosystem services (e.g., urban heat          are typically siloed, with
mitigation, carbon emission reductions, air quality improvements,         engineered GSI used for
and human health and well-being). Urban trees are particularly
                                                                          stormwater management
relevant at this intersection. They can play a role similar to
GSI in stormwater management, suggesting that trees could
                                                                          and non-engineered urban
be considered an integral part of the watershed-scale green               greening used to support
infrastructure network (Berland et al., 2017; Kuehler et al., 2017).      other ecosystem services.
Quantified benefits of non-engineered urban greening elements
such as trees is still an under-studied component due to complex
processes and lack of evaluation and assessment tools that can integrate requirements for stormwater
management, forestry hydrology, and benefit evaluation modeling. As a growing area of research, models and
tools have been developed that can simulate and evaluate the hydrological benefit of urban trees, with some
simplifications (Coville et al., 2020). Overall, improved technical approaches for evaluating the multiple benefits
of both engineered and non-engineered urban greening activities are needed to facilitate integrated planning
and achieve greater benefits at lower costs.

This project sought to expand the capacity for evaluating engineered GSI and non-engineered urban greening
within a modeling and analysis framework, with a primary focus on evaluating the hydrologic benefit of
urban trees. The first step was to advance the GreenPlan-IT toolkit (greenplanit.sfei.org), a modeling and
optimization framework for analysis of GSI, such that it could represent hydrologic processes within the
tree canopy. To explore the role of trees in stormwater runoff, several test case sensitivity analyses were
conducted. These examined relative differences between deciduous and evergreen trees, street trees with
different tree well sizes compared to impervious surfaces, and relative runoff changes across storm events
with differing intensities. Third, a demonstration analysis was performed for the City of Sunnyvale to assess
the degree to which trees at the landscape scale affect city-wide runoff. Additional considerations and
explorations related to hydrologic impacts of trees are also provided. Finally, we explore a potential technical
approach for expanded integrated multi-benefit assessment of urban greening. Overall, as part of the Healthy
Watersheds, Resilient Baylands grant from the US Environmental Protection Agency Region IX Water Quality
Improvement Fund, this work supports a watersheds-to-Baylands approach for redesigning urban landscapes
for resilience through nature-based solutions.

                                   Trees and Hydrology in Urban Landscapes • Page 3
Trees and Stormwater
Urban stormwater runoff is a major pathway for pollutants to enter waterways, the Bay, and ocean. Rainfall
interception by the tree canopy can reduce the magnitude of runoff generated during storm events, which
mitigates associated erosion and reduces pollutant loadings to receiving water bodies. Previous research
has indicated that the urban forest can substantially contribute to runoff reduction (Xiao et al., 1998).
Stormwater benefits of trees results from both canopy interception and change in infiltration at the ground.
The leaves and branches of tree canopies intercept and store rainfall, some of which evaporates and some
of which drips to the surface below, thus reducing the volume of rainfall reaching the ground and altering
stream hydrographs (Carlyle-Moses and Gash, 2011). Tree canopy interception is affected by storm event
characteristics (e.g., magnitude, intensity), tree characteristics (e.g., species, age, health), and other weather
variables (e.g., temperature, wind; Reid and Lewis, 2009; Li et al., 2017). The root system of trees facilitates the
redistribution of water within the soil medium. The roots increase infiltration rates of land surface, allowing
more stormwater to infiltrate and be retained in the soil matrix, thus reducing the runoff (Burgess et al., 1998).
A recent study shows the root system of trees can increase the soil infiltration rate by more than 89% (Xie et
al., 2020). The benefits of trees from increasing infiltration and soil water storage is affected by tree species,
tree size/age, soil properties, and urban environmental limitations (Bartens et al., 2008; Wang et al., 2018). The
evapotranspiration of trees can also adjust the water balance and thus influence runoff.

Given the stormwater benefits of urban trees, many state and municipal governments have established
stormwater credit programs which grant runoff reduction credits for tree conservation and/or newly planted
trees. The most common ways to provide credit for urban trees are through recharge volume, water quality
volume, and reduction of impervious areas. The state of Minnesota credits via a process-based method where
evapotranspiration, interception, and infiltration credits are given to individual trees of certain sizes (MPCA,
2020). The Chesapeake Bay Program considers tree canopy as a type of Best Management Practice (BMP)
and gives water quality reduction credit to trees (Forestry Workgroup Chesapeake Bay Program Office, 2018).
Pine Lake, GA and Washington, D.C. have applied stormwater volume reduction credit systems for individual
trees. Other cities such as Portland, OR, Seattle, WA, Philadelphia, PA, and Indianapolis, IN, apply impervious
surface reduction credit systems (Rosenstock et al., 2019). In California, Sacramento and South Placer regions
(Sacramento and South Placer Regions, 2007; Sacramento County, 2018) suggest using an impervious surface
reduction method to quantify the stormwater benefits of trees. For example, a new deciduous tree can offset
the runoff from 100 ft2 of impervious surface and a new evergreen gree can offset the runoff from 200 ft2 of
impervious surface. Within the San Francisco Bay Area, the current Municipal Regional Stormwater NPDES
Permit does not credit urban trees.

                                   Trees and Hydrology in Urban Landscapes • Page 4
Tool development
Advancing GreenPlan-IT
Quantifying the impact of urban greening and nature-based solutions for ecosystem resilience in urban
landscapes is a growing field in academia and in practice. Including appropriate representation of trees in such
assessments is important given the ecosystem functions and services trees provide, such as improving air and
water quality, cooling urban heat islands, increasing biodiversity, and enhancing aesthetics, as well as reducing
local flooding and associated contaminant loading to waterways. Nature-based solutions to address water quality
issues associated with urban stormwater runoff typically center on the modeling, design, and placement of
green stormwater infrastructure (GSI). These are typically highly engineered features for capturing and filtering
runoff that contain vegetated elements (e.g., tree wells, bioretentions, flow-through planter boxes). Stormwater-
focused modeling tools such as the US Environmental Protection Agency’s (EPA) Stormwater Management
Model (SWMM; Rossman, 2010) have developed detailed modules to represent varied hydrological processes
of different design elements of GSI (e.g. drainage, storage, infiltration). While GSI tends to be well-represented
in stormwater models, the representation of tree canopy is typically simplified as a type of land use, with the
hydrological processes of the tree canopy represented as a fixed value depression storage. This simplification
ignores the dynamics of canopy interception, throughfall, and stemflow with different rainfall patterns, intensities,
and tree species. Most conventional stormwater models lack the capability to evaluate the hydrological benefits
of trees for planning and design, such as representing the hydrological processes of tree species and planting
designs, or the hydrologic impact of trees across a range of storm event types. For climates like that of Northern
California, the mismatch between the rainy season and tree growing season means that canopy interception
processes differ between evergreen trees and deciduous trees, which can affect stormwater budget estimation
at different time scales. A more detailed representation of tree canopy processes within stormwater models could
help address these environmental factors and help better quantify hydrological benefits of trees.

To better understand the stormwater runoff benefits of trees and support a broader urban greening
perspective, the work presented here involved developing 1) a tool that can represent the varied hydrological
                                                processes within and under tree canopies, and 2) a method
                                                to evaluate the hydrological benefits of urban trees from a
                                                storm runoff perspective in a manner similar to evaluating
Adding a canopy module                          hydrological benefits of GSI. We programmed the canopy
to the US EPA SWMM                              interception and evaporation algorithms from the i-Tree
allows the simulation                           software suite (itreetools.org) into SWMM (Rossman, 2010)
                                                to allow canopy hydrological processes simulation in SWMM
of vegetation-mediated
                                                (see the following section for technical details). i-Tree is one
hydrologic processes                            of the few tools focused on quantifying ecosystem services
in green stormwater                             of trees, and the i-Tree Hydro tool evaluates individual tree
infrastructure modeling                         benefits and aggregates them for the tree population. By
and analysis, improving                         coding i-Tree algorithms into SWMM, trees with different
                                                physical characteristics (e.g., species, size) can be represented
quantitative assessments
                                                under the same framework as GSI, thus the hydrological
of tree contributions to                        benefits of trees can be evaluated and compared with GSI.
runoff reduction.                               This newly updated SWMM extends the functionality of
                                                the GreenPlan-IT toolkit to a more general urban greening
                                                planning perspective.

                                    Trees and Hydrology in Urban Landscapes • Page 5
GreenPlan-IT (greenplanit.sfei.org) is a versatile planning-level toolset to help municipalities place GSI in
effective locations within the landscape, evaluate expected runoff and contaminant load reductions, and track
the effectiveness of these installations (Wu et al., 2019). GreenPlan-IT was designed to support the cost-
effective selection and placement of GSI in urban watersheds through a combination of GIS analysis, watershed
modeling, and optimization techniques. GreenPlan-IT comprises four distinct tools: (a) a GIS-based Site Locator
Tool (SLT) that combines the physical requirements of different GSI types with local and regional GIS information
to identify and rank potential GSI locations, (b) a Modeling Tool built on SWMM to establish baseline conditions
and quantify anticipated runoff and pollutant load reductions from GSI sites, (c) an Optimization Tool that uses
a cost-benefit analysis to maximize flow or load reduction objectives through combinations of GSI and tree
types within the study area, and (d) a Tracker Tool that tracks GSI implementation and reports the cumulative
programmatic outcomes for regulatory compliance and other needs (Figure 1). For this effort, the SLT was used
to identify potential locations of trees, the updated SWMM was used to evaluate the effect of trees on runoff in a
manner similar to GSI evaluation, and the Optimization Tool was used for a Monte Carlo simulation to examine the
relationship between the number or cost of trees or GSI and runoff reduction. The Tracker Tool was not used.

In summary, the expansion of the Modeling Tool (SWMM) of the GreenPlan-IT toolkit allows trees of different
characteristics and with different planting designs to be represented in SWMM via the new canopy module.
We used this to explore how tree characteristics affect hydrological processes and how that changes across
different storm event types. We conducted a demonstration analysis using the GreenPlan-IT toolkit for the City
of Sunnyvale to assess hydrologic benefits of trees at the landscape scale.

Figure 1. Diagram of the GreenPlan-IT toolkit (GSI Site Locator Tool, Modeling Tool, Optimization Tool, and Tracker Tool) and how they relate to
one another.

                                             Trees and Hydrology in Urban Landscapes • Page 6
Tree canopy module for SWMM
The algorithms of the new SWMM canopy module are adopted from iTree-Hydro tool (Hirabayashi, 2013).
The representation of hydrological processes within and through the tree canopy is shown in Figure 2 below.
The canopy interception process can be divided into three stages as shown in Figure 2. The first stage begins
at the onset of precipitation. In this stage, the precipitation reaches the canopy and fills the canopy storage
until it is filled up or saturated. The second stage starts when the canopy storage is saturated. The subsequent
precipitation falls through the canopy and reaches the ground. The third stage starts when the precipitation
ends. The water stored in the tree canopy starts to dry up, gradually increasing available canopy storage to its
maximum value.
RAINFALL EVAPOTRANSPIRATION RAINFALL EVAPOTRANSPIRATION EVAPOTRANSPIRATION
INTERCEPTION INTERCEPTION
THROUGHFALL THROUGHFALL
STEMFLOW STEMFLOW
OVERLAND OVERLAND
FLOW FLOW
INFILTRATION INFILTRATION
STAGE 1: ONSET OF PRECIPITATION STAGE 2: CANOPY STORAGE SATURATED STAGE3: WATER IN CANOPY DRIES UP
CANOPY STORAGE
WETTING SATURATION DRYING
TIME
Figure 2. Tree canopy hydrological processes represented in the newly added tree canopy module of SWMM. The canopy storage time series
follows the pattern of observational data (Modified from Xiao and McPherson, 2016).
Trees and Hydrology in Urban Landscapes • Page 7During the first stage, the precipitation (P) is divided into canopy precipitation (Pc ) and through precipitation
(Pt ) that falls through the canopy. The water stored in canopy (Sv ) in this stage is a function of precipitation
and canopy evaporation (Ev )
Sv(t ) = Sv (t-1) + Pc (t ) - Ev (t-1)
Sv > 0 and SvTree representations with the canopy module
The canopy module developed through this project was added as a new feature for the Low Impact
Development (LID) modules of SWMM. Different types of GSI are represented in SWMM by different
combinations of modules. For example, bioretention with an underdrain could be represented using the
combination of surface, soil, storage, and drain modules. With the addition of canopy module in SWMM,
individual trees are dynamically represented in a similar way as GSI, with the combination of canopy, surface,
and soil modules. The canopy module contains several parameters to distinguish varied canopy structures of
different trees (e.g., leaf area index, extinction coefficient, vegetation evaporation coefficient, canopy size). With
the combination of the canopy module and the modules representing conditions under the tree canopy, both
tree species and planting designs can be distinguished in SWMM. Design features such as tree wells, curbs,
and drainage areas that are routed to the tree well can be added into the model by setting the parameters of
surface and soil modules. By treating trees in the same way as LID/GSI in SWMM, trees can be modeled as
individual treatment features within a subwatershed or modeled as their own specific treatment subwatershed
that receives stormwater runoff from other subwatersheds.
Photograph by Robin Grossinger, SFEI.
Trees and Hydrology in Urban Landscapes • Page 9Hydrologic evaluation of tree types
and storm events
To explore how different characteristics of trees and storm events affect the volume of stormwater runoff
and demonstrate the capability of the updated SWMM, evergreen and deciduous trees growing in parks or
yards (park tree) and along streets (street tree) were compared at the site scale. This took advantage of the
flexibility to represent trees with varied forms and features in the canopy module along with existing surface
and soil modules in SWMM. In the Mediterranean climate of Northern California, rains come in winter
when deciduous trees have lost their leaves. Evergreen trees thus have greater canopy storage during the
rainy season than deciduous trees. These two types of trees were distinguished in this analysis by assigning
different canopy storage volumes (based on LAI and specific leaf storage). We used parameters representing
typical or average-sized trees, based on trees within the City of Sunnyvale. Another important factor to
consider when simulating trees in urban settings is the imperviousness of the land surface under the tree
canopy. Unlike trees grown in residential yards and parks, the trees planted in the streets have a large portion
of impervious land surface under the canopy. In this study, street trees and park trees were distinguished by
different degrees of imperviousness under the canopy. The four major tree types considered were: evergreen
park tree, deciduous park tree, evergreen street tree, and deciduous street tree. Some major features of
these four types of trees as represented in the canopy module are shown in Table 1 and discussed further in
subsequent sections.
A hypothetical one-acre test watershed was used to evaluate the hydrologic response to different tree
characteristics. The soil parameters were constant across all scenarios. The slope of the test watershed
was set as the average slope value of the City of Sunnyvale. To account for impervious surfaces that are not
directly connected to stormwater catch basins, 25% of stormwater runoff from impervious surfaces was
routed to pervious surfaces. As a test case to simplify interpretation, the one-acre watershed was assumed to
have 100% tree canopy coverage.
Table 1. Tree parameters used in the SWMM canopy module demonstration analysis. Canopy storage per unit area was derived from Xiao and
McPherson (2016). Canopy area was determined from products based on LiDAR and aerial imagery analysis.
Max canopy Pervious surface
storage per Canopy area under canopy/ Berm Soil depth Infiltration
Tree types unit area (in) area (ft2) tree well (ft2) height (in) (in) rate (in/hr)
Evergreen street tree (S, M, L
tree well) 0.04 450 8, 18, 30 3 21 0.06
Evergreen park tree 0.04 450 450 0 21 0.06
Deciduous (leaf-off) street tree
(S, M, L tree well) 0.01 450 8, 18, 30 3 21 0.06
Deciduous (leaf-off) park tree 0.01 450 450 0 21 0.06
Trees and Hydrology in Urban Landscapes • Page 10Comparing deciduous and evergreen trees
The major difference between evergreen and deciduous trees in terms of model representation is the maximum
canopy storage volume (a function of LAI and specific leaf storage). Average canopy storages per unit canopy
area of 20 northern California tree species (both evergreen and deciduous) are 0.030 inches for broadleaf
deciduous, 0.031 inches for broadleaf evergreen and 0.049 inches for coniferous evergreen, and stem and branch
surface storage for broadleaf deciduous (i.e., leaf-off) is ~0.01 inches (Xiao and McPherson, 2016). In this study,
the average canopy storage value of broadleaf evergreen and coniferous evergreen was assigned to evergreen
trees (see Table 1). The stem surface storage for broadleaf deciduous was assigned to deciduous trees with the
assumption that leaves are off when most storm events occur. Thus, for this analysis, the maximum canopy
storage of an evergreen tree is four times larger than a leaf-off deciduous tree of the same size.
A simplified ‘big-leaf’ model was used to represent the canopy structure. The product of the canopy storage
per unit area and the canopy size is the total canopy storage capacity. The average tree canopy size was derived
from EarthDefine data (EarthDefine, 2018). The EarthDefine tree canopy dataset, derived from 2006 LiDAR
and 2016 NAIP imagery, is the most recent high resolution information found depicting tree canopy for the City
of Sunnyvale study area. Total canopy area and individually identified trees were used together to estimate an
average individual tree canopy area for all trees in the City of Sunnyvale. The average canopy size of all trees
using the EarthDefine data is approximately 450 ft2. The canopy size is the projected area of the canopy.
For this evaluation, the 2002
water year (WY) total precipitation
(11.1 inches) for the City of
Sunnyvale was used to drive
SWMM to assess the runoff
reduction due to evergreen versus
deciduous trees for an average
year. This year is considered a
representative water year for
PCBs and mercury stormwater
loading which is recommended
as a baseline year in the Bay Area
Reasonable Assurance Analysis
(RRA) Guidance (BASMAA,
2017). Using a water year as
opposed to one or more individual
larger design storm events is
more representative of overall
conditions because it includes a
range of medium and larger storm
sizes as well as low-magnitude,
low-intensity rainfall, which is
captured more effectively by trees
Photograph by Robin Grossinger, SFEI. than larger storms.
Trees and Hydrology in Urban Landscapes • Page 11To highlight the differences in canopy characteristics
of deciduous and evergreen trees and show the
stormwater runoff benefit via canopy interception,
Evergreen trees in the
hydrologic simulations of the one-acre test watershed
for 100% pervious land surface without trees, with model intercept more
100% coverage of evergreen trees, and with 100% rainfall than deciduous
coverage of deciduous trees were compared. Figure trees in Northern California
3 shows the partition of rainfall for WY2002 into loss climates.
from canopy (canopy interception), loss and storage
in soil, and runoff for the three different land cover
scenarios. The canopy interception of evergreen
trees is more than twice as large as that of deciduous trees. For this simplified test case, 15% of WY2002
rainfall was intercepted by evergreen tree canopy compared to 7% for deciduous tree canopy. The 15% or
7% less precipitation reaching the ground (throughfall) reduces the stormwater runoff, but not to an equal
percentage. This is because the soil infiltration rate determines how much of this throughfall will run off.
That is, precipitation lost from the tree canopy through interception would have otherwise gone to either soil
infiltration or runoff. The size and intensity of rainfall events are also factors. Stormwater runoff is usually
generated during large rainfall events and/or high intensity rainfall events when the soil matrix under the
canopy is saturated or the rainfall rate exceeds the infiltration rate. While the tree canopy intercepts some
portion of the rainfall, canopy storage is exceeded more quickly with large and high intensity rainfall events
such that they are more likely to result in stormwater runoff under the canopy. This analysis shows that runoff
reduction due to tree canopies above entirely pervious surface is 2% and 4% of annual rainfall (or, 20% and
40% of total runoff) for deciduous and evergreen trees, respectively.
Figure 3.
Precipitation
partitioning
associated with
three different land
covers: pervious,
deciduous park
trees, and evergreen
park trees. Analysis
was conducted for
the one-acre test
watershed in the
City of Sunnyvale for
the 2002 water year
(11.1 inches).
Trees and Hydrology in Urban Landscapes • Page 12Comparing impervious surface with no trees to street trees
This section assesses the hydrological benefits of adding street trees (with tree wells) to areas of impervious
sidewalk or other surfaces. Trees along streets are usually planted in tree wells, with limited pervious surface
under the canopy. The infiltration process is limited within tree wells. The size of tree wells, as well as the
permeability of the substrate, influences the volume of stormwater that can infiltrate into the soil matrix. To
explore this relationship, a sensitivity analysis was conducted using evergreen trees with three different tree well
sizes: small (8 ft2), medium (18 ft2), and large (30 ft2). The percentage of pervious surface area under the tree
canopy was 2%, 4%, and 7%, respectively. For this analysis, a 3-in high berm was assumed to surround the tree
well (allowing for some ponding and infiltration) and the stormwater runoff from the adjacent impervious surface
was not routed into the tree well. A 2-year storm (1.86 inches)
with 24-hour duration was selected to drive the simulation
process (Schaaf & Wheeler, 2007). The distribution of the storm
was derived from a normalized rainfall pattern recommended Increasing the tree well
by the manual for use in Santa Clara County (Schaaf & Wheeler, size for street trees
2007). The design storm simulation was conducted on the one
substantially increases
acre test watershed.
runoff reduction benefits.
Simulations with evergreen street trees (450 ft2 canopy size,
see Table 1) with small, medium, and large tree wells were
compared to a simulation with 100% impervious area. The
stormwater runoff generated from 100% impervious area was 1.8 inches per unit area for the 1.86 inch design
storm (97%). Tree canopy interception and tree well infiltration for the three different tree settings reduced
the runoff from the 100% impervious conditions by 6.9%, 11.2%, and 15.5% of the storm event (Figure 4).
Substantial stormwater runoff was generated for all three street tree scenarios due to the large percentage of
Figure 4. Reduced
runoff as a
percentage of a
2-year 24-hour
design storm
depth by evergreen
trees with three
different tree well
sizes compared to
runoff under 100%
impervious land
surface conditions
(sidewalk or similar
with no tree).
Trees and Hydrology in Urban Landscapes • Page 13impervious area under the street tree canopies. Infiltration through tree wells reduced runoff per unit area by
0.06, 0.14, and 0.22 inches for the small, medium, and large tree well sizes. Runoff reduction increases as the
size of the tree wells increases. Also, the 2-year 24-hour storm is a relatively large and intense storm. Thus,
relatively more rainfall would be expected to pass through
the tree canopy than for a smaller and less intense storm
event. This is illustrated by the fact that rainfall intercepted
Due to associated tree well by the tree canopy is 4% of the storm event (0.07 inches per
replacement of impervious unit area), which is much smaller than the 15% evergreen
tree interception of WY2002. This indicates that the impact
surface, street trees have
of canopy interception decreases with more extreme storm
larger runoff benefits events, a logical outcome, which is explored further in the
compared to park or yard following section.
trees (of the same size).
Similar to the analysis comparing deciduous and evergreen
park trees, SWMM simulations were conducted to compare
deciduous and evergreen street trees (100% coverage, medium
tree well size) against 100% impervious coverage in the one-acre
test watershed for WY2002 (note, there is no difference between street and park tree canopy interception in this
analysis). Figure 5 shows the rainfall partitioning for the three scenarios. Much less stormwater can infiltrate into
the land surface and be stored in the soil matrix in an urban setting with high imperviousness compared to more
Figure 5.
Precipitation
partitioning for
three different land
covers: impervious
(no tree), deciduous
street trees, and
evergreen street
trees. Analysis
was conducted for
the one-acre test
watershed in the
City of Sunnyvale for
the 2002 water year
(11.1 inches).
Trees and Hydrology in Urban Landscapes • Page 14natural pervious settings. Thus, a large portion of precipitation intercepted by the canopy translates to reduction in
stormwater runoff. Compared to the 100% impervious surface conditions where 88.0% of rainfall becomes runoff,
an additional 19.5% and 25.1% of annual rainfall is intercepted by tree canopy and infiltrated into the tree well for
deciduous and evergreen trees, respectively. The contribution of interception and infiltration are 6.9% and 12.6%
for deciduous trees and 14.6% and 10.5% for evergreen trees, respectively. The larger canopy storage of evergreen
trees intercepted 7.7% more stormwater and reduced 5.6% more runoff than deciduous trees.
Relative benefit of trees across different storm events
As indicated by the previous analysis, the portion of rainfall intercepted by the tree canopy varies with storm
intensity. A sensitivity analysis was conducted to further examine the impact of storm intensity on canopy
interception and resulting runoff. The runoff reduction of street trees with 100% canopy coverage for the one-
acre test watershed under six different design storm events were assessed. Four were storm events of current
climate conditions (1-yr 24-hr, 2-yr 24-hr, 10-yr 24-hr, and 25-yr 24-hr) and two were future storm events
(RCP8.5 2-yr 24-hr and RCP8.5 10-yr 24-hr). The rainfall depths of storm events for current conditions were
acquired from NOAA point precipitation frequency estimates for the City of Sunnyvale (Perica et al., 2014), and
rainfall depths for future events were derived from the extreme precipitation estimation of Cal-Adapt (cal-
adapt.org/tools/extreme-precipitation). Downscaled daily precipitation data (6 km resolution) for the City of
Sunnyvale from 10 global climate models (GCMs) of the more extreme RCP 8.5 scenario were analyzed and
the average change ratio of the rainfall depths between the historical condition and the end of 21st century
conditions were applied to the 2-year 24-hour storm and 10-year 24-hour storm to get the future rainfall
depth of the same return periods. The design storm pattern from the Santa Clara Drainage Manual (Schaaf
& Wheeler, 2007) was used to disaggregate daily rainfall depths to five minute intervals. Table 2 shows the
rainfall depths of the six selected storm events. The change of storm pattern under future climate was not
considered in this experiment, which can be further investigated in the future.
Table 2. Rainfall depths associated with four 24-hr storm events reflecting the current climate and two 24-hr storm events under future (end of
21st century) climate scenarios for the City of Sunnyvale.
Recurrence interval 1-yr 2-yr RCP8.5, 2-yr 10-yr RCP8.5, 10-yr 25-yr
Rainfall depth (in) 1.47 1.86 2.37 2.76 3.11 3.36
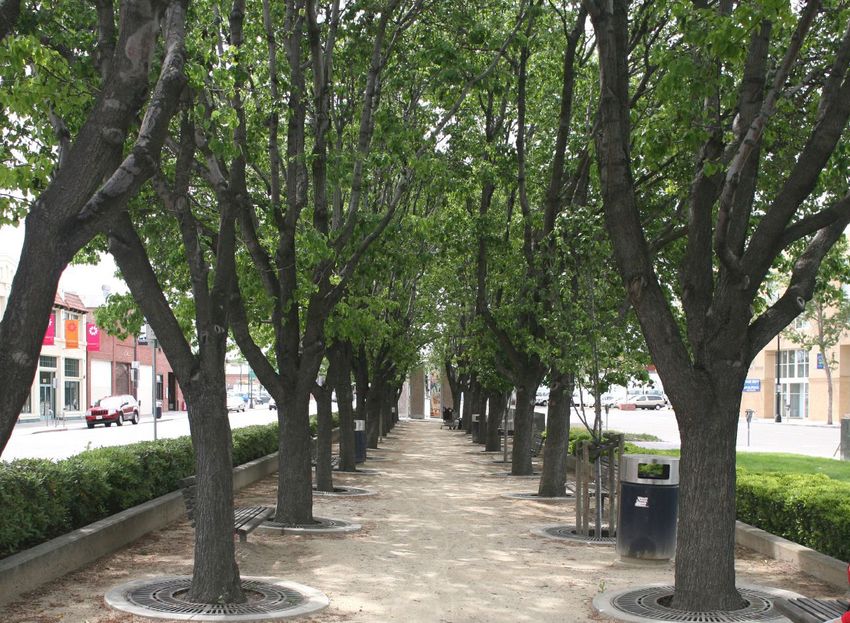
Photograph by Dileep Eduri, courtesy of Creative Commons.
Trees and Hydrology in Urban Landscapes • Page 15Figure 6 shows the percentages of runoff reduction of
evergreen and deciduous street trees for the different
storm events. As the storm events become more extreme,
Runoff reduction benefits of stormwater runoff reduction due to trees declines. The rate
trees decline slightly with of decline is higher when the storm events are less intense
more extreme storm events, (more frequent) and the changes become negligible for
suggesting that more trees storm events larger than the 10-year recurrence interval.
Evergreen trees, with their greater canopy interception
and GSI will be needed under compared to deciduous trees, show higher runoff reduction
a future climate to provide the (reducing an additional 1 to 1.6% of total rainfall amount)
same level of runoff reduction across all storm events. With the expectation of increasing
benefits as today. storm intensity and a greater proportion of rainfall
occurring as intense storms in the future under climate
change, the effectiveness of street tree runoff reduction
would be expected to decline. For example, the runoff
reduction declined 1.2% and 0.8% (of rainfall amount) for
evergreen and deciduous street trees, respectively, between the current and future 2-year 24-hour
storm event. This implies more runoff reduction solutions (more trees and GSI) will be needed in order
to achieve the same runoff reduction under more extreme events associated with climate change.
Future changes of other meteorological variables such as temperature were not considered in this
comparison, by assuming the impacts is negligible at the single storm event scale. Future changes
of other meteorological variables such as temperature were not considered in this comparison (by
assuming the impacts is negligible at the single storm event scale).
Figure 6. The
percentage of
reduced runoff
from different storm
events by evergreen
and deciduous
street trees.
Trees and Hydrology in Urban Landscapes • Page 16Trees at the landscape scale
For a demonstration analysis of the tree canopy module for SWMM, a city-wide model in SWMM previously
established for the City of Sunnyvale was updated and used to evaluate the hydrologic impact of trees at
the landscape scale. The overall approach was to conduct hydrologic modeling representing conditions with
and without existing trees within Sunnyvale for a typical water year. The output from the “no-tree” and “tree”
modeling scenarios were then compared.
The City of Sunnyvale study area
The City of Sunnyvale is one of the major cities in Santa Clara County and part of Silicon Valley, with an
area of 22.8 square miles (14,600 acres) and a population of over 152,000 people. The average annual
precipitation of the City of Sunnyvale is ~14 inches. Its land uses are primarily residential, industrial, and
commercial. Like many cities in the Bay Area, Sunnyvale has undergone significant growth over time and
experienced environmental issues typically associated with urbanization, including increased loadings of
sediment, PCBs, mercury, and pathogens. Sunnyvale is regulated by the Municipal Regional Stormwater
NPDES Permit (MRP; SFBRWQCB, 2015), and stormwater management is a driver for a number of
Sunnyvale plans, activities and area-wide programs. Due to recognized benefits as well as regulatory
requirements, cities are increasingly turning to nature-based solutions to address urban challenges such as
stormwater runoff and associated contaminant loading. In its recent Green Stormwater Infrastructure Plan
(City of Sunnyvale and EOA, Inc., 2019), Sunnyvale articulates its goals for shifting from traditional “gray”
stormwater infrastructure to GSI. Beyond stormwater and water quality benefits, the plan recognizes the
additional benefits these features offer over traditional stormwater infrastructure, including improved air
quality, increased water supply, urban heat reduction, safer streets, and wildlife habitat. Sunnyvale’s recent
Caribbean Drive Green Street project is an example of urban greening that uses GSI to also provide human
safety and recreation as well as ecological benefits.
Like many cities, Sunnyvale is engaged in a wide range of urban greening activities. Its Urban Forest
Management Plan was established with the goal of maintaining and enhancing the benefits of Sunnyvale’s
urban forest, primarily through its Street Tree Program (Bernhardt et al., 2014). Currently, tree canopy covers
~18% of Sunnyvale (both public and private trees) and ~11% of street tree planting spaces (public places only)
are vacant. The urban forest plan proposes to increase overall canopy cover to 20.5%, or an additional 15,000
trees in residential areas and 14,000 trees in commercial areas. This plan also recognizes the importance of
coordination across departments so that activities provide mutual benefits across programs.
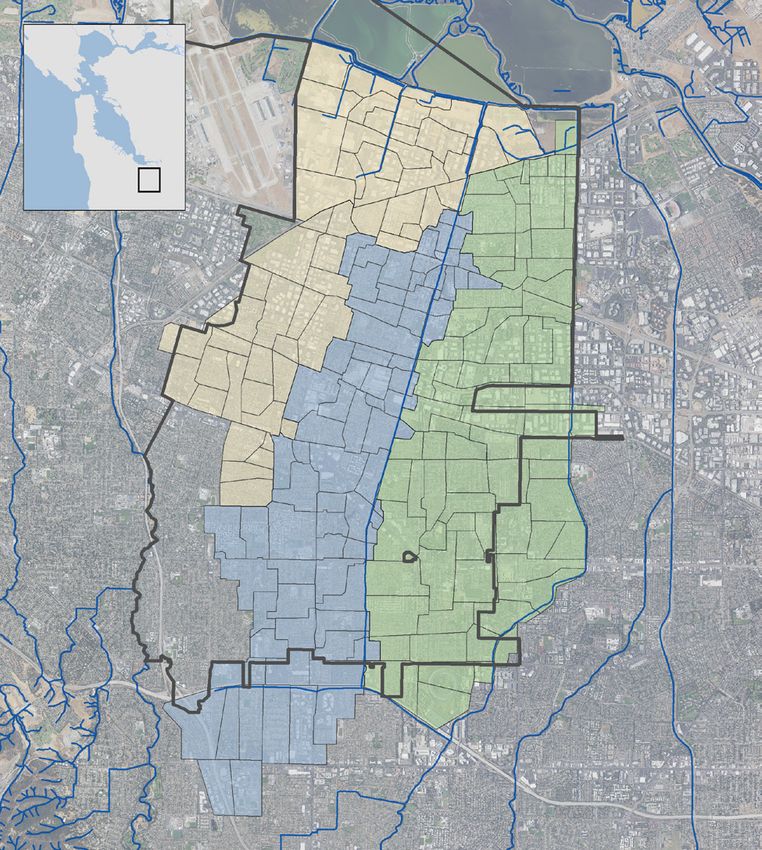
The study area for this analysis covers the majority of the City of Sunnyvale and covers an area of 20.9
square miles (13,386 acres). Within the Sunnyvale boundary, the analysis focused on three major watersheds
(Sunnyvale West Channel, Sunnyvale East Channel, and Calabazas Creek) which cover about 27%, 26%, and
33% of the Sunnyvale footprint, respectively (86% combined; Figure 7; Wu et al., 2018). This application built
upon prior work that used the SWMM Modeling Tool for the City of Sunnyvale (Wu et al., 2018). All three
watersheds in the City of Sunnyvale were delineated and subdivided into a total of 215 subwatersheds based
on their connections and flow direction. These subwatersheds range from 4.6 to 173 acres in size.
Trees and Hydrology in Urban Landscapes • Page 17Figure 7. Modeled watersheds and the 215 N
subwatershed boundaries. Basemap courtesy
NAIP 2018, USDA Farm Service Bureau.
2 miles
Sunnyvale City Boundary
Sunnyvale Modeled Subwatersheds
Sunnyvale West Channel
Sunnyvale East Channel
Calabazas (Lower)
Trees and Hydrology in Urban Landscapes • Page 18SWMM setup
Detailed information describing the input data that were used to set up and calibrate the model in SWMM for
the City of Sunnyvale are documented in Wu et al. (2018). The original model was considered as a baseline
model to conduct hydrological simulations for WY2002. Hourly rainfall data were obtained for WY2002 from
a gauge at the Sunnyvale wastewater treatment plant maintained by Valley Water (Santa Clara Valley Water
District, alert.valleywater.org/map). A basic quality assurance assessment was completed for these data that
involved checking the data at a monthly time step against other neighboring NOAA rainfall station locations,
graphical inspection of the data, and comparison of the data to the frequency depth duration published in
the NOAA 14 Atlas (Perica et al., 2014). The total annual rainfall for this station was 11.1 inches in WY2002.
The 2002 water year is considered as a reference year for PCBs and Hg TMDLs, and is thus a useful year for
stormwater management in terms of water quality.
The baseline model in SWMM is used to provide the stormwater runoff simulation results of WY2002. The
current number and types of trees in each subwatershed of Sunnyvale were identified and then the newly
updated SWMM with the canopy module was used to add trees into the baseline model. The differences in
the simulation results between the baseline and current trees scenarios were used to examine the hydrologic
impact of trees at the landscape scale.
Identifying and characterizing Sunnyvale trees
The number of trees and their primary characteristics (e.g., species, age/size, street or park tree) affect
hydrologic processes at the landscape scale. For the SWMM application to Sunnyvale, we determined the
existing number of trees per subwatershed (Figure 8), the proportion of deciduous versus evergreen trees, and
proportion of park versus street trees (Figure 9).
To identify existing tree locations and determine the number of trees per subwatershed, we used spatial data
of tree coverage derived from 2006 LiDAR and 2016 NAIP imagery (EarthDefine, 2018). The proportion of
deciduous and evergreen trees was established using existing classified vegetation cover data (USGS, 2016).
Though vegetation classes allow for separation of deciduous and evergreen tree coverage, the resolution is
relatively coarse (30 m). Given the low resolution of the data, a city-wide ratio of deciduous versus evergreen
trees was assessed. Additionally, trees were distinguished as either street trees or park (or yard) trees based
on proximity to streets. Specifically, street trees were identified as those trees (from the EarthDefine dataset)
within 43 feet of a street centerline, or within 10 feet of the edge of the right of way (defined as the edge of
parcel polygons that were merged together). All other tree polygons were defined as park trees (see Figure 9
for an illustration of the outcome from this approach).
This analysis produced an estimated total of 236,335 trees (both public and private) with 18% canopy
cover within the modeled subwatersheds of Sunnyvale, which aligns with the 2014 Sunnyvale Urban
Forestry Plan’s estimate of 231,000 trees (~18% canopy cover) in Sunnyvale (Bernhardt et al., 2014).
For the evergreen and deciduous tree assessment, the ratio was found to be 6.7% evergreen, 83.9%
deciduous, and 9.4 % mixed evergreen/deciduous. This contrasts with the Sunnyvale street tree inventory
(public only), which reported 47% evergreen (8% conifer) and 52% deciduous trees (Bernhardt et al.,
2014). However, the street trees in this inventory represent less than 16% of total trees in Sunnyvale and
may not be representative of the total population. Given the assessed dominance of deciduous trees, all
trees for the city-wide analysis were evaluated as deciduous trees. This is a conservative approach that
Trees and Hydrology in Urban Landscapes • Page 19Figure 8. Existing trees within N Figure 9. Example of how Earth- N
the City of Sunnyvale’s modeled sub- Define tree polygons were classi-
watersheds. Tree dataset courtesy fied as street trees or park trees.
EarthDefine (2018). 2 miles Tree dataset courtesy EarthDefine 1/10 of a mile
(2018). Basemap courtesy NAIP
2018, USDA Farm Service Bureau. EarthDefine LLC
Existing Trees
Tree Polygons
Trees per acre Street Tree
28
likely underestimates the runoff reduction impacts of current trees. Across the modeled subwatersheds
for Sunnyvale, 48.3% of trees were classified as park trees and 51.7% were classified as street trees.
The number of assigned street trees in this analysis is over three times the number of street trees in
the Sunnyvale street tree inventory and thus captures trees that may not be maintained by the City of
Sunnyvale as street trees, but likely have characteristics of street trees (e.g., impervious surface beneath
much of the tree canopy).
Trees and Hydrology in Urban Landscapes • Page 20City-wide runoff results
Using the tree characterization, the City of Sunnyvale model in SWMM was updated to include the estimated
number of street and park trees in each subwatershed. The reference WY2002 was applied to both the
baseline model and the model with trees added. Figure 10 shows the runoff depth of each subwatershed under
the baseline and current trees scenarios. The majority of runoff is generated in lower elevation areas of the
watershed where there are higher proportions of impervious area. The runoff coefficients for subwatersheds
range from 0.19 to 0.67.
(a) Baseline Modeled Runoff (in) (b) Modeled Runoff with Trees (in)
Figure 10. Modeled runoff depths for each subwatershed in the City of Sunnyvale study area for (a) baseline conditions and (b) conditions
including the explicit hydrologic effects of trees (based on the estimated 236,335 trees currently in Sunnyvale).
N
2 miles
Runoff (in)
7
Trees and Hydrology in Urban Landscapes • Page 21The difference in runoff depths between the two scenarios for each subwatershed shows the stormwater
runoff reduced due to trees. This is illustrated in Figure 11, where the reduced runoff depth per unit area for
each subwatershed is normalized by the WY2002 annual rainfall depth. The reduced runoff ranges from 1.4%
to 9.5% of the annual rainfall across the Sunnyvale subwatersheds. The subwatersheds with a higher density
of street trees are associated with larger runoff reduction benefits, as shown in the inset plot of Figure 11.
Figure 11. Reduction in runoff (percentage of the 2002 water Runoff Reduction N
year total precipitation of 11.1 inches) due to trees for modeled (% of Total Precipitation)
subwatersheds of the City of Sunnyvale. The inset plot shows 7
Trees and Hydrology in Urban Landscapes • Page 22The total runoff generated for each scenario was compared
to show the overall impact of current trees in Sunnyvale.
At the landscape scale, Figure 12 shows that for WY2002, the current trees in
Sunnyvale evaporated 7.7% more of annual rainfall than
current trees in the City of
the baseline scenario. The increase of evaporation is mainly
Sunnyvale are estimated to due to interception and evaporation at the canopy layer.
be reducing runoff by ~5% of This increased evaporation translates to reductions in both
annual rainfall. infiltration as well as runoff. With 18% mixed coverage of
both street and park trees in Sunnyvale, this demonstration
analysis suggests that the stormwater runoff reduction
benefit is 4.6% of annual rainfall. This number agrees well
with previous research results. For example, the avoided runoff due to urban canopy at the landscape scale
range from 0.6% to 2.6% with a canopy cover from 5% to 13% (Xiao et al, 1998).
Figure 12. Rainfall
partitioning of
the 2002 water
year for the City
of Sunnyvale with
trees (‘Trees’)
and without trees
(‘Baseline’).
Trees and Hydrology in Urban Landscapes • Page 23Exploring future analysis directions
The demonstration analysis described in the previous sections is a proof of concept approach that illustrates
the hydrologic significance of trees within urban landscapes and the potential for trees to play an important
role in stormwater management as elements of urban greening strategies. Further analysis will be necessary to
more fully evaluate the hydrologic role of trees with varying characteristics and to incorporate trees into typical
management evaluations for regulatory purposes and site-specific design guidance. The following sections
include initial analysis and suggested directions for next steps.
Tree characteristics: Growth and age
Tree canopy interception and evapotranspiration are closely related to canopy size and structure. These
characteristics are highly variable across trees of different ages and species. They also vary over time,
seasonally and inter-annually. Tree canopy size and leaf area index (LAI) are two parameters that adjust the
interception and evaporation processes in the new canopy module of SWMM. For an initial investigation of the
impact of tree sizes on the canopy interception, a common native evergreen species, coast live oak (Quercus
agrifolia), was selected for a sensitivity analysis.
The canopy size and LAI parameters for coast live oak with a DBH (diameter at breast height) from 1 to 50
inches (1 inch interval) were extracted from the i-Tree database (database.itreetools.org; Figure 13a and 13b).
A test watershed of one acre and 100% tree canopy coverage was established in SWMM and run for each of
the tree sizes. The 2-year 24-hour storm was used for the canopy interception evaluation. Figure 13c shows
the percentage of rainfall volume captured per tree across the different sizes. The percentage ranges from
~0% to ~7% and is nearly directly proportional to canopy size. Given the wide range of canopy size and more
limited variation in LAI, canopy size is the primary factor determining capture volume. Similar analyses could
be conducted for other common species to provide greater insight into the range of expected canopy capture
depending on species and size.
The range in rainfall capture indicates the size of trees and the time for newly planted trees to grow to
desired sizes should be considered when planning to use trees as a nature-based solution for stormwater
management. The factor of tree size is also relevant to differences between street and park trees as the growth
and longevity of street trees is often more limited than park or yard trees due to planting space (volume of soil
and tree well size), maintenance, and other environmental factors. Improved understanding of how much these
factors influence the hydrologic impact of trees in combination with cost-benefit assessments of planning for
and maintaining larger and healthier street trees could help guide planting and management practices.
Photographs by Robin Grossinger, SFEI.
Trees and Hydrology in Urban Landscapes • Page 24Figure 13. Tree size (a)
relationships. Tree
canopy (a) and leaf
area index (LAI; b)
of coast live oak
are shown as they
relate to diameter at
breast height (DBH),
with values derived
from the i-Tree
database (database.
itreetools.org). In (b)
(c), the percentage
of rainfall volume
captured from a
2-year 24-hour
storm event is
shown.
(c)
Photographs by Shira Bezalel, SFEI.
Trees and Hydrology in Urban Landscapes • Page 25Stormwater management perspective
From a stormwater regulatory perspective, urban trees have
been credited in various ways across the country (Center for
Watershed Protection, 2017). The newly updated SWMM
The newly updated SWMM
offers an approach for quantifying the stormwater benefit
of trees in the same way as GSI. Thus, the tool can be used can quantify stormwater
to evaluate trees with the sizing criteria for GSI from the benefits of trees in the
Municipal Regional Stormwater NPDES Permit (MRP 2.0; same way as GSI, allowing
SFBRWQCB, 2015). For a demonstration approach here, trees to be evaluated
the hydraulic sizing volume-based criteria for treatment
with the sizing criteria for
best management practices from MRP 2.0 was selected to
evaluate the performance of street trees: “The maximized GSI from the Municipal
stormwater capture volume for the area on the basis of Regional Stormwater
historical rainfall records… (e.g. approximately the 85 th
Permit.
percentile 24-hour storm runoff event)” (SFBRWQCB, 2015).
If a street tree can be considered as a self-treating unit, it
should capture all the stormwater from the 85th percentile
24-hour storm event. For this exploratory analysis, an 85th percentile daily rainfall depth of 0.37 inches
was determined based on daily rainfall data at Moffett Airport (a NOAA site with long term precipitation
records). This was corrected to 0.41 inches using a 1.12 correction factor from the NOAA Atlas 14 (Perica
et al., 2014) to account for the difference of the rainfall depths between constrained and unconstrained
24 hours (daily vs. any consecutive 24 hours).
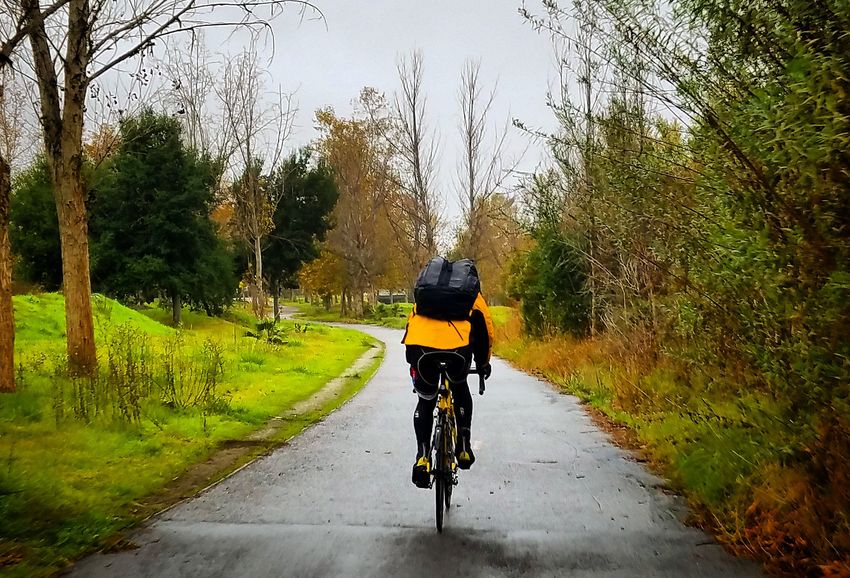
Photograph by Richard Masoner / Cyclelicious, courtesy of Creative Commons.
Trees and Hydrology in Urban Landscapes • Page 26This analysis found that street trees with larger tree wells can be considered as self-treated areas. Trees
with small (8 ft2) and medium size tree wells (18 ft2) cannot capture all the stormwater of a 85th percentile
24-hour event. However, evergreen street trees with medium size tree wells captured nearly all of the
stormwater runoff (97%) and could thus be considered a self-treated area with slightly larger tree wells.
To complete the analysis, design storm depth was disaggregated to a five minute interval to run eight
simulations for a one acre test watershed with 100% evergreen and deciduous street tree coverage for
three tree well sizes and with 100% pervious and 100% impervious land surface. Unlike previous analyses
that did not route the runoff from adjacent impervious areas into the tree wells, all stormwater runoff from
the impervious surface under the tree canopy was routed into the tree wells, which treated the street tree
as a whole self-treating unit (a recommended design to maximize the infiltration of street trees). Figure 14
shows runoff depths of a 85th percentile 24-hour storm event from the different land covers. Street trees
with larger tree wells can be considered as self-treating areas. Trees with small (8 ft2) and medium size tree
wells (18 ft2) cannot capture all of the stormwater of an 85th percentile 24-hour event. However, evergreen
street trees with medium size tree wells captured nearly all of the stormwater runoff (97%) and could thus
be considered a self-treating area with slightly larger tree wells. The results detailed above demonstrate
that tree wells can treat more stormwater than that derived from their footprints, which has implications for
design considerations.
Figure 14. Runoff
depth from different
land surfaces
(pervious (P),
impervious (IMP),
street trees with
small (S), medium
(M), and large (L)
tree wells) after a
85th percentile 24-
hour storm event.
Trees and Hydrology in Urban Landscapes • Page 27You can also read