A STORM TO REMEMBER: HURRICANE HARVEY AND THE TEXAS ECONOMY - Texas Comptroller
←
→
Page content transcription
If your browser does not render page correctly, please read the page content below
FEBRUARY 2018
SP EC I AL ED IT IO N
FISCAL NOTES
A REVIEW OF THE TEX AS ECONOMY FROM THE OFFICE OF G LE N N H E GA R, TEX AS COMPTROLLER OF PUBLIC ACCOUNTS
A STORM TO REMEMBER:
HURRICANE HARVEY AND THE TEXAS ECONOMY
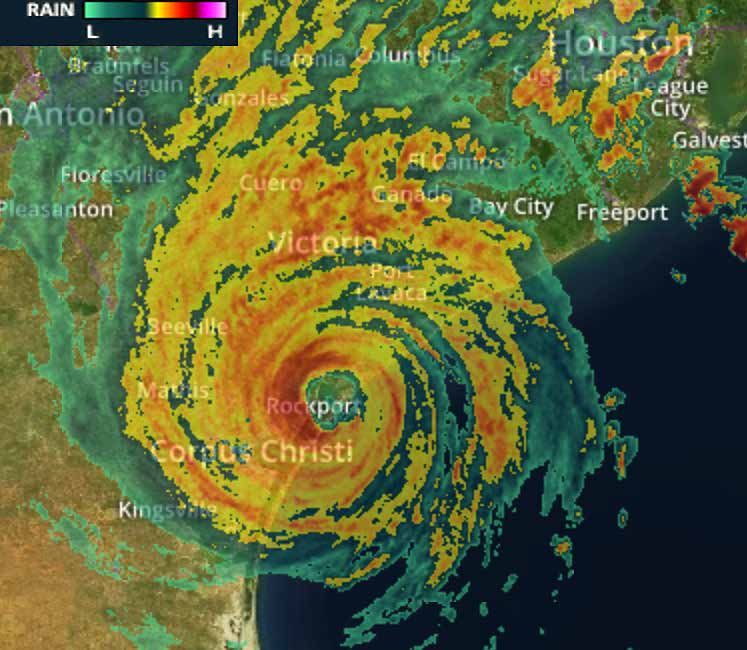
G LE N N H E GA R, TEX AS COMPTROLLER OF PUBLIC ACCOUNTS AUGUST 25, 2017, 10:41 PM CDT
A Message from the Comptroller
                                                                         In 2017, we saw massive destruction along U.S. coastlines from
                                                                         hurricanes Harvey, Irma and Maria. Texas, of course, was ground zero
                                                                         for Hurricane Harvey, one of the costliest storms in American history.
                                                                                  Harvey devastated much of southeast Texas in August, earning
                                                                         a page in the history books for its overwhelming winds and flooding.
                                                                         The storm brought unprecedented destruction to parts of our coast;
                                                                         dozens died and many more lost homes, automobiles and livelihoods.
                                   Many small communities may require years to recover, and some may not recover completely.
                                            But Texans are resilient, and so is our state. While the initial impact of Harvey was severe,
                                   the Texas economy has already absorbed much of the damage from this record-breaking storm
                                   and should avoid long-term losses.
                                            It may take years to tally Hurricane Harvey’s toll on Texas, but we’ve been working hard
                                   to analyze the net impact of the storm based on the data we’ve seen so far.
                                            Our analysis takes a wide-ranging view of the consequences, using a dynamic input-output
                                   model to measure the storm’s economic impacts, both negative and positive, on our state. We
                                   estimate lost business productivity from the storm resulted in a $16.8 billion decrease in gross
                                   state product (GSP) — but that’s only part of the equation, because gains to GSP stemming
                                   from recovery efforts and increased construction activity are likely to offset most of this loss.
                                            As you’ll see in this report, we estimate the net impact of Hurricane Harvey will be a
                                   loss of $3.8 billion in GSP during the first year following the storm, with a cumulative gain of
                                   approximately $800 million over three years.
                                            In this special edition of Fiscal Notes, we examine the effect of Harvey on the state
                                   economy through data modeling. We also look at recovery efforts and possible opportunities to
                                   prevent other flooding disasters in the future.

                                   G LENN HEGAR
                                   Texas Comptroller of Public Accounts

 Cover: Radar image of Harvey on Aug. 25, 2017, 10:41 p.m.

 The statements contained in this report and the information referenced in it that are not purely historical are forward-looking statements within the meaning of Section 27A of the
 Securities Act of 1933, as amended, and Section 21E of the Securities Exchange Act of 1934, as amended, including statements regarding the Comptroller’s expectations, hopes, intentions
 or strategies regarding the future. Readers should not place undue reliance on forward-looking statements. All forward-looking statements included in this report are based on information
 available to the Comptroller on the date of publication, and the Comptroller’s office assumes no obligation to update any such forward-looking statements. It is important to note that actual
 results could differ materially from those in such forward-looking statements.
        The forward-looking statements included here are necessarily based on various assumptions and estimates and are inherently subject to various risks and uncertainties, including
 those relating to the possible invalidity of the underlying assumptions and estimates and possible changes or developments in social, economic, business, industry, market, legal and
 regulatory circumstances and conditions and actions taken or not taken by third parties including customers, suppliers, business partners and competitors and legislative, judicial and other
 governmental authorities and officials. Assumptions related to the foregoing involve judgments with respect to, among other things, future economic, competitive and market conditions
 and future business decisions, all of which are difficult or impossible to predict accurately and many of which are beyond the control of the Comptroller’s office. Any of such assumptions
 could be inaccurate and therefore there can be no assurance that the forward-looking statements included in this report will prove to be accurate.

                                   If you would like to receive paper copies of Fiscal Notes, contact us at fiscal.notes@cpa.texas.gov

2 |   G LE N N H E GA R, TEX AS COMPTROLLER OF PUBLIC ACCOUNTS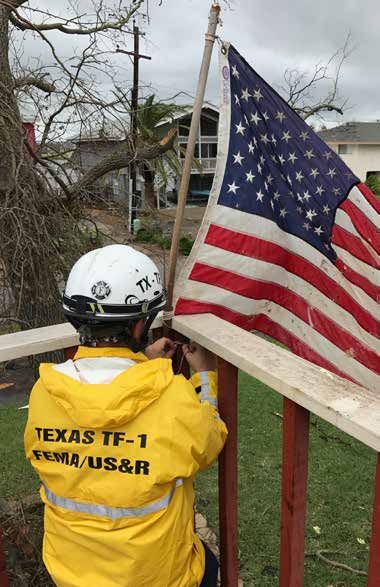
A STORM TO REMEMBER: Hurricane Harvey and the Texas Economy
                         Late last August, Texans watched and waited anxiously as Hurricane Harvey
                              approached our state. Born in the Atlantic Ocean as a tropical storm,
                            Harvey intensified rapidly to a Category 4 hurricane in the Gulf of Mexico
                                          and hurtled directly toward the Texas coast.

                 On Aug. 25, 2017, Harvey made landfall, devastating                     bringing record-breaking rainfall and catastrophic
                 Port Aransas, Rockport and other nearby commu-                          flooding to the southeastern part of the state. Parts
                 nities with 130 mph winds and a six-foot storm                          of the Houston metro area recorded more than
                 surge. Swinging north, the hurricane moved into the                     50 inches of rain in a four-day period, while inland
                 Houston area, bringing thunderstorms and tornadoes                      communities such as La Grange, Bastrop and
                 that caused extensive damage.                                           Smithville saw massive flooding as the Colorado
                     Although it downgraded to a tropical storm as                       River overflowed its banks.1
                 it moved inland, Harvey wasn’t through spreading                            The Saffir-Simpson Hurricane Wind Scale classifies
                 havoc. The storm lingered in Texas for several days,                    hurricanes and tropical storms according to their
                                                                                         maximum sustained wind speeds (Exhibit 1). A “major”
                                                                                          hurricane is defined as one at Category 3 or higher.
                                                                                             Once the danger passed, it was clear the
                                                                                         hurricane had caused dozens of deaths and billions
                                                                                         of dollars’ worth of physical damage to homes,
                                                                                         buildings, vehicles and basic infrastructure in the
                                                                                         affected areas.
                                                                                             Texans have weathered many major storms
                                                                                         through the years, but Harvey — the strongest
                                                                                         hurricane to hit Texas since Carla in 1961 — was
                                                                                         particularly devastating. 2 According to data collected
                                                                                         by the Texas Division of Emergency Management as
                                                                                         of Nov. 30, 2017, Harvey damaged or destroyed more
                                                                                         than 178,400 Texas homes and inflicted an estimated
                                                                                         $669 million in damage to public property such as
                                                                                         government buildings, roads, bridges, water facilities
                                               Aftermath of Harvey in Rockport, Texas.
                                                                                         and electric utilities. 3 October estimates from the
                     H U R R I C AN E C ATEG O R I E S                                   Texas Department of Motor Vehicles suggested flood-
                                                                                         ing may have ruined from half a million to a million
                                      EXHIBIT 1
                                                                                         cars and trucks, although more recent estimates put
       THE SAFFIR-SIMPSON HURRICANE WIND SCALE                                           the number at around a quarter-million vehicles.4
                                                     SUSTAINED WIND SPEEDS                   Harvey also exacted a high cost on many
    TYPE OF STORM                   CATEGORY                 (MPH)                       of the state’s industries. According to the Texas
   Tropical Depression                 TD                        0-38                    A&M AgriLife Extension Service’s most recent
      Tropical Storm                   TS                        39-73                   estimates, the storm caused more than $200 million
        Hurricane                      1                         74-95                   in Texas crop and livestock losses. 5 The coastal
        Hurricane                      2                        96-110                   tourism industry suffered crippling damages,
        Hurricane                      3                        111-129                  especially in Rockport-Fulton, where the Chamber
        Hurricane                      4                        130-156                  of Commerce estimates winter tourism was down by
        Hurricane                      5                     157 or higher               50 percent. Other economic sectors — particularly
Source: National Hurricane Center                                                        CONTINUED ON PAGE 4

                                                                                                                  FISCAL NOTES — SPECIAL EDITION   | 3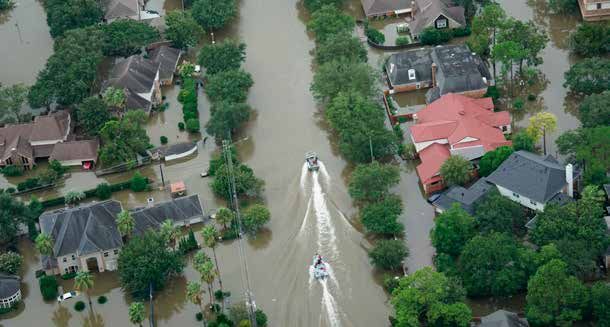
Hurricane Harvey and the Texas Economy                        CONTINUED FROM PAGE 3

               manufacturing, energy, chemical production and                  Atmospheric Administration estimates Harvey’s
               retail sales — suffered damage to structures and                total costs at $125 billion.7 Once actual damages
               equipment and, in many cases, experienced signifi-              and repair costs are determined, the cost may be
               cant and expensive downtime due to flooding, lost               even higher.
               electrical power, employees’ inability to get to work               Although the losses stemming from Hurricane
               and other situations causing temporary disruptions              Harvey are enormous, they will be counteracted,
               to the flow of goods and services.                              to some degree, by economic activity — primarily
                   Most businesses in the affected areas had to                reconstruction and repair — following the storm. To
               close in the immediate aftermath of the storm,                  estimate the full economic change resulting from the
               although the period of lost production varied. Many             storm, we must consider not only losses but gains.
               encountered structural damage, floodwater, debris
                                                                               ECONOMIC IMPACTS
               and downed utilities.
                   This is a preliminary analysis. We may not know             The extent and cost of Harvey’s destruction were
               the full impact of Hurricane Harvey for years. But              significant. But when balanced against the anticipated
               the National Center for Economic Information has                increase in business activity due to reconstruction
               predicted Harvey will prove to be one of the most               and restoration efforts, combined with an influx of
               expensive natural disasters in U.S. history, perhaps            funding from federal aid and insurance payments,
               second only to 2008’s Hurricane Katrina.6 The most              the effect on the state’s economy may be much less
               recent estimate from the National Oceanic and                   severe than many expected. Gains from increased

                                                        A H I STO RY O F H U R R I C AN E S
 To put Harvey’s costs in perspective, consider previous storms with similar characteristics. These storms shared many similarities with Harvey in their
 effects on lives, homes and infrastructure.

      TROPICAL STORM ALLISON (June 2001): Like Harvey,                            HURRICANE IKE (September 2008): Ike, a Category 2 hurricane,
      Allison was responsible for severe flooding in the Houston area,            hit Galveston with winds of up to 110 mph and a 20-foot
      dropping more than three feet of rain in four days and producing            storm surge. In addition to causing 112 deaths, Ike damaged
      23 tornadoes. Allison caused 43 deaths and damages estimated                oil platforms, storage tanks, pipelines and refineries, causing
      at $8.5 billion (or $11.9 billion in 2017 dollars), making it one of        gasoline shortages in the southeastern U.S. The storm caused an
      the most deadly and expensive weather events in Texas history.8             estimated $30 billion in damages ($34.8 billion in 2017 dollars).13

      HURRICANE KATRINA (August 2005): Katrina made landfall                      POST-TROPICAL STORM SANDY (October 2012): Sandy,
      on the Louisiana and Mississippi coasts as a Category 3 hurricane,          originally a Category 3 hurricane, hit the northeastern U.S. with
      bringing a 20- to 30-foot storm surge and strong winds that                 a storm surge of up to 12 feet and about a foot of rain.14 Sandy
      damaged many levees, flooding more than 80 percent of New                   damaged or destroyed thousands of businesses and hundreds
      Orleans and causing at least 1,833 deaths in five states.9 With             of thousands of homes.15 Total damages were estimated at
      damage costs estimated at $125 billion ($161.3 billion in 2017              $65 billion ($70.2 billion in 2017 dollars), making Sandy the
      dollars), Katrina remains the costliest storm in U.S. history.10            second-costliest storm in U.S. history after Katrina until Harvey.16

      HURRICANE RITA (September 2005): Rita made landfall
      near the Texas-Louisiana border as a Category 3 hurricane with
      sustained winds reaching 115 mph. Rita’s 10- to 15-foot storm
      surge, combined with up to 15 inches of rain in some areas,
      caused extensive flooding and wind damage.11 Rita caused 119
      deaths and an estimated $18.5 billion in damages ($23.9 billion in
      2017 dollars).12

4 |   G LE N N H E GA R, TEX AS COMPTROLLER OF PUBLIC ACCOUNTS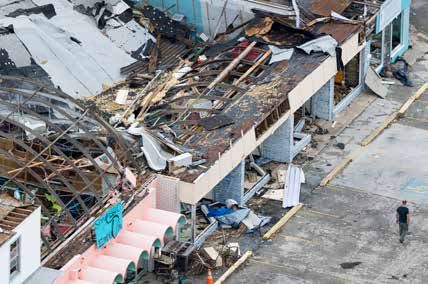
EXHIBIT 2
      D I R E C T AN D I N D I R E C T DA M AG E S
                                                                      FUNDING SOURCES FOR HURRICANE DISASTER RELIEF
Weather events such as Harvey cause both direct and indirect
damages. Direct damages include the destruction of buildings,        FEDERAL EMERGENCY MANAGEMENT AGENCY
possessions, vehicles and infrastructure, such as roads,
                                                                       • National Flood Insurance Program: payments for flood claims
water systems and power lines. Indirect damages refer to
                                                                       • Individual Assistance: payments to individuals and households
the interruption of business activity caused by the storm —
                                                                       • Public Assistance: reimbursements to state and local
disruptions caused by safety concerns, the loss of electrical
                                                                         governments and certain nonprofits
power, damaged machinery or the temporary inability of
                                                                     SMALL BUSINESS ADMINISTRATION
employees to reach work. These affect the economy through
                                                                       • Home loans
lost business income as well as reduced employee earnings or,
in some cases, lost jobs.17                                            • Business loans
       While direct damages represent the most obvious and           U.S. DEPARTMENT OF HOUSING AND URBAN DEVELOPMENT
                                                                     – COMMUNITY DEVELOPMENT BLOCK GRANTS
visible effects of the hurricane, they do not enter into our
analysis because they represent what economists call retro-          STATE AND LOCAL FUNDS
spective or “sunk” costs — in essence, money already spent,          PRIVATE INSURANCE COMPANIES
economic activity that has already taken place. A home, for          NONPROFIT ORGANIZATIONS
instance, affects economic output when it is built, but not if it    Sources: Congressional Research Service and the Texas Legislative Budget Board

is damaged or destroyed a decade later by a storm. Its repair
or rebuilding, however, will affect the economy.                    disaster relief and rebuilding as of Nov. 30, 2017. This
                                                                    number is likely to rise. Money for reconstruction
                                                                    efforts will come primarily from the Federal
         construction activity and associated spending              Emergency Management Agency (FEMA), state and
         undertaken to repair and rebuild should help offset        local governments and private insurance (Exhibit 2).
         losses in the months and years to come.                         All of this spending will spur economic growth.
             During and immediately following the storm,                 Without the boost from rebuilding, Texas’ gross
         Texas communities in the affected areas faced costs        state product (GSP) would have required four years
         associated with emergency response, evacuee shel-          to recover to pre-Harvey expectations; personal
         ters, debris removal and infrastructure repair. Many       income would require five years. Single-family
         suffered damage to public buildings and vehicles           residential housing stock would take seven years to
         that must be repaired or replaced. Many businesses,        rebound to normally expected levels, while non-
         in addition to repairing damaged facilities, must          residential building stock in the affected areas would
         replace some or all of their equipment and inventory.      require four years for recovery. 20 With the help of
             Meanwhile, thousands of evacuees staying in            federal, state and local government aid, however,
         hotels or rental units faced temporary housing costs       all of these measures should recover in the second
         and, upon returning to their flood-damaged homes,          year after the storm, and Texas should gain about
         began replacing floors and sheetrock and purchasing        half as many jobs as it would have lost in the absence
         furniture, household goods, electronics, clothes           of government aid.
         and vehicles.                                                   Exhibit 3 displays the estimated indirect losses
             Harvey disrupted a broad range of industries, but      and gains to Texas GSP resulting from Hurricane
         manufacturers represented a large share of them.18         Harvey. In all, the total estimated net impact (losses
         Although many were back in operation within five or        plus gains) is a $3.8 billion loss in GSP in the first year
         so days, some experienced significant disruptions for      following the storm. (To put this loss in perspective,
         two weeks or more.19                                       Texas’ GSP was $1.6 trillion in 2016.)21
             Based on information submitted to the                       Recovery will stimulate economic activity,
         Comptroller’s office, federal, state and local govern-     producing an estimated $800 million cumulative
         ments, along with private insurers, had spent or
         committed about $31 billion for Harvey-related             CONTINUED ON PAGE 6

                                                                                                      FISCAL NOTES — SPECIAL EDITION                  | 5
Hurricane Harvey and the Texas Economy                          CONTINUED FROM PAGE 5

            gain in GSP over three years. 22                                                                         EXHIBIT 3

                 It’s also possible to assess economic costs on a
                                                                                    NET ECONOMIC IMPACT OF HURRICANE HARVEY ON
            local basis by examining the counties included in                               TEXAS GROSS STATE PRODUCT
            Texas’ councils of government (COGs), multi-county                                                (IN BILLIONS OF DOLL ARS)
            regional planning bodies. Harvey affected eight COG                                                YEAR 1          YEAR 2     YEAR 3     YEARS 1-3
            regions — the Houston-Galveston, South East Texas,                  Estimated Losses               ($16.8)         ($2.0)     ($1.0)       ($19.8)
            Golden Crescent, Coastal Bend, Brazos Valley,                       Estimated Gains                 $13.0           $4.1       $3.5        $20.6
            Deep East Texas, Capital and Alamo areas — and                      Net Economic Impact             ($3.8)          $2.1       $2.5         $0.8
            41 counties within them were designated as disaster                 Source: Texas Comptroller of Public Accounts
            areas (Exhibit 4).
                 The storm hit the 13-county Houston-Galveston                     Our estimate of first-year effects on real GSP by
            COG region hardest, causing an estimated $16 billion               sector show the hardest-hit industries include mem-
            economic loss during the first year. FEMA designated               berships (to clubs, sports centers, parks, theaters
            all 13 counties in this region as disaster areas. The              and museums), telecommunication services and
            Coastal Bend, South East Texas and Golden Crescent                 entertainment, while those faring the best include
            COGs can expect first-year losses projected at                     health services, food and beverages and, for obvious
            $350 million to $800 million each. The Alamo Area,                 reasons, rental housing, motor vehicles, furniture and
            Capital Area and North Central Texas regions, by                   clothing.
            contrast, stand to gain in Harvey’s wake, each with an                 The auto industry in particular should see
                                estimated $1 billion to $2 billion in          increased demand as consumers seek to replace the
                                   additional economic activity.               cars and trucks damaged or destroyed by flooding.

                                                                        EXHIBIT 4

                                        TEXAS COUNTIES AFFECTED BY HURRICANE HARVEY

                                                                                    Counties declared by FEMA as disaster areas and boundaries
                                                                                    showing the eight Councils of Governments affected.

                                                                                     DETCOG              Deep East Texas Council of Governments
                                                                                                         Jasper, Newton, Polk, Tyler, Sabine, San Jacinto
                                                                                      SETRPC             South East Texas Regional Planning Commission
                                                                                                         Hardin, Jefferson, Orange
                                                                                       H-GAC             Houston-Galveston Area Council
                                                                                    	Austin, Brazoria, Chambers, Colorado, Fort Bend,
                                                                                      Galveston, Harris, Liberty, Matagorda, Montgomery,
                                                                                      Walker, Waller, Wharton
                                                                                       BVCOG             Brazos Valley Council of Governments
                                                                                                         Grimes
                                                                                     CAPCOG              Capital Area Council of Governments
                                                                                                         Bastrop, Caldwell, Fayette, Lee
                                                                                    GCRPC Golden Crescent Regional Planning Commission
                                                                                    	Calhoun, DeWitt, Goliad, Gonzales, Jackson, Lavaca,
                                                                                          Victoria
                                                                                      AACOG              Alamo Area Council of Governments
                                                                                                         Karnes

                               Source: Federal Emergency Management Agency            CBCOG              Coastal Bend Council of Governments
                                                                                                         Aransas, Bee, Kleberg, Nueces, Refugio, San Patricio
6 |   G LE N N H E GA R, TEX AS COMPTROLLER OF PUBLIC ACCOUNTS
Although this increase in demand is expected to share of the total damages compared with other
spike during the first year after the storm, it should major U.S. hurricanes because a larger-than-usual
return to pre-Harvey levels within five years. share of the property damage was caused by flood-
As expected, the Texas economy as a whole ing rather than wind damage, and flooding generally
appears to have bounced back to pre-Harvey levels is not covered under homeowner policies.
as of the end of the fourth quarter of 2017. 23 The negative economic impact of lost productivity
and damage to structures, however, is expected to
DATA AND ASSUMPTIONS be counterbalanced largely by businesses’ quick
For this analysis, Comptroller economists used a recovery as well as the money communities and
Regional Economic Models Inc. (REMI) model based businesses spend to rebuild.
on Texas’ 24 COG regions to examine economic Texas’ diverse and resilient economy will help
activity. Eight of the 24 include the 41 counties that buoy the state from Harvey’s impact. While some
bore the brunt of the damage inflicted by Harvey, as industries continue to struggle, most businesses are
determined by FEMA’s disaster designation. recovering and moving ahead. In all, our analysis
The methodology used to estimate losses and indicates that Hurricane Harvey will have minimal
gains in economic activity as a result of Harvey relied long-term effects on the Texas economy, which —
on a combination of data, assumptions and estimates. with time — will recover and be stronger than ever.
REMI calculates the effect of losses and gains on
HURRICANE HARVEY AND THE
projected GSP for the duration of the time period
STATE BUDGET
used in this analysis. (Appendix 2 provides a detailed
description of the methodology used in this analysis.) The damages wrought by Harvey will affect the state
Several factors influenced the inputs used to budget as well. While the federal government, local
generate this estimate, including the number and authorities and private insurance are providing much
population of counties affected by Hurricane Harvey of the funding needed for cleanup and rebuilding,
as well as the extent and duration of the damage. the state may have further expenses.
Because the affected areas do not match up Determining funding sources and storm-related
neatly with COG boundary lines, this estimate expenses is an ongoing task, and the picture is
assumes only the affected counties experienced changing rapidly as information is shared among
productivity loss and reduces nonfarm productivity state, federal and local entities. The Comptroller,
by the proportion of people in affected counties to Legislative Budget Board and the Governor’s office
the total population of each region. are working together to identify and track Harvey-
Our estimate also addresses reconstruction and related revenues and expenditures.
repairs in the first three years, although no actual FUTURE MITIGATION
timeline for reconstruction has been determined. OPPORTUNITIES
The estimate also assumes the duration of
A storm as devastating as Hurricane Harvey inevitably
business closures or reduced revenue as follows:
is followed by efforts to mitigate the effects of future
· medical care facilities: four days storms. Hazard mitigation is any sustained action
·m
anufacturing and oil- and gas-related taken to reduce or eliminate the risks and impacts of
production: two weeks natural hazards, such as floods, tornadoes and severe
· all other industries: one week winter storms. 24
Recovery efforts are more expensive than
RECOVERY AND BEYOND mitigation efforts, but many believe the nation hasn’t
Despite the transitory nature of Harvey’s impact adequately funded the latter. According to Larry
on employment and business activity, the damage Larson, a senior policy adviser at the Association of
to property and infrastructure has been severe. State Flood Plain Managers, the U.S. has spent about
Moreover, insured losses are expected to be a smaller CONTINUED ON PAGE 8
FISCAL NOTES — SPECIAL EDITION | 7Hurricane Harvey and the Texas Economy CONTINUED FROM PAGE 7
HARV E Y AN D TE X A S TA S K FO RC E 1
Amid the chaos of Hurricane Harvey, Texas Task Force 1
(TX-TF1) deployed to Texas coastal communities to coordinate
and perform search and rescue missions. More than 250 TX-TF1
personnel participated, as did teams from Texas state agencies,
two federal agencies and more than a dozen other states. In
all, the effort completed 841 rescues by air, 19,050 rescues by
ground or water and nearly 38,000 evacuations.
TX-TF 1, comprising more than 600 volunteers representing
60 organizations throughout Texas, is one of 28 federal teams
within FEMA’s National Search and Rescue System. TX-TF1 is
based in College Station and sponsored by the Texas A&M
Engineering Extension Service (TEEX).
Under the direction of the Texas Department of Public
Safety’s Texas Division of Emergency Management, TX-TF1
also serves as a statewide urban search and rescue team. In
partnership with the Texas Military Department (TMD), the task
force coordinates the state’s swift-water rescue program and
helicopter search and rescue team.
TX-TF1 maintains its readiness for rapid response through
training classes and exercises held throughout the year at a
52-acre training facility in College Station called Disaster City,
a mock community outfitted with full-scale, collapsible
structures that simulate disaster and wreckage.
“Texas A&M System and TEEX support includes Disaster City,
originally built to train TX-TF1, a 40,000-square-foot headquarters
facility, a large vehicle fleet and equipment cache and 18 TEEX
staff to provide constant and well-trained support of the team
and its equipment,” says Chuck Jones, TX-TF1 operations chief.
“Our mission is to always be ready to respond at a
Photo courtesy of Texas Task Force 1.
moment’s notice, to do the most good for the most people in
the least amount of time,” says Jeff Saunders, TX-TF1 director.
$300 billion responding to various natural disasters,
“The support the Texas A&M University System and TEEX give
but only $600 million on mitigation. Yet mitigation
to TX-TF1 is incredible, and a critical part of what keeps this
spending has a four-to-one payback ratio. 25
team always ready to respond.”
Mitigation actions fall into two categories,
TX-TF1 members include firefighters, doctors, nurses,
structural and non-structural.
structural engineers, canine handlers, professors, police officers
and other professionals from many different fields. TX-TF1 also STRUCTURAL MEASURES
has 10 trained and FEMA-certified dogs for locating survivors Structural measures attempt to “disaster-proof”
and human remains. physical infrastructure through repair, replacement
TX-TF1 has been deployed more than 100 times in its or additions.
20-year history, assisting with a wide range of emergency R E S E RVO I R S
and disaster recovery operations around the state and across Houston has two reservoirs, Addicks and Barker,
the nation. From the team’s first deployment in response to created by earthen dams in the 1940s to address
the 1997 tornado in Jarrell, Texas, to 2017’s Hurricane Harvey, downtown flooding. Neither was designed to contain
TX-TF1 has provided on-site emergency services under the the volume of water they’ve received in the last three
most severe and challenging circumstances. CONTINUED ON PAGE 10
8 | G LE N N H E GA R, TEX AS COMPTROLLER OF PUBLIC ACCOUNTSE X TR A H E LP I N TO UG H TI M E S:
CO M P TRO LLE R ’S O FFI C E SU PP O R T S TA XPAY E R S AN D E M PLOY E E S
State agencies serve Texas residents in good times and bad. It wasn’t the first time. SPD worked with the Department
During the devastating hurricane of August 2017, the Comptroller’s of Public Safety’s Texas Division of Emergency Management to
office took this commitment to heart. support recovery efforts during hurricanes in 2005, 2007 and 2008;
The Comptroller’s office has locations across Texas. Some field the Bastrop fires in 2011; the West fertilizer plant explosion in 2013;
offices in Houston, Beaumont, Corpus Christi and elsewhere experi- and many other disasters.
enced brief, storm-related closures, but the Comptroller’s Taxpayer Our own Comptroller family also was affected by Harvey. About
Services staff in Austin fielded hundreds of calls and emails about 20 employees experienced flood damage; at least one of our Houston-
tax payments. The agency granted businesses in affected counties area employees lost his home. In response, agency employees
temporary extensions to file taxes. hosted fundraisers to purchase supplies for fellow workers affected
But the Comptroller’s hurricane relief efforts extended well by the hurricane and took food, bottled water, clothes, cleanup
beyond taxes. The Comptroller’s Statewide Procurement Division supplies and gift cards to storm-ravaged areas.
(SPD) plays a lead role in the State of Texas Emergency Management “It was a very pleasant surprise when employees from Austin
Plan and the state’s Emergency Management Council. During walked into our office with care packages wearing ‘Houston Strong’
disasters, the governor can suspend state purchasing laws with the T-shirts,” says Houston Northwest Enforcement Office Manager
issuance of a disaster proclamation, allowing SPD to get emergency Jesse Vela. “We had office staff who had property damage, had to
supplies and equipment to first responders and Texans in need as be rescued and even had to be evacuated. But thankfully, consider-
quickly and efficiently as possible. ing all the damage that occurred throughout the Houston area, we
In a single weekend, SPD staff initiated purchases of more than didn’t have a loss of life.”
$15 million for mobile fueling stations, a fleet of 650 evacuation The Comptroller’s office is here to help Texans, from expedited
buses, bottled water and ice, showering stations, portable toilets, purchasing of emergency equipment and supplies, special licenses
heavy equipment for recovery efforts and other items for emer- for motor fuel imports, tax deadline extensions and more. We’ll
gency shelters and rescue efforts. continue to assist in this situation and any other that arises.
Comptroller volunteers delivered care packages and water to fellow employees in the Houston office.
FISCAL NOTES — SPECIAL EDITION | 9Hurricane Harvey and the Texas Economy CONTINUED FROM PAGE 8
years, and both need repairs. In 2009, the U.S. Army discourages federal legislators from devoting funds
Corps of Engineers classified both as “unsafe” and to home-state “pet” projects, has made such funding
called for more than $100 million in dam repairs and difficult to obtain. 30
maintenance, but to date the repairs have not been Yet another idea concerns repairing Houston’s
completed. 26 outdated drainage system. According to Texas
F LO O D A BAT E M E N T A&M Professor Sam Brody, a specialist in natural
hazard mitigation, the city’s drains and pipes are
Perhaps the best-known proposal for hurricane
old and inadequate, able to handle only one to
mitigation along the upper Texas coast is the “coastal
one-and-a-half inches of rain per hour. 31 The city
spine,” also known as the “Ike Dike” — a concept,
of Houston estimates 60 percent of its drainage
borrowed from the Dutch, which would involve a
infrastructure needs repairs that would cost about
line of coast barriers, levees and gates to protect
$650 million annually. 32
Galveston Bay and the Bolivar Peninsula. The Gulf
Coast Community Protection and Recovery District “G R E E N ST O R M WAT E R I N F R A ST R U C T U R E ”
has recommended the construction of a 277-mile Civil and structural engineering experts contend
line of these features at a cost of $11.6 billion. 27 Hurricane Harvey shows a need for “green storm-
The U.S. Corps of Engineers, however, must recom- water infrastructure,” also known as low-impact
mend a similar plan before Congress will fund its development. Rebuilding damaged areas with
construction; the Corps’ recommendation is expect- features such as “green” roofs covered with
ed by June 2018. 28 vegetation, permeable pavements and rain
Mike Talbott, a former executive director of the cisterns would reduce runoff and thus lower the
Harris County Flood Control District, says another chances of flooding. 33
solution is to widen some of Houston’s thousands of
miles of bayous, allowing them to carry more water NON-STRUCTURAL MEASURES
to the Gulf of Mexico. According to Talbott, this
Non-structural measures include those that do not
would cost about $25 billion. At the district’s current
involve massive changes to existing infrastructure.
funding levels, however, protecting this stretch of
coast to 100-year-flood protection levels would C I T Y/R E G I O N A L P L A N N I N G
require 400 years. 29 Governmental partnerships One contentiously debated issue affecting Houston
would be needed to fund such large-scale projects, is the city’s rapid rate of growth and development.
but the 2011 ban on Congressional earmarks, which More than 166,000 acres in the area have been
10 | G LE N N H E GA R, TEX AS COMPTROLLER OF PUBLIC ACCOUNTSpaved in the last 10 years, greatly increasing the lead to increased risk of flooding. Due to funding
flow of floodwater into bayous, reservoirs and constraints, however, FEMA can update only a limited
drainage systems. 34 number of flood plain maps each year, and many
The temporary accumulation of water after heavy researchers contend flood maps often fail to reflect
rains, as in the Addicks and Barker reservoirs, is called current conditions.
a “flood pool.” Of the 10 largest U.S. flood pools Houston provides a case in point; FEMA estimat-
accumulated after storms, six occurred since 2000. ed about 40 percent of all buildings flooded in Harris
Richard Long with the U.S. Army Corps of Engineers County were in areas considered to be “of minimal
says new growth and development, with concrete flood hazard.” Similarly, researchers at the University
replacing prairie lands, directly causes flooding in of California at Davis determined half of the flooded
previously vegetated areas. 35 City planners must land in Harris County was outside the boundaries of
take such factors into account when approving new official flood maps. As a result, many buildings and
development. homes lacked flood insurance. 36
According to the Harris County Flood Control
U P DAT E D F LO O D P L A I N M A P S
District, more than 140,000 Houston-area homes
FEMA, in cooperation with state and local officials, are in flood plains, and thousands of them should
creates Flood Insurance Rate Maps (FIRMs) for every be purchased by the city, county, state or federal
community in the U.S. These maps delineate special governments to remove them from future floods. 37
flood hazard areas — those judged to have a 1 percent Updated flood plain maps may require thousands
chance of flooding in any year, sometimes called more homes to be removed in this way.
the 100-year flood plain — and “risk premium zones,”
areas in which insurance companies may charge F LO O D I N S U R A N C E P O L I C I E S
higher premiums due to an increased risk of flooding. The federal National Flood Insurance Program,
Depending on the classification of the zone, these established in 1968, subsidizes flood insurance on
premiums may be considerably higher than in homes in special flood hazard areas, which may
nearby areas. encourage developers to build more homes in flood
It typically takes three to five years to complete plains. The program has outgrown its scope,
the study for a FIRM, which form the basis for however, and is currently $24 billion in debt. 38
National Flood Insurance Program (NFIP) regulations Scaling back the subsidies offered through NFIP
(see next section) and the insurance requirements would make the cost of insurance prohibitive for
that accompany mortgages. FEMA periodically some homeowners and deter them from buying
revises these maps to reflect population growth homes in flood-prone areas. 39 FN
and development or changing conditions that may
FISCAL NOTES — SPECIAL EDITION | 11APPENDIX 1: Major Hurricanes in Texas and the U.S.: A Historical Perspective
In a typical year, about 100 storms and tropical disturbances EXHIBIT 5
develop in the Atlantic Ocean, Caribbean Sea and Gulf of Mexico. MAJOR HURRICANES AFFECTING TEXAS SINCE 1957*
Some of these turn into tropical storms, and on average, two each
year become hurricanes that make landfall in the U.S.40 Between STORM NAME YEAR CATEGORY AT LANDFALL
1851 and 2016, 289 hurricanes affected the continental U.S. Of Audrey 1957 4
these, 63 made landfall in Texas.41 Carla 1961 4
Hurricane season runs from June 1 to Nov. 30, with most Beulah 1967 3
storms making landfall during August and September.42 In Texas, Celia 1970 3
Allen 1980 3
these storms make landfall on the Gulf Coast, generally moving
Alicia 1983 3
north or northeast through the state.
Bret 1999 3
MAJOR TEXAS HURRICANES Rita 2005 3
Harvey 2017 4
The Galveston hurricane of 1900, a Category 4 storm, was the
*Category 3 or higher
deadliest natural disaster in U.S. history, bringing a 15-foot storm Source: National Oceanic and Atmospheric Administration
surge and winds of more than 135 mph. The hurricane killed
between 6,000 and 12,000 and brought damages totaling about EXHIBIT 6
$881 million in 2017 dollars.43
Since then, Texas has been affected by 20 more major TOP 15 COSTLIEST STORMS IN THE U.S. SINCE 1980
hurricanes (classified as Category 3 or higher).44 Exhibit 5 lists CATEGORY AT DAMAGE*
STORM NAME LANDFALL YEAR (BILLIONS)
major hurricanes that have made landfall in Texas since the early
Katrina 3 2005 $161.3
1950s, when the U.S. National Hurricane Center began naming
Harvey 4 2017 125.0
each storm.
Maria 4 2017 90.0
COSTLIEST U.S. STORMS Sandy Tropical Storm 2012 70.9
Irma 4 2017 50.0
Of course, hurricanes and other major storms affect the entire
Andrew 5 1992 48.3
country, not just the Gulf Coast. Exhibit 6 lists the most destruc- Ike 2 2008 35.1
tive storms affecting the U.S. in the last half-century. Ivan 3 2004 27.3
Hurricane Katrina, which caused $161.3 billion in damages, Wilma 3 2005 24.5
still ranks as the costliest storm in American history; Hurricane Rita 3 2005 23.9
Harvey is expected to rank second, with total estimated damages Charley 4 2004 21.3
of about $125 billion.45 Hugo 4 1989 18.4
Irene 1 2011 15.1
Frances 2 2004 13.0
Allison Tropical Storm 2001 12.0
*Dollar amounts represent the 2017 Consumer Price Index cost-adjusted value.
Source: National Oceanic and Atmospheric Administration
12 | G LE N N H E GA R, TEX AS COMPTROLLER OF PUBLIC ACCOUNTSAPPENDIX 2: Detailed Methodology of Net Economic Impact Analysis
Economists use various modeling techniques PRODUCTIVITY LOSS GAINS FROM REBUILDING
to estimate the effect of economic trends and The productivity-loss component of the Following economic shocks, institutions
government policy options over time. For this estimate assumes business days lost due to the begin to respond to the community’s needs,
report, the Comptroller’s office developed an storm, whether from power outages, damaged both immediate and ongoing. Gains from the
approach to analyze the cost of a disruptive structures or temporary labor shortages, rebuilding component of the estimate account
event on the Texas economy as well as the result in lower output (a “time discount”). The for increases in spending from government,
subsequent economic activity generated as a estimate assumes most industries were offline businesses and nonprofits on timely disaster
result of the shock. Our economic impact or experienced reduced revenue for one week, relief, shelter and food for displaced people,
analysis thus estimates the net effect of from landfall on Friday, Aug. 25, followed debris removal, medical attention and
Hurricane Harvey on the Texas economy. by five days of rain and subsequent dam reconstruction.
To estimate the cost of the storm on overflows in Houston until it dissipated For this estimate, current and expected
Texas, productivity loss is approximated by in Louisiana on Aug. 30.48 Industries are expenditures were collected — via either news
discounting the expected economic fore- discounted differently depending on the sources or self-reporting — from federal and
cast for three years by the amount of time amount of time they were estimated to be state agencies as well as private insurance
businesses were closed or out of production, offline, their level of competition and their companies and large nonprofits; these are non-
varying in length by industry. place in the supply chain: exhaustive. Each organization’s expenditures
To estimate the gain from rebuilding, · manufacturing and mining were assumed are categorized by expected use over a three-
reported and anticipated expenditures are to be offline or experiencing reduced year period, divided 40/20/20, and assuming
introduced that offset the negative effects of revenue for 15.4 days.49 the remaining 20 percent will be spent in
production loss. · hospitals were assumed to be offline future years beyond the three-year scope of
The forecast employs a 70-sector, 24 or experiencing reduced revenue for this analysis.
Council of Government (COG) region version four days. 50 Funds flowing from and through state
of Regional Economic Models Inc. (REMI) Policy · f irm-level competition is assumed for agencies are allocated by individual industry
Insight+ for Texas, Version 2.0, an economic all industries except those with a high and weighted by output in construction,
software application that generates realistic location quotient (LQ > 4) such as oil and housing, health care and social services. 53
annual estimates of the total regional effects gas extraction, which are considered The estimate weights funds categorized as
of policy or other market changes, based on exogenous. 51 government administration or equipment
an approach that combines and builds on · retail and wholesale trade are further by population. It excludes agency expenditures
input-output, general equilibrium, computable discounted to account only for the reallocated from a similar use, such as
econometric and economic geography markup of cost of goods sold, to avoid medical costs expected to be covered by
modeling techniques. The software calculates double-counting. 52 Medicaid funds.
differences between the baseline (a regional · accommodation is assumed to be Funds from the National Flood Insurance
control forecast) and the shock forecast.46 unaffected by productivity losses as the Program, 54 Small Business Administration (SBA)
The COG regions affected by the storm decrease in tourism from the storm could loans, 55 private insurance companies56 and
are assumed to be those containing counties be counterbalanced by the increase in hotel nonprofits57 are allocated by individual
that received FEMA assistance due to the occupancy by evacuees. industry in the proportion by which funds were
storm.47 All counties in the Houston-Galveston, The standard regional control is reduced by released for SBA loans following Superstorm
South East Texas and Golden Crescent COGs a percentage of sales derived from a combina- Sandy: roughly 64 percent on construction
were affected by the storm. The Brazos Valley, tion of the time discount and population for real estate damages, weighted by output;
Coastal Bend, Deep East Texas, Alamo Area and discount. The results show the reduction in 10 percent on equipment for business content,
Capital Area COGs were only partly affected GSP due to this reduction in output. weighted by population; and 26 percent
and were discounted by the share of popula- A similar reduction in labor productivity on relevant consumer spending for home
tion in the affected counties in each COG to was considered; however, it is assumed the content (such as motor vehicles, furnishings,
the total population of each (a “population negative effects on wages in August would housewares and health services), weighted by
discount”). The estimate assumes all of the be counterbalanced by increases in the consumer spending. 58
businesses in affected counties were affected. fourth quarter. It is also assumed that salaried
The estimate’s timeframe is the LIMITATIONS
employees were largely unaffected by the
initial shock year and two forecast years. storm and would either telework or make up This estimate is intended to depict Texas’
Determining the cost share among federal, lost time in September, while non-salaried economy as a whole and the net effects of
state and local governments is ongoing, even employees would experience a dip in produc- Hurricane Harvey based on currently available
as more costs are being recorded. Because tivity and income in August but would have data. Figures for government spending may
we do not yet know who will ultimately bear more work opportunities and higher wages in change as agencies report expenditures and
the burden of some Harvey-related costs, the the recovery months following the storm. more people submit claims. 59 It is a projection,
scope of this analysis is limited to a relatively Because the model treats labor productiv- and does not account for:
short time period. ity differently based on regional and industry · damage to commercial, government or
The estimate uses nominal dollars variation, the effects of the storm on labor personal property, including real estate,
(unadjusted for inflation). productivity could have counterintuitive contents, equipment, vehicles, inventory,
effects; nevertheless, change in labor produc- etc. Instead, it accounts for the funds likely
tivity is left outside the scope of this estimate. CONTINUED ON PAGE 14
FISCAL NOTES — SPECIAL EDITION | 13APPENDIX 2: CONTINUED FROM PAGE 13 ENDNOTES
Detailed Methodology of Net
1
National Oceanic and Atmospheric Administration, 17
Alana Semuels, “How a Disaster’s Economic Impacts
National Weather Service, “Hurricane Harvey & Its Impacts Are Calculated: Providing an Early Estimate of a Storm’s
on Southeast Texas,” https://www.weather.gov/hgx/ Costs is Generally a Pretty Rough Science, and Harvey is
Economic Impact Analysis hurricaneharvey; and National Oceanic and Atmospheric
Administration, National Weather Service, “Hurricane
Harvey 2017 – Impacts to South Central Texas,” https://
a Particularly Tough Case,” The Atlantic (August 29, 2017),
https://www.theatlantic.com/business/archive/2017/08/
harvey-economic-impacts/538353/.
www.weather.gov/ewx/wxevent-2017harvey. 18
Federal Reserve Bank of Dallas, “Texas Manufacturing
be spent in the next three years to rebuild Outlook Survey,” https://www.dallasfed.org/research/
2
National Oceanic and Atmospheric Administration,
and replace these items. “Reviewing Hurricane Harvey’s Catastrophic Rain and surveys/tmos.aspx.
· expenditures from smaller nonprofit Flooding,” September 18, 2017, https://www.climate.gov/ 19
Federal Reserve Bank of Dallas, “Texas Businesses Feel
news-features/event-tracker/reviewing-hurricane-har- Impact of Hurricane Harvey on Revenue, Production,”
organizations. veys-catastrophic-rain-and-flooding. September 25, 2017, https://www.dallasfed.org/news/
· change in tax burden on Texans at the local 3
Texas Division of Emergency Management, Disaster releases/2017/nr170925.aspx.
and state levels due to increased costs from Summary Outline spreadsheets for November 28, 2017 20
Calculated using REMI, reducing capital stock by report-
Harvey recovery or state budgetary actions and November 29, 2017, available at https://www.dps. ed residential and non-residential losses and comparing
texas.gov/dem/sitrep/default.aspx. standard regional control projection, leaving optimal
that may be taken.
4
Texas Department of Motor Vehicles, “TxDMV Informs capital stock unchanged.
· change in government services provided Owners of Flood-Damaged Vehicles of Duty to Brand 21
U.S. Bureau of Economic Analysis statistics on GDP by
due to resource reallocation. Their Title,” October 23, 2017, http://www.txdmv.gov/ state, current dollars, all industries, for Texas, available
· income to insurance companies from txdmv-media; and Business Insider, “The Auto Industry May at https://www.bea.gov/itable/iTable.cfm?ReqID=70&-
Take Longer Than Expected to Recover After Hurricane step=1#reqid=70&step=1&isuri=1&7003=900&7004=naics
deductibles or potential changes in Harvey,“ December 16, 2017, http://www.businessinsider. &7035=-1&7005=-1&7006=48000&7001=1900&7036=-1&7
insurance premiums. com/auto-industry-demand-after-harvey-2017-12?utm_ 002=1&7090=70&7007=2016&7093=levels.
· productivity loss and gains from agricultural source=feedburner&utm_medium=referral. 22
The overall gain is measured in GSP years and calculated
insurance; this study focused on the nonfarm
5
Texas A&M AgriLife Extension Service, “Texas Agricul- by taking the sum of the difference in GSP between the
tural Losses from Hurricane Harvey Estimated at More standard regional control and the forecast for each year
portion of the economy. The REMI model Than $200 Million,” October 27, 2017, https://today.agrilife. of the analysis.
does not include an agriculture sector. org/2017/10/27/texas-agricultural-losses-hurricane-har- 23
Federal Reserve Bank of Dallas, “Texas Economy
vey-estimated-200-million/.
· non-pecuniary losses due to fatalities or Finishes the Year Firing on All Cylinders,” December
6
National Oceanic and Atmospheric Administration, 20, 2017. https://www.dallasfed.org/research/update/
decreased desirability of living in an area. reg/2017/1708.aspx
“U.S. Billion-Dollar Weather and Climate Disasters,” 2017,
The estimate assumes people who do https://www.ncdc.noaa.gov/billions/; and Kevin Quealy, 24
Harris County, All Hazard Mitigation Plan, Section 1, p. 1,
not receive a buyout will rebuild — “The Cost of Hurricane Harvey: Only One Recent Storm http://mitigationguide.org/wp-content/uploads/2013/05/
Comes Close,” The New York Times (September 1, 2017), TXHarris.pdf.
especially property owners along the coast https://www.nytimes.com/interactive/2017/09/01/upshot/
in hurricane-prone areas, who are likely to
25
Ella Nilsen, “The National Flood Insurance Program
cost-of-hurricane-harvey-only-one-storm-comes-close.
was Already $24 Billion in Debt before Harvey and
understand the risk of property ownership in html.
Irma,” Vox (September 11, 2017), https://www.vox.
their location. 7
National Oceanic and Atmospheric Administration, com/2017/8/26/16208230/hurricane-harvey-flood-
“U.S. Billion-Dollar Weather and Climate Disasters.” damage.
· the long-term costs of flooding, including 8
National Oceanic and Atmospheric Administration, 26
Neena Satija and Kiah Collier, “Documents Detail
buyout programs, new reservoirs, bayou “Hurricanes in History,” http://www.nhc.noaa.gov/out- Concerns about Houston Dams — Before Harvey,” Texas
dredging or seawall construction. These reach/history/#allison; and “U.S. Billion-Dollar Weather Tribune (September 28, 2017), https://www.texastribune.
flood mitigation efforts will cost billions and Climate Disasters.” org/2017/09/28/could-houstons-dams-have-failed-
during-harvey/.
of dollars over a number of years and are 9
U.S. National Weather Service, National Hurricane Cen-
ter, Tropical Cyclone Report, Hurricane Katrina, 23-30 August 27
Gulf Coast Community Protection and Recovery Dis-
beyond the scope of this study. 2005, by Richard D. Knabb et al, Updated September 14, trict, Storm Surge Suppression Study Phase 3 Report: Recom-
The model available divides Texas into 2011, p. 11, http://www.nhc.noaa.gov/data/tcr/AL122005_ mended Actions (Austin, Texas: General Land Office, June
COG regions and depicts dynamic relationships Katrina.pdf. 21, 2016), p. 6, http://www.gccprd.com/pdfs/GCCPRD%20
Phase%203%20Report%20-%20Recommended%20Ac-
between industries and market forces; future
10
National Oceanic and Atmospheric Administration, “U.S.
tions.pdf.
Billion-Dollar Weather and Climate Disasters.”
studies may benefit from a more granular 28
Harvey Rice, “George P. Bush Emerges as Ike Dike Cham-
11
National Oceanic and Atmospheric Administration,
model to show county-level damage to housing “Hurricanes in History.”
pion,” Houston Chronicle (March 20, 2017), http://www.
houstonchronicle.com/news/houston-texas/houston/
stock, which would eliminate the need for the 12
National Oceanic and Atmospheric Administration, “U.S. article/George-P-Bush-emerges-as-Ike-Dike-champi-
population discount. Billion-Dollar Weather & Climate Disasters, 1980-2017,” on-11015304.php?t=e68a6954bf438d9cbb&cmpid=e-
This estimate intends to depict the order by Adam Smith et al, p. 8, https://www.ncdc.noaa.gov/ mail-premium.
billions/events.pdf; and “Hurricanes in History.” 29
Neena Satija, Kiah Collier and Al Shaw, “Boomtown,
of magnitude of the net effects of Hurricane 13
National Oceanic and Atmospheric Administration, “U.S. Flood Town,” Texas Tribune (December 7, 2016), https://
Harvey on the Texas economy as a whole. The Billion-Dollar Weather & Climate Disasters 1980-2017,” p. 7; www.texastribune.org/boomtown-floodtown/.
economic losses and gains may not be known in and “Hurricanes in History.” 30
Dylan Baddour, “How to Fix the Houston Floods,” Hous-
their entirety, but our approach aims to provide 14
National Hurricane Center, Tropical Cyclone Report: ton Chronicle (January 3, 2017), http://www.houstonchron-
Hurricane Sandy, 22 – 29 October 2012, by Eric S. Blake et al icle.com/news/houston-texas/houston/article/How-to-fix-
a high-level perspective of the possible damage the-Houston-floods-10826834.php.
(February 2013), pp. 13 and 82, http://www.nhc.noaa.gov/
by a severe weather event such as Harvey as data/tcr/AL182012_Sandy.pdf. 31
David Schaper, “3 Reasons Houston was a ‘Sitting Duck’
well as the strength of the Texas economy to 15
National Hurricane Center, Tropical Cyclone Report: for Harvey Flooding,” National Public Radio, http://www.
withstand such events. Individual Texans and Hurricane Sandy, 22 – 29 October 2012, p. 17. npr.org/2017/08/31/547575113/three-reasons-houston-
was-a-sitting-duck-for-harvey-flooding.
communities may continue to bear a heavy 16
National Oceanic and Atmospheric Administration, “U.S.
Billion-Dollar Weather & Climate Disasters,” p. 4.
32
Neena Satija and Kiah Collier, “Houston’s ‘Flood Czar’
burden rebuilding their lives in the wake of Says Harvey Has Brought the City to a Decision Point on
the storm, but the assistance provided by Flood Control,” Texas Tribune (September 13, 2017), https://
government, business and nonprofit resources www.texastribune.org/2017/09/13/follow-conversa-
tion-houstons-flood-czar/.
and the diversity of Texas’ economy protect the 33
“Hurricane Harvey Shows Need to Use More Green
state from the level of devastation experienced Infrastructure,” Civil + Structural Engineer (September
by smaller, less robust economies after an 21, 2017), https://csengineermag.com/hurricane-har-
vey-shows-need-use-green-infrastructure/.
economic shock.
CONTINUED ON PAGE 15
14 | G LE N N H E GA R, TEX AS COMPTROLLER OF PUBLIC ACCOUNTSENDNOTES CONTINUED FROM PAGE 14
34
Natasha Geiling, “Harvey is an Unprecedented Disaster 49
Federal Reserve Bank of Dallas, “Texas Manufacturing 59
For example, on Nov. 17, 2017, the U.S. Department of
Made Worse by Poor Planning,” Think Progress (August Outlook Survey,” September 25, 2017, https://www. Housing and Urban Development announced it would
28, 2017), https://thinkprogress.org/hurricane-harvey-cli- dallasfed.org/research/surveys/tmos/2017/1709/specquest. award $5.024 billion in community development block
mate-politics-bc26ca7afa9f/. aspx. The average number of days businesses were either grants for hard-hit areas in Texas; the expenditure timeline
35
Neena Satija, Kiah Collier and Al Shaw, “Boomtown, completely shut down or experienced a reduction in was unknown at the time of publication, however, and
Flood Town.” revenue/production is 15.4. Because 59 percent of firms therefore is not included in this study. See “HUD Provides
that experienced a reduction in revenue or production $5 Billion To Help Texas Recover From Harvey,” Office of the
36
Ford Fessenden, Robert Gebeloff, Mary Williams Walsh reported ongoing reductions, it is assumed that Texas Governor, November 17, 2017, https://gov.texas.gov/
and Troy Griggs, “Water Damage From Hurricane Harvey productivity losses continuing beyond the date of the news/post/hud-provides-5-billion-to-help-texas-recover-
Extended Far Beyond Flood Zones,” New York Times survey are counterbalanced by the 41 percent of firms that from-hurricane-harvey.
(September 1, 2017), https://www.nytimes.com/interac- did not experience reduced revenue/production.
tive/2017/09/01/us/houston-damaged-buildings-in-fema-
flood-zones.html?mcubz=0.
50
Andrea Hsu and Becky Sullivan, “In Houston, Most
Hospitals ‘Up And Fully Functional,’” All Things Considered,
37
Neena Satija, Kiah Collier and Al Shaw, “Boomtown, National Public Radio (August 30, 2017), http://www.npr.
Flood Town.” org/sections/health-shots/2017/08/30/547327581/in-
38
Ella Nilsen, “The National Flood Insurance Program Was houston-most-hospitals-up-and-fully-functional. Although
Already $24 Billion in Debt Before Harvey and Irma.” some hospitals were evacuated, many remained operation-
al or entered “ride-out” mode in which outpatient services
39
Benjamin Powell and Phil Magness, “Here’s the Best Way
were postposed while inpatient services continued; only
to Limit the Risk of ‘Widespread’ Hurricane Damage,” CNBC
four days are assumed for disruption in service.
(September 11, 2017), https://www.cnbc.com/2017/09/11/
we-cant-stop-hurricanes-heres-how-to-limit-the-damage- 51
Industries are assumed to compete locally because
commentary.html. goods and services could be obtained from neighboring
counties that were not affected by the storm; this is thus
40
National Weather Service, The Deadliest, Costliest, and
a more conservative estimate. Some industries, however,
Most Intense United States Tropical Cyclones from 1851 to 2010
were disproportionately affected because of the high num-
(Miami, Florida, August 2011), p. 15, http://www.nhc.noaa.
ber of businesses located in Texas relative to the nation.
gov/pdf/nws-nhc-6.pdf.
These categories in the North American Industry Classifi-
41
National Oceanic and Atmospheric Administration, cation System with a high location quotient, a measure of
“Continental United States Hurricane Impacts/Landfalls industrial concentration, are treated differently: 211 Oil
1851-2016,” http://www.aoml.noaa.gov/hrd/hurdat/ and Gas Extraction, 213 Support Activities for Mining and
All_U.S._Hurricanes.html. 486 Pipeline Transportation had an LQ > 4 for Texas and
42
National Oceanic and Atmospheric Administration, were considered industry-level (exogenous) production.
“Tropical Cyclone Climatology,” http://www.nhc.noaa.gov/ 52
A discount rate of .277 was applied to 42 Wholesale
climo/#cp100. Trade and 44-45 Retail Trade as prescribed by experts at
43
National Oceanic and Atmospheric Administration, “The REMI, Inc.
Galveston Hurricane of 1900: Remembering the Deadliest 53
The amount of funds flowing through the state of Texas
Natural Disaster in American History,” https://oceanser- are being updated as new costs are incurred and new infor-
vice.noaa.gov/news/features/sep13/galveston.html; and mation is received. The figures presented were determined
National Weather Service, Texas Hurricane History, by David by the best data available as of Nov. 30, 2017.
Roth (Camp Springs, Maryland, January 2010), p. 31, http:// 54
David Hunn, “FEMA on Track to Pay $11 Billion in
www.wpc.ncep.noaa.gov/research/txhur.pdf.
Hurricane Harvey Insurance Claims,” Houston Chronicle
44
National Oceanic and Atmospheric Administration, (September 13, 2017), http://www.houstonchronicle.com/
“Continental United States Hurricane Impacts/Landfalls business/article/FEMA-on-track-to-pay-11-billion-in-Hurri-
1851-2016.” cane-12196002.php.
45
National Oceanic and Atmospheric Administration, “U.S. 55
“SBA Has Approved $1B-Plus in Harvey-related Disaster
Billion-Dollar Weather and Climate Disasters.” Loans,” Houston Chronicle (October 11, 2017), http://www.
46
Productivity loss was calculated with a percent decrease chron.com/business/article/SBA-has-approved-1B-plus-in-
while rebuilding gains were calculated with dollar amounts Harvey-related-12271216.php.
available at the time of the study. 56
“ICT Pegs Hurricane Harvey Insured Losses at $19B,”
47
Federal Emergency Management Agency, “Texas Hurri- Insurance Journal (September 15, 2017), https://www.insur-
cane Harvey (DR-4332),” December 4, 2017, https://www. ancejournal.com/news/southcentral/2017/09/15/464484.
fema.gov/disaster/4332. Forty-one counties were declared htm.
disaster areas: Aransas, Austin, Bastrop, Bee, Brazoria, 57
Morgan Smith, “How Much Has Been Raised for Harvey
Caldwell, Calhoun, Chambers, Colorado, DeWitt, Fayette, Relief — and How’s It Being Spent?” Texas Tribune (October
Fort Bend, Galveston, Goliad, Gonzales, Grimes, Hardin, 6, 2017), https://www.texastribune.org/2017/10/06/how-
Harris, Jackson, Jasper, Jefferson, Karnes, Kleberg, Lavaca, much-money-has-been-raised-harvey-relief-and-how-it-
Lee, Liberty, Matagorda, Montgomery, Newton, Nueces, being-spent/.
Orange, Polk, Refugio, Sabine, San Jacinto, San Patricio, 58
Construction is spread by individual industry and
Tyler, Victoria, Walker, Waller and Wharton.
output. Equipment is spread by population. Consumer
48
Texas Department of Public Safety, Texas Division spending is spread by commodity and consumption across
of Emergency Management, “State Situation Report, these categories: new motor vehicles, net purchase of used
Tropical System Harvey,” Report Number 3, August 25, motor vehicles, motor vehicle parts and accessories, fur-
2017, and Report Number 8, August 30, 2017, https:// niture and furnishings, household appliances, glassware,
www.dps.texas.gov/dem/sitrep/default.aspx; and “Harvey tableware and household utensils, tools and equipment for
Timeline: See How the Storm Developed and Marched house and garden, food and nonalcoholic beverages pur-
Across Texas and Louisiana,” Corpus Christi Caller-Times chased for off-premises consumption, alcoholic beverages
(September 7, 2017), http://www.caller.com/story/weather/ purchased for off-premises consumption, food produced
hurricanes/2017/09/02/harvey-timeline-see-how-storm- and consumed on farms, men and boys’ clothing, women
developed-and-marched-across-texas-and-louisi- and girls’ clothing, children and infants’ clothing, other
ana/625563001/. clothing materials and footwear, motor fuels, lubricants
and fluids, fuel oil and other fuels, pharmaceutical and
other medical products, household supplies, personal care
products, rental of tenant-occupied nonfarm housing,
group housing, physician services, dental services, para-
medical services, hospitals, nursing homes, other motor ve-
hicle services, purchased meals and beverages, accommo-
dations, personal care and clothing services, social services
and religious activities and household maintenance.
FISCAL NOTES — SPECIAL EDITION | 15You can also read