Halifax Tourism and COVID-19: Scenario-Planning Exercises for Summer 2021 - Discussion Paper September 2020 - Dalhousie University ...
←
→
Page content transcription
If your browser does not render page correctly, please read the page content below
Halifax Tourism and COVID-19:
Scenario-Planning Exercises for Summer 2021

                Discussion Paper

                 September 2020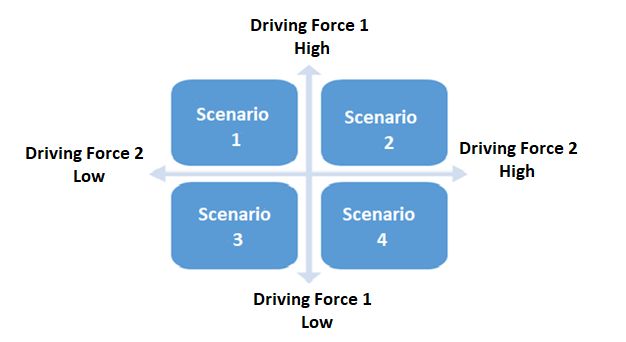
HALIFAX TOURISM AND COVID-19: SCENARIO-PLANNING EXERCISES
FOR SUMMER 2021

Discussion Paper

September 2020

AUTHORS
Kevin Quigley
Kevin Quigley is the Scholarly Director of the MacEachen Institute for Public Policy and Governance
and a professor in the School of Public Administration at Dalhousie University. He is the co-author of
the book Too Critical to Fail: How Canada Manages Threats to Critical Infrastructure, which was
shortlisted for the Donner Prize in 2018.

Brianna Wolfe
Brianna Wolfe is a Research Assistant at the MacEachen Institute for Public Policy and Governance at
Dalhousie University.

PROJECT TITLE
Halifax Tourism and COVID-19: Scenario-Planning Exercises for Summer 2021

ACKNOWLEDGEMENTS
This project is a collaboration between Discover Halifax and the MacEachen Institute for Public Policy
and Governance at Dalhousie University.

This project was made possible by financial contributions from the Change Lab Action Research
Initiative (CLARI).

https://actionresearch.ca/

                                                                                                 2
Table of Contents
Executive Summary ...................................................................................................................................... 5
PART A
1. Introduction ............................................................................................................................................... 8
2. Risk Governance ....................................................................................................................................... 8
2.1. What is risk governance? ................................................................................................................... 8
2.2. What is an uncertain risk? ................................................................................................................. 9
3. Scenario Planning ................................................................................................................................... 10
3.1. What is scenario planning and when do you do it? ......................................................................... 10
3.2. Scenario-planning design ................................................................................................................ 11
4. Selected Comments on COVID-19 in the Atlantic Region .................................................................... 13
5. Overview of Halifax tourism .................................................................................................................. 17
5.1. Snapshot of Halifax tourism............................................................................................................. 17
5.2. Impacts of COVID-19 on Halifax tourism ....................................................................................... 20
5.3 Polling data: Selected observations .................................................................................................. 23
5.4. Halifax Tourism’s response to COVID-19....................................................................................... 24
PART B
6. Project Description.................................................................................................................................. 25
6.1. Purpose ............................................................................................................................................ 25
6.2. Goals ................................................................................................................................................ 25
6.3. Deliverables ..................................................................................................................................... 25
6.4. Session structure .............................................................................................................................. 25
7. Scenario-Planning Variables ................................................................................................................... 26
7.1. Timeline............................................................................................................................................ 26
7.2. Sample variables .............................................................................................................................. 26
7.3. Chatham House Rule ....................................................................................................................... 27
7.4. Facilitated discussion on critical drivers in Halifax tourism .......................................................... 27
7.5. Selected variables ............................................................................................................................ 28
8. Discussion of Four Scenarios.................................................................................................................. 30
8.1. Scenario descriptions ....................................................................................................................... 30
8.2. How do we respond to these scenarios? .......................................................................................... 35
9. Discussion ............................................................................................................................................... 37
9.1. Method ............................................................................................................................................. 37
9.2. Observations about the four scenarios ............................................................................................ 38
9.3. Comments on session discussions .................................................................................................... 39
10. Conclusion ............................................................................................................................................ 40
11. Appendix ............................................................................................................................................... 41
Appendix A: Information about the MacEachen Institute....................................................................... 41
12. References ............................................................................................................................................. 43
13. Further Reading .................................................................................................................................... 45
3Table of Figures
Figure 1: Four Plausible Scenarios for Halifax ............................................................................................. 6
Figure 2: 2 x 2 Matrix ................................................................................................................................. 12
Figure 3: 2 x 2 Matrix Example .................................................................................................................. 12
Figure 4: Total Confirmed Cases of COVID-19 Reported Across Canada as of March 31, 2020 ............. 14
Figure 5: Total Confirmed Cases of COVID-19 Reported Across Canada as of June 1, 2020 .................. 15
Figure 6: Total Confirmed Cases of COVID-19 Reported Across Canada as of July 29, 2020 ................ 15
Figure 7: Active Cases of COVID-19 in Nova Scotia ................................................................................ 16
Figure 8: Active Cases of COVID-19 in Ontario ....................................................................................... 16
Figure 9: Total Number of Visitors by Trip Purpose .................................................................................. 17
Figure 10: Number of Cruise Ships Visiting Halifax.................................................................................. 18
Figure 11: Number of Cruise Passengers Visiting Halifax ......................................................................... 18
Figure 12: Total Visitor Spending .............................................................................................................. 19
Figure 13: Visitor Origin ............................................................................................................................ 19
Figure 14: Mode of Transportation ............................................................................................................. 20
Figure 15: Nova Scotia Unemployment Rate, June 2019 vs June 2020 ..................................................... 21
Figure 16: March 2020 Hotel Room Bookings ........................................................................................... 22
Figure 17: Average Number of Hotel Rooms Occupied Jan 2019–June 2019 vs Jan 2020–June 2020 ..... 22
Figure 18: Percentage of People Who Feel Comfortable Engaging in Activities ....................................... 23
Figure 19: Impact/Uncertainty Visual......................................................................................................... 29
Figure 20: 2 x 2 Matrix with Selected Variables ....................................................................................... 30
Figure 21: 2 x 2 Matrix with Named Scenarios .......................................................................................... 31
4Executive Summary
Project Description
This project was devised jointly by Discover Halifax and the MacEachen Institute for Public
Policy and Governance and sponsored by the Change Lab Action Research Initiative (CLARI).
We aimed to create and support a conversation with the Halifax tourism sector and related
stakeholders about the impacts of COVID-19 on tourism and how to foster appropriate responses
that contribute to the health and economic well-being of our community in the medium and long
term, with a focus on summer 2021. The challenges the sector is facing are considerable, and we
recognize that this is only one exercise of many that the sector is undertaking.
Context
Tourism is an important sector for both Halifax and the province. The tourism sector in Halifax
employs more than 34,000 people and generates over $1.3 billion in direct spending each year.
While Nova Scotia has fared better than many parts of the country in containing the spread of
COVID-19, Halifax tourism has been hit hard: unemployment rates are high and many
businesses are struggling. Travel restrictions and border closures will continue to affect Halifax
tourism for the foreseeable future; the Atlantic Bubble introduced in July underscores that
Atlantic Canada is the key market for the sector to target in the short-term.
Method
We hosted and facilitated two three-hour scenario-planning sessions with tourism sector
stakeholders at the Westin Nova Scotian. The first session, August 7, 2020, provided participants
with an introduction to scenario planning and involved a group discussion of key variables that
drive the tourism sector. The second session, August 14, 2020, included a group discussion about
four plausible futures and strategic interventions for addressing these futures. Session
participants were chosen and invited for their knowledge of, responsibility for, and interest in
tourism and the COVID-19 pandemic. Both sessions followed public health guidelines for in-
person meetings.
Halifax Tourism Drivers
The scenario literature characterizes drivers as concepts that are largely outside an organization's
control but significantly impact the organization. Following the discussion at the first session, we
identified two drivers that demonstrated high levels of impact and uncertainty: market confidence
in travel and capacity to host. Market confidence in travel is largely a demand concept and refers
to the public’s confidence and interest in travelling and ability to do so (e.g., level of demand for
air travel and hotel rooms). Capacity to host is largely a supply concept, which refers to Halifax’s
ability to host visitors (e.g., border restrictions, the social distancing measures in place and their
impact on restaurants and bars). We plotted these variables on a 2 x 2 matrix to identify four
plausible futures for the Halifax tourism sector (see figure below). After providing an overview
of each scenario, we asked participants to answer the following questions:
• What does the scenario look like and how would we get to this scenario?
• What are the underlying causes of this scenario?
• What are the potential critical failures in this scenario?
• What are the opportunities that present themselves in this scenario?
5Figure 1: Four Plausible Scenarios for Halifax. Market confidence in travel and the capacity to host is
high/unconstrained in the “happy days” scenario, while market confidence in travel and the capacity to
host is low/constrained in the “ghost town” scenario. For more information on these scenarios, please see
pages 30-36.
As the figure above illustrates: scenario 1 is “happy days,” which refers to a return to the supply
and demand level prior to the pandemic; scenario 2, “suspicious minds,” refers to Halifax having
the capacity to host tourists but people are still too uneasy to travel; scenario 3, “ghost town,”
refers to a situation that is very much like the circumstances we faced between April and June
this year, in which many places were closed and most people stayed home; and scenario 4, “all
dressed up, nowhere to go,” refers to a situation in which people are ready to travel again but
rules, regulations, and processes are making it difficult for them to do so.
Strategic Responses
We identified some early strategic responses the sector could adopt in these highly fluid and
uncertain circumstances in order to better prepare for next year.
As for many sectors, the tourism sector needs to continue to adapt in light of COVID-19, learn
how to manage risks, including those associated with government regulation and public attitudes,
and leverage the opportunities presented by the different futures. An effective risk management
plan depends on having access to reliable information, developing and enforcing high standards
and motivating appropriate behaviours in the sector, all in a timely and transparent manner.
6Typical of many tourism sectors, the Halifax tourism sector is comprised of mainly small- and
medium-sized enterprises (SMEs), working in a competitive context, which can make it difficult
to coordinate across the sector and represent a unified position on issues. At the same time, those
in the sector have shared aspirations for a healthy and prosperous community and a thriving
tourism sector, which can be achieved more effectively in the current circumstances by better
coordination across the sector. To respond to the scenarios described above, the sector needs to
create a strategy for improving sector coordination. This strategy would require tourism
industries to meet more frequently and work to establish a method for engaging with other key
stakeholders, such as the government and public health agencies. A more collaborative approach
would also provide the sector with the opportunity to make positive changes aimed at placing the
sector in a stronger position going forward. New partnerships, technological advances,
expanding the tourism season and infrastructure development were cited as opportunities that the
sector and key stakeholders can pursue to help in the sector’s recovery.
Stronger alignment across the sector can also help the sector maintain high standards of public
health and market itself accordingly; in so doing, it can help to allay public concerns from Nova
Scotians and tourists from markets who visit Nova Scotia that the province is a safe place to
visit.
Structure of the Report
The report is organized in two parts. The first part reviews key concepts from the risk
governance and scenario planning literature and provides an overview of the importance of the
tourism sector to Halifax and the impact COVID-19 has had on the sector. The second part of the
report summarizes the goals, process, and outcomes of the scenario-planning sessions that we
undertook with key stakeholders from the Halifax tourism sector in August 2020.
Conclusion
The Halifax tourism sector has endured many challenges throughout the COVID-19 pandemic.
Despite these challenges, industries in the tourism sector have shown adaptive capacity, along
with a commitment to learn from this unprecedented situation. Looking ahead to summer 2021,
the tourism sector could face vastly different futures, with attendant opportunities and risks.
Scenario planning is one tool the tourism sector can use to identify, plan, and strategize for these
futures and manage uncertainty.
71. Introduction
The COVID-19 pandemic has impacted industries across the Canadian economy, including those
involved in the tourism sector. Tourism is an important sector for Halifax, employing more than
34,000 people and generating over $1.3 billion in direct spending each year. While Nova Scotia
has fared better than many parts of the country in containing the spread of COVID-19, Halifax
tourism has been hit hard: unemployment rates are high and many businesses are struggling.
Travel restrictions and border closures will continue to affect Halifax tourism for the foreseeable
future. As a result, the tourism sector needs to employ a collective and strategic approach to
these new circumstances.
In response to COVID-19’s impact on Halifax tourism, the MacEachen Institute for Public
Policy and Governance (MI) at Dalhousie University and Discover Halifax collaborated on a
project focusing on what the tourism sector could experience in summer 2021. We aimed to
contribute in a constructive manner to community discussions about the impact COVID-19 is
having on the Halifax tourism sector and how the sector might address some of the challenges.
The challenges the sector is facing are considerable, and we recognize that this is only one
exercise of many that the sector is undertaking.
In this report, we approach the impact of COVID-19 on Halifax tourism as a risk problem. Risk
governance can be a structured and holistic way to think about risks and how to address them.
When confronted with such high degrees of uncertainty and fluidity, the risk governance
literature recommends scenario planning. For this exercise, we employed the intuitive logics
method of scenario planning; it is process- and discussion-oriented and dependent on active
participation from session participants. This method helps organizations and sectors identify
factors that drive their sector, describe plausible futures to which they must react, and define
policies they can develop in response to these futures.
The report is organized in two parts. The first part reviews key concepts from the risk
governance and scenario planning literature and provides an overview of the importance of the
tourism sector to Halifax and the impact COVID-19 has had on the sector. The second part of the
report summarizes the goals, process, and outcomes of the scenario-planning sessions that we
undertook with key stakeholders from the Halifax tourism sector in August 2020.
2. Risk Governance
2.1. What is risk governance?
The International Risk Governance Council (IRGC) takes a broad view of understanding risk and
how to address it. According to the IRGC, risk governance is defined as the totality of actors,
rules, conventions, processes, and mechanisms concerned with how relevant risk information is
collected, analyzed, and communicated and how management decisions are taken.
8Risk governance can be a structured and holistic way to think about Uncertain Risks
risks and how to address them. Renn (2008), one of the key Uncertain risks exist where
contributors to the IRGC, divides the risk governance process into there is an absence of
two broad spheres: assessment, which focuses on knowledge reliable historical data
generation, and management, which focuses on decisions and action. about past performance to
The assessment phase includes pre-assessment (which captures help us plan for the future.
existing indicators, routines and conventions that may prematurely
narrow what is going to be addressed) and risk appraisal (which See the IRGC framework
includes technical risk assessments and determining the level of for more information about
social concern). risk governance and
uncertain risks.
Tolerability and acceptability straddle both knowledge generation
and management; they determine “appetite” for risk, given
likelihood, consequence, and the level of residual risk allowable
after mitigation measures are put in place.
The final stage is risk management, which focuses on the actions required to manage risk to an
acceptable level. While Renn shows the process as four discrete and sequential steps, it is not
necessarily linear or easily compartmentalized. The process is dynamic and iterative as new data
comes to light, particularly for risks where there are considerable knowledge gaps, such as the
COVID-19 pandemic.
2.2. What is an uncertain risk?
The IRGC framework distinguishes between types of risk. As a starting point, it is useful to think
about our state of knowledge of a particular risk and how this will influence the process and the
actors with which we engage.
The IRGC framework divides risks into four classes: simple, complex, uncertain, and
ambiguous. The classification of risk is “not related to the intrinsic characteristics of hazards or
risks themselves but to the state and quality of knowledge available about both hazards and
risks” (Renn and Walker, 2008, p. 18). An example of a simple risk would be road safety. We
typically have reliable data for simple risks. Although car accidents are random, the number of
car accidents that occur each year, including deaths and serious injuries, is quite predictable. For
these types of risk problems, we assume the future will look like the past and we focus on how to
improve road safety based on past experience. In other words, we jump almost immediately to
the last stage of the risk governance process – risk management – and deliberate over options
based on past experience.
COVID-19, however, is an uncertain risk. Uncertain risks exist when there is an absence of
reliable predictive data to allow us to make reasonable forecasts about the future. These
limitations diminish confidence in traditional objective measures of risk estimation, and therefore
risk management becomes more reliant on “fuzzy” or subjective measures of risk estimation
(Renn, 2008, pp. 18-9). Uncertain risks frequently generate surprises or realizations that risk-
modelling frameworks and experts fail to anticipate or explain (e.g., rare natural disasters,
terrorism, pandemics).
9For this type of risk, we are particularly interested in risk tolerance. If the consequences can be
catastrophic and irreversible, then we adopt a precautionary approach. While a precautionary
stance will lead us to be more cautious in our decisions, there is still scope for exploration,
discussion, and debate over what a precautionary stance might entail. Generally, however,
precautionary approaches are expensive and controversial.
People’s reactions to risk are deeply embedded in psychological and sociological phenomena.
The psychology of risk literature identifies several biases in people’s ability to draw inferences in
the face of uncertainty. People are particularly anxious about unknown and high-dread risks
(Craig, 2005; Quigley et al., 2017, p. 12). Unknown risks include those that are unobservable,
unknown to those exposed and to science, new, and have a delayed effect. High-dread risks
include those that are understood to be uncontrollable, inequitable in their reach, potentially
catastrophic, of high risk to the future, not easily reduced, include involuntary exposure, and
affect people personally. Uncertain risks like pandemics have many of these characteristics.
Moreover, our willingness to tolerate risk is influenced by a variety of social factors, including
age, gender, income, employment status, ethnicity, lived experiences, (dis)ability, geographic
location, worldviews, and institutional arrangements (Jaeger et al., 2001; Quigley et al., 2017;
Hood et al., 2001, p. 9).
When we are confronted with such high levels of uncertainty and fluidity, the risk literature
recommends scenario planning as a process that can help us to think about the future and our
ability to respond to it.
3. Scenario Planning
3.1. What is scenario planning and when do you do it?
For many aspects of futures planning, prediction based on previous trends is a useful and
necessary tool to remain competitive and inform decisions. But how can an organization
anticipate events that do not follow a trend? What should an organization do when the future is
uncertain, and a variety of dimensions intersect to create an outcome that is almost impossible to
predict? These situations require more than just forecasting. In these cases, data on past
performance is not as reliable and the range of estimates is significant and uncertain – the 1970s
oil crisis, 9/11, and the 2008 financial crisis are examples of events in which scenario planning
was frequently used. COVID-19 is also one of these situations.
In light of uncertainties presented by COVID-19, scenario planning can challenge us to think
differently, and invite us to examine alternative outcomes and how to respond to them. A
scenario is not a prediction of the future but rather a hypothetical sequence of events that is
helpful in investigating causes and necessary decision points (Van Asselt et al., 2010). Scenario
planning can help organizations distinguish between what they can and cannot control, and what
policies they can develop in response to the situation.
10Scenario planning includes these four processes:
1) Identifies ‘driving factors’ for the organization
2) Identifies potential risks and uncertainties for the organization
3) Imagines potential future scenarios for the organization
4) Develops criteria by which to judge policies and plans to address these futures.
3.2. Scenario-planning design
There is no one way to do scenario planning. We will be following the intuitive logics method.
During these sessions, we apply an exploration approach to scenario planning that is intuitive
and leverages stakeholder engagement to approach simple scenarios/problems.
The 2 x 2 matrix is often referred to as the “standard” tool in intuitive logics scenario planning
(Van Asselt et al., 2010; Ringland, 2002; Ramirez and Wilkinson, 2014). This matrix consists of
four boxes used to plot scenarios and two axes that represent driving forces. Like most aspects of
intuitive logics scenario planning, the 2 x 2 matrix can be used differently depending on the
circumstance. The conventional structure of an intuitive logics scenario planning exercise using
the 2 x 2 matrix is referred to as the backbone. The backbone matrix is built by:
a) Identifying and explaining key contextual drivers for the organization. In the backbone
model these are the two factors that score the highest with regards to impact and uncertainty.
They serve as the axes for the matrix.
b) Developing different scenarios based on the organization’s key drivers. Each of the four
possible scenarios is plotted on the 2 x 2 matrix.
c) Identifying policy and program characteristics suited to the scenarios that they generate.
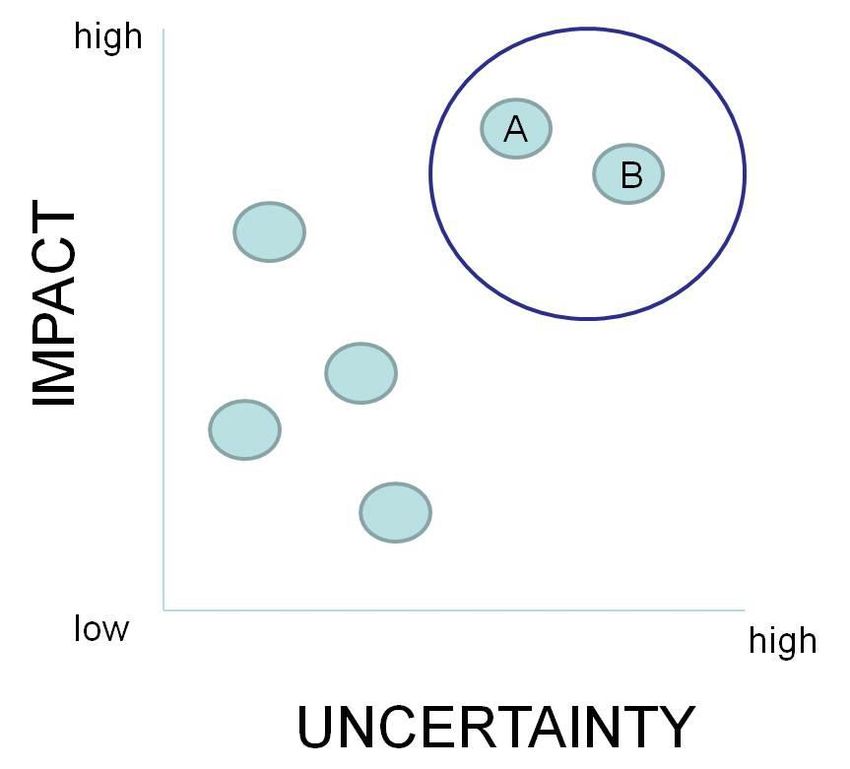
11Figure 2: 2 x 2 Matrix. The 2 x 2 matrix demonstrates how two driving forces generate four plausible
futures.
Figure 3: 2 x 2 Matrix Example. Scenario 1 involves high social distancing measures and low consumer
activity, while Scenario 4 involves low social distancing measures and high consumer activity.
Ramirez et al. (2008) suggest that participants involved in the scenario planning should reflect a
wide array of different views, with all stakeholders’ interests being considered. Participants come
as individuals and do not represent the interests of their organization. Additionally, the event has
12to take place in an environment of mutual trust, with no hierarchies and with active participation
by all those involved.
In sum, a scenario is not a prediction of the future but rather an attempt at understanding
causal factors that impact a particular organization or sector and how to address them.
Successful scenario planning requires active participation by those involved in the sector,
with people coming as individuals with a wide array of views. While there are many
scenario planning methods, we employed the intuitive logics method and drew on the work
of Van der Heijden, Van Asselt, and others, with some modifications of our own. An
essential step of this process is to identify which driving forces have the most impact and
which are the most difficult to predict or most uncertain. We plot these driving forces on a
2 x 2 matrix to identify four potential scenarios and to develop strategies for addressing
these futures.
4. Selected Comments on COVID-19 in the Atlantic Region
The first confirmed case of COVID-19 in Canada was reported on January 27, 2020, in Toronto,
Ontario (Government of Canada [GOC], 2020). As of January 31, there were a total of 4
confirmed cases of COVID-19 in Canada. Ontario and British Columbia were the only provinces
that reported cases. On February 20, Canada confirmed the first case of COVID-19 not related to
travel from mainland China (GOC, 2020).
On March 15, Nova Scotia became the last province to report a confirmed case of COVID-19
(GOC, 2020). On March 22, the Government of Nova Scotia declared a provincial state of
emergency to contain COVID-19. Non-essential travel was limited. Non-essential businesses,
schools, and universities and non-essential public spaces (e.g., parks) closed. The government
requested that Nova Scotians stay home and avoid contact with people outside their household.
The state of emergency has been extended until 12pm on September 20 (Government of Nova
Scotia, 2020b).
Outdoor parks, beaches, and trails were re-opened by the province and Halifax on May 1 – the
first wave of re-openings in the province. Many businesses (e.g., restaurants, lounges, and retail
stores) were closed under the Health Protection Act. This imposed new health protection
guidelines on all organizations to limit the spread of COVID-19 (e.g., social distancing, event
cancellation, mask wearing, sanitation protocols). A variety of enforcements have been used to
ensure compliance, such as information dissemination, fines, reporting structures, and legal
charges. Many businesses were approved to resume operations under new public health orders as
of June 4.
On June 1, Prince Edward Island began allowing seasonal residents to apply to visit their
properties in PEI; however, the requirement to self-isolate was still in place (Cyr, 2020).
13July 3 was the official launch of the “Atlantic Bubble”, a policy decision to allow residents of the
four Atlantic provinces (i.e. New Brunswick, PEI, Nova Scotia, and Newfoundland) to travel
between these provinces without the requirement to self-isolate for 14 days (Government of
Nova Scotia, 2020a).
In sum, Atlantic Canada has fared well throughout the pandemic, especially when
compared to other parts of Canada. The snapshots below describe the total cases confirmed
across Canada by province. When considering total cases, it is important to consider the
population of a region. For example, the population of Nova Scotia is just over 970,000 and
the population of Ontario is 14.57 million (the city of Toronto reporting a population of
nearly 3 million; Statistics Canada, 2020c). It is also important to note that the data below
includes total cumulative confirmed cases for each province and does not represent the
total active cases at that time (i.e. the data does not include recoveries and deaths).
Numbers in the table below have been rounded for simplicity and the population
information uses data from Statistics Canada.
For more statistical data about COVID-19 in Canada, please see “Coronavirus disease (COVID-
19): Outbreak update” on the Government of Canada website.
Province # of Confirmed % of Total Cases Cases per
Cases in Canada 100,000
British Columbia 970 11.3 19.13
Alberta 754 8.8 17.25
Saskatchewan 184 2.2 15.67
Manitoba 103 1.2 7.52
Ontario 1966 23.0 13.5
Quebec 4162 48.7 49.05
New Brunswick 70 0.8 9.0
Nova Scotia 147 1.7 15.13
Prince Edward Island 21 0.25 13.4
Newfoundland 152 1.8 29.14
Yukon 5 0.06 12.17
Northwest Territories 1 0.01 2.22
Nunavut 0 0.0 0.0
Figure 4: Total Confirmed Cases of COVID-19 Reported Across Canada as of March 31, 2020.
Nova Scotia had the sixth highest number of cases per 100,000 in March.
Source: Statistics Canada (2020c).
As of March 31, Canada had a total of 8,548 confirmed cases of COVID-19. The majority (71%)
were concentrated in Ontario and Quebec, with total cases in British Columbia (BC) and Alberta
accounting for an additional 20%. At this time, Atlantic Canada accounted for less than 5% of
total cases in Canada.
14Province # of Confirmed % of Total Cases Cases per
Cases in Canada 100,000
British Columbia 2597 2.8 51.21
Alberta 7044 7.7 161.15
Saskatchewan 646 0.7 37.13
Manitoba 295 0.3 21.55
Ontario 28263 30.8 194.0
Quebec 51354 56.2 605.23
New Brunswick 132 0.14 17.0
Nova Scotia 1057 1.15 108.81
PEI 27 0.03 17.2
Newfoundland 261 0.28 50.04
Yukon 11 0.01 26.64
Northwest Territories 5 0.005 11.12
Nunavut 0 0.0 0.0
Figure 5: Total Confirmed Cases of COVID-19 Reported Across Canada as of June 1, 2020. Nova
Scotia had the fourth highest number of cases per 100,000 in June.
Source: Statistics Canada (2020c).
As of June 1, Canada reported a total of 91,705 cases of COVID-19. The majority of cases were
in Quebec, Ontario, and Alberta (94%). At this time, Atlantic Canada accounted for
approximately 1.6% of total confirmed cases in Canada.
Province # of Confirmed % of Total Cases Cases per
Cases in Canada 100,000
British Columbia 3562 3.1 70.24
Alberta 10603 9.2 242.58
Saskatchewan 1268 1.1 72.87
Manitoba 407 0.35 29.73
Ontario 38,986 33.8 267.58
Quebec 59,073 51.2 696.21
New Brunswick 170 0.1 21.9
Nova Scotia 1067 0.9 109.84
Prince Edward Island 36 0.3 22.94
Newfoundland 266 0.23 51.0
Yukon 14 0.01 33.9
Northwest Territories 5 0.004 11.12
Nunavut 0 0.0. 0.0
Figure 6: Total Confirmed Cases of COVID-19 Reported Across Canada as of July 29, 2020. Nova
Scotia had the fourth highest number of cases per 100,000 in July.
Source: Statistics Canada (2020c).
At this time, Canada reported a total of 115,470 confirmed cases of COVID-19. The majority of
cases were located in Quebec, Ontario, Alberta, and British Columbia (97%). Total cases in
Atlantic Canada had peaked at 1,539 cases (approximately 1.3% of Canada’s total confirmed
15cases) and many cases had recovered. For example, as of July 30, Nova Scotia had reported no
cases of COVID-19 since July 15 (Quon, 2020).
The figures below show the total active cases (i.e. total confirmed cases less total deaths and
recoveries) in Nova Scotia and Ontario. The total active cases over time demonstrates whether
COVID-19 is successfully being reduced and/or eliminated from a given area.
Figure 7: Active Cases of COVID-19 in Nova Scotia. The total number of active cases of COVID-19 in
Nova Scotia between June 1 and July 31 fell to zero for 15 days during the period.
Source: Statistics Canada (2020c).
Figure 8: Active Cases of COVID-19 in Ontario. The total number of active cases of COVID-19 in
Ontario between June 1 and July 31 decreased from approximately 4,000 cases to 1,500 cases.
Source: Statistics Canada (2020c).
165. Overview of Halifax tourism
5.1. Snapshot of Halifax tourism
According to Destination Halifax’s (the former name of Discover Halifax) Marketing Strategy
2016–2021 (n.d.), Halifax is a competitive destination for domestic and international visitors in
terms of border security, lodging availability and costs, uniqueness of attractions, and
attractiveness of the city, including its mixture of old and new architecture. However, there are
limited international flights to Halifax (compared to first-tier cities), high travel costs compared
to central Canada destinations, and lower awareness for international visitors.
On average, the Halifax tourism industry:
• Experiences its peak season during the third quarter (July–September)
• Accommodates 5.5 million overnight stays each year
• Generates approximately $1.3 billion annually in direct spending
• Generates more than $120 million annually in provincial sales tax revenue and $43 million in
municipal tax revenue from hotel and tourism properties
• Includes 34,000 jobs and 4,000 businesses, including:
o 55 hotels/accommodations
o 1,088 restaurants
o 312 things to do (212 businesses)
o 10 car rental agencies
TOTAL NUMBER OF VISITORS BY TRIP PURPOSE
387,797
570,483 To visit friends or relatives
1,627,821 Shopping
All other pleasure
Business (includes conventions)
All other/Not stated
1,005,074
328,359
Figure 9: Total Number of Visitors by Trip Purpose. 41.5% of visitors to Halifax come to visit friends
or relatives (VFR).
Source: Destination Halifax Marketing Strategy 2016–2021.
The leisure market in Halifax is divided into five segments:
1) Urban experiencers
172) Cruise
3) VFR
4) Shopping
5) Other (e.g., LGBT, New Canadians, other opportunities, motorcycle)
The cruise segment is a distinctive market comprising both a group sales market and a direct-to-
consumer leisure market. Discover Halifax supports the Halifax Port Authority by selling the city
as a port of call to major cruise lines and provides information to guide consumers in choosing
itineraries. As a result, the cruise industry is a critical market for many suppliers.
NUMBER OF CRUISE SHIPS VISITING HALIFAX
145 141
140
134 134 134
# of Cruise Ships
135
130
125 122
120
115
110
2011 2012 2013 2014 2015
Year
Figure 10: Number of Cruise Ships Visiting Halifax. 2015 saw an increase in cruise ships following
three stagnant years.
Source: Destination Halifax Marketing Strategy 2016–2021.
NUMBER OF CRUISE PASSENGERS VISITING HALIFAX
260,000 252,847 252,121
250,000 243,577
# of Cruise Passengers
240,000
230,000 217,305 222,309
220,000
210,000
200,000
190,000
2011 2012 2013 2014 2015
Year
Figure 11: Number of Cruise Passengers Visiting Halifax. Despite the increase in cruise ships visiting
Halifax, the number of passengers declined by 21,268 between 2011 and 2015.
Source: Destination Halifax Marketing Strategy 2016-2021.
18TOTAL VISITOR SPENDING
Other
$62 million Pure VFR
Business
$119 million
$110 million
Meetings &
conventions $112
million
Pleasure & VFR
pleasure
$467 million
Figure 11: Total Visitor Spending. 53.7% of total visitor spending is from purchases related to pleasure
and VFR pleasure.
Source: Statistics Canada (2010-2015a, as cited in Destination Halifax, n.d.).
Statistics Canada (2010-2015b, as cited in Destination Halifax, n.d.).
Halifax has a competitive advantage in urban experiences compared to nearest competitors
Charlottetown and Moncton. Access to outdoor and nature experiences in other near markets,
including rural Nova Scotia and New Brunswick, however, makes the city less competitive in
this aspect.
VISITOR ORIGIN
2.6% 5.6%
7.7%
Europe
10.0% Maritimes
Middle Canada
9.5% New England
Ontario
4.1% Other
56.6%
Rest of Canada
3.5%
South Atlantic
Figure 12: Visitor Origin. Roughly 56.6% of Halifax visitors come from across the Maritime provinces.
Source: Statistics Canada (2010-2015a, as cited in Destination Halifax, n.d.).
Statistics Canada (2010-2015b, as cited in Destination Halifax, n.d.).
19Transportation Mode Total Visitors % of Total Visitors
Bus 78,833 2.0%
Car/truck/camper or RV 3,459,920 88.2%
Commercial flight 333,077 8.5%
Not stated 25,757 0.7%
Other 88,959 2.3%
Rail 22,524 0.6%
Ship/boat 68,249 1.7%
Figure 13: Mode of Transportation. Driving is the most common visitor method of transportation, with
88.2% of visitors using this mode.
Source: Destination Halifax Marketing Strategy 2016–2021.
Tourism Nova Scotia has reported that overall United States (US) Travel Bubble
visitation to NS has declined steadily for 10 years, decreasing by Representing 17.2% of
approximately 33% between 2001 and 2010. In response to these visitors, Ontario and the
findings, the Destination Halifax Marketing Strategy 2016-2021 Rest of Canada are two
(n.d.) discusses a near-market segment strategy. The strategy major markets excluded
strives to position Halifax as the central place for activity in the from the current travel
Maritimes, improve the likelihood of the near-market segment bubble.
consulting Discover Halifax’s website when looking for something
to do, promote specific events and activities, and make Maritimers
consider Halifax as their city.
In sum, tourism is an important sector for Halifax, employing more than 34,000 and
generating over $1 billion in direct spending each year. Halifax’s competitive advantage
and position as the Maritime provinces’ city contributes to the significance of promoting
Atlantic Canada tourism, especially with declining tourism from the US and promotion of
“staycations” for the foreseeable future.
5.2. Impacts of COVID-19 on Halifax tourism
Following an increase in unemployment during the early months of COVID-19, jobs increased in
June 2020 by 29,000 in Nova Scotia (Statistics Canada, 2020a).
20NOVA SCOTIA UNEMPLOYMENT RATE
JUNE 2019 VS JUNE 2020
14.0%
12.0% 13.0%
10.0%
8.0%
6.0% 6.7%
4.0%
2.0%
0.0%
June 2019 June 2020
Figure 14: Nova Scotia Unemployment Rate, June 2019 vs June 2020. The June 2020 NS
unemployment rate was almost double what it was in June 2019, but has declined by 0.6% since May
2020, on track with the recovering national unemployment rate (12.3%).
Source: Statistics Canada (2020b).
The NS unemployment rate is masking what is happening in the tourism sector. While there is
little data available about specific tourism employment in Halifax, a recent study by Tourism HR
Canada (2020) estimates tourism unemployment in Nova Scotia at 21%, which is 8% higher than
the provincial unemployment rate. The closure and limited operations of tourist attractions
accounts for this higher rate. Small-business owners also experienced high levels of uncertainty
in the early stages of the lockdown, with several restaurants closing permanently.
Hotels have been one of the most impacted markets of the Halifax tourism sector, experiencing
the first hit in March 2020. Halifax hotels experienced their lowest sales in April 2020, with an
average of 820 room bookings, a 76.5% decrease from April 2019. It is important to note that
Halifax hotels were not welcoming visitors during the early periods of the lockdown. Instead,
these numbers largely reflect occupation by doctors, homeless individuals, and people trying to
self-isolate from their families.
21MOST HOTEL ROOMS WERE NOT OCCUPIED BY VISITORS TO
HALIFAX DURING LOCKDOWN, MARCH 2020
# of Hotel Rooms Sold
5,000
4,000
3,000
2,000
1,000
0
7
14
1
2
3
4
5
6
8
9
10
11
12
13
15
16
17
18
19
20
21
22
23
24
25
26
27
28
29
30
31
Day
Figure 15: March 2020 Hotel Room Bookings. March 23 saw the lowest average daily number of hotel
room bookings at 669, 78.9% lower than March 23, 2019 (3,164 hotel room bookings).
Source: Smith Travel Research (2020).
AVERAGE NUMBER OF HOTEL ROOMS OCCUPIED
JAN 2019–JUNE 2019 vs JAN 2020–JUNE 2020
5000 4667
4500 4306
# of Hotel Rooms Sold
4000 3745
3467 Jan
3500 3245
3051 2934
3000 Feb
2507
2500 2077 Mar
2000
Apr
1500
880 984 1077 May
1000
500 Jun
0
2019 2020
Figure 16: Average Number of Hotel Rooms Occupied Jan 2019–June 2019 vs Jan 2020–June 2020.
This year began with an increase in the average number of hotel rooms sold over the same period in 2019.
By March 2020, the number of rooms sold declined, which was followed by the lowest sales in April, a
decline of 76.5% compared to April 2019.
Source: Smith Travel Research (2020).
Travel restrictions in place are likely to influence Halifax tourism activity. As of July 3, the
“Atlantic Bubble” is in operation. This allows residents from the four Atlantic provinces (NS,
NB, PEI, and NL) to travel within these provinces without having to self-isolate for 14 days.
Visitors from outside the Bubble, both domestic and international, are required to self-isolate
upon arrival. The Government of Canada continues to recommend against non-essential travel
for Canadians, while incoming international passenger flights are limited to four major airports,
22all located outside the Maritimes (Tourism Nova Scotia, 2020). Cruise ships are prohibited from
visiting Canadian ports until at least October 31.
5.3 Polling data: Selected observations
According to data collected by Leger and the Association of Canadian Studies, 64% of
Canadians have changed or cancelled their 2020 vacation plans (Leger Marketing, 2020d) and
85% say they are not planning to travel internationally by the end of 2020 (Leger Marketing,
2020c). Approximately one in three Canadians will not feel comfortable travelling
internationally until there is a vaccine for COVID-19 (Leger Marketing, 2020a), and 86%
disagreed with reopening the border between Canada and the US at the end of July (Leger
Marketing, 2020b). Twenty-seven percent indicate they would only be comfortable going on a
cruise once a vaccine has been developed, while 40% say they will never go on a cruise (Leger
Marketing, 2020a). Perhaps most notably, 46% indicate they are currently comfortable traveling
locally (staying in their own homes and exploring local areas), with 31% comfortable travelling
around their province (Leger Marketing, 2020d).
COVID-19 also influenced how Canadians planned for the summer months, including how
comfortable they felt engaging in different social activities. In anticipation of the relaxing of
protective measures in early June, 17% of Atlantic Canadians indicated they would be
comfortable dining in a restaurant, while 16% said they would attend large gatherings, such as
sporting events, festivals, and concerts, and 17% would feel comfortable going to bars, lounges,
and nightclubs (Leger Marketing, 2020a). The figure below illustrates how the comfort levels of
Atlantic Canadians for engaging in social activities have varied from the national average.
National Average 27-Apr 04-May 10-May 25-May
Dine in restaurants (%) 45 19 21 17
In Atlantic Canada (%) 54 9 22 17
Travel to USA (%) 41 10 20 17
In Atlantic Canada (%) 47 14 25 20
Attend large gatherings (sporting events, 34 14 14 13
festivals, concerts) (%)
In Atlantic Canada (%) 45 15 14 16
Go to bars, nightclubs and lounges (%) 37 19 17 16
In Atlantic Canada (%) 34 16 21 17
Figure 17: Percentage of People Who Feel Comfortable Engaging in Activities. The percentage of
people who would feel comfortable engaging in these activities following the lifting of some protective
measures in June. Atlantic Canadians seem to be slightly less risk-averse than the national average,
though in most cases the difference is not significant.
Source: Leger Marketing (2020b, May 25).
A recent study by the Agri-Food Analytics Lab (2020), in collaboration with Caddle, an Ontario
research firm, suggests that the Canadian hospitality industry could lose $20 billion in revenue
over the next year. According to the study, which surveyed 10,851 Canadians, telecommuting
may be influencing the food industry (Agri-Food Analytics Lab, 2020). Before the pandemic,
2336.8% of respondents indicated that they visited a restaurant for a meal/break twice a week,
while 23.3% of respondents reported that they will go to a restaurant twice a week after the
pandemic (Agri-Food Analytics Lab, 2020). Recent statistics from Tourism Nova Scotia (2020)
indicate similar impacts on commercial air travel. The Halifax Stanfield International Airport
recorded 360,000 passenger enplanements in June 2020, a 63% decline from June 2019 (Tourism
Nova Scotia, 2020). Collectively, these findings suggest that industries in the tourism sector will
continue to experience the impacts of COVID-19 for the foreseeable future.
5.4. Halifax Tourism’s response to COVID-19
In response to these impacts of COVID-19, Discover Halifax introduced The Halifax Region
Tourism Opening Plan, composed of four parts: leisure marketing, group sales, programming
and events, and Halifax region tourism reopening. The overall goal of the plan is “to protect our
communities against the importation and spread of COVID-19 and by doing so expedite the
opening of the tourism industry to safe markets” (Discover Halifax, 2020, slide 4). The Plan also
emphasizes the significance of taking a “community-first approach” in responding to challenges
associated with the pandemic, which brings together the tourism industry, public health, and
citizens (Discover Halifax, 2020, slide 7).
The Tourism Recovery Plan outlines strategies Halifax can pursue under four pillars:
1) Access to safe markets
2) Safe spaces
3) Communications to promote safe travel and public health goals
4) Responsive design to adapt to changing epidemiology.
Specific actions include the promotion of “staycations”, a focus on outdoor experiences and
events, collaboration with industries to provide safe messaging and visitor information, and the
introduction of an oversight committee for monitoring, evaluating, and implementing corrective
actions.
In sum, Halifax tourism has experienced higher unemployment rates and business closures
than other sectors due to COVID-19. The hotel industry is among the markets most
impacted by COVID-19, with 77% fewer rooms sold in June 2020 than in June 2019. A
study by Leger Marketing (2020d) finds that 46% of Canadians are comfortable travelling
locally, with 31% comfortable travelling around their province. Travel restrictions and
border closures will continue to influence Halifax tourism for the foreseeable future, while
the Atlantic Bubble introduced in July highlights Atlantic Canada as the key market for
the sector to target. The Halifax Region Tourism Opening Plan promotes Halifax as the
Maritimes’ city and outlines strategies for the tourism sector, including a focus on outdoor
experiences and “staycations”.
246. Project Description
6.1. Purpose
This project was devised jointly by the MacEachen Institute and Discover Halifax. We aimed to
create and support a conversation with the Halifax tourism sector and related stakeholders about
the impacts of COVID-19 on tourism and how to foster appropriate responses that contribute to
the health and economic well-being of our community in the medium and long term.
6.2. Goals
• Provide the Halifax tourism industry and related stakeholders with relevant information and
structure to describe, examine, and respond to plausible near-term futures, in light of the
challenges and opportunities that COVID-19 presents. Our exercise focused on summer
2021.
• Examine the interface between economic and health concerns, with an eye to contributing to
a healthy and prosperous Halifax.
6.3. Deliverables
• Two scenario-planning sessions on Halifax tourism. Each three-hour session took place in
person at the Westin Nova Scotia.
• A report that summarizes key points about risk governance and scenario planning, the
impacts of COVID-19 on tourism, and the outcome of the scenario sessions.
• A briefing note that identifies the key takeaways from the scenario-planning sessions.
6.4. Session structure
The sessions brought together individuals from the Halifax tourism sector and key stakeholders
to take part in the scenario-planning process. The sessions were moderated by Kevin Quigley,
Scholarly Director of the MacEachen Institute, and took place on Friday, August 7 and Friday,
August 14 from 9:00 am to 12:00 pm at the Westin Nova Scotian.
1) The first session began with a brief address by Greg Klassen, a Partner with Twenty31
Consulting, followed by an introduction to scenario planning and a group discussion of key
variables that drive the tourism sector.
2) The second session involved a brief address by Mayor Mike Savage, followed by a group
discussion of four plausible futures and strategic interventions that will address these futures.
Invitees were chosen for their knowledge of, responsibility for, and interest in tourism and
COVID-19. They were expected to attend both sessions and were encouraged to participate
actively during the group discussions. The moderator provided a structure for group discussion.
Session two built on session one.
257. Scenario-Planning Variables
7.1. Timeline
The timeline for these scenarios is summer 2021.
7.2. Sample variables
During the first scenario-planning session, we discussed driving forces that potentially influence
the tourism sector. A driving force is an environmental variable that drives a possible outcome of
a critical uncertainty. Here are some examples that impact the Halifax tourism sector:
• Social distancing measures: Social distancing requires individuals to stay two metres away
from people who are not from their household. As a result, businesses face occupancy
restrictions, such as restaurants operating at 50% capacity.
• Border restrictions: Border restrictions are in place, with visitors from across
provincial/territorial and national borders having to self-isolate for 14 days upon their arrival.
The Atlantic Bubble allows residents of Atlantic Canada to visit without having to self-
isolate.
• Travel restrictions: Non-essential travel, including air and train travel, is discouraged in
Canada to prevent the spread of the virus. These restrictions dissuade visitors from outside
the Maritimes from visiting Halifax.
• Port access: The closure of ports is significantly impacting the cruise ship industry. Halifax
typically welcomes over 200,000 cruise passengers each year, making some suppliers
dependent on this industry.
• Economic outlook: Economic outlook refers to the trends and prospects of the economy,
whether it be local, national, or international. Consumer confidence is one economic trend
affecting Halifax tourism.
• Economic recovery: Economic recovery is the period following a recession, during which
the economy begins to rebound. A recovering economy could help the Halifax tourism sector
experience more stable operations and employment.
• Government support programs: The Business Credit Availability Program, for example, is
designed to provide over $10 billion in support to small and medium-sized businesses.
Support programs can help local businesses, like restaurants, stay open during uncertain
times.
• Hosting capacity: Hosting capacity often refers to the number of people permitted inside a
business or organization at one time. Current restrictions may lead to fewer visits and/or sales
for Halifax attractions and businesses.
• Community interest and support: Community interest in and support of the tourism sector
are always influential for the sector. Promotion of local businesses and attractions is
especially important during this period of travel restrictions and “staycations”.
• A second wave: A resurgence of the virus could force businesses back into lockdown.
Halifax could experience additional business closures and unemployment as a result.
26• Vaccine: The development, production, distribution, and administration of a COVID-19
vaccine could lead to the lifting of travel and business restrictions currently in place. Halifax
could experience a subsequent increase in visitors.
• Visitors’ risk perception: Risk perception refers to the subjective assessment that people
make about the severity or potential harm of a risk. Visitors’ perception of risk could limit
the number of people visiting and experiencing Halifax.
7.3. Chatham House Rule
Under the Chatham House Rule, meeting participants “are free to use the information received,
but neither the identity nor the affiliation of the speaker(s), nor that of any other participant may
be revealed” (Chatham House, n.d., para. 3). We employed this rule during our discussions at the
sessions, in which ideas were collected, summarized, and documented, but not attributed.
7.4. Facilitated discussion on critical drivers in Halifax tourism
Participants identified 10 driving forces during the first session’s facilitated discussion on critical
drivers in Halifax tourism: technology, perception of fear, tone of discourse, access to
markets, cashflow, perceived effectiveness of a vaccine, consumer confidence, virus
containment, working from home, and seasonality. The following paragraphs provide an
overview of the group’s conversations about the driving forces influencing Halifax tourism.
Technology was discussed first, with participants emphasizing its direct impact on consumer
behaviour and its capacity to connect demand with supply. Participants characterized technology
as a driver impacting how people are buying tourism products and how organizations are
adapting to provide their goods and services. Participants noted that some organizations are
being left behind due to an incapacity to adapt their business, while others are successfully
leveraging technology, such as the use of online bookings. While technology will never replace
person-to-person contact, the COVID-19 pandemic is revealing the vulnerabilities of many
organizations within the tourism sector, including limited access to high-speed internet in rural,
tourism-driven communities across the municipality.
Following the discussion on technology, the group identified how significantly tourism impacts
the economy and how underappreciated it can be. Participants emphasized that aspects of
tourism and tourism infrastructure can be considered a public good that requires government
support.
Participants also raised perception of fear, related to both the virus and the re-opening of the
province, and how this is impacting the tourism sector. It was noted as being ironic that on one
hand we would like to encourage visitors from outside the region to come to the region while, on
the other hand, some local residents are concerned about their own health when engaging with
their own community. Some participants were concerned about the tone of discourse; at times, it
has seemed overly alarming and unclear, and involving little encouragement for residents to go
out and experience what Halifax or the province has to offer.
27You can also read