EAST AND SOUTHERN AFRICA (ESA) NATIONAL BUDGET COMMITMENT TO NUTRITION - GRAÇA MACHEL TRUST - CARE Action!
←
→
Page content transcription
If your browser does not render page correctly, please read the page content below
EAST AND SOUTHERN AFRICA (ESA)
 NATIONAL BUDGET COMMITMENT
         TO NUTRITION

  A report of National
   Budget allocation
      to Nutrition,
  An analysis of nine
       countries

                                       Civil Society Network

                  GRAÇA MACHEL TRUST   ENGAGE   INSPIRE   INVEST
‘‘ A thriving Africa should provide
                                   ‘‘
sufficient nutritious food to all women
and children to enable each generation
       to grow to its full potential
               Graça Machel

                                          Civil Society Network

         GRAÇA MACHEL TRUST               ENGAGE   INSPIRE   INVEST

                    2
ACKNOWLEDGEMENTS
This report’s primary research and compilation was done by Dr. Michael Johnson
and Prof Othieno Nyanjom. The report was written and put together by Vitumbiko
Chinoko and Reginald Ntomba from CARE, overall edit input provided by Michelle
Carter from CARE. The review and country content would not have been possible
without feedback from CARE country teams and the East and Southern Africa
Civil Society Network members from Kenya, Madagascar, Malawi, Mozambique,
Rwanda, South Sudan, Tanzania, Zambia and Zimbabwe. Technical edits and
overview managed by Rachel Toku-Appiah and Christine Muyama from the Graça
Machel Trust.

The finalisation of the report would have not been possible without invaluable
inputs and comments from many colleagues and partners from CARE, Scaling
Up Nutrition and the Graça Machel Trust Special thanks for inputs and review at
different stages to: Hugh Bagnall-Oakeley from Save the Children UK and William
Knechtel from Scaling up Nutrition.

We are grateful to Raashida Khan the copy edit work, comments and inputs that
have helped to improve and formalise the report.

Thanks to Adele Sherlock from Freelance Media for the creative layout and design
of the report, and credit to CARE and the Graça Machel Trust’s Communications
team for providing some of the images used in the report.

This publication is copyright, but may be reproduced by any method without
fee or prior permission for teaching purposes, but not for resale. For copying in
any other circumstances, prior written permission must be obtained from the
publisher.
Printed by Typo Print

                                         1
LIST OF ACRONYMS
CAADP			    Comprehensive Africa Agriculture Development Programme

CHW			      Community Health Workers

CSA SUN		   Civil Society Alliance on Scaling Up Nutrition

CSO			      Civil Society Organisation

CSO SUN		   Civil Society Organisation Scaling Up Nutrition

DHS			      Demographic Healthy Survey

ESA			      East and Southern Africa

ESA CSN		   East and Southern Africa Civil Society Nutrition Network

FANRPAN		   Food, Agriculture and Natural Resources Policy Analysis Network

FAOSTAT		   Food and Agricultural Organization of the United Nations
			         (Statistical database)

FY			       Financial Year

GDP			      Gross Domestic Product

GMT			      Graca Machel Trust

GNR			      Global Nutrition Report

IMF			      International Monetary Fund

MDGs			     Millennium Development Goals

N4G			      Nutrition for Growth

NGOs			     Non-governmental Organisations

                             2
LIST OF ACRONYMS
OECD			      The Organisation for Economic Co-operation and Development

OECD CRS		   The Organisation for Economic Co-operation and Development
			          Common Reporting Standard

RCT			       Randomised Control Trial

ReSAKSS		    Regional Strategic Analysis and Knowledge Support System

SDGs			      Sustainable Development Goals

SETSAN		     Technical Secretariat for Food and Nutritional Security

SP			        Social Protection

SSHS			      South Sudan Household Survey

SUN			       Scaling UP Nutrition

UN			        United Nations

UNICEF			    United Nations Children’s Emergency Fund

WASH			      Water and Sanitation / Water and Sanitation Health

WHA			       World Health Assembly

WHO			       World Health Organisation

                              3
CONTENTS
List of Acronyms										                                                                         2
CONTENTS											                                                                                4
FOREWORD											                                                                                7
EXECUTIVE SUMMARY										                                                                        9
INTRODUCTION										                                                                            12
NUTRITION STATUS, POLICIES, STRATEGIES AND CHALLENGES				                                         15
Overview and status of undernutrition and poverty status in the countries			                      16
Figure 1: Selected nutrition indicators for 9 ESA countries					                                  16
Figure 1.2: Selected nutrition indicators for nine Eastern and Southern Africa countries		        17
Overview of current policy commitments and targets to address under-nutrition		                   19
Table 2.1: Global and regional food and nutrition security commitments				                        19
Table 2.2: Global Nutrition Targets 2025								                                                  20
Progress and key challenges 									                                                             21
Challenges											                                                                             22

NATIONAL NUTRITION PLANNING AND MANAGEMENT					                                                   23
Figure 3.1 Share of on-budget nutrition spending in the total national budget			                  24
Figure 3.2: Share of donor funding to nutrition							                                            25
Figure 3.3 Relative shares of nutrition specific and nutrition sensitive spending, 2017		         27

NATIONAL BUDGET ALLOCATIONS, INCLUDING DONOR AID FLOWS				                                        28

KENYA												                                                                                 30
Figure 4.1: Allocation of all nutrition spending across sectors (on- and off-budget programmes)   31
Table 4.1.2 Consolidation of budget analysis for nutrition with OECD (2015) donor aid flows       32

MADAGASCAR                                                                                        33
Figure 4.2: Allocation of all nutrition spending across sectors (on- and off-budget programmes)   34
Table 4.1.2 Consolidation of budget analysis for nutrition						                                  35

MALAWI											                                                                                 36
Figure 4.3: Allocation of all nutrition spending across sectors                                   37
Table 4.3.1: Consolidation of budget analysis for nutrition with OECD donor aid flows		           38

MOZAMBIQUE										                                                                              39
Figure 4.4: Allocation of all nutrition spending across sectors			                                40
Table 4.4.1: Consolidation of budget analysis for nutrition with OECD donor aid flows             41

                                                 4
CONTENTS
RWANDA										                                                                             42
Figure 4.5: Allocation of all nutrition spending across sectors                              43
Table 4.4.1: Consolidation of budget analysis for nutrition with OECD donor aid flows        44

SOUTH SUDAN										                                                                        45
Figure 4.6: Allocation of all nutrition spending across sectors                              46
Table 4.6.1 Consolidation of budget analysis for nutrition with OECD donor aid flows         47

TANZANIA										                                                                           48
Figure 4.7 Allocation of all nutrition spending across sectors			                            49
Table 4.7.1 Consolidation of budget analysis for nutrition with OECD donor aid flows         50

ZAMBIA										                                                                             51
Figure 4.8 Allocation of all nutrition spending across sectors 		                            52
Table 4.8.1 Consolidation of budget analysis for nutrition with OECD donor aid flows         53

ZIMBABWE										                                                                           54
Figure 4.9 Allocation of all nutrition spending across sectors 				                          55
Table 4.9.1 Consolidation of budget analysis for nutrition with OECD donor aid flows         56

DISCUSSIONS ON THE FINDINGS AND RECOMMENDATIONS				                                          57
Figure 5.1: Total nutrition spending weighted by GDP (%)				                                 58
Figure 5.2: Aggregate, government and donor nutrition spending and shares                    60
Figure 5.3: Total nutrition spending and remaining gap2 (2015 USD/child)		                   61
Figure 5.4: Share of donor funding of nutrition in government programmes                     63
Figure 5.5: Share of on-budget nutrition spending in the total country and regional budget   64
Social Protection 									                                                                  65
Figure 5.6: Shares of government and donor resources via social protection		                 66
Key Gaps and Challenge								                                                               67
Data Generation and Management 							                                                       68
Advocacy and Influencing								                                                             69
Planning and Budgeting								                                                               71
Implementation, Monitoring and Evaluation						                                              71

                                               5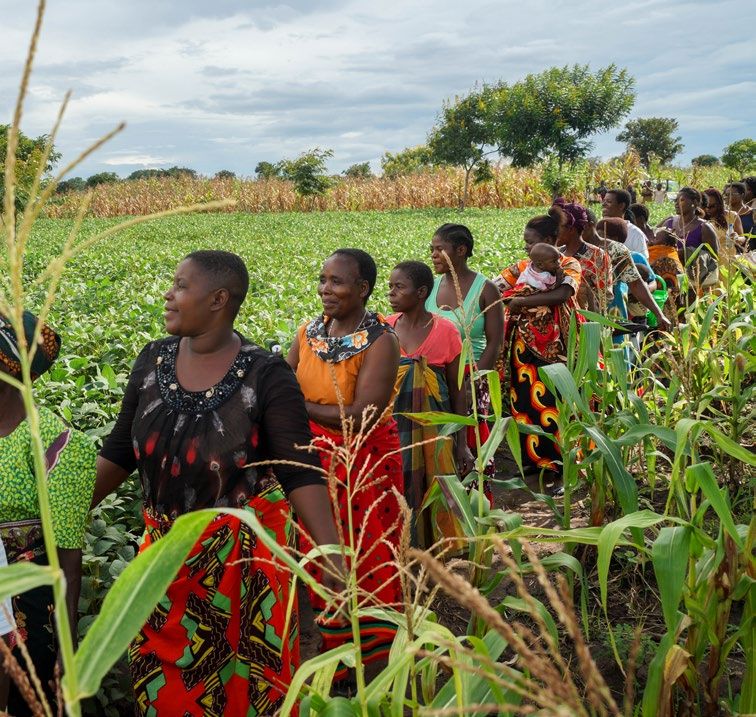
REFERENCES                                              72

ANNEXES (METHODS AND SOURCES)                           90
Methodology of the budget estimates                     77
Table A–1: Sources of budget data and level of detail   78
Table A–1: Sources of budget data and level of detail   79
Table A–1: Sources of budget data and level of detail   80
Table A–2: OECD Sector/Programmes				                   81
Table A–3: Numbers of sector programmes per country     82
Table A–3: Numbers of sector programmes per country     83
Table A–3: Numbers of sector programmes per country     84
Table A–4: Basic country data used in the analysis      85

                                             6
FOREWORD
Science has more recently helped us underscore the importance of nutrition
to social and economic development of households and countries. In order to
achieve positive nutrition outcomes, governments have developed policies and
made particular commitments to address malnutrition but the measurement of
the implementation frequently lacks baseline information. This report is a result
of the analysis by CARE and the Graça Machel Trust (GMT) to provide baseline
information of the implementation of nutrition commitments.

Despite the evidence on the importance of nutrition to national development,
the report has found out that most governments are not meeting the
levels of investment recommended to achieve the nutrition targets in the
Sustainable Development Goals, to which all the countries have committed. The
underinvestment in per child spending compromises the fight against stunting
which is prevalent in the region, by as much as 41% in some countries.

The report recommends the need for national governments to prioritize spending
on nutrition from national sources for sustainability of nutrition outcomes.
Currently, donors dominate nutrition spending in all countries except Kenya.
Governments should own the nutrition agenda by developing relevant policies and
resourcing the instruments for implementation. Nutrition being a multi-sectoral
issue, the report further recommends that governments adopt nutrition sensitive
programming, the areas of main focus being transformation of agricultural
systems, water, sanitation and hygiene (WASH) and women’s empowerment.

Despite the evidence on the importance of nutrition
to national development, the report has found out
that most governments are not meeting the levels of
investment recommended to achieve the nutrition
targets in the Sustainable Development Goals, to
which all the countries have committed.

                                         7
We are very hopeful that this report will be useful to a wide range of actors. CARE
  and the Graça Machel Trust strongly recommend the report to governments
  to support them in exploring mechanisms to increase investments in nutrition
  through national budgets. One such mechanism is to improve dietary diversity at
  household level through the transformation of agricultural systems. We further
  recommend the report to non-governmental organizations (NGOs) and other
  Non-State Actors (NSA) to align their nutrition programming in accordance
  with government commitments, both through the SUN movement and their
  domesticated policies. Beyond governments and NGOs, we hope that this report
  will –in some ways - benefit women, men and children – so that together we
  can see meaningful improvements in the well-being and future of the African
  continent.

  The collaboration between CARE and GMT in supporting the development of
  this report is a demonstration of our long-standing commitment to support
  governments in improving nutrition outcomes in Southern Africa.

  Michelle Carter								                                             Nomsa Daniels
  Managing Deputy Regional Director
                                       Chief Executive Officer
  CARE International, Southern Africa					Graça Machel Trust

‘‘ The collaboration between CARE and GMT in
  supporting the development of this report is a
 demonstration of our long-standing commitment
  to support governments in improving nutrition
                                                                                    ‘‘
           outcomes in Southern Africa.

                                           8
EXECUTIVE SUMMARY
CARE International and the Graça Machel Trust (GMT) through the Civil Society
Organisations Scaling Up Nutrition (CSO SUN) Alliance in East and Southern
Africa (ESA) jointly commissioned a study to establish baseline national budget
nutrition commitments and expenditures. The study was conducted in Kenya,
Madagascar, Malawi, Mozambique, Rwanda, South Sudan, Tanzania, Zambia and
Zimbabwe. The findings are aimed at supporting the East and Southern Africa
CSA SUN (Civil Society Alliance Scaling Up Nutrition) members to engage
with their respective governments to increase their investment in nutrition.
The report will further help non-state actors on how to leverage on such
government investment. It is hoped that increased access to the statistics and
recommendations contained in the report will enhance members’ implementation
of the SUN commitments and lead to increased budgetary allocations.
Although there were some notable reductions in
stunting rates in some countries between 2015 and
2018, the numbers remain worryingly high. Across
the nine countries, a total of 14.8 million children
under-five are stunted.
The report reveals that governments are not adequately prioritising nutrition
spending despite abundant evidence of its importance to individuals, households,
and the national economy. Findings across the nine countries show that
malnutrition is a major problem with far-reaching consequences on households
and national development. For instance, according to SUN Movement, of the nine
countries in the study, Madagascar has the highest rate of malnutrition: 47.3%
of children under-five are stunted. Kenya has the lowest stunting rates at 26%.
The median for the nine countries is 37.6%. Although there were some notable
9EXECUTIVE
SUMMARY
reductions in stunting rates in some countries between 2015 and 2018, the
numbers remain worryingly high. Across the nine countries, a total of 14.8 million
children under-five are stunted. Governments have developed national policies,
action plans and signed up to various global commitments in response to their
respective nutrition challenges. However, the study found that governments have
challenges translating policies and commitments into implementable actions to
effectively address the problem of malnutrition.
A key indicator of a government’s commitment to nutrition is the amount of
resources it allocates and spends through the national budget from its own
resources. The study found that the highest allocation to nutrition of the nine
countries was in Malawi in 2015: 0.58% of its national budget. Including donor
budgets increases this figure to 1.15%. The lowest national budget allocation
to nutrition excluding on-budget donor support is in South Sudan at 0.09%
(although the overall budget allocation to nutrition stands at 0.5% of the national
budget).
The average allocation to nutrition as a share of the national budget across
the nine countries was 0.45%. Donors are providing a significant proportion of
on-budget funding for nutrition associated programmes in countries such as
Mozambique (67%), South Sudan (82.8%) and Zambia (67%). The governments of
South Sudan, Zambia and Mozambique allocate the least share of their national
budgets to nutrition activities from their own resources at 0.09%, 0.25% and
0.33%, respectively. Rwanda allocates the most at 0.80%, followed by Malawi
(0.58%) and Madagascar (0.57%).
The study found that The average allocation
the highest allocation to to nutrition as a
nutrition of the share of the national
nine countries was budget across the nine
Malawi in 2015: countries was
0.58% 0.45%
of its national budget
10EXECUTIVE
SUMMARY
While governments have recorded progress on reducing stunting and
undernutrition, these gains are not sustainable given that the majority of
investment is through donor support either through national on-budget or off-
budget programmes. The report therefore urges governments to aim at spending
at least 3% of their national budgets on nutrition by 2021, beginning in 2018/9 and
progressing each year until this target is reached. This will guarantee more fiscal
resources for nutrition from internal resources for the full implementation of the
nutrition policies and commitments.
Governments and development partners in the nutrition sector should ensure
nutrition is integrated into the national development planning and budgeting
processes. There is need to strengthen sectors’ capacity to integrate nutrition in
the planning and implementation of the respective programmes. Most importantly,
the report recommends that nutrition planning and implementation takes a
multi-sectoral approach informed by evidence. The recommendations contained
in the report are aimed at supporting governments and other stakeholders in the
nutrition sector, to be able respond to fiscal challenges that hinder investment in
nutrition at national level in a coordinated manner.
111
INTRODUCTION
121 INTRODUCTION
During 2008 and 2009, a spike in global food prices and the global financial
crisis sparked concerns for the world’s poorest populations and shed light on
the cost of hunger and malnutrition. The High-Level Task Force on Food and
Nutrition Security was established by the UN (United Nations) Secretary-General
in 2008. In the same year, the LANCET SERIES on maternal and child nutrition1
provided a new evidence base for action on nutrition. It highlighted the high
personal and economic costs of stunting and criticised the failure of a ‘fragmented
and dysfunctional’ international architecture to deal with it2 . This led to the
establishment of a movement comprising governments, the private sector, civil
society and UN agencies in a collective effort to address the global problem of
malnutrition.
Since 2010, from the onset of the Scaling Up Nutrition (SUN) movement,
governments, civil society, private sector and UN agencies have realised the
importance of nutrition. As of 2018, 60 governments have committed to the
principles and ideals of the SUN Movement that seek to address undernutrition in
their countries.
Further, governments have signed up to several global commitments on nutrition.
Most of the global anti-poverty efforts such as the Millennium Development
Goals (MDGs) (2000-2015), Sustainable Development Goals (SDGs), World
Health Assembly (WHA), Nutrition for Growth (N4G), the Rome Declaration on
Nutrition, Malabo Declaration and Africa Union Agenda 2063, among others,
have included nutrition considerations, underscoring its importance to national
and global development. Governments have demonstrated their commitment by
inclusion of nutrition in national development plans, policies and strategies. While
governments have taken these steps on the policy front, they have not matched
these steps with requisite resourcing for adequate and effective implementation.
1 https://www.thelancet.com/pb/assets/raw/Lancet/stories/series/nutrition-eng.pdf
2 http://scalingupnutrition.org/about-sun/the-history-of-the-sun-movement/
During 2008 and 2009, a spike in global food prices
and the global financial crisis sparked concerns for
the world’s poorest populations and shed light on
the cost of hunger and malnutrition
131 INTRODUCTION
Part of the reason for the under-prioritisation of nutrition is its ‘invisible’ nature
compared to more visible development outcomes such as physical infrastructure
in roads, etc. Such thinking ignores abundant evidence of the significance
of nutrition (status) on human welfare and social and economic growth and
development. The Global Nutrition Report (2016) notes: “the costs of neglecting
nutrition are high, causing economic losses of (as much as) 10% of gross domestic
product (GDP)3 .” Governments are custodians of their peoples’ welfare and they
need to harness all the resources that can contribute positively to outcomes such
as good nutrition. Different governments recognise this responsibility by including
it in their national constitutions and other national regulatory frameworks.
It is therefore important to review and track the implementation of the various
commitments to ensure governments continue to prioritise investment and
support ongoing improvement to their national and global commitments to
nutrition. While the report compares investment between countries, individual
performances of governments are more important considering the differences
in the economies and the social and political undertaking. The report has used
2015 a base year data from OECD (Organisation for Economic Cooperation
and Development) and where possible established the variance in performance
between then and now. Further computations have been done using policy and
national budget information provided by the East and Southern Africa Civil
Society Nutrition Network (ESA CSN) focal points, where sources are not included
for tables and graphs, these are based on the consultants’ own computations.
The Global Nutrition Report (2016) notes: “the costs
of neglecting nutrition are high, causing economic
losses of (as much as) 10% of gross domestic
product (GDP).” Governments are custodians of their
peoples’ welfare and they need to harness all the
resources that can contribute positively to outcomes
such as good nutrition.
3 The report is cited in CARE (2017: 17).
142
NUTRITION STATUS,
POLICIES, STRATEGIES
AND CHALLENGES
152 NUTRITION STATUS, POLICIES,
STRATEGIES AND CHALLENGES
OVERVIEW AND STATUS OF UNDERNUTRITION AND
POVERTY STATUS IN THE COUNTRIES
Interventions to improve nutrition status are monitored through a variety of
related indicators; which is why nutrition interventions can also involve multiple
approaches. Figure 1 shows the performance of the nine countries in the East and
Southern Africa countries for four indicators. The average stunting score for the
nine countries was 37.6%, ranging from Kenya’s 26% score to Madagascar’s 49.2%
score. The nine-country average wasting (6.5%) and overweight (5.7%) scores
were comparable (6.5% vs. 5.7%), which was also the general picture across the
individual countries, except for the outlying South Sudan with a wasting rate of
22.7%. On these indicators alone, the greatest absolute variation was in stunting,
with a range of about 20 percentage points.
FIGURE 1
SELECTED NUTRITION INDICATORS FOR 9 ESA COUNTRIES
31,6
9-COUNTRY 5,7
AVERAGE 6,5
36,9
28,4
3,6
ZIMBABWE 3,3
27,6
29,2
6,2
ZAMBIA 6,3
40,0
39,6
5,2
TANZANIA 3,8
34,7
39,6
6,0
SOUTH SUDAN 22,7
31,1
17,4
7,7
RWANDA 2,2
37,9
44,2
7,9
MOÇAMBIQUE 6,1
43,1
28,8
5,1
MALAWI 3,8
42,4
31,8
MADAGASCAR
49,2
25,0
4,1
KENYA 4,0
26,0
0,0 10,0 20,0 30,0 40,0 50,0 60,0
ANAEMIA
UNDER-5
OVERWEIGHT
WASTING
STUNTING
SOURCE: GLOBAL NUTRITION REPORT, 2016
162 NUTRITION STATUS, POLICIES,
STRATEGIES AND CHALLENGES
Child Stunting Child Wasting
Low Height for age Low weight for height
Figure 1 above also shows the rate of anaemia in women of the reproductive age
of 15 to 49. This has implications for expectant and lactating mothers’ health, and
therefore the health of expected and breastfeeding babies, as well as those who
have been weaned off. The nine-country anaemia average stood at 31.6%, while
the individual countries ranged between Rwanda’s 17.4% and Mozambique’s rather
high 44.2%, a variance of 27 percentage points. Figures on Madagascar’s wasting
statistics not available.
FIGURE 1.2
SELECTED NUTRITION INDICATORS FOR NINE EASTERN AND
SOUTHERN AFRICA COUNTRIES
7,7
9-COUNTRY 6,8
AVERAGE 25,1
55,7
6,9
10,5
ZIMBABWE 30,7
41,0
8,3
8,9
ZAMBIA 29,2
72,5
7,6
7,1
TANZANIA 25,6
41,1
10,0
7,5
SOUTH SUDAN 27,8
45,1
6,1
4,0
RWANDA 19,8
87,0
7,8
5,3
MOÇAMBIQUE 21,8
41,0
8,0
5,3
MALAWI 21,9
70,2
6,8
5,4
MADAGASCAR 22,8
41,9
7,6
7,0
KENYA 26,2
61,4
0,0 10,0 20,0 30,0 40,0 50,0 60,0 70,0 80,0 90,0
DIABETES
ADULT OBESITY
ADULT OVERWEIGHT
EXCLUSIVE BREASTFEEDING
SOURCE: GLOBAL NUTRITION REPORT, 2016
172 NUTRITION STATUS, POLICIES,
STRATEGIES AND CHALLENGES
Exclusive breastfeeding to six months is arguably both a child and mother status
indicator: the benefits of the approach to the development of children are well
known. The average exclusive breastfeeding rate among the nine countries is
55.7%, as seen in Figure 1.2 below, ranging from Zimbabwe’s 41% to Rwanda’s
87%. Among the other indicators, adult overweight averages 25.1% ranging from
Rwanda’s 19.8% to Zimbabwe’s 30.7%. However, the rates of adult obesity and
diabetes had the least variance around the nine-country average of 6.8% and 7.7%
respectively, the largest variance being Zimbabwe’s 3.6 percentage points range.
The average exclusive
breastfeeding rate among
the nine countries is
55.7%
182 NUTRITION STATUS, POLICIES,
STRATEGIES AND CHALLENGES
OVERVIEW OF CURRENT POLICY COMMITMENTS
AND TARGETS TO ADDRESS UNDER-NUTRITION
Global concerns over poverty and deprivation date back to the Human
Development Report of 1990, which pioneered the concept and measurement
of human development. This led to the Copenhagen World Summit for Social
Development of 1995, a pioneering anti-poverty initiative involving global
leaders from governments, NGOs (non-governmental organisations) and the UN
(United Nations).
Arguably, the Copenhagen Consensus pioneered the idea of ring-fencing portions
of national budgets for poverty reduction initiatives. The poverty agenda was
furthered by the Millennium Summit of 2000, which spawned the Millennium
Development Goals (MDGs), succeeded by the Sustainable Development
Goals (SDGs) in 2015. These frameworks’ multi-sectoral goals are the basis of
contemporary poverty reduction approaches acceded to by all UN member states;
and attention to poverty and the related phenomena of hunger and malnutrition
feature prominently.
TABLE 2.1
GLOBAL AND REGIONAL FOOD AND NUTRITION SECURITY COMMITMENTS
GLOBAL AND REGIONAL FOOD AND NUTRITION SECURITY COMMITMENTS
WORLD HEALTH NUTRITION ROME DECLARATION ON SUSTAINBALE MALABO
ASSEMBLY FOR GROWTH NUTRITION (2014) DEVELOPMENT DECLARATION
COMMITMENTS COMMITMENTS GOALS (2015) (2014)
(2012) (2013)
Stunting Ensure that Eradicate hunger and all GOAL 1: End Recommitment
TARGET: 40% effective forms of malnutrition, poverty in to the Principles
reduction in nutrition particularly to eliminate all its forms and Values of
the number of interventions stunting, wasting and everywhere. the CAADP
children under-5 reach at least overweight in children Process
who are stunted. 500 million under 5 and anemia
pregnant women in women; eliminating
and children undernourishment and
under 2. reversing rising trends in
obesity;
Anaemia Reduce the Reshape food systems GOAL 2: End Commitment
TARGET: 50% number of through coherent hunger, achieve to Enhancing
reduction of stunted children implementation of public food security Investment
anaemia in under 5 by at policies and investment and improved Finance in
women of least 20 million plans throughout food value nutrition and Agriculture
reproductive age by 2020. chains to serve the health promote
and nutrition needs of the sustainable
growing world population agriculture.
by providing access to safe,
nutritious and healthy foods
in a sustainable and resilient
SOURCE: NTOMBA (2017: 7)
way;
192 NUTRITION STATUS, POLICIES,
STRATEGIES AND CHALLENGES
Each of the foregoing frameworks has goals and targets to which signatories
aspire. Table 2.2 below illustrates the malnutrition targets for the WHA resolutions
of 2012. These targets broadly coincide with those of the other frameworks. For
example, these nutrition aspirations reflect MDGs 1 (hunger), 4 (child survival)
and 5 (maternal survival), SDGs 1 (poverty) and 2 (hunger). Further, they were
reiterated by the Malabo Declaration’s ‘commitment to end hunger by 2025.’
The nine countries in the study all have long-term national development plans
with specific targets on nutrition. These homegrown development blueprints
relate closely to global development strategies, such as the WHA, N4G, SDGs
and others as listed in Table 2.1. Long-term development plans aligned with the
global development strategies create an enabling environment for conducive
international development cooperation.
TABLE 2.2
GLOBAL NUTRITION TARGETS 2025
Target Baseline 2012 Target 2025
40% reduction in the number of children who 162 million 100 million
are stunted
50% reduction of anaemia in women of 29% 15%
reproductive age
30% reduction in low birth weight 15% 10%
No increase in childhood overweight 7% Not more than 7%
Increase in the rate of exclusive breastfeeding 38% At least 50%
in the first 6 months up to at least 50%
Reduce and maintain childhood wasting to 8%2 NUTRITION STATUS, POLICIES,
STRATEGIES AND CHALLENGES
PROGRESS AND KEY CHALLENGES
Across the nine countries, governments have developed national nutrition
policies and integrated nutrition in other development planning mechanisms
such as long-term development, sectoral policies, national budgets and
education curricula at various levels, among others. Further, governments have
worked towards domestication of global and continental commitments such
as the SUN, World Health Assembly, Nutrition for Growth, Malabo Declaration
and the African Union Agenda 2063. However, governments need to improve
coherence and coordination of the various policies that seek to address nutrition.
Overall, governments are making strides to implement their commitments as
demonstrated by fiscal resources allocated through their national budgets.
FIGURE 2.3
99,9%
$128,16
130
92,7%
120
85,2%
110 80,7% 79,8%
$128,01
75,2%
100 73,7% 73,0%
90 65,4%
60,6%
80
70
60
$49,03
50
$39,55
40 $33,10
$30,68 $25,78 $27,75
30
$22,57 $21,77 $22,16
$18,36 $18,80 $19,40
20 $13,67 $15,90
$13,24 $15,65 $12,29
$9,76
10 $9,52
$8,9 $3,49 $2,42 $2,71 $9,48 $0,15 $6,51 $5,87 $6,38 $5,59
0
KENYA
MADAGASCAR
MALAWI
MOÇAMBIQUE
RWANDA
SOUTH SUDAN
TANZANIA
ZAMBIA
ZIMBABWE
9-COUNTRY
AVERAGE
REAST
OSF SSA
TOTAL DONOR SPENDING ON NUTRITION (ON-AND OFF-BUDGET)
SHARE OF DONOR SPENDING FOR NUTRITION
212 NUTRITION STATUS, POLICIES,
STRATEGIES AND CHALLENGES
In 2013, parties to the Nutrition for Growth (N4G) Summit agreed to spend US$30
per child as one of the commitments to tackling undernutrition. The report found
that only Malawi and Rwanda met the N4G target on spending per child. However,
these two governments also fail to meet the same target without donor support.
Malawi and Rwanda spend US$2.42 and US$9.48 per child, respectively, from
their own resources. The other seven countries failed to meet the target even
with combined donor and national budget support. The N4G commitment on
spending per child was premised on the importance of addressing stunting and
undernutrition which have long term negative cognitive impacts on populations
and socio-economic development.
CHALLENGES
Implementation of the nutrition agenda in each of the nine countries is
undermined by inadequate human resources. The country analyses show that the
scarcity of human resources – including high staff turnover, some departing for
‘greener pastures’4, is a major constraint to the effective delivery of the nutrition
agenda. At community level, nutrition programming is driven by government staff
supported by a cadre of community volunteers. Yet, governments have dithered in
several countries over years, on whether community health workers (CHW) should
be volunteers or on the government payroll5.
Political will also affects decisions on the optimal structure of nutrition delivery
and whether the pre-requisite resources are availed on time and in adequate
quantities6. For example, Tanzania under President Jakaya Kikwete, made
significant progress on nutrition through his personal dedication and commitment.
This resulted in nutrition being a high profile issue on the national development
agenda. However, stakeholders in the nutrition sector failed to capitalise on the
immense political goodwill to institutionalise the nutrition agenda for sustainability
of action.
4 ‘Staff turnover’ refers to the loss of staff by an institution (facility; department; etc.),
leading to the loss of institutional memory. It may or may not result in ‘brain drain’: some
staff may simply move (horizontally) within the same institution, sector or employer, such
as a nutrition nurse transferring to a general hospital; but others may follow the various
brain drain channels, from the public health sector to the private health sector, back to
education (brain gain), abroad, or into non-health employment.
5 See Cherrington et al. (2010). Also see Chacha (2017).
6M ichaud-Letourneau (2017) provides a four-perspective framework for reviewing such
political commitment, including the implementation, advocacy, structuralist and people-
centered perspectives, which will feature in Section 4’s discussions.
223
NATIONAL
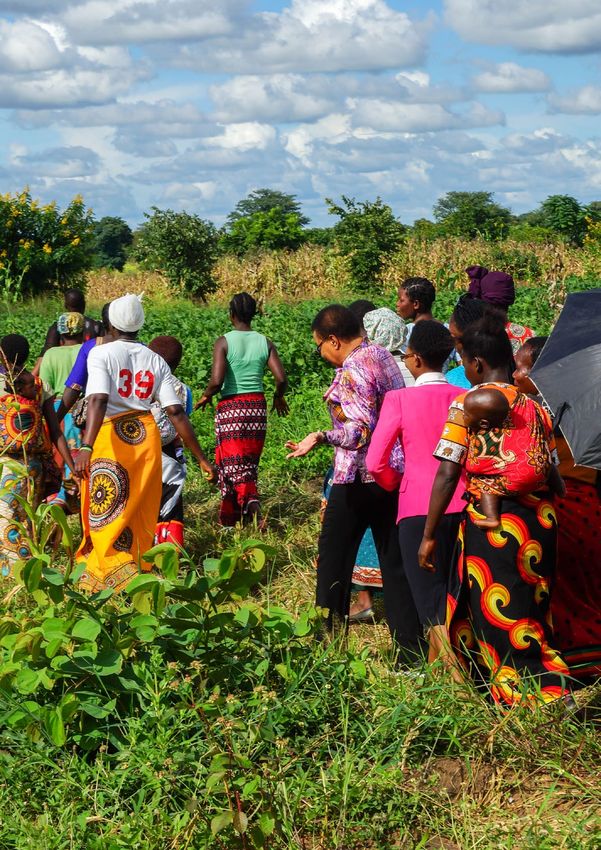
NUTRITION PLANNING
PHOTOGRAPH: CARE 2017
AND MANAGEMENT
233 NATIONAL NUTRITION PLANNING
AND MANAGEMENT
In analysing the national financing of nutrition, the report considered spending
on both nutrition specific and nutrition sensitive interventions. Nutrition specific
interventions address the direct and immediate causes of malnutrition. Nutrition
sensitive interventions address the underlying causes of malnutrition. The
allocation for nutrition in national budgets comprises both governments internal
resources and external support. However, donors contribute nearly half of the
nutrition investment in most countries except Zimbabwe and Rwanda where
governments provide a larger share of the funding through their national budgets.
NUTRITION SPECIFIC INTERVENTION NUTRITION SENSITIVE INTERVENTIONS
Address the immediate causes of Address some of the underlying
undernutrition, like inadequate dietary and basic causes of malnutrition by
intake and some of the underlying incorporating nutrition goals and actions
causes like feeding practices and from a wide range of sectors. They can
access to food. also serve as delivery platforms for
nutrition-specific interventions.
FIGURE 3.1
SHARE OF ON-BUDGET NUTRITION SPENDING IN THE
TOTAL NATIONAL BUDGET
1,46%
0,89%
1,15%
1,12%
0,57%
0,32%
0,98%
0,94% 0,95% 0,92%
0,66%
0,40% 0,47%
0,46%
0,74%
0,80%
0,50%
0,50%
0,57% 0,58% 0,47%
0,42%
0,50% 0,48% 0,57% 0,46%
0,33%
0,25%
0,09%
KENYA
MADAGASCAR
MALAWI
MOÇAMBIQUE
RWANDA
SOUTH SUDAN
TANZANIA
ZAMBIA
ZIMBABWE
ALL 9 COUNTRIES
ON-BUDGET, DONOR SUPPORT (% ON NATIONAL BUDGET)
ON-BUDGET, GOVERNMENT’S OWN (% ON NATIONAL BUDGET)
243 NATIONAL NUTRITION PLANNING
AND MANAGEMENT
Of the nine countries, Rwanda had the highest allocation from own resources at
0.8% of the national budget, while South Sudan had the lowest at 0.09%. Including
donor support, the two countries spent only 1.12% and 0.5% of their national
budget on nutrition, respectively. The average on-budget allocation for the nine
countries was 0.46%.
Ironically, although South Sudan had the lowest allocation from on-budget
resources (see Figure 3.1 above), it had the highest allocation to nutrition as a
percentage of GDP at 8.43%, with Malawi at 1.5%, while Kenya, which has the
largest GDP of all the nine countries, spent the lowest at 0.20%. Overall, the
nine countries spent an average of 0.49% of their GDP on nutrition. Anecdotal
evidence shows that this is in stark contrast to allocations to other sectors such as
education, health and infrastructure.
FIGURE 3.2
SHARE OF DONOR FUNDING TO NUTRITION
82,75%
0,89%
66,96% 66,98%
60,74%
0,40% 50,47%
49,53% 49,01% 0,46%
47,29%
0,80%
28,91%
0,57%
0,00%
KENYA
MADAGASCAR
MALAWI
MOÇAMBIQUE
RWANDA
SOUTH SUDAN
TANZANIA
ZAMBIA
ZIMBABWE
ALL 9 COUNTRIES
253 NATIONAL NUTRITION PLANNING
AND MANAGEMENT
The existence of a variety of inputs that contribute to nutrition status leads to
the distinction between nutrition specific and nutrition sensitive interventions.
That countries have historically not given much attention to nutrition issues is
likely because of the perception, that nutrition (seen as food) is a private- or at
the least, a household-affair guided by cultural values within a budget constraint7,
suggesting a modest government role. Yet, as the definitions above show, nutrition
specific and nutrition sensitive interventions involve very much more than feeding
interventions, which individuals, households and even communities have no
influence over, hence the need for governments to play more critical roles.
The nine countries under the study pay very little specific budgetary attention
to the nutrition sector. How individual governments prioritise specific versus
sensitive interventions should depend on how the political will to address nutrition
interacts with the emerging nutrition status picture and its determinants. However,
the priority interventions each country has already identified provide guidance
to the technical interventions which must then be weighted by the comparative
populations in need.
Figure 3.3 shows data for 41 countries globally including Kenya, Zambia,
Mozambique, Madagascar and South Sudan. Data for the remaining four countries
under the study was not available. The Global Nutrition Report (2017) reveals
that the five countries investing more in nutrition sensitive programming are
Zambia (95%), South Sudan (80%), Mozambique (100%), Madagascar (84%) and
Kenya (100%). The focus on nutrition sensitive investment is commendable as it
demonstrates the desire to integrate nutrition across development sectors.
The nine countries under the study pay very little
specific budgetary attention to the nutrition sector.
How individual governments prioritise specific
versus sensitive interventions should depend on
how the political will to address nutrition interacts
with the emerging nutrition status picture and its
determinants.
7 T
his budget constraint can also be interpreted for self-provisioning households in terms
of the comparative distribution of hours of work on food provision compared to those on
other needs.
263 NATIONAL NUTRITION PLANNING
AND MANAGEMENT
FIGURE 3.3
RELATIVE SHARES OF NUTRITION SPECIFIC AND NUTRITION SENSITIVE
SPENDING, GNR2016
274 NATIONAL BUDGET ALLOCATIONS,
INCLUDING DONOR AID FLOWS
4
NATIONAL BUDGET
ALLOCATIONS, INCLUDING
DONOR AID FLOWS
284 NATIONAL BUDGET ALLOCATIONS,
INCLUDING DONOR AID FLOWS
This section presents analysis of the budget allocation to nutrition including
donor support for each of the nine countries. The analysis is followed by
recommendations on how each government can mobilise, allocate and spend
to achieve their respective nutrition targets. The data used in this section of the
report comprises the consultant’s own computations, analysis of OECD 2015
reports and where possible most recent data on nutrition spending.
294 NATIONAL BUDGET ALLOCATIONS,
INCLUDING DONOR AID FLOWS
KENYA
Of the nine countries, Kenya has the largest GDP of
U$80.8 billion (2015) but allocated only 0.20% of its
GDP to nutrition. As of 2015 Kenya spent 0.94% of its
national budget to nutrition, of which 60.6% was from
donors. The government of Kenya spends U$13.67 per
child against U$30 as per child, which is the Nutrition for
Growth commitment, while donors spend U$8.43 on the same. Even the total
investment between government and donors does not reach the U$30 per child
(Nutrition for Growth Commitment).
Based on the findings of the study, the report recommends that government of
Kenya should:
1. Increase share of nutrition investment in the national budget commensurate
with the size of the economy.
2. Increase spending per child on nutrition to meet the Nutrition for Growth (N4G)
commitment of US$30 per child.
3. Take more ownership on nutrition investment in the country by adopting
pathways of increasing national fiscal commitment to nutrition from the current
scenario where donors are responsible for 60.6% of the nutrition spending.
4. Increase investment on gender and women empowerment as studies have
shown that this has great potential not only to improve the status of women,
but also other development outcomes including nutrition.
304 NATIONAL BUDGET ALLOCATIONS,
INCLUDING DONOR AID FLOWS
KENYA
FIGURE 4.1
ALLOCATION OF ALL NUTRITION SPENDING ACROSS SECTORS
(ON- AND OFF-BUDGET PROGRAMMES)
GENDER (WOMEN’S EDUCATION
EMPOWERMENT)
1,4%
1,1%
ENVIRONMENT & OTHER
2,0%
SOCIAL PROTECTION
AND HUMAN WELFARE
32,4%
HEALTH
23,1%
AGRICULTURE, LIVESTOCK
WATER AND SANITATION & FISHERIES
(WASH)
14,9%
25,0%
SOURCE: COMPUTED FROM 2015 OECD DATA
314 NATIONAL BUDGET ALLOCATIONS,
INCLUDING DONOR AID FLOWS
KENYA
KENYA
TABLE 4.1.2
CONSOLIDATION OF BUDGET ANALYSIS FOR NUTRITION WITH OECD (2015) DONOR AID FLOWS
BASIC STATISTICS VALUE UNITS
Incidence of malnutrition (stunting) among children under-five 31.0% Percent
Number of children under-five stunted 2.24 Million
Value of Gross Domestic Product (GDP) $80,781 million constant 2015 USD
Total National Budget $12,933 million constant 2015 USD
Total on-budget spending for nutrition $121.7 million constant 2015 USD
Total off-budget spending for nutrition $41.1 million constant 2015 USD
Grand total spending for nutrition in the country $162.8 million constant 2015 USD
SHARES OF NUTRITION TO GDP
What is the ratio of all nutrition spending to GDP in the country? 0.20% Percent
What is the ratio of nutrition spending by government to GDP? 0.15% Percent
Shares of nutrition in the national budget
What proportion of the national budget goes to nutrition? 0.94% Percent
What is the proportion if on-budget donor resources are excluded? 0.50% Percent
SHARES OF NUTRITION SPECIFIC ALLOCATIONS
How much of total nutrition spending is nutrition specific? 19.7% Percent
How much of the government’s own resources are nutrition specific? 16.3% Percent
And among donors allocating to government programmes (on-budget)? 20.5% Percent
And among donor programmes outside government (off-budget)? 23.9% Percent
Spending per stunted child in the country
Spending per child in the country, current versus required $8.90 constant 2015 USD
What is the government spending per child? $13.67 constant 2015 USD
What are donors spending per child? $8.43 constant 2015 USD
How much weight are donors carrying in total? 60.6% Percent
324 NATIONAL BUDGET ALLOCATIONS,
INCLUDING DONOR AID FLOWS
MADAGASCAR
Madagascar has made some positive strides on
stunting. The rate of stunting has reduced from
56% recorded in 2015 to 47.3% in 2018. The stunting
rate of 47.3% is still the highest amongst the nine
countries and government and stakeholders need to
invest more to continue to make a dent on malnutrition
and sustain the positive strides made. According to 2015
data, Madagascar’s GDP stood at US$10.87 billion, of which 0.47% was spent on
nutrition. The government spent only 1.46% of its national budget on nutrition,
of which 73.7% was a contribution from donor support. The investment per child
from government’s own resources was US$3.49, compared to US$9.76 from
donors.
The report therefore recommends that the government of Madagascar should:
1. Raise the level of investment in the nutrition sector considering the high levels
of malnutrition e.g. stunting currently at 47.3%.
2. Develop mechanisms to increase the share of national resources spent on
nutrition for more ownership and sustainability of the national nutrition agenda.
3. Prioritise meeting the Nutrition for Growth commitment of US$30 per child
spending on nutrition from the current US$13.24, which is very low to address
acute challenges of malnutrition in the country.
4. Considerably increase investment in (Water and Sanitation because of its
inherent impact on nutrition outcomes.
334 NATIONAL BUDGET ALLOCATIONS,
INCLUDING DONOR AID FLOWS
MADAGASCAR
FIGURE 4.2
ALLOCATION OF ALL NUTRITION SPENDING ACROSS SECTORS
(ON- AND OFF-BUDGET PROGRAMMES)
ENVIRONMENT PRIME MINISTER’S
& OTHER OFFICE
0,7% 5,9%
EDUCATION
5,4% HEALTH
24,0%
SOCIAL PROTECTION AGRICULTURE,
AND HUMAN WELFARE LIVESTOCK & FISHERIES
42,9% 16,1%
WATER AND SANITATION
(WASH)
5,0%
SOURCE: COMPUTED FROM 2015 OECD DATA
344 NATIONAL BUDGET ALLOCATIONS,
INCLUDING DONOR AID FLOWS
MADAGASCAR
TABLE 4.2.1
CONSOLIDATION OF BUDGET ANALYSIS FOR NUTRITION WITH ORGANIZATION FOR ECONOMIC
COOPERATION AND DEVELOPMENT OECD (2015) DONOR AID FLOWS
BASIC STATISTICS VALUE UNITS
Incidence of malnutrition (stunting) among children under-five 56% percent
Number of children under-five stunted 2.16 million
Value of Gross Domestic Product (GDP) $10,878 million constant 2015 USD
Total National Budget $2,343 million constant 2015 USD
Total on-budget spending for nutrition $34.3 million constant 2015 USD
Total off-budget spending for nutrition $16.9 million constant 2015 USD
Grand total spending for nutrition in the country $51.2 million constant 2015 USD
SHARES OF NUTRITION TO GDP
What is the ratio of all nutrition spending to GDP in the country? 0.47% percent
What is the ratio of nutrition spending by government to GDP? 0.32% percent
Shares of nutrition in the national budget
What proportion of the national budget goes to nutrition? 1.46% percent
What is the proportion if on-budget donor resources are excluded? 0.57% percent
SHARES OF NUTRITION SPECIFIC ALLOCATIONS
How much of total nutrition spending is nutrition specific? 13.8% percent
How much of the government’s own resources are nutrition specific? 11.8% percent
And among donors allocating to government programmes (on-budget)? 23.4% percent
And among donor programmes outside government (off-budget)? 3.4% percent
Spending per child in the country, current versus required
What is the government spending per child? $3.49 constant 2015 USD
What are donors spending per child? $9.76 constant 2015 USD
What is the gap required to eradicate malnutrition? ** $42.76 constant 2015 USD
How much weight are donors carrying in total? 73.7% percent
354 NATIONAL BUDGET ALLOCATIONS,
INCLUDING DONOR AID FLOWS
MALAWI
According to OECD reports of (2015), Malawi had
a GDP of US$ 6.45 billion, of which 1.54% was
spent on nutrition. In the same year Malawi had a
budget of US$1.25 billion, of which 1.15% was allocated
to nutrition. The government spending per child was
US$2.42, compared to the donors’ share of US$30.68.
Donors further took a whopping 92.7% of the total
funding to nutrition. The sustainability of action is doubtful in view of huge donor
dependence on nutrition programming. According to OECD reports, stunting
for children under-five was 46% in 2015, but the latest Malawi Demographic and
Health Survey reports a reduction to 37%.
In view of these findings, the report recommends that the government of Malawi
should:
1. As a matter of priority, allocate more financial resources to nutrition from the
national budget as the current reliance on donors to the tune of 92.7% is not
sustainable. The government of Malawi should consider allocating 3% of the
national budget to nutrition for the next 3 years for sustainable nutrition action.
2. Increase the spending per child as the current level is too small compared to the
target of US$30 according to the Nutrition for Growth commitment to which
the Malawi Government is signatory.
3. Invest significantly in nutrition through WASH programmes given the bearing
that water sanitation and hygiene have on nutrition outcomes.
364 NATIONAL BUDGET ALLOCATIONS,
INCLUDING DONOR AID FLOWS
MALAWI
FIGURE 4.3
ALLOCATION OF ALL NUTRITION SPENDING ACROSS SECTORS
(ON- AND OFF-BUDGET PROGRAMMES)
GENDER (WOMEN’S ENVIRONMENT
EMPOWERMENT) & OTHER
1,0% 2,1%
SOCIAL
PROTECTION
AND HUMAN WELFARE
46,5% HEALTH
38,3%
AGRICULTURE,
LIVESTOCK &
WATER AND
FISHERIES
SANITATION
(WASH)
10,3%
1,7%
SOURCE: COMPUTED FROM 2015 OECD DATA
374 NATIONAL BUDGET ALLOCATIONS,
INCLUDING DONOR AID FLOWS
MALAWI
TABLE 4.3.1
CONSOLIDATION OF BUDGET ANALYSIS FOR NUTRITION WITH OECD DONOR AID FLOWS
Basic Statistics Value Units
Incidence of malnutrition (stunting) among children under-five 46.0% percent
Number of children under-five stunted 1.38 million
Value of Gross Domestic Product (GDP) $6,451 million constant 2015 USD
Total National Budget $1,250 million constant 2015 USD
Total on-budget spending for nutrition $14.4 million constant 2015 USD
Total off-budget spending for nutrition $84.8 million constant 2015 USD
Grand total spending for nutrition in the country $99.2 million constant 2015 USD
Shares of nutrition to GDP
What is the ratio of all nutrition spending to GDP in the country? 1.54% percent
What is the ratio of nutrition spending by government to GDP? 0.22% percent
Shares of nutrition in the national budget
What proportion of the national budget goes to nutrition? 1.15% percent
What is the proportion if on-budget donor resources are excluded? 0.58% percent
Shares of nutrition specific allocations
How much of total nutrition spending is nutrition specific? 29.4% percent
How much of the government’s own resources are nutrition specific? 0.6% percent
And among donors allocating to government programmes (on-budget)? 0.0% percent
And among donor programmes outside government (off-budget)? 34.3% percent
Spending per child in the country, current versus required
What is the government spending per child? $2.42 constant 2015 USD
What are donors spending per child? $30.68 constant 2015 USD
What is the gap required to eradicate malnutrition? ** $12.90 constant 2015 USD
How much weight are donors carrying in total? 92.7% percent
384 NATIONAL BUDGET ALLOCATIONS,
INCLUDING DONOR AID FLOWS
MOZAMBIQUE
According to OECD data, Mozambique had a stunting
rate of at 38% in 2015, although the government’s
Technical Secretariat for Food and Nutritional Security
(SETSAN) puts it at 43%. In 2015, the country had a
GDP of US$11,615 million, of which 0.78% was spent on
all nutrition programming. International cooperation
dominates investment in nutrition at 85.2%. In the same
vein, government only spends US$2.71 per child on
nutrition compared to donors whose investments stand at US$15.65 per child.
The bulk of nutrition spending through national budget is through health at 43%
which is usually nutrition specific. Mozambique’s over-dependence on donors for
nutrition spending will not sustain the positive outcomes the country is making in
improving nutrition indicators considering that donor support unpredictable.
In view of the situation and analysis, the report recommends that the
government should:
1. Clearly define the budget vote or nutrition specific and nutrition sensitive
interventions in the key sectors.
2. Integrate and prioritise nutrition into development policies, plans and strategies
at national, regional and local level including in country’s decentralised
authorities and rollout.
3. Ensure that spending per child is increased to the N4G targets of US$30 from
the current US$2.71. Government should further take more ownership on the
nutrition spending as donors carry the most burden at 85.2%.
4. Invest and increase nutrition sensitive budgeting and planning processes.
Government should develop pathways to increase nutrition spending from
current of 0.98% of total national budget to 3% through nutrition sensitive
planning across development sectors and plans.
394 NATIONAL BUDGET ALLOCATIONS,
INCLUDING DONOR AID FLOWS
MOZAMBIQUE
FIGURE 4.4
ALLOCATION OF ALL NUTRITION SPENDING ACROSS SECTORS
(ON- AND OFF-BUDGET PROGRAMMES)
EDUCATION GENDER (WOMEN’S
EMPOWERMENT)
0,1%
1,0%
ENVIRONMENT
SOCIAL & OTHER
PROTECTION
AND HUMAN WELFARE
3,6%
27,8%
HEALTH
43,6%
WATER AND SANITATION
(WASH)
4,5%
AGRICULTURE,
LIVESTOCK & FISHERIES
19,4%
SOURCE: COMPUTED FROM 2015 OECD DATA
404 NATIONAL BUDGET ALLOCATIONS,
INCLUDING DONOR AID FLOWS
MOZAMBIQUE
TABLE 4.4.1
CONSOLIDATION OF BUDGET ANALYSIS FOR NUTRITION WITH OECD DONOR AID FLOWS
Basic Statistics Value Units
Incidence of malnutrition (stunting) among children under-five 38.0% percent
Number of children under-five stunted 1.88 million
Value of Gross Domestic Product (GDP) $11,615 million constant 2015 USD
Total National Budget $4,120 million constant 2015 USD
Total on-budget spending for nutrition $40.6 million constant 2015 USD
Total off-budget spending for nutrition $50.3 million constant 2015 USD
Grand total spending for nutrition in the country $90.8 million constant 2015 USD
Shares of nutrition to GDP
What is the ratio of all nutrition spending to GDP in the country? 0.78% percent
What is the ratio of nutrition spending by government to GDP? 0.35% percent
Shares of nutrition in the national budget
What proportion of the national budget goes to nutrition? 0.98% percent
What is the proportion if on-budget donor resources are excluded? 0.33% percent
Shares of nutrition specific allocations
How much of total nutrition spending is nutrition specific? 26.5% percent
How much of the government’s own resources are nutrition specific? 0.3% percent
And among donors allocating to government programmes (on-budget)? 11.8% percent
And among donor programmes outside government (off-budget)? 41.5% percent
Spending per child in the country, current versus required
What is the government spending per child? $2.71 constant 2015 USD
What are donors spending per child? $15.65 constant 2015 USD
What is the gap required to eradicate malnutrition? ** $19.64 constant 2015 USD
How much weight are donors carrying in total? 85.2% percent
414 NATIONAL BUDGET ALLOCATIONS,
INCLUDING DONOR AID FLOWS
RWANDA
Rwanda is a booming economy and in 2015 recorded
GDP of US$8.6 billion. Of this, 0.98% was dedicated to
nutrition. The country had high rates of malnutrition
with stunting at 43% in 2015, according to OECD, but
the government data shows a reduction to 37.9%. In
2015, Rwanda spent 1.12% of the total national budget on
nutrition. Of this total, 0.80% was supported by donors. The
heavy nutrition investment by donors raises many sustainability
questions. One of the commitments under SUN is the investment
in the First 1000 days from conception to a child’s second birthday. In this regard,
Rwanda spends US$9.48 per child from the government’s own resources while
donors spend USD39.55 per child. Donors are carrying a heavy load on nutrition
investment at 80.7%.
The report therefore recommends that the government should:
1. Increase the investment in food and nutrition through both on- and off-budget
programming through nutrition sensitive planning and budgeting. Government
should explore national mechanisms to increase investment in nutrition at
national level through active involvement of different role-players including the
private sector.
2. Strengthen women empowerment and early child development programmes to
ensure nutrition education is mainstreamed in all national gender related efforts.
3. Ensure budget allocation targets early child development that includes
pregnant and lactating mothers and children under five years.
4. Ensure districts increase their budget allocations on food security and nutrition
specific and sensitive interventions by implementing a multi-faceted nutrition
agenda. Currently 44% of health investment is nutrition-centred – considered
quite high.
5. Improve information, education and communication on food and nutrition to
enable communities and household to better understand practical principles of
nutrition.
424 NATIONAL BUDGET ALLOCATIONS,
INCLUDING DONOR AID FLOWS
RWANDA
FIGURE 4.5
ALLOCATION OF ALL NUTRITION SPENDING ACROSS SECTORS
(ON- AND OFF-BUDGET PROGRAMMES)
GENDER (WOMEN’S
EMPOWERMENT)
8,8%
ENVIRONMENT
& OTHER
5,3%
SOCIAL
PROTECTION
AND HUMAN WELFARE
21,5%
HEALTH
44,6%
WATER AND SANITATION
(WASH)
4,3%
AGRICULTURE,
LIVESTOCK & FISHERIES
15,5%
SOURCE: COMPUTED FROM 2015 OECD DATA
434 NATIONAL BUDGET ALLOCATIONS,
INCLUDING DONOR AID FLOWS
RWANDA
TABLE 4.5.1
CONSOLIDATION OF BUDGET ANALYSIS FOR NUTRITION WITH OECD DONOR AID FLOWS
BASIC STATISTICS VALUE UNITS
Incidence of malnutrition (stunting) among children under-five 43.0% percent
Number of children under-five stunted 0.75 million
Value of Gross Domestic Product (GDP) $8,662 million constant 2015 USD
Total National Budget $2,071 million constant 2015 USD
Total on-budget spending for nutrition $23.3 million constant 2015 USD
Total off-budget spending for nutrition $62.3 million constant 2015 USD
Grand total spending for nutrition in the country $85.5 million constant 2015 USD
SHARES OF NUTRITION TO GDP
What is the ratio of all nutrition spending to GDP in the country? 0.99% percent
What is the ratio of nutrition spending by government to GDP? 0.27% percent
Shares of nutrition in the national budget
What proportion of the national budget goes to nutrition? 1.12% percent
What is the proportion if on-budget donor resources are excluded? 0.80% percent
SHARES OF NUTRITION SPECIFIC ALLOCATIONS
How much of total nutrition spending is nutrition specific? 47.1% percent
How much of the government’s own resources are nutrition specific? 50.5% percent
And among donors allocating to government programmes (on-budget)? 8.6% percent
And among donor programmes outside government (off-budget)? 50.3% percent
Spending per child in the country, current versus required
What is the government spending per child? $9.48 constant 2015 USD
What are donors spending per child? $39.55 constant 2015 USD
What is the gap required to eradicate malnutrition? ** $0.00 constant 2015 USD
How much weight are donors carrying in total? 80.7% percent
44You can also read