Public Information is an Incentive for Politicians: Experimental Evidence from Delhi Elections - Yale ...
←
→
Page content transcription
If your browser does not render page correctly, please read the page content below
Public Information is an Incentive for Politicians:
              Experimental Evidence from Delhi Elections
         Abhijit Banerjee, Nils Enevoldsen, Rohini Pande and Michael Walton∗

                                           April 6, 2020

                                              Abstract

        In 2010, we informed a random set of Delhi councilors, some ineligible for re-election
        in their current ward, that a newspaper would report on their performance shortly
        prior to the 2012 city elections. Using slum dwellers’ spending preferences, we created
        a councilor-specific index of pro-poor spending. Treated councilors increased pro-poor
        spending in high-slum wards. Cross-cutting experiments suggest that the public na-
        ture of report cards, not access to information on public services per se, incentivized
        councilors. Data on party ticket allocation and electoral outcomes shows that, in low-
        information situations, credible public disclosures of politician achievements matters
        to both parties and voters.

1       Introduction
Can government transparency increase politician accountability and make democracy work
better for citizens? In this paper, we consider a specific aspect of this wider question.
Can independent public validation of politician achievements, identified using freedom of
information data, make politicians more responsive to the development preferences of their
    ∗
    Authors are affiliated with mit (Banerjee), Yale (Pande), Harvard (Walton), and unaffiliated
(Enevoldsen), and are listed in alphabetical order. Emails: banerjee@mit.edu, nils@wlonk.com, ro-
hini.pande@yale.edu, Michael_Walton@hks.harvard.edu. For fieldwork and research assistance we thank
Aditya Balasubramanian, Gaurav Chiplunkar, Sarika Gupta, Sandra Levy, Patrick Mayne, Cory Smith,
Yashas Vaidya, Jeff Weaver, and Ariel Zucker. We thank Dominic Leggett and seminar participants for
comments, and usaid div (AID-OAA-G-12-00006), National Science Foundation (1063693), 3ie (OW2.099)
and International Growth Center for financial support. aea rct Registry is AEARCTR-0004975.

                                                  1
electorates? And does the behavior of political parties and the electorate validate politician
responsiveness?
We experimentally test the effect of a credible promise of revealing performance in-
formation to voters in the context of Delhi’s city government (Municipal Corporation)
elections. We find that politicians’ responsiveness to voter preferences increased. It also
altered the pool of politicians: parties weeded out some of those with the weakest records.
Consequently, voters’ electoral choices became more responsive to politician performance.
Delhi is one of the world’s most populous cities. It is divided into wards with a single
councilor elected per ward for a five-year term. A gender quota that rotates across wards
in each election cycle renders a fraction of incumbent male councilors ineligible to re-run
from their current wards (henceforth “ineligible councilors”). (A cross-cutting caste quota
is mostly nonrotating.) A ward’s gender reservation status is only announced a few months
before the election. A party can allocate an ineligible councilor a party ticket (i.e. the right
to be the party candidate) for a unreserved ward. However, it can be difficult for the party
to convey credible information about candidate quality in a new ward.
A councilor enjoys multiple policy levers. She receives an annual fund to spend on local
development, typically the improvement of local infrastructure. She sits on committees
which manage distribution of publicly provided private goods and public goods. More
broadly, she is expected to be responsive to constituent demands.
Our primary field experiment – the newspaper report card experiment – occurred at
scale covering 240 of Delhi’s 272 wards. In 2010, two years prior to city elections, a random
sample of incumbent councilors were informed that, using performance data obtained under
India’s Freedom of Information Act, a leading newspaper would report on their performance
a month before the next election. For a random subset of treated councilors, the newspaper
also immediately published midterm report cards, identical in structure to the final report
cards. The additional midterm report card treatment may have enhanced the credibility
of our primary treatment. However, it may have also had a councilor information effect,
increasing the salience of performance indicators (and current performance). (It may also
change citizen behavior and lead them, for instance, to hold a councilor accountable.)
Within the sub-set of high-slum wards, we therefore implemented a cross-cutting experi-
ment to directly test for a councilor information (or salience) effect absent public disclosure.
Treated councilors received a State of Sanitation Information (ssi) based on audit in three
slums in their ward. This included geolocated information on quality of public toilets and
garbage removal. Two audit reports were provided – eight and two months prior to the
2election. The information was never made public.
To evaluate whether disclosures – either anticipated public or real-time private ones –
better align councilor spending with citizen preferences requires knowledge of citizen spend-
ing preferences (which likely vary by neighborhood characteristics). Here, we make use of
a slum survey that we conducted prior to launching the experiments. Using data from
residents in over 100 high-slum wards on their public spending preferences, we construct
preference weights for spending categories. Our focus on slum dwellers had multiple moti-
vations. First, slum infrastructure investments – for instance, building and repairing drains
– are relatively inexpensive high-return investments for councilors, precisely because slum
infrastructure is so bad. Second, unlike other administrative funds that can only be used
in legal settlements, councilor funds can be invested in slums. Finally, our sampling choice
reflected our interest in whether anticipated performance disclosures can make elected gov-
ernments more accountable to poor citizens.
Figure 1 shows a large divergence between slum dwellers’ infrastructure priorities and
councilors’ spending choices. Nearly 70% of our respondents describe sanitation (sewage
and drainage) as a concern, but only 16% of councilor funds are spent on it, against 54% on
roads, despite the fact that only 2% of our respondents complain about roads. Why do we
see this disparity? We conjecture that electoral returns to local sanitation improvements
are low as they are less visible. Figure 2 provides corroborative evidence: Over a quarter
of respondents believe that their councilor spends the least on sanitation. In comparison,
only 5% believe their councilor spends the least on parks and greenery, and 2% believe she
spends the least on schools. In reality, councilors spend 16% of their budget on sanitation,
but only 7% on parks and greenery and 3% on schools.
Newspaper report cards thus provide an opportunity to inform (and advertise) councilor
performance on sanitation. Therefore, at least for high-slum wards, anticipated public
disclosures should incentivize councilors to move spending towards less visible but highly
valued investments (i.e. in a pro-poor direction).1
Anticipated newspaper report card disclosures led spending allocations of councilors of
high-slum wards to be 0.62 standard deviations more pro-poor. We also observe a 0.37
standard deviation increase in their assembly and committee attendance. The estimated
effects are similar across treatment arms: councilors who only anticipated disclosure in 2012
and those who additionally received a midterm report card in 2010. This argues against
1
We define high-slum wards as wards where the fraction of slum area is above the median value computed
across all wards
3Figure 1: Councilor spending and constituent preferences
54
Roads and lanes 2
16
Sewage and drainage 69
Street lights¹ 8
7
Parks and greenery 0
3
Education and schools 5
1
Garbage removal 54
Other spending areas¹ 12
Water² 73
Electricity² 31
Rations² 28
Health² 8 MCD councilor spending
Law and order² 5 Slum household faced problem
5
¹ Not in household survey
Pension²
² Not an MCD responsibility
0 20 40 60 80
Percent
“MCD councilor spending” is the ward-mean of annual fraction of councilor spending (2007–2012). “Slum
household faced problem” is the ward-mean of slum households who specify each category in response to
the question, “In which of the following areas have you personally faced problems in the last year?”
Household responses are weighted within wards. Bold face indicates areas that are included in
preference-weighted spending measures.
any additional value from early information associated with the midterm report card.
In contrast, actionable information via the private ssi treatment did not improve sani-
tation. This is consistent with our conjecture that the public nature of disclosure matters,
especially for less visible investments. For example, many citizens see public health gains
from sanitation improvements during monsoons, because drains don’t flood. However, they
recognize these gains only if the monsoon floods are sufficiently severe. Additionally, since
wards have about 50,000 residents each, some investments that are locally visible will lack
visibility to voters farther away. This limits the direct spread of information about politician
investments from affected voters to a broader voting public. Newspaper report cards can
amplify information about such investments. First, because many voters routinely obtain
information via newspapers. And second, because parties use them to advertise candidates
to voters. The advertising effect can cause parties to favor allocating party tickets to can-
didates with a good report card, especially where they are less known, because they are
easier to advertise.
4Figure 2: Constituent beliefs and preferences about councilor spending
3.7
Believe that councilor 27.3
spends least on 4.4
2.0
29.4
Believe that councilor 4.9
spends most on 2.5
Roads and lanes
2.4
Sewage and drainage
Parks and greenery
4.4
Education and schools
Prefer that councilor 0.1
would spend less on 6.7
0.1
4.3
Prefer that councilor 32.3
would spend more on 2.9
4.1
0 10 20 30
Percent of households
Each bar represents ward-mean of slum households who specify each category in response to, “What type
of project do you think your councilor spends most (least) on?” and, “What type of project do you think
you councilor spends too much (little) money on?” Household responses are weighted within wards.
Respondents were prompted with project categories. (The figure presents categories included in
preference-weighted spending measures; other prompts were “Water”, “Health”, and “Community centres.”
Beliefs and preferences about spending on garbage collection were not elicited.)
To evaluate this hypothesis for why public disclosures influenced councilor behavior,
we turn to party and voter behavior in the 2012 elections. Four months prior to the
April 2012 elections, the government unexpectedly announced an increase in the number of
wards reserved for women from 33% to 50%. They also decided to randomize the reservation
status of wards. One third of incumbents in our sample were rendered ineligible to re-run for
election from their current ward.2 For ineligible councilors, the party faces a much sharper
decision: Should it allocate a ticket to an ineligible councilor for a different (unreserved)
ward where he will be less well-known (and perhaps have less opportunity to engage in
clientelistic politics)?
The newspaper report card treatment influenced party ticket allocation. Treated incum-
bents were 12 percentage points more likely to run for re-election, with the effect concen-
trated among ineligible councilors. Within this group, ineligible treated incumbents with
a standard deviation more pro-poor spending than their counterparts were 13 percentage
points more likely to get a party ticket for a different ward. We also find suggestive evi-
2
While all councilors would have anticipated some likelihood of being ineligible, the increase in quotas
and choice of reserved wards was a surprise. Consistent with this, we show that report card impacts on
spending are unaffected by a councilor’s subsequent eligibility status.
5dence that the effects were concentrated among ineligible incumbents in high-slum wards,
and that some good performers were moved to other high-slum wards.
Turning to the group of eligible councilors, roughly half of them received party tickets
to run from their current ward while only 2% received a ticket for a different ward. Report
cards don’t benefit better performing councilors when it comes to ticket allocation. Thus,
it appears that the party perceives that electoral benefits from a good newspaper report
card are valuable when a councilor needs to run in a different ward, where he is less known.
Ticket allocation treatment effects among ineligible councilors translate into electoral
gains. (One has to run to gain votes, but running does not guarantee winning.) Treated
ineligible councilors with a pro-poor spending record that is one standard deviation above
counterparts are 23 percentage points more likely to win. In contrast, and consistent with
the absence of ticket allocation treatment effects for this group, we see no treatment effects
on vote share within the pool of eligible councilors.
Good newspaper report cards on ineligible councilors provide the party with reputa-
tional benefits. The incumbent party’s vote share rises in a report-card treatment ward
where the incumbent performed well but was rendered ineligible. This ward-level treat-
ment effect is absent when a high-performing incumbent candidate remained eligible. The
latter may reflect the fact that across eligible councilors there is a second effect at work:
voter displeasure with the party when eligible good performers do not getting a party ticket.
Our final result comes from randomization of the mix of four councilors whose report
cards were published in the same newspaper issue. Conditional on absolute performance,
an ineligible councilor who performs better relative to the other councilors featured in the
same newspaper edition is both more likely to get a party ticket and to receive a higher
vote share. This is further evidence that is supportive of a party advertising view – it is
easier to pitch a candidate when she is the best on the page – but also of an information
view – voters benchmark their candidate relative to the others on the page.
To summarize, anticipated public disclosures led councilors in high-slum wards to move
their spending in a pro-poor direction. The party and electoral impacts of good performance
are concentrated among the group of ineligible councilors. For this group, we posit that
the advertising effect is particularly important since, if they received a ticket, it would be
in a ward where they are less known. Conversely, voters recognize that the party could
not have fielded the candidate in the current ward. The party, therefore, benefits from a
high-performing ineligible councilor’s reputation in the current ward as well.
62 Contribution to the Literature
Observational studies of the impact of media, typically, report a positive link between
media presence and quality of policies but have limited ability to disentangle selection
and incentive effects (Besley and Burgess 2002; Strömberg 2004; Snyder Jr and Strömberg
2010). We provide the first at-scale experimental study, conducted in conjunction with a
daily newspaper, that isolates how media can engender incentive effects for politicians.
Recently, experimental studies on information disclosures have expanded. A first strand
of this literature reports on selection by voters in response to pre-election information
disclosures. These disclosures, especially when publicized by media, are associated with
corrupt incumbents faring worse in subsequent elections (Ferraz and Finan 2008), and
likewise for low-performing incumbents (Banerjee et al. 2011; Kendall et al. 2015). Chong
et al. (2014) highlight that a negative turnout effect can counter this selection effect. The
impacts are also muted or absent when information is delivered through non-media sources
such as pamphlets (Dunning et al. 2019). Finally, the impacts of soft information – for
instance, candidate debates – are sensitive to what the voters infer from it (Bidwell et al.
2019; Wantchekon 2003; Fujiwara and Wantchekon 2013).
A second strand examines politician reactions to information disclosure. In the Philip-
pines, areas where beliefs about incumbent mayoral candidates were most adversely affected
by an information campaign saw more vote-buying (Cruz et al. 2016). Relatedly, candi-
dates in Sierra Leone increased campaign expenditures in areas where candidate debates
were screened (Bidwell et al. 2019).
The final strand, and the one closest to our paper, evaluates longer-term effects of
anticipated disclosures on incumbent behavior. Bobonis et al. (2016) exploits the fixed
schedule of municipality audits in Puerto Rico. Mayors expecting pre-election information
disclosures are honest prior to, but not after, election. In contrast, Avis et al. (2018) observe
durable positive impacts of expected audits in Brazil on corruption among mayors.
Corruption by politicians is sensitive to the electoral incentives they face, at least in
the short run. However, corruption and other governance failures differ in important ways.
First, while accusations and counter-accusations of corruption are common in electoral poli-
tics, the key is to be credible, and to be credible the auditing authority must be independent
and the evidence must be solid. For this reason such exposures are typically rare, unless
a lot of resources are put behind the anti-corruption authority.3 Put differently, credible
3
Avis et al. (2018) emphasize the prestige and credibility of a Brazilian auditor’s job.
7corruption accusations are expensive to bring about and big news when they happen.
Second, behind every corruption investigation there is the possibility of prosecution.
Avis et al. (2018) argue that the fear of prosecution can explain the entire effect on corrup-
tion that they find. While Bobonis et al. (2016) does not disentangle judicial and electoral
incentives, if pre-election report cards attract more attention than those published after,
then the impact could partially come from similar prosecution concerns.
By focusing on councilor performance, captured by information about spending of dis-
cretionary funds, we consider a substantively different, and increasingly important, aspect
of performance. While India and Kenya are among the best-known examples of countries
that provide elected officials with discretionary constituency funds, such funding is on the
rise (International Budget Partnership 2010). The concomitant rise of freedom of infor-
mation acts in lower-income countries makes performance disclosures based on routinely
collected government data increasingly feasible (Mendel 2014). It is possible that councilor
performance in areas valued by voters is less visible and/or the set of voters that have
direct knowledge is relatively small. Both these reasons would suggest that credible and
broad-based transmission of information about councilor fund use can matter.4
In summary, we evaluate the impact of relatively easy to obtain information, whereas
corruption audit studies consider costlier and more sensitive information. The fact that one
works tells us relatively little about whether the other will work.
A closely related paper is Grossman and Michelitch (2018), a field experiment in Uganda
where a cso produced annual performance score cards for politicians. They also find
that public disclosure to citizens was critical; however, unlike our study, they rely on cso
intermediation.5
We trace the full causal chain from the announcement of future report cards, through
politician behavior, all the way to the electoral fortunes of targeted politicians and their
parties. In doing so, we study an important but understudied question: How do information
disclosures influence the competition for party nomination? In related work, Besley et al.
(2017) found that gender quotas increased intra-party competition among Swedish men and
thereby leadership quality.6 As in our paper, they find that binding gender quotas engender
4
The impact of corruption information on electoral outcomes as reported in Ferraz and Finan (2008) are
substantially larger than those of performance information, as reported in Banerjee et al. (2011).
5
The cso created aggregate politician assessment while in our case, the ngo reported spending data, in
part because, as we will see, low and high income voters have different preferences. In addition, the cso
in Uganda disseminated report cards through public meetings (preceded by community mobilization). Our
experiment, by contrast, relied on the newspaper publishing report cards.
6
Our work is also related to papers on gender quotas in Indian politics – for instance, Beaman et al.
8greater selection among men. We provide causal evidence of such a selection mechanism,
since the party responds differently to ineligible candidates with similar spending records
but who differ in whether a report card was produced.
3 Setting and Experimental Design
3.1 Electoral and administrative structure of Delhi
A. Elections
With a population of over 18 million, Delhi ranks among the world’s largest cities. Between
a quarter and a half of Delhi’s population lives in slums (Delhi Human Development Report
2006).7 Delhi has a two-tier elected governance structure: a state legislature and a city
government. We focus on the city government, termed the Municipal Corporation of Delhi
(mcd). Plurality rule mcd elections occur every five years; each of the 272 city wards elects
a councilor. The party/coalition with the majority of councilors controls the corporation.
Our experiments spanned the two years in the run-up to the April 2012 election. Of the
272 incumbents elected in the previous election in 2007, India’s two main national parties,
bjp and inc, had the largest share of councilors at 65% and 25% respectively. Party leaders
nominate candidates for each ward; there are no primaries.
These elections are subject to political affirmative action (quotas), for two groups: sched-
uled castes (SC) and women. Only members of an identified group can stand for election in
a ward reserved for that group. Four months prior to 2012 elections, the Delhi government
announced that gender quotas would increase from 33% to 50% and be stratified by SC
reservation status. Specifically, within each of the categories of SC reserved wards and other
wards, half the wards would be reserved for women.8 Wards in each category were listed by
(ascending) serial number with every odd seat reserved for a woman. Thus, wards reserved
for women were chosen effectively at random.9
(2012) find that quotas increased political entry by women.
7
The difference in estimates reflect differences in slum definition: for instance, whether they only include
notified slums (which were legally notified or declared as slum areas under the Slum Areas (Improvement
and Clearance) Act of 1956) or also include non-notified slums (typically illegal encroachment on land)
(DUSIB 2010). Residential status does not affect voting rights.
8
SC ward reservation is based on their ward population share, with priority given to wards with higher
SC population.
9
One additional level of stratification was used: In 2011 Delhi was split into three separate municipal
corporations, with all wards being assigned to one of the three. The SC reservation was implemented within
9B. Councilor policy powers
Very broadly, councilors have access to four policy levers. First, via legislative activism:
Between 2007 and 2012, the mcd met, on average, 24 times per session. The average
councilor attended 19 times per session.
Second, councilors are assigned to standing committees which are intended to meet
regularly and be responsive to citizen complaints about various government services.
Third, councilors receive an annual discretionary fund for development works in their
ward. The annual amount varies and averaged 200,000 usd per year during the 2007–
2012 election cycle.10 Figure 1 shows the fraction spending in different categories for the
pre-treatment period (2007–09). Alongside, we summarize areas of perceived problems, as
reported in a household survey of slum dwellers and by neighborhood associations (these
surveys are described in the data section). Prima facie there is evidence of a mismatch
between reported needs and spending – we discuss this further in Section 3.3.
Fourth, councilors provide and maintain local public goods including public toilets,
garbage removal, and drain cleaning. Toilets and garbage removal are managed on a con-
tractual basis by private or non-government organizations.11 Councilors help choose the
contractor, and can pressure or sanction them for non-delivery, in addition to directly
spending discretionary funds on fixing toilets or improving the garbage collection process.
3.2 Experimental Design
A. Partners
Our experiment on information disclosure was made possible by three partners. First,
Satark Nagrik Sangathan (sns), or Society for Citizens Vigilance Initiatives, which has a
mandate to promote transparency and accountability in government functioning. It was
involved with the passage of the 2005 Right to Information law (rti), which allows citizens
each municipal corporation and then the reservation for women was implemented separately within each
set of SC reserved and unreserved wards, as described.
10
The amounts were Rs. 7.1M in 2007–08, Rs. 20M in 2008–09, Rs. 5.0M in 2009–10, Rs. 5.0M in 2010–11,
and Rs. 9.5M in 2011–12.
11
The typical toilet contract sets maximum user price, states necessary facilities and requires regular
cleaning. 20–30 year contracts are awarded per facility, with a clause that should “unsatisfactory” condi-
tions fail to be improved within 15 days after notice is given, the contract may be rescinded. Garbage
contracts stipulate that operators provide bins for non-biodegradable and recyclable/biodegradable waste,
and segregate and collect waste daily (IL & FS Ecosmart Limited 2006). The typical garbage contract is
nine years, awarded at the zonal level, and includes a performance evaluation mechanism.
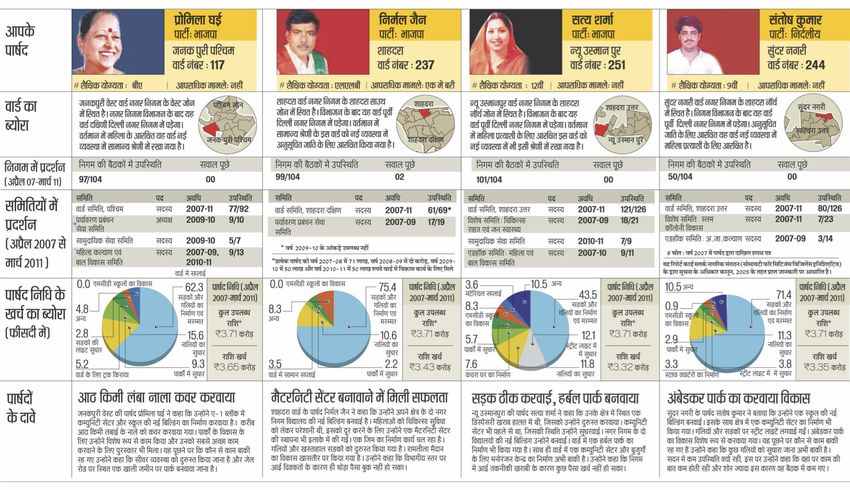
10Figure 3: Example mcd councilor report cards in the Hindustan, 2012
to obtain official information about the functioning of the government. sns has a long
history of creating and then, in partnership with media outlets, disseminating report cards
on incumbent performance and qualifications of leading candidates for state and national
legislatures. Banerjee et al. (2011) evaluated one such experiment during the 2010 Delhi
state elections and found that it increased the vote share of better performing candidates.
Our second partner was a leading Hindi daily newspaper, Dainik Hindustan which, at
the time of our experiment, was the second largest newspaper in Delhi in terms of market
share. The newspaper published report cards on incumbents (prepared by sns) in 2010
and 2012. Figure 3 is an example of one daily report in 2012: it includes report cards
on four councilors. For each councilor, it includes herphoto, patterns of spending from
her discretionary funds, which committees she served on, and her attendance at those
committees. There is no overall assessment or grade provided; rather, the reader is invited
to make her own mind up based on these relatively objective numbers.
Our third partner was the jpal South Asia team that conducted toilet, garbage, and
drain audits and disseminated the State of Sanitation Information privately to councilors.
11B. Newspaper report card experiment
Sample Our sample consists of 240 wards, with treatment assignment stratified on in-
cumbent party and zone.12 We randomly assigned 72 to be control wards, 58 to only receive
pre-election report cards (T1) and 110 to receive both midterm and pre-election report cards
(T2). Figure 4 shows a map of wards in our sample.
Figure 4: Map of Delhi wards by treatment status
Informing politicians about report cards Treatment councilors received a letter in
June 2010 from our partner organization sns. Appended to the letter was a copy of the
first set of report cards published by the newspaper on May 27, 2010. Common text in the
letters across treatment arms was:
sns uses the rti Act to obtain objective information on the functioning of
elected representatives and disseminates this information in the form of Report
Cards. We collaborate with the media to disseminate these Report Cards.
12
We excluded 32 of Delhi’s 272 wards: 5 where sns was doing community work, 10 where by-elections
occurred less than two years ago, and two zones (17 wards) with few or no slums, including rural areas.
12Prior to the Delhi Assembly elections in 2008, sns developed Report Cards to
disseminate information about the functioning of all 70 mlas in Delhi. Similarly,
before to the 2009 Lok Sabha elections, they developed Report Cards on the
performance of about 250 prominent Members of Parliament of the country.
sns ran joint campaigns with Hindustan, the Times of India, Outlook magazine
etc to disseminate these report cards.
sns prepared midterm report cards of mcd councilors to inform people of the
development work being done by councilors for the welfare of ward residents.
Due to limited resources, we have not been able to prepare report cards for all
272 councilors in Delhi. We have randomly selected 110 wards for which report
cards are being prepared. The party-wise break up of the sample is the same
as in the mcd. As you might be aware, these report cards are being published
by the Hindi newspaper Hindustan (please find attached the report cards that
appeared on May 27, 2010 in Hindustan)
The T1 letter then went on to state
Unfortunately, your ward is not in the list of 110 wards for which report cards
are being prepared this time. However, in 2012, we will again be preparing
report cards for these and more wards in Delhi. In 2012, we intend to include
your ward.
The T2 letter instead stated
Your ward is one of the 110 wards for which the report card has been prepared.
In 2012, we will again be preparing report cards for these 110 wards and for
more wards in Delhi. We hope that dissemination of these report cards based
on objective information will help people understand the development efforts
being made by councilors for the welfare and betterment of their wards.
The councilors in control wards received a letter that they were not selected for report
cards and would not be reported on until at least 2014 (two years after the election). All
treatment councilors received a reminder letter in February 2011.
Report card format Our ngo partner sns used the rti Act to obtain data from the
mcd on councilor spending, meeting attendance, and committee membership.
13For midterm report cards, over (roughly) a month starting on May 27th 2010, the
newspaper featured three report cards daily. Each report card included the councilor’s
photo, spending patterns for discretionary funds, and committee attendance. The data
reported on covered the period between April 2007 to March 2009, inclusive.
The 2012 report cards had the same format as those issued in 2010, but were published
in groups of four. They covered the time period between April 2007 to March 2011. As
data is released by fiscal year, we lacked spending data for the last year of the councilor’s
term. The report cards were published in March 2012, the month prior to the election.
On a given day the newspaper featured four councilors. Because of publication constraints,
we were unable to publish all 2012 report cards before the 2012 election. We prioritized
publication of report cards for councilors eligible for reelection. Of 168 report cards for itt
councilors, 124 were published, comprising all report cards for eligible councilors and half
of those for ineligible councilors.See Appendix 8.2 for details. Throughout, we report ITT
estimates.
We use the publication of four report cards on a single newspaper page to evaluate
yardstick competition, i.e. whether parties (and voters) valued a councilor’s relative perfor-
mance. Report card placement on a newspaper page occurred in two steps. First, report
cards were categorized into comparable groups (by zone, eligibility, and "slumminess") and
within each group the wards were grouped into pairs. Next, two pairs were randomly chosen
to feature on the same page.
C. Private State of Sanitation Information (ssi) experiment
Can information on public good provision problems in a ward, absent public disclosure, suf-
fice to influence councilor behavior? To evaluate this possibility, the ssi treatment provided
councilors information on the state of toilets and garbage dumps in slums in their wards.
Recall from Figure 1 that sanitation and garbage were the two categories (where councilors
could act) which slum dwellers identified as the most problematic. The information was
privately conveyed and not put in the public domain.
Sample Our audits covered the sample of 108 high-slum wards where we also undertook
baseline surveys. We undertook a two-stage randomization. First, we randomized state
election jurisdictions into treatment and control and then randomized wards within treat-
ment jurisdictions into treatment and control. In each ward we audited, on average, three
14slums, giving us a sample of 310 slums across 108 wards. See Data Appendix 8.3 for details.
Information reporting The reports were based on public toilet and garbage dump (dha-
lao) audits in each slum.Three ssi audit rounds were conducted, with reports based on the
first two mailed to councilors (and legislators) in treatment groups. The first round of ssi
was distributed in August 2011, about eight months before the elections for councilors,
and the second round was sent in February 2012, only a couple of months prior to the
elections. The first summarized the baseline ssi audits conducted between April and June
2011 (Round 1), and the second compiled ssi audits conducted between November 2011 and
January 2012 (Round 2). The final round of ssi audits occurred immediately after the mcd
elections, from April through June 2012 (Round 3). Cover letters sent to the legislators
along with the audit result, explained the context behind the ssi audits. A cover letter for
the second round ssi audit read in part:
As part of a study on urban poor in Delhi, we conducted a survey in 2010,
which was done with [number of] families of your ward [ward identifier] in slum
settlements and in low-income areas. Of these families, [percentage] reported
that public toilets and sanitation are a major problem for their community, and
[percentage] reported that garbage was a major problem for their community.
You may recall, in September 2011, we sent you a report card in which we high-
lighted the condition of the garbage collection points and public toilet facilities
in your ward’s slum settlements and in low-income areas. We have recently
completed the second round of audits of garbage and toilet facilities in these
areas, and we are again sharing this information with you. We hope this can be
useful in your ward-related work. Our auditors have tried to cover all garbage
points and public toilets in the slum settlements and in low-income areas that
were audited.
Information gathered by our auditors in your ward is enclosed with this letter.
In the first part of the report card there is a summary of the status of audited
garbage and toilet facilities, and in the latter part, their details. We are also
enclosing a map of all these facilities where your attention is needed. Each
facility has been assigned a code which is placed on its location on the map, so
that you can easily identify it.
15Figure 5: Experiment timeline
Parties
finalized
Gov’t informed rolls
2007 MCD We informed
councilors councilors
Elections of eligibility 2012 MCD
of treatment
Elections
2007 2008 2009 2010 2011 2012 2013
Councilor spending data
period reported at midterm
period reported at pre-election
full term (never reported)
Newspaper publication
midterm pre-election
SSI audits
1 2 3
SSI mailings
1 2
Household surveys
1 2
Information on the state of drains was collected, but not shared with politicians, during
the second and third rounds of ssi audits. Spillover effects on this service could have been
positive, if, for example, the audits made them more aware of the problems in those slums,
or negative if there was a diversion of effort away from drains.
Figure 5 summarizes the experiment and data collection timeline.
3.3 Data and Descriptive Statistics
Our experiments, and subsequent analysis, draw upon multiple sources of data.
A. Citizen preferences and slum incidence
We use aerial data on slum incidence to define a high-slum ward dummy that equals one if
the fraction of slum area in that ward exceeds the median value across all wards (about 1%).
High-slum wards have a mean of 7% slum area across 3.1 slums. Low-slum wards have a
mean of 0.1% slum area across 0.7 slums. Data Appendix 8.1 describes our ward selection,
16and our sample frame of slums. In April–May 2010 (prior to launching our experiment),
we surveyed 5,481 slum households in 107 wards.13 Survey respondents were typically
long-term migrants: our average respondent had lived in Delhi for seventeen years.
Figure 1 shows low alignment between (category-wise) councilor spending and problem
areas identified by slum dwellers. Councilors spend a majority of their funds (57%) on
roads, an area with significant corruption in contracting (Lehne et al. 2018). Roads are also
a visible form of infrastructure investment. Arguably, both factors make road investments
valuable to councilors. In contrast, slum dwellers report clean water, sewage management,
and garbage collection as the most problematic issues. Water in Delhi is privately provided
and is beyond the remit of the councilors; however drains and toilets are not. Despite
this, spending on drains and toilets at 17% constitutes a low proportion of councilor funds
(relative to roads). The next two highest expense categories for councilors also do not meet
slum dwellers’ interests: provision and repair of lights (8%) and improvement of parks and
provision of gates (7%). In particular, slum dwellers express no interest in spending on
parks and greenery, which are typically located in non-slum neighborhoods.
Figure 2 reports slum dweller beliefs and preferences over councilor spending. Over
a quarter believe that councilors spend the most on roads and the least on sanitation.
Roughly a third would like the councilor to spend more on sanitation.
A comparison of actual spending with slum dweller beliefs (Figure 1 and Figure 2)
suggests that more visible infrastructure spending items (roads and parks and greenery)
are more salient to slum dwellers. For instance, respondents strongly believe that councilors
spend less on sewage and drains than on parks and greenery. In reality, councilors spend
twice as much on sanitation as on parks and greenery.
In 94 of these wards we surveyed 250 office-holders of Resident Welfare Associations
(rwas) which represent households with legal status in the ward (and which are, on average,
richer than slum dwellers).14 Slum dwellers and rwa residents have different preferences:
rwa residents are ten times more likely to name roads as an important problem, put less
(but still substantial) emphasis on sewage, drainage, and garbage disposal and are keen on
parks and street lights, two items that the slum dwellers never name.15
13
This was intended to be identical to the audit sample. Due to slum mis-identification and other
surveying errors, the survey sample does not include four audit wards, but includes three other wards.
14
rwas are neighborhood associations that can formally interact with state agencies (Government of
National Capital Territory of Delhi 2014). Our rwa sample was drawn from the Delhi government list,
which we matched to wards based on the rwa’s stated address. Not all survey wards had registered rwas.
15
Detailed results are available from authors on request.
17B. Councilor performance data
sns collated councilor performance data for all wards; only treatment ward data was sub-
sequently released as newspaper report cards. The report card included category-wise
spending of discretionary funds by the councilor (see Figure 1).16
We combine these data with survey data on slum dwellers’ preferences for infrastructure
to construct a pro-poor spending index as follows. We use a five category spending classifi-
cation: Roads and lanes, Sewage and drainage, Parks and greenery, Education and schools,
and Garbage removal. We weight each spending category by slum dweller preferences. We
use three measures of slum dweller preference to create three separate indices: the fraction
of slum households in the city reporting (1) that the issue is the biggest problem in their
area, (2) that it is a problem for them, or (3) that it is a problem for the community. For
each weighting criteria, we calculate the sum of the logs of each weighted spending amount
(wherever the value was zero it was bottom-coded to the first percentile of the spending
distribution, prior to taking logs). The mean z-score of these three log-weighted spending
measures serves as our pro-poor spending index. We also report the three log-weighted
spending measures as separate outcomes.
The report card also reported councilors’ assembly and committee attendance which
were, on average, 81% and 66%, respectively. Our second measure of councilor quality
is an attendance index which is the mean z-score of attendance in: (1) mcd’s general
assembly and (2) mcd committees of which the councilor is a member. We focus on absolute
committee attendance, without regard to the number of meetings per committee. The pro-
poor spending index and the attendance index are positively correlated with ρ = 0.10.
C. Audit data from SSI
All audits covered toilets and garbage points (dhalaos) and the second and third audit also
covered drains. In each case, the auditor identified all alternatives. Auditors asked slum
dwellers where they disposed of their trash and which public toilet they used. Any garbage
disposal point or public toilet was audited when at least three residents reported using it.
16
The categories were: (i) roads and lanes (construction and repair); (ii) sewage and drainage (including
toilets); (iii) street lights; (iv) parks and greenery; (v) education and schools (improvement of mcd schools);
(vi) garbage removal (supply of material, trucking; construction of garbage dumps; removal of malba (rub-
ble)); and (vii) other. “Other” included: construction of mcd offices; improvements to staff quarters, katras
(high-slum-index tenements), community centers, and health centers; construction of boundary walls; pro-
viding grills on chabuttras (monuments); and street name boards.)
18During a facility audit the surveyors noted its quality and interviewed two respondents
to obtain data on frequency of cleaning and prices. For usage, the surveyor counted how
many people used the toilet in a randomly chosen 15 minute interval between 3–5 pm.
D. Electoral data
For the April 2012 election we obtained ward-level electoral data: turnout, candidate list
(with party) and candidate-wise vote-share. We also collected data on ward reservation
status. For each incumbent councilor we coded a dummy which is equal to one if the quota
rendered him ineligible for re-contest from his current ward. One third (80 of 240) of our
incumbent councilors were ineligible.
Consistent with the idea that parties exercise choice in ticket allocation, the fraction of
incumbents who did not re-run exceeds the fraction affected by quotas. Only two fifths (95
of 240) of incumbent councilors contested an election in any ward, including just over half
(87 of 160) of those who were eligible to re-run in the same ward.
3.4 Implementation and Balance Checks
In late May and June 2010, mid-term report cards were published. Actual treatment was
close to itt: 109 of the 110 councilors were reported on, excluding one ward in which the
councilor had died. In June 2010 letters were sent out to treatment councilors.
In March 2012, the second round of report cards was published. Newspaper space
constraints resulted in actual treatment being significantly lower than itt. 124 report cards
were published: 45 of the 58 T1 wards and 79 of the 110 T2 wards. Across itt councilors,
we randomized the order in which report cards were published, but we prioritized report
cards of councilors eligible for reelection. Data Appendix 8.2 provides details.
Throughout, we estimate itt effects. Appendix Tables A.I and A.II provide balance
checks. Panels A and B of Appendix Table A.I consider pre-treatment councilor spending
outcomes (for 2007–09) for all wards and for slum-survey wards, respectively. Panel C
considers slum households self-reports on problem areas over the last year. We observe
no differences between treatment and control wards. Appendix Table A.II considers 2007
electoral outcomes as the dependent variable. We observe no differences between treatment
and control wards for number of registered voters, turnout, seat reservation, or number of
candidates, but 5.6% percentage points higher vote share among eligible treated councilors
(significant at 10%).
194 What to expect
Political agency models assume that citizens infer a politician’s type (say, how much she
cares about the voter’s welfare) from imperfectly observed politician actions. A politician’s
inferred type influences whether her party will select her to run again and whether voters
subsequently vote for her. We discuss how, in such a setting disclosures – public or private
– alter politician, party, and voter behavior.
4.1 Impact on councilor behavior
First, consider the newspaper disclosure treatment. Re-election concerns should cause a
councilor to choose policies that result in a report card that appeals to party leaders and/or
voters, assuming that she believes that these groups condition their choices on performance
metrics in report cards. Presumably all voters want total spending of discretionary funds
maximized. Meeting attendance should also be an unambiguous good, unless citizens favor
councilor actions unobserved to us and there is a time budget constraint.
The effect on spending composition is less clear; slum residents and wealthier residents
have different preferences, and incumbents’ spending decisions, on average, favor wealthier
residents and visible infrastructure. Given this, we evaluate a narrower hypothesis: in slum-
dense wards, treated councilors should better align spending decisions with the public good
preferences of low-income voters. Such alignment is favored by the fact that newspaper
report cards make it easier to transmit information about less visible but valued public
goods to a broad population. By contrast, building a new park, a visible public good that
rwa owners want, is expensive in land-scarce Delhi.
Both report card treatment arms should create incentive effects, though the additional
credibility of T2 (midterm and pre-election report card) may plausibly increase its impact.17
In addition, the T2 treatment may have a councilor information effect if midterm report
cards raise the salience of certain issues to councilors or provide them new information. For
instance, since total spending in any single category reflects spending on multiple projects
in different locations and years, councilors may not recognize the composition of their own
spending and/or benchmark it correctly against spending by other councilors. On the other
hand, this source of difference between T2 and T1 councilors is unlikely to be large; after
all, T1 councilors could have collated the data to construct their own report cards.
17
Avis et al. (2018) highlights the credibility effect by comparing municipalities that differ in whether, in
addition to a pre-election corruption report, the municipality received a corruption report at start of term.
20Thus, a comparison of T1 and T2 may have limited power to disentangle the incentive
and councilor information effects, especially since activism by citizens informed by the
midterm report cards about councilor performance may strengthen T2 incentive effects.
In the private ssi experiment, we test the hypothesis that providing information just to
the councilor can improve service delivery. The audit focused on public goods that corre-
spond to slum dwellers’ stated priorities (sanitation and garbage) and that lend themselves
to simple improvements by a councilor: she could use discretionary funds to fix the toilets,
monitor contractors who run the toilets, and pressure on municipal employees in charge
of garbage collection. However, these also happen to be public goods where improvements
are either less visible (repairing sewer systems) or require ongoing maintenance (toilets and
garbage). If the councilors believe that a sufficient number of voters may not learn about
their investments, then improving councilor information may not be enough to incentivize
a councilor to improve performance.
4.2 Impact on party and voter behavior when quotas exist
By providing voters new information about their councilor or increasing its salience, news-
paper report cards may change their voting preferences. Better performers should benefit,
because voters will interpret good performance as indicative of a type that will also do more
in the future. The one complication is if, knowing that a councilor was anticipating a report
card, voters discount the signalling aspect of performance. In this case, a treated councilor
with the same performance as a councilor in a control ward may attract less support (unless
voters value the ability or willingness to respond to incentives). However, we have little
reason to believe voters knew that politicians were forewarned.
Second, based on the incumbent’s performance voters may conclude that the party does
(or does not) care about voters like them.
Third, by informing party leaders about councilor performance, newspaper report cards
could affect parties’ rankings of councilors in terms of electability and contribution to
positive party image. This should increase the likelihood that a high performing treated
councilor receives a party ticket for the upcoming election.
Fourth, even if party leaders don’t receive new information on a candidate, they may
recognize that voters prefer high performers. This effect may be most important when
voters do not know the candidate (e.g. because the candidate needs to change wards). A
positive and credible report card is a good way to present a new candidate. We call this
21effect on the party selection process that happens even when the party learns nothing new,
an advertisement effect.
In addition, by printing four report cards daily in 2012, the newspaper allowed voters to
benchmark their councilor performance. Our baseline survey shows constituent pessimism
about councilor spending: Of the 81% of slum households who answered a question on their
councilor’s relative performance, 71% thought he spent less money than other councilors.
(9% thought more, and 20% thought about the same.) Thus, report cards could improve
perceptions of a councilor, by showing that he was not performing relatively worse than
the others. This should favor all treated councilors (unless voters extended inference to the
untreated councilors). Further, it should encourage voters to benchmark their councilor’s
performance against those of others on the same page: controlling for actual performance,
being a better performer among the four featured councilors should attract more votes.18
Expansion of gender quotas strengthened the party selection effect for incumbents who
were rendered ineligible to run in their ward. The party had to decide whether to give
these councilors a ticket from another ward; information that an ineligible councilor is a
high-performer may sway the party decision.
Finally, turning to the ssi experiment, better performance based on improved informa-
tion about where to invest in local public goods would benefit a councilor electorally only
if a substantial number of voters and/or the party observe improvements in the quality of
local public goods and attribute these improvements to the councilor. The localized and
less visible nature of the investments highlighted in the audits makes it likely that, absent
public disclosures, such information transmission doesn’t occur.
4.3 Summary of likely treatment impacts
If councilors believe that newspaper report cards provide voters with information or make
known information salient, then being treated should incentivize better performance. In
high-slum wards, this should increase pro-poor spending. Informing only councilors (via
audits) will similarly incentivize them only if they believe that a sufficient number of citizens
or the party will learn about subsequent performance improvements.
New information or greater salience of known information should cause voters to favor
better performers. With newspaper report cards, they should favor the better performers
18
There is a potential countervailing effect: poor performance of all councilors may cause citizens to vote
for someone outside of mainstream parties or depress turnout.
22among those published in the same newspaper edition.
The information and advertisement effects associated with newspaper report cards
should lead parties to favor good performers in treatment wards when allocating party
tickets. The advertisement effect is likely to be important in selecting which councilors to
move to new wards where the voters do not know the candidate.
A well-performing incumbent’s party should benefit from her performance. This is
clear-cut where an incumbent’s ineligibility requires the party to field a new candidate: the
candidate will benefit from the party reputation. This is less obvious where the incumbent
is eligible, because as we noted, a substantial fraction of eligible incumbents do not re-run
presumably because parties want someone else. When a well-performing eligible incumbent
gets replaced (say, because of internal party politics) voters may punish the party.
Finally, as incumbents’ eligibility status was only determined four months before the
election, we don’t expect the incentive effects of the treatment to be influenced by a coun-
cilor’s ultimate eligibility status.
5 Does information influence councilor behavior?
We start with the newspaper report card treatment and examine evidence on an incentive
effect for councilors who anticipate performance disclosures prior to the election.
5.1 Anticipated public disclosures: Newspaper report cards
A. Specification
We consider ancova specifications, which allow for smaller changes in wards with high
baseline investments in that outcome, to estimate newspaper treatment effects in ward w:
yw1 = αyw0 + βT reatw + Xw + w , (1)
yw1 = αyw0 + βT reatw + γHighw + λT reatw × Highw + Xw + w , (2)
yw1 = αyw0 + βT reatw + γHighw + δIneligw + λT reatw × Highw + µT reatw × Ineligw
+ νHighw × Ineligw + ξT reatw × Highw × Ineligw + Xw + w , (3)
23T reatw is ward treatment status, Highw is a high-slum ward indicator, Ineligw is whether
the councilor is ineligible for reelection in that ward, Xw is a stratum fixed effect ( zone–
party combination), and other variables are described below. The main tables report itt
estimates where we pool the T 1 and T 2 treatment arms.
Our councilor performance measures yw1 include: log total spending, a pro-poor spend-
ing index, a councilor attendance index, and components of both indices. All outcomes are
measured for post-treatment fiscal years 2010 and 2011. The lagged dependent variable,
yw0 represents the average for pre-treatment fiscal years 2007–2009 of the same variables.
The equation (1) specification considers average treatment effects for the full sample.
Equation( 2) examines heterogeneous treatment effects across high- and low-slum-density
wards. A final source of random variation comes from quota-induced councilor ineligibility.
Equation (3) examines what happens when we also control for eventual ineligibility.
B. Results
Table I presents our main specifications. Councilors typically spent their entire budget.
Reflecting this, columns (1)–(3) show that anticipation of report cards has no effect on log
total spending, estimated precisely, either on average or in high-slum wards. Councilor
ineligibility for future elections also doesn’t affect overall spending.
Columns (4)–(6) consider our primary incentive outcomes: the pro-poor spending index.
The treatment impact on councilor spending depends on ward type: column (4) shows no
overall treatment impact on spending. However, column (5) shows a large negative (but
noisy) impact on pro-poor spending in low-slum wards, and relative to these treatment
wards, a large positive impact on high-slum treatment wards (higher by 62% of a standard
deviation). Column (6) shows that councilor ineligibility has no impact on nature of spend-
ing, in high- or low-slum wards. As a robustness check, Appendix Table A.VII presents
specifications using an alternative definition for being high-slum: whether the ward was in
our household survey sample. Recall that a survey selection criterion was (verified) slum
density. Unsurprisingly, we see similar results to the main specification.
Appendix Table A.VI presents specifications where spending outcomes are individual
spending categories. While the impacts are noisily estimated, treated councilors in high-
slum wards spent more on drainage and sewage – column (2) – and less on schools and
parks – columns (4) and (6).
Columns (7)–(9) of Table I report on the attendance index. Interestingly, the pattern
24You can also read