Did California's Shelter-In-Place Order Work? Early Coronavirus-Related Public Health Effects - IZA DP No. 13160 APRIL 2020 - IZA Institute ...
←
→
Page content transcription
If your browser does not render page correctly, please read the page content below
DISCUSSION PAPER SERIES

IZA DP No. 13160

Did California’s Shelter-In-Place Order
Work? Early Coronavirus-Related Public
Health Effects

Andrew I. Friedson
Drew McNichols
Joseph J. Sabia
Dhaval Dave

APRIL 2020
DISCUSSION PAPER SERIES

IZA DP No. 13160

Did California’s Shelter-In-Place Order
Work? Early Coronavirus-Related Public
Health Effects

Andrew I. Friedson Joseph J. Sabia
University of Colorado Denver San Diego State University and IZA
Drew McNichols Dhaval Dave
University of San Diego-California and Bentley University, IZA and NBER
San Diego State University

APRIL 2020

Any opinions expressed in this paper are those of the author(s) and not those of IZA. Research published in this series may
include views on policy, but IZA takes no institutional policy positions. The IZA research network is committed to the IZA
Guiding Principles of Research Integrity.
The IZA Institute of Labor Economics is an independent economic research institute that conducts research in labor economics
and offers evidence-based policy advice on labor market issues. Supported by the Deutsche Post Foundation, IZA runs the
world’s largest network of economists, whose research aims to provide answers to the global labor market challenges of our
time. Our key objective is to build bridges between academic research, policymakers and society.
IZA Discussion Papers often represent preliminary work and are circulated to encourage discussion. Citation of such a paper
should account for its provisional character. A revised version may be available directly from the author.

 ISSN: 2365-9793

 IZA – Institute of Labor Economics
Schaumburg-Lippe-Straße 5–9 Phone: +49-228-3894-0
53113 Bonn, Germany Email: publications@iza.org www.iza.org
IZA DP No. 13160 APRIL 2020

 ABSTRACT
 Did California’s Shelter-In-Place Order
 Work? Early Coronavirus-Related Public
 Health Effects*
 On March 19, 2020, California Governor Gavin Newsom issued Executive Order N-33-20
 2020, which required all residents of the state of California to shelter in place for all but
 essential activities such as grocery shopping, retrieving prescriptions from a pharmacy, or
 caring for relatives. This shelter-in-place order (SIPO), the first such statewide order issued in
 the United States, was designed to reduce COVID-19 cases and mortality. While the White
 House Task Force on the Coronavirus has credited the State of California for taking early
 action to prevent a statewide COVID-19 outbreak, no study has examined the impact of
 California’s SIPO. Using daily state-level coronavirus data and a synthetic control research
 design, we find that California’s statewide SIPO reduced COVID-19 cases by 125.5 to 219.7
 per 100,000 population by April 20, one month following the order. We further find that
 California’s SIPO led to as many as 1,661 fewer COVID-19 deaths during the first four
 weeks following its enactment. Back-of-the-envelope calculations suggest that there were
 about 400 job losses per life saved during this short-run post-treatment period.

 JEL Classification: H75, I18
 Keywords: coronavirus, COVID-19, shelter in place order, synthetic control

 Corresponding author:
 Joseph J. Sabia
 Department of Economics
 San Diego State University
 5500 Campanile Drive
 San Diego, CA 92182-4485
 USA
 E-mail: jsabia@sdsu.edu

 * Sabia acknowledges research support from the Center for Health Economics & Policy Studies (CHEPS) at San
 Diego State University, including grant support received from the Charles Koch Foundation and the Troesh Family
 Foundation. We thank Kyutaro Matsuzawa, Isaac Baumann, Cameron Milani, Alicia Marquez, James Curry, and
 Samuel Safford for excellent research assistance on this project. We also thank Donald Kenkel, Daniel Hamermesh,
 David Powell, Sebastian Tello-Trillo, Jason Fletcher, Ben Hansen, Sarah Stith, Laura Argys, Susan Averett, David
 Neumark, Daniel Rees, and Nicolas Ziebarth for helpful comments and suggestions that helped to improve this paper.
1. Motivation

 "I simply do not know if our aggressive actions early on ... have had the intended
 effect … I certainly am hoping and praying that that is the case. We still need the
 data to confirm that.”
 - Grant Colfax, San Francisco Director of Public Health, March 31, 2020

 The 2020 U.S. coronavirus outbreak is one of the most serious public health challenges in

American history. The U.S. has seen more reported COVID-19 cases between January 1, 2020

and April 16, 2020 than reported polio cases between 1910 and 2010 (Ochmann and Roser

2020). The transmission of COVID-19 is presently believed to occur largely through exposure to

respiratory droplets, usually emitted during coughing, sneezing, or nose-blowing (Centers for

Disease Control and Prevention 2020a), but may also occur through natural respiratory expulsion

(Fineberg 2020). The primary strategies suggested by governments worldwide to reduce the

spread of COVID-19 have been frequent handwashing, mask-wearing in public, and social

distancing (Australian Government Department of Health 2020; Public Health England 2020;

Public Health Agency of Canada 2020; White House 2020).

 In contrast to many countries throughout the world, many of the authorities used to

combat public health threats in the United States rest not with the Federal government, but

largely with state and local officials. The primary state and local policy strategy to prevent the

spread of coronavirus is the enactment of shelter-in-place orders (SIPOs), sometimes called “stay

at home” orders. The State of California was at the forefront of issuing comprehensive SIPOs as

the COVID-19 crisis unfolded nationwide. On March 17 and 18, 2020, 12 California counties

 1
and the City of Berkeley adopted SIPOs. 1 And on the evening of March 19, Governor Gavin

Newsom announced the nation’s first statewide SIPO, earning immediate attention in the

national news media. California Executive Order N-33-20 2020 stated:

 “To protect public health, I as State Public Health Officer and Director of the California

 Department of Public Health order all individuals living in the State of California to stay

 home or at their place of residence except as needed to maintain continuity of operations

 of the federal critical infrastructure sectors…” (California Executive Order N-33-20

 2020).

 This statewide executive order required all California residents to remain in their homes

for all but essential activities such as purchasing food or medicine, caring for others, exercise, or

traveling for employment deemed essential. While grocery stores, pharmacies, restaurants

providing takeout or delivery service, and other essential businesses were permitted to remain

open, most other non-essential businesses were ordered closed. 2 In addition, residents were

advised to continue to maintain a six-foot distance with non-household members with whom

they come in contact and public gatherings of non-household members were strongly

discouraged.

 Violations of the SIPO were subject to a $1,000 fine and up to 6 months of imprisonment

(Allday 2020), though enforcement most often occurred through social pressure and warnings for

1
 On March 16, Los Angeles Mayor Eric Garcetti implemented a non-essential business closure order. The seven
counties that adopted a SIPO on March 17 were: Alameda, Contra Costa, Mendocino, San Francisco, San Mateo,
Santa Clara, and Santa Cruz. The five counties that adopted a SIPO on March 18 were: Monterey, San Benito,
Solano, Sonoma, and Ventura.
2
 California’s statewide SIPO was soon followed by the closing of many public parks or beaches (California
Department of Parks and Recreation 2020), driven in part by public outrage over the surge in beach parties and
picnics immediately following the executive order (Kopetman 2020).

 2
first offenses. State SIPOs appear to have had increased social distancing (Abouk and Heydari

2020; Fry 2020), with non-essential travel falling 40 to 60 percent following California’s SIPO

(COVID-19 Community Mobility Report).

 In issuing the SIPO, Governor Newsom implored residents of California “to meet this

moment and flatten the curve together” (Romero 2020). Thus, an important policy rationale was

not simply to curb the pandemic’s growth in California, but also to delay its peak, allowing the

state additional time to obtain the necessary ventilators, hospital beds, and medical staff in place

to meet the surge in demand for services among those who test positive (Baker and Fink 2020;

Greenstone and Nigam 2020; Ranney et al. 2020; Tsai et al. 2020; Hicks and Marsh 2020).

 The White House Coronavirus Task Force singled out two states, including California,

for their early adoption of mandatory social distancing policies:

 “[Dr. Deborah] Birx said the experiences of California and Washington give her

 hope that other states can keep the coronavirus under control through social

 distancing. That’s because they moved quickly to contain the early clusters of

 coronavirus by closing schools, urging people to work from home, banning large

 gatherings and taking other measures now familiar to most Americans.” (The

 Associated Press, March 31, 2020)

 Following the adoption of California’s SIPO, 39 additional states and the District of

Columbia enacted similar statewide SIPOs between March 20, 2020 and April 9, 2020. And by

early April, over 90 countries worldwide, representing half of the world’s population, requested

or ordered their citizens to stay at home (Sandford 2020).

 3
There are a number of important reasons to single out California’s SIPO in studying its

effects on COVID-19 infection and mortality. First, California was the first state to implement a

statewide order, an important policy feature designed to prevent within-state spillovers of

infectious disease across neighboring counties, cities, and townships with heterogeneous local

orders. Second, California ranks 12 out of 51 states (including the District of Columbia) in

population per square mile (World Population Review) and 2 out of 51 in percent living in

urbanized areas and urban clusters (Iowa Community Indicators Program). 3 The spread of

coronavirus is exacerbated by increased population density, which generates greater

opportunities for transmission among frequently interacting individuals (Centers for Disease

Control and Prevention 2020b). This makes California a location with a high potential for rapid

spread of the disease.

 Third, California implemented its SIPO at a unique time: early in the cycle of an

outbreak, when the rate of growth in observed coronavirus case rates was quite low relative to

other states that ultimately implemented SIPOs. The average daily growth in confirmed

coronavirus cases in the four days prior to SIPO enactment was 19.1 percent in California. No

other SIPO-implementing state in the upper 25th percentile of the state population density or

urbanicity distribution had an average daily coronavirus growth rate lower than California during

this period. As a comparison, New York, which had the highest per-capita case rate in the nation

throughout much of the outbreak, had an average daily coronavirus case growth rate of 39.5

percent in the four days prior to its enactment of a SIPO. In this context, California may provide

a cleaner natural experiment in relation to later adopters, while also informing the efficacy of the

decision to enact a SIPO early in the outbreak cycle. Finally, at this early stage of assessing the

3
 In 2019, the population density in California was 253.7 persons per square mile; 95.0 percent of residents lived in
an urbanized area or urban cluster.

 4
short-run public health effects of SIPOs, California has more days of post-treatment data than

any other state, critical for analyzing the public health benefits of an epidemic with potentially

exponential short-run contagion and lagged mortality effects.

 While there is speculation by the White House Coronavirus Task Force that SIPOs have

been effective at “bending the case curve,” there is little rigorous empirical analysis of this

question. This study is the first to examine early public health effects of a statewide SIPO.

 Using 29 days of state-level data on confirmed COVID-19 cases and COVID-19-related

deaths, this study provides evidence on the public health effects of California’s SIPO during the

crucial early weeks of the policy. Estimates from our preferred synthetic control models show

that California’s SIPO led to a 125.5 to 219.7 per 100,000 population reduction in COVID-19

cases and a 1.9 to 4.2 per 100,000 population reduction in COVID-19-related deaths per 100,000

during the first month following its enactment. These findings are robust to the selection of

observables (i.e. pre-treatment COVID-19 rates, population density, urbanicity, and other

COVID-related policies) to generate the weights to construct our counterfactual. We find that

the number of cases averted and lives saved were much larger in the second and third weeks

following the SIPO’s adoption, consistent with growing public health benefits over the period

during which the outbreak was exponentially growing. Back-of-the-envelope calculations

suggest that there were approximately 8 to 14 job losses per coronavirus case averted and 421 to

917 job losses per life saved during this short-run post-SIPO window in California.

 2. Background on Coronavirus

 In December 2019, an outbreak of a new zoonotic coronavirus, SARS-CoV-2, which

causes the disease COVID-19, was detected in Wuhan, Hubei Province, China (World Health

Organization 2020a). The symptoms of COVID-19 resemble that of influenza, including fever,

 5
cough, and shortness of breath (Centers for Disease Control and Prevention 2020c). However,

severe respiratory symptoms generate a mortality rate that may be an order of magnitude greater

than that of the common flu (World Health Organization 2020b, House Oversight and Reform

Committee 2020). Deaths from COVID-19-related illness are heavily concentrated among the

elderly and those with underlying health conditions such as respiratory ailments, heart disease,

diabetes, or high blood pressure (Wu and McGoogan 2020; Verity et al. 2020; CDC Covid-19

Response Team 2020).

 The substantial epidemiological risk from this new coronavirus is exacerbated by (i) a

high degree of contagion (Thackeray 2020; Cascella et al. 2020), (ii) the possibility that

transmission may occur among those who are asymptomatic (Centers for Disease Control and

Prevention 2020a; Mandavilli 2020, Whitehead 2020, Li et al. 2020), and (iii) lack of adequate

testing (Cohen 2020, Shear et al. 2020, Rabin et al. 2020, Desiderio and Levine 2020). In the

main, transmission of COVID-19 occurs via respiratory droplets, usually emitted during

coughing, sneezing, or nose-blowing (Centers for Disease Control and Prevention 2020a, World

Health Organization 2020c & 2020d). There is also some evidence that the disease may be

easily transmitted through normal breathing function in common air space (Fineberg 2020). The

incubation period for COVID-19 is 2 to 14 days, during which time transmission may also be

possible (Centers for Disease Control and Prevention 2020b, Li et al. 2020).

 U.S. pharmaceutical companies, in partnership with the public sector, have begun clinical

trials for a COVID-19 vaccine (White House 2020, Food and Drug Administration 2020).

However, a longer-run medical solution such as a vaccine is unlikely to solve short-run capacity

constraints faced by hospitals, which have faced a sharp increase in demand for medical services

among coronavirus patients (Secon 2020, Seewer 2020, Kaste 2020, Marquez and Moghe 2020).

 6
Fears over shortages of ventilators (Baker and Fink 2020, Ranney et al. 2020), intensive care unit

beds (Tsai et al. 2020, Hicks and Marsh 2020), and protective personal equipment (James 2020,

Petras and Loehrke 2020, Ranney et al. 2020, World Health Organization 2020e) have instead

led policymakers to seek strategies to “flatten the curve” of infections, reducing the peak number

of infections and spreading its incidence over time (Meredith 2020). The World Health

Organization (WHO) recommended that individuals frequently wash hands, avoid shaking hands

with others, self-isolate when presenting flu-like symptoms, and avoid all unnecessary contact

with non-household members through the practice of social distancing (World Health

Organization 2020b). The adoption of shelter-in-place orders is the dominant policy strategy to

induce such distancing.

 SIPOs can affect COVID-19 cases and deaths through a number of channels. As public

health officials and epidemiologists expect, reducing exposure of uninfected individuals to those

who are infected via social distancing should reduce the transmission rate of the virus. However,

there are other indirect channels through which SIPOs could impact reported cases and deaths.

SIPOs may affect testing and coronavirus-related mortality because infected individuals who are

unaware of their infection choose to stay at home rather than seek out testing or other medical

care. This may be because of fears of contagion at medical facilities or because of a desire to

adhere to a “civic duty” to shelter in place. In addition, as SIPOs may necessitate an increase in

public resources spent on patrol and enforcement, they may reduce resources available for public

health services. On the other hand, as SIPOs are expected to reduce the demand for “non-

essential” medical procedures such as well care visits or elective surgery, they may free up

resources for those most at risk for coronavirus-related mortality.

 7
3. Data and Methodology

3.1 Data

 In order to examine the “first stage” compliance with the California SIPO, we utilize

publicly available data from SafeGraph Inc. 4 For each state (and county) on each day SafeGraph

provides a shelter-in-place index, based on the percent of individuals staying at home during the

day. The metric is calculated from spatial data generated using anonymous cell phone pings.

First, each cell phone is assigned a “home” (or 153m by 153m square) based on a common

nighttime location over a baseline period. SafeGraph then calculates the percent staying at

home, i.e. the fraction of cell phones in a geographic unit (state, county, etc.) that do not leave

the “home” for any given day. 5 The shelter-in-place index is the percentage point change in the

number of cell phones staying at home relative to the baseline of February 6, 2020 through

February 12, 2020. 6

 To examine the short-run public health effects of the statewide order, we utilize a panel

of state-specific daily counts of COVID-19 cases and deaths from March 12, 2020 through April

20, 2020. These data are collected by the Centers for Disease Control and Prevention (CDC) and

made public by the Kaiser Family Foundation. 7 Over this period, there were a total of 778,328

confirmed COVID-19 cases in the United States, 4.3 percent (33,862) of which were in

California, and 37,372 coronavirus-related deaths, 3.2 percent (1,223) of which were in

California.

4
 Data and detailed descriptions of variable construction are available at:
https://www.safegraph.com/dashboard/covid19-shelter-in-place
5
 SafeGraph makes adjustments for small geographic units which are not relevant for a state-level analysis.
6
 So a value of 25 is for the shelter in place index could represent an increase from of 12% of phones staying at
home at baseline to 37% of phones staying at home (37-12=25).
7
 See data available here: https://www.nytimes.com/interactive/2020/us/coronavirus-us-cases.html

 8
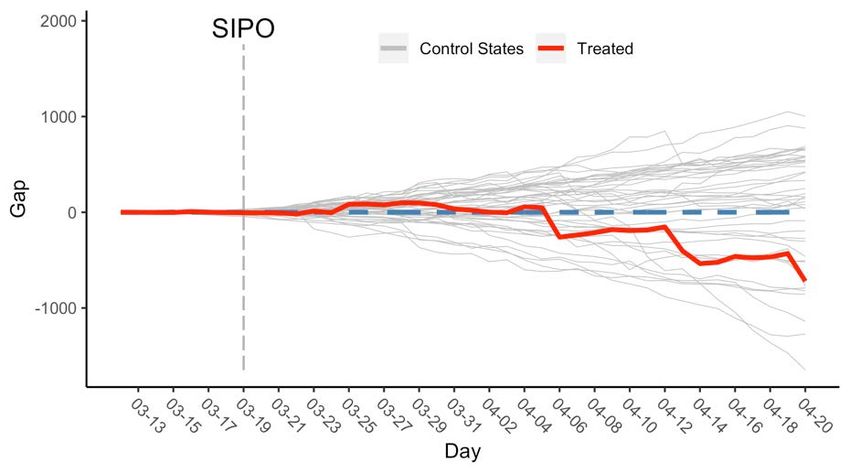
Figure 1 shows state-specific trends in cumulative coronavirus rates per 100,000

population in each state. Daily cases can be calculated as the slope of this cumulative case

distribution. Over the period under study, the average coronavirus case rate in California was

30.8 per 100,000 population, and its growth rate from March 12 to April 9 ranked 6th lowest

among the 50 states and the District of Columbia. In addition, California had the lowest case

growth rate among the top 25th percentile of most highly urbanized states. California also had

the lowest case rate among the top 25th percentile of most highly densely populated states.

 Figure 2 shows the trends in cumulative coronavirus-related death rates per 100,000

population. Between March 12 and April 20, the COVID-19 death rate in the United States grew

by 8.56 deaths per 100,000 population, while it grew by less than one half as much (3.08 per

100,000 population) in California. New York, New Jersey, Washington, Louisiana, and

Massachusetts had among the highest rates of coronavirus-related deaths at the end of the sample

period. In terms of the death rate, the growth in the COVID-19 death rate in California ranked

lowest among the top 25th percentile of most highly urbanized states.

 Figure 3 shows trends in coronavirus case rates for each county in the state of California

during the sample period. As noted above, prior to the statewide SIPO on March 19, 12 counties

and the City of Los Angeles adopted SIPOs. Early adopting counties are shaded black and all

other counties are shaded gray. We find that the growth rate in coronavirus cases from March 12

through April 20 in early adopting California counties was about 9 percent. This compares to an

average growth rate of 11 percent in the remaining counties in the state who were bound by the

statewide order. 8

8
 Appendix Figure 1 shows trends in coronavirus mortality rates for each county in California during the sample
period. Due to many low population counties with zero deaths for much of the sample period it is difficult to draw
reliable inference with regards to county level SIPOs and mortality.

 9
3.2 Synthetic Control Design

 We use the synthetic control method introduced by Abadie et al. (2010) to infer the

causal impact of SIPOs on the number of confirmed coronavirus cases and number of COVID-

19-related deaths per 100,000 population in California. This method uses data on pre-treatment

COVID-19 case (or mortality) rates and observable characteristics of states that may influence

the spread of the virus (i.e. population density, urbanicity, emergency decrees for major disaster

area, travel restrictions, and the number of tests conducted). 9 The synthetic control approach

generates a counterfactual designed to capture how coronavirus cases would have evolved in

California in the absence of its SIPO.

 Our chief outcomes of interest, and ℎ , measure the cumulative

number of confirmed coronavirus cases and number of coronavirus-related deaths per 100,000

population in state i at day t. We estimate the unobserved counterfactual (“synthetic California”)

as a weighted linear combination of states included in a donor pool. The weights are chosen so

as to generate a synthetic state that is as similar as possible to California on key observables.

Given the importance of the selection (i) of states to be included in the donor pool, and (ii)

observable characteristics on which to closely match California to its synthetic counterpart, it is

9
 Population density is measured as the ratio of state population to land area in square miles and is available from
U.S. Census (see: https://www.census.gov/geographies.html). Urbanicity is measured as percentage of total
population living in urban areas and is available from Iowa Community Indicators Program (see:
https://www.icip.iastate.edu/tables/population/urban-pct-states). Emergency major disaster declarations are
measured as a state with disaster that exceeds the response capabilities of the state and local governments, and long-
term recovery assistance is needed and are available from the Federal Emergency Management Agency (see:
https://www.fema.gov/disasters). Travel restrictions are measured as states that restrict residents from traveling to
other states and/or states that restrict residents of other states from entering the state. COVID-19 tests are measured
as the natural log of total coronavirus tests reported by each state. These data are available from COVID Tracking
Project (see: https://covidtracking.com).

 10
incumbent on researchers to offer a theoretical defense of these choices and to explore the

sensitivity of estimated policy impacts to these choices (Ferman 2019).

 Our primary donor pool is comprised of a total of 42 state and the District of Columbia:

10 states that had never enacted a SIPO during our sample period, and 32 states and the District

of Columbia that adopted a SIPO at least 5 days after California did so. We select this five-day

period because it is the median incubation period of COVID-19 (Lauer et al. 2020), and thus

gives the case data from California sufficient time to reflect underlying changes in the

transmission rate before any of the donor states implement their own SIPOs. Coupled with

information on the date at which each state implemented a SIPO (Appendix Table 1), our

decision rule eliminates the following states from our donor pool: Illinois, New Jersey, New

York, Connecticut, Louisiana, Oregon, and Washington. 10 Moreover, as shown in Figures 1 and

2, several of these states (New Jersey, New York, and Washington) appeared to be on very

different pre-treatment case and mortality trends than the majority of states, including California.

To test the sensitivity of our results to the inclusion of these 43 states (including the District of

Columbia) in the donor pool, we re-estimate our synthetic control models without eliminating

pre-March 24 SIPO-adopters from the donor pool. Our main findings are largely unchanged (see

column 1 of Appendix Table 2).

 One limitation to our preferred donor pool is that by including later-adopting SIPO states

as potential donors, the synthetic control is contaminated on some post-treatment days. Thus, to

the extent that later enacted SIPOs have taken effect, our estimated treatment effects will be

biased towards zero and lower-bound estimates. As one approach to address this concern, we

10
 Ohio implemented its statewide SIPO at 11:59pm on March 23, 2020. We code this order as effective on March
24, 2020. However, if we exclude Ohio from our donor pool, we obtain a pattern of results quantitatively similar to
those reported above. Moreover, if we allow all early adopters into our donor pool (see column 1 of Appendix Table
2), the results are also unchanged.

 11
select an alternate donor pool that includes states that had never adopted a SIPO or had adopted a

SIPO but had 4 or fewer days of post-treatment data, meaning that likely at least half of all

individuals infected post-SIPO had not yet reached the median incubation period (Lauer et al.

2020). However, this restriction to the donor pool has its own limitation: only 10 states had not

adopted SIPOs by April 9 (Arkansas, Iowa, Kentucky, Massachusetts, Nebraska, North Dakota,

Oklahoma, South Dakota, Utah, and Wyoming), and just 2 were late adopters that fit this

selection criteria (Missouri and South Carolina). 11 Many of these non-adopting and late-

adopting states do not share urbanicity, population density, or other policy-related characteristics

of California making them potentially bad donors to the synthetic control group.

 Thus, selecting the eligible donor states for the analyses to follow has an inherent

tradeoff. We can select from a broader set of donor states that allow for a better synthetic control

match to California on observables, but partially contaminates our control group with treated

days biasing the estimated policy effect towards zero, or, we can select from a more limited set

of donor states that is uncontaminated by treatment but that may be poorly matched to California

on observables leading to a synthetic control group that is potentially a poor counterfactual for

California. We will present results under both choices. The former approach yields policy

effects that suggest California’s SIPO was effective at slowing the spread of COVID-19 (and is

presented in Tables 1 and 4); the latter approach also yields policy effects that suggest

California’s SIPO was effective (and is presented in columns 2 and 3 of Appendix Table 2), with

results that are larger in magnitude (consistent with the prior approach generating a lower bound

estimate) but also less precise. It is our opinion that a better synthetic control match that yields a

11
 Among these states, Massachusetts had issued a “stay at home advisory.”

 12
downward biased estimate is more reliable than an estimate from a potentially poorly matched

control group, a point to which we will return below.

 With regard to the choice of observables used to select our synthetic control from among

the donor states, we take several approaches. First, an important objective of this research design

is to generate common pre-treatment trends in coronavirus cases (or deaths). Our primary

strategy to achieve this objective is to generate a synthetic control that closely approximates

coronavirus case (and mortality) rates in California in each of seven (7) pre-treatment days

(March 12 through March 18). We also experimented with requiring pre-treatment matches up

to two weeks (14 days) prior to California’s SIPO and our results are unchanged. We estimate

the unobserved counterfactual COVID-19 case rate for California on pre-treatment day by

∑ ∗ , where is the weight assigned to donor state . The analogous

counterfactual death rate is ∑ ∗ ℎ . The estimated weights are chosen to

minimize the absolute difference between = , and ∑ ∗ and for all

pre-treatment days, as well as the absolute difference between ℎ = , and

∑ ∗ ℎ . Then, the per-day treatment effect αt is estimated as = = , −

∑ ∗ for t ∈ r [March 19, April 9], where = [ , ℎ ]. The average

treatment effect is then the average over the post-treatment window.

 Choosing a counterfactual based only on pre-treatment outcomes has a number of

advantages. Given a long enough pre-treatment window, matching on covariates and matching

on outcomes will produce similar results. Choosing not to match on covariates can eliminate

concerns of ‘p-hacking’ and reduce bias of our estimate (Botosaru and Ferman, 2017).

 However, a limitation of matching all pre-treatment days to construct synthetic California

is that there may be other observables that may legitimately and strongly influence the path of an

 13
outbreak such as population density, urbanicity, weather, state travel restrictions, or a declaration

of major disaster. As shown by Kaul et.al (2018), matching on all periods of pre-treatment

outcomes renders all covariates irrelevant in the prediction of the outcome.

 Thus, we take alternate approaches to generating a synthetic control that allow for these

relevant observables to influence estimation of synthetic weights. First, we generate weights by

matching on coronavirus case (or death) rates on three pre-treatment days (March 13, March 15,

and March 18) as well as state population density and a state urbanicity index. These latter

factors play an important role in the spread of infectious disease across communities due to

increased crowding (Florida 2020). New York City, the most densely populated city in the U.S.,

for example, experienced one of the most dramatic increases in coronavirus outbreaks and has

more coronavirus cases per capita than the nation of Italy (Rosenthal 2020).

 Second, we generate synthetic weights using March 13, March 15, and March 18

coronavirus case (or death) rates and several state policies designed to affect the outbreak:

whether an emergency major disaster declaration was in effect for the state and whether the state

had imposed travel restrictions (i.e. guidelines for residents and/or visitors to quarantine

themselves for two weeks following arrival from other states).

 Third, we consider the role of state COVID-19 testing rates. One reason why we might

see changes in cases is because testing resources have changed. As of March 13, only 15,000

tests had been conducted in the U.S. To address the low testing rate in the U.S., the Food and

Drug Administration approved a new COVID-19 test from the pharmaceutical company Roche

(Arnold 2020). In the following days, states including Delaware, New York, Massachusetts and

Texas, began implementing drive-up testing sites, which made access to testing more available

(Yancey-Bragg 2020). Despite these improvements in accessibility, many testing delays

 14
persisted due to laboratory capacity constraints (Brown and Court 2020). Coronavirus-related

deaths are less likely to be affected by this selection into testing. Nevertheless, we take two

approaches to explore the issue of testing capacity. For our first approach, we explore if

California’s SIPO affected testing rates, using synthetic control methods described and the

number of tests as the outcome variable. For our second approach, we return to our main

analysis of case (and death) rates and generate a synthetic California using March 13, 15 and 18

pre-treatment case (and death) rates as well as the average rate of testing per 100,000 population.

 To conduct hypothesis tests, we take two approaches. First, we conduct placebo tests

following the method suggested by Abadie et al. (2010). We apply the same synthetic control

method described above for each donor state. For donor state j, we reclassify the state as a

treatment state, and select a donor pool based on all donor states except j, and add California to

the donor pool. We then use the same matching criteria stated above to generate a synthetic

control ℎ for each donor state j as if treatment were assigned March 19.

 We compare the pre-treatment and post-treatment mean squared prediction error (MSPE)

for each state, calculating the MSPE ratio as follows:

 ∑
 =3/19( − ℎ )
 2
 = 3/18 (1)
 ∑ =3/12( − ℎ )2

 The MSPE measures a relative goodness of fit for each state’s synthetic control based on

estimated coronavirus cases (or deaths). A high MSPE ratio can be interpreted as poor post-

treatment fit relative to pre-treatment fit. The ranking of the treated states relative to the placebo

states then provides a permutation-based p-value. The p-value relies directly on the number of

states in the donor pool. With 43 states in the donor pool, California’s MSPE ratio must rank at

 15
least 2nd to receive a p-value below .05 and at least 4th to receive a p-value below .1. A p-value

of less than .01 is not attainable given the number of donor states. 12

 The p-value generated for the “standard” synthetic control model generates information

on post-treatment fit based on the entire post-treatment period following the March 19 California

order. However, there are some important reasons why we might want to calculate MSPE over

particular post-treatment windows. For example, differences in the California “gap” (the

difference between California’s coronavirus rate and synthetic California’s coronavirus rate) is

expected to be much smaller during the incubation period (median of 5.1 days, 97.5th percentile

of 11.5 days) following the SIPO relative to the post-incubation period when symptoms would

have been present and infectious disease transmission more efficient. Moreover, given that the

effects of social distancing may have important multiplier effects over time (Florida 2020), we

could expect the “gap” to increase exponentially following treatment. For these reasons, we

provide a range of permutation p-values based on several post-treatment windows: (i) the entire

post-treatment period, (ii) the post-SIPO period after the median incubation length (March 24

and later), and (iii) the post-SIPO period after which 97.5 percent of those infected on the SIPO

implementation date are expected to experience symptoms (March 30 and later).

 Second, we conduct statistical inference by estimating wild bootstrap cluster standard

errors (Cameron et al. 2008; Cameron and Miller 2015) using difference-in-differences

regressions. We draw data from California and donor states that received positive synthetic

12
 The null hypothesis utilizing these p-values is that there is no effect in each period, not that the average policy
effect is zero. It is possible to have a policy effect with an average of zero in the post-treatment period, but a large
MSPE if the effect of the policy changes sign in the post-period. For this reason, it is important to make judgements
based on both the MSPE and the general pattern of results.

 16
weights in the construction of synthetic California and estimate a difference-in-differences model

of the following form:

 ln (Case Rateit) = β0 + β1SIPOit + β2Xit + γs + τt + μit (2)

where SIPOit is an indicator for the day that California adopts a shelter-in-place order, Xit is a set

of state-level, day-varying controls that include indicators for whether the state enacted a

statewide non-essential business closure order (that falls short of a shelter-in-place order),

whether the state enacted a targeted shelter-in-place order that covers only older individuals over

age 65 or those with underlying health conditions, whether the state had enacted travel-related

restrictions, whether a major disaster declaration had been issued for the state, the average

temperature (in degrees Celsius) at all weather stations in the state, and an indicator for whether

any weather station in the state reported measurable precipitation. In addition, we control for

state fixed effects (γs) and day fixed effects (τt), identifying our treatment effect (β1) via within-

state variation in the enactment of a SIPO. We also estimate equation (2) where we replace Case

Rateit with Death Rateit, but given low counts of deaths during the earlier days of our analysis

period, we experiment with count data models such as Poisson and negative binomial models.

 We first estimate equation (2) using an unweighted linear regression, giving equal weight

to California and each positively synthetically-weighted donor state. Then, we use the synthetic

weights (between 0 and 1) generated from the synthetic control model to weight each state and

then assign California a weight of 1. In all cases, to conduct statistical inference, we generate

standard errors via wild cluster bootstrapping given the small number of clusters (states), which

includes a single treatment state (Cameron et al. 2008; Cameron and Miller 2015).

 17
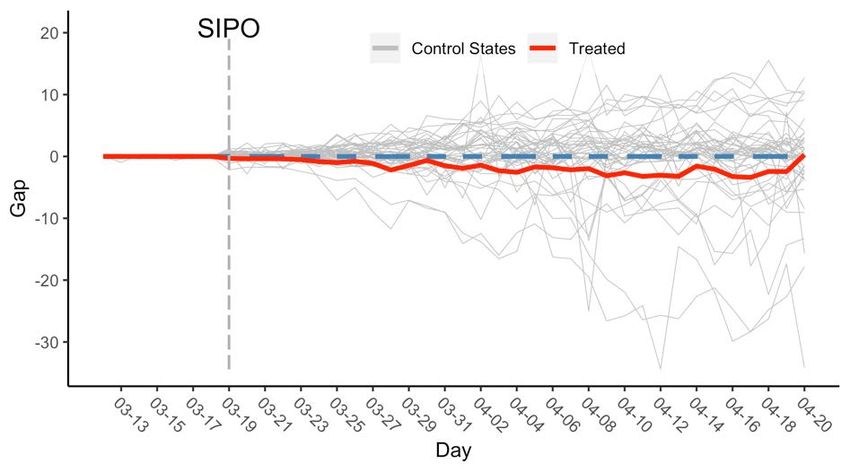
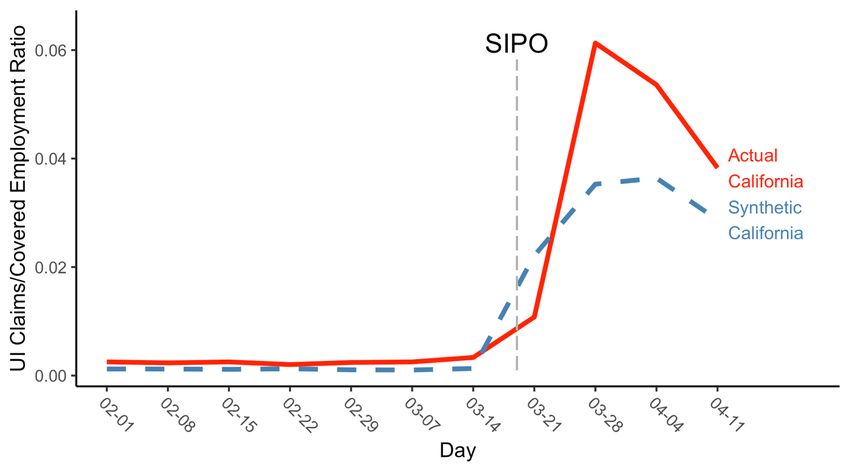
4. Results

 Our main findings on the effects of California’s statewide SIPO can be found in Figures 4

through 18 and Tables 1 through 6. Discussion of county-specific COVID-19 SIPOs are

discussed in Section 4.4 and in Tables 7 and 8.

4.1 “Stay at home” Behavior and California Statewide SIPO

 Figure 4 presents trends in the shelter-in-place index for both California and its synthetic

control. The index reflects the percent of the population in a given state that stays at home all

day relative to a baseline, derived from anonymized cell phone geotagging (SafeGraph, Inc.).

We assign weights to the synthetic control based on close matches in the shelter-in-place index

for each of the 7 days prior to CA’s statewide SIPO. 13 Trends in social distancing are expectedly

positive over the entire analysis period as awareness of COVID-19 was proliferating and the

benefits of social distancing were emphasized through public health advisories and guidelines.

The synthetically-generated counterfactual tracks California nearly identically prior to the SIPO,

with trends markedly diverging only after California issued its statewide order on March 19.

Estimates of the average daily treatment effect indicate that the percent of individuals remaining

at home throughout the day increased by 2.1 percent in California relative to its synthetic control,

over the entire post-SIPO period. The effect is larger over the initial post-treatment window up

to March 28, indicating an average 3.3 percent increase per day in individuals sheltering at home

in California relative to the control, and suggestive of a rapid run-up in social distancing.

13
 As the baseline for the index is the same for all states (week ending February 12, 2020), and the pre-SIPO trends
are nearly identical, the treatment effect can be interpreted as the increase in the percent of households in CA who
are staying at home relative to its counterfactual in the post-SIPO period.

 18
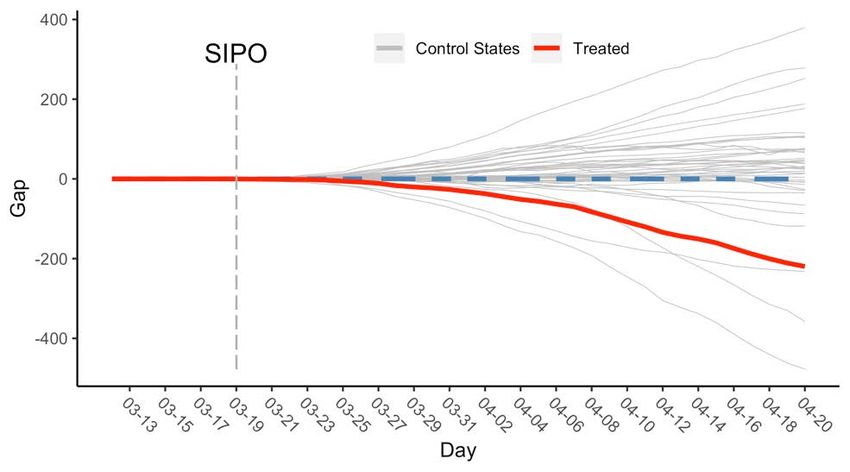
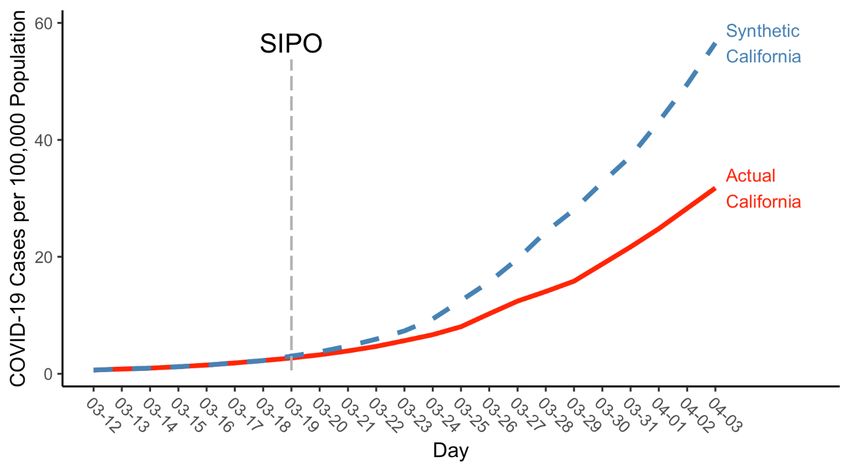
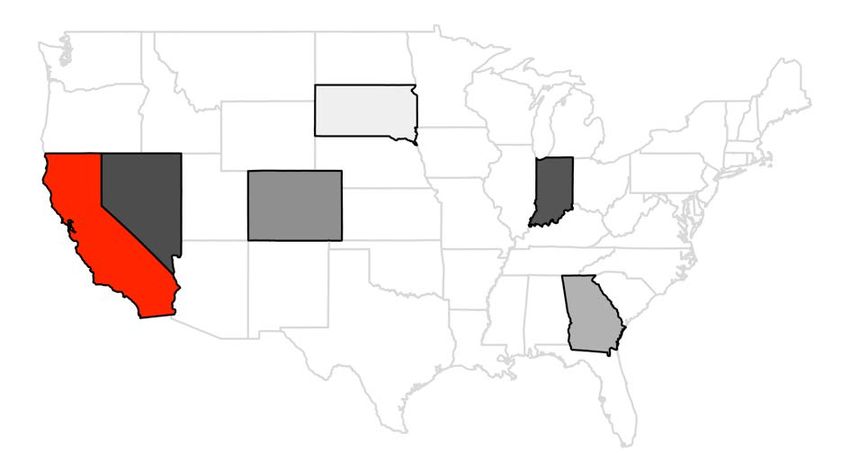
Focusing on this window wherein CA experienced the largest gains in social distancing, the

effect is statistically significant with a one-sided permutation-based p-value of 0.023. As more

donor states issued their own shelter-in-place orders, notably by the end of March, and gains for

California decelerated, trends narrowed somewhat between California and its synthetic control.

 These analyses underscore two points. First, they provide some supporting evidence that

individuals in California complied with the shelter-in-place order, and that the SIPO effectively

and rapidly reduced social mobility in California, an effect which was sustained over the analysis

period. Second, as pressure for social distancing intensified, the health effects that we estimate

below capture the direct effect of California’s SIPO on contagion by forcing certain forms of

economic activity to stop as well as the compounding effects of the SIPO accelerating social

distancing behavior during the early period of the coronavirus outbreak cycle.

4.2 COVID-19 Confirmed Cases and California Statewide SIPO

 Figure 5a shows trends in California’s confirmed COVID-19 cumulative cases from

March 12, 2020 through April 20, 2020. Case rates rose fairly linearly over the period from

March 12 through March 25 from .6 to 8 per 100,000 population before beginning more

exponential growth, reaching 85.6 per 100,000 on April 20, 2020.

 Our first synthetic control assigns weights based on close matches in pre-SIPO case rates

on each of the 7 pre-treatment days. We find that a total of 10 states contributed approximately

two-thirds of the weight for the estimated counterfactual. These include Colorado, the District of

Columbia, Hawaii, Maine, Massachusetts, Michigan, Minnesota, New Mexico, Rhode Island and

South Dakota (Figure 5b). 14 This estimated synthetic control serves as our counterfactual for

14
 The highest synthetic weights were assigned to Colorado (11%), the District of Columbia (3%), Maine (10%),
Massachusetts (15%), and South Dakota (18%).

 19
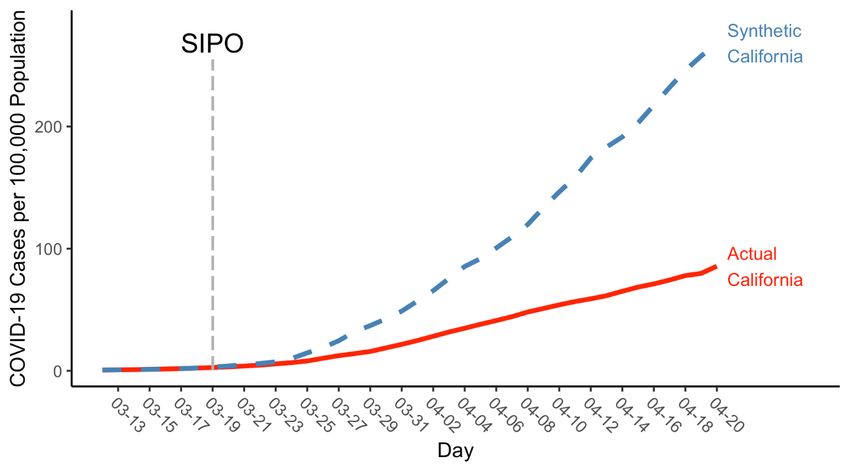
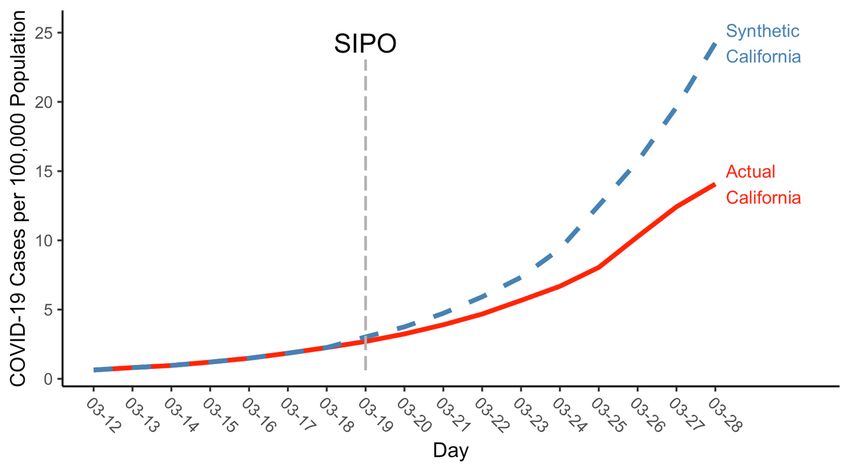
coronavirus case trends that would have unfolded in California in the absence of the SIPO

enactment. Figure 5a shows that COVID-19 case rate trends in California and synthetic

California are nearly identical in the pre-March 19 period. During the first three (3) days

following treatment, which capture the first half of the coronavirus incubation period,

coronavirus case rates remain quite similar in California and the synthetic control state.

However, beginning on March 23 and accelerating after March 25, the rate of growth in

California’s coronavirus cases was substantially lower in California relative to the synthetic

control. By the final day of case data in our analysis (April 20), we find that there were 125.5

fewer coronavirus cases per 100,000 population, which translates to 49,636 fewer total cases on

that day. This pattern of findings suggests that the public health benefits of the SIPO grew over

the near-month long period of analysis. These public health benefits also capture any potential

compounding effects due to California responding early during the initial phase of its outbreak

cycle. 15

 In column (1) of Table 1, we show estimates of the average daily treatment effect for the

full post-SIPO period from March 19 through April 9 (Panel I), for the post-treatment period

beginning March 23, which accounts for the median coronavirus incubation period (Panel II),

and for the post-SIPO period beginning March 30, the 97th percentile of the coronavirus

incubation period (Panel III). For the full post-treatment period, we estimate that the enactment

of the SIPO is associated with a 42.02 decline in average coronavirus cases per 100,000

15
 If we employ the synthetic weights from Model 1 (Table 1) to compute a weighted average date of SIPO
enactment among the states in the control group and assign never adopters a pseudo-treatment date that is one day
after the end of the analysis period, then, using this measure, California issued its SIPO on average 13 days prior to
synthetic California.

 20
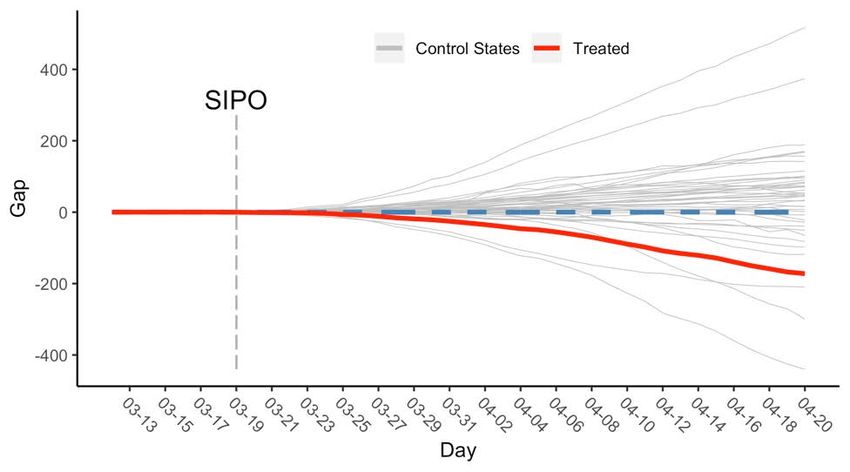
population. Over the near month-long window, this suggests approximately 49,636 COVID-19

cases averted. 16

 The daily decline in coronavirus cases is not constant over the post-treatment window.

The estimated public health benefits accelerate in the days following enactment, consistent with

an exponential growth in contagion that was averted from the SIPO’s enactment. Following

March 22, the enactment of the SIPO led to a 47.7 decline in average coronavirus cases per

100,000 population while in the post-March 30 period, the average cumulative case reduction

that we attribute to California’s SIPO is 61.0 per 100,000 population. Together, this evidence is

consistent with the hypothesis that the public health benefits of California’s SIPO grew

exponentially in the short-run.

 To conduct statistical inference of the above estimates, we turn to permutation-based p-

value calculations. In Figure 5c, we show results from our placebo tests, which give rise to the

rank-based p-values we generate. In each case, the permutation-based p-value was .045 using

the standard ranking generated by the pre-post MSPE ratio, and .045 using a one-tailed pre-post

MSPE ratio test.

 An important concern in synthetic control analysis is how robust findings are to the

choice of observable controls and donor states. Figure 6a shows results from a synthetic control

approach where we only assure pre-treatment matches on COVID-19 cases on three days (March

13, March 15, and March 18), but also augment our matching strategy by assuring similarity on

the share of the state population residing in urban areas. According to the 2010 Census, 95.0

percent of the population lived in urbanized areas or urban clusters. In Appendix Table 3, we

16
 To take a more conservative approach, we also consider an alternate strategy where we force coronavirus cases
during the period from March 19 through March 23 to be comparable to the donor states. This imposes a null effect
of the SIPO on cases due to lagged effect from exposure to symptoms during the incubation period. This exercise,
shown in Appendix Figure 4, yields similar results as our main model.

 21
compare urbanicity rates in California (column 1) with all other states (column 2), and synthetic

California (column 3). We find that urbanicity rates are most similar to California with the

synthetic counterfactual.

 Despite generating a very different set of positively weighted donor states from the

approach undertaken in Figure 5a, the estimated treatment effect is quite similar, as is the pre-

treatment match. 17 There is a tight pre-treatment fit, with an exponential divergence following

the post-SIPO initial virus incubation period. In column (2) of Table 1, we show that over the

full post-treatment period, the California SIPO led to a 59.3 per 100,000 population decline in

average cumulative coronavirus cases. Again, the effect sizes were larger in later days of the

post-treatment period (Panels II and III), consistent with exponential growth in public health

benefits to those in California. The permutation-based p-value from placebo tests (Figure 6c)

is .023 in all panels.

 Given that urbanicity rates may not fully capture the degree of crowding, in Figures 7a

through 7c, we show results from a synthetic control model where we match not only on

urbanicity, but also population density, increasing the likelihood that we more heavily weight

those donor states with higher risk of coronavirus contagion. 18 Our findings, shown in Figures

7a-7c and in column (3) of Table 1, are quite similar to those in column (2) of Table 1.

 To ensure that coronavirus testing is not biasing estimates of the effect of California’s

SIPO on confirmed cases, we next select weights for donor states by also matching on the

average rate of testing over the sample period. 19 The results in Appendix Figures 2a through 2c

17
 In Appendix Table 4, we show synthetic control estimates where we limit the donor states to the continental
United States, thus eliminating Alaska and Hawaii as potential donors. The pattern of results is qualitatively similar
to that shown in Table 2.
18
 Appendix Table 3 shows the quality of the synthetic control on these observables.
19
 Appendix Table 3 shows means of testing rates for California and its synthetic control.

 22
provide some support for the hypothesis that testing for the coronavirus may have increased

following the SIPO, suggesting that estimated case reductions may be biased toward zero. After

controlling for average coronavirus testing rates, we find that the California SIPO led to an

average reduction of 57.8 COVID-19 cases per 100,000 population. By April 20, we estimate

68,157 COVID-19 cases averted (Figures 8a-8c and column 4 of Table 1).

 In column (5), we explore whether our estimated treatment effect is sensitive to the

addition of COVID-19-related policy controls, including major disaster declarations and state

travel restrictions (see Appendix Table 3). The pattern of results shown in Figures 9a through 9c

are quite similar to those shown in the previous figures. We find that the California SIPO led to

an average 60.0 case per 100,000 population reduction in COVID-19 cases. By April 20, the

cumulative number of coronavirus cases averted was approximately 66,020 (column 5 of Table

1).

 One important question about our prior analyses is whether we are identifying the effect

of a SIPO or just voluntary social distancing that is correlated with the adoption of a SIPO and

with coronavirus cases. In column (6) of Table 1, we match on pre-treatment growth in rates of

staying-at-home using SafeGraph data as well as three days of pre-treatment coronavirus cases.

Here, we estimate that over the near-month long pretreatment period, California’s SIPO was

associated with a nearly 87,000 decline in the total number of COVID-19 cases. Figures 10a-10c

show these results.

 Could our donor states be too different from synthetic California in experiencing

community spread of the coronavirus? Different states experienced coronavirus outbreak at

different times. In the pre-treatment period, California had experienced nearly 252 cases of

COVID-19 on March 12, which suggests that outbreak and community spread was well

 23
underway. To ensure that the donor pool for synthetic California had also experienced

community spread, in Table 2, we limit our donor pool to states that had experienced at least 10

(column 1), 50 (column 2), or 100 cases (column 3) of coronavirus. The results in Table 2 and

Figure 11 continue to show strong evidence that California’s SIPO was associated with a

reduction in COVID-19 cases.

 It is important to recall that each of the above estimates is based on a synthetic control

from a set of donor states that are partially treated in the latter part of the post-period, and as such

are a lower bound for the true effect of the policy. 20 In columns (2) and (3) of Appendix Table 2,

we examine the sensitivity of estimated policy impacts to the use of never-adopting or later-

adopting (after April 5) states as controls. We find that California’s statewide SIPO reduced

average cumulative case rates by between 44.4 and 75.2 cases per 100,000 relative to synthetic

California. These results are larger in magnitude, but also less precise than the estimates when

we allow partially treated states in the control group.

 Appendix Figure 7 presents the corresponding trends in cumulative cases for California

and synthetic California. While these results are validating, we note here the qualification that

the set of donor states that receive positive weights among non-adopters include Massachusetts

(38 percent), Oklahoma (22.4 percent), Utah (22.3 percent), North Dakota (14 percent), and

Wyoming (3.2 percent). Appendix Table 5 shows that the synthetic California estimated from

never adopters (columns 2 and 3) and never or late adopters (columns 4 and 5) differ on

population density and urbanicity. Given the important role of social interactions in the spread of

20
 In Appendix Figures 5 and 6, we trim the post-treatment window in order to limit the effects of later SIPOs
enacted by states within the synthetic control. Specifically, Appendix Figure 5 trims the post-treatment period to
March 28, which is 5 days (median incubation period) after the first treatment date for any donor state, ensuring that
the trend in cases exhibited by synthetic CA is not due to a SIPO enacted within the control group. Appendix Figure
6 slightly extends the post-treatment period to April 3, ensuring that the window ends before the median incubation
period plus lag to ARDS (13 days). Both figures show consistent evidence that the statewide SIPO in CA flattened
its outbreak trajectory and reduced the average daily COVID-19 cases.

 24
the coronavirus, this makes it possible that the synthetic California generated from a much

narrow set of never (or later) adopting donor states were on a different longer-run coronavirus

contagion trend, and thus may serve as a poor counterfactual for California. 21

 Table 3 presents difference-in-differences estimates of the effect of California’s SIPO on

the natural log of confirmed COVID-19 cases. In each case, the sample is comprised of

California and each donor state that received a positive weight in the synthetic control exercise

described by each column, which follows the set of tests from Table 3. Panel I shows estimates

from unweighted regressions, while Panel II uses synthetic weights (which sum to 1) for the

donor states and a weight of 1.0 for California. All models include the full set of controls

described below equation (2) above. Standard errors are generated via wild cluster (state)

bootstrap.

 Our findings provide consistent evidence that the California SIPO had substantial

negative effects on coronavirus cases. Unweighted estimates in Panel I show that the enactment

of California’s SIPO was associated with a 50.3 to 58.9 percent decline in the coronavirus rate.

When we weight using synthetic weights (Panel II), the effect sizes range from approximately

35.5 to 53.7 percent declines. 22

 In Panel III of Table 3, we focus on regressions weighted by synthetic weights and

decompose the average treatment effect based on the approximate interquartile range of the

incubation window following enactment of the SIPO. Consistent with the synthetic control

estimates, we find that the effectiveness of the SIPO grows larger following the virus’s

incubation period and the period from time until first symptom until respiratory failure.

21
 This may also help explain why the estimated effects for deaths in Panel II of Appendix Table 2 are weak and do
not attain statistical significance at conventional levels. The longer lag from infection to incubation to ARDS limits
the quality of the synthetic control match when drawing from the smaller pool of never or late adopters.
22
 Given that the outcome is the log of the caseload, the percent decline for model 1 is [e-0.439- 1]*100 = 35.5%.

 25
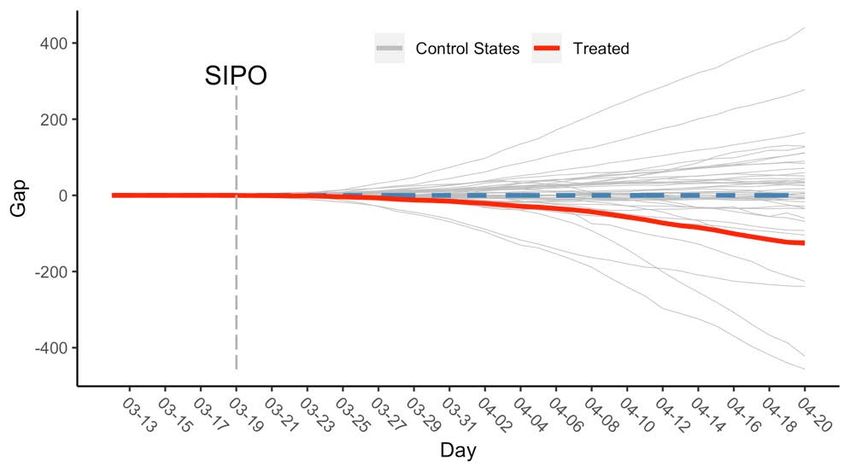
Together, the findings in Tables 1 through 3 provide compelling evidence that

California’s first-in-the-nation SIPO generated important public health benefits in preventing the

spread of the coronavirus during the first three weeks of enactment. 23 Next, we explore whether

these case declines generated improvements in mortality rates.

4.3 COVID-19 Deaths and California Statewide SIPO

 In Figures 12a through 12c, we show estimates of the effect of California’s SIPO on

coronavirus-related mortality. Figure 12a shows the exponential rise in cumulative COVID-19-

related deaths in California, from 0.01 per 100,000 population (4 deaths) on March 12 to 3.09 per

100,000 population (1,223 deaths) on April 20. When we generate a synthetic control using all

pre-treatment days to generate matches on COVID-related mortality rates, we find strong

evidence of a pre-March 19 common trend for California and synthetic California. On March

25, 6 days following enactment of the SIPO, we find that the rate of increase in mortality begins

falling in California as compared to the estimated counterfactual, with a gap that widens

exponentially over time, getting particularly large nearly two weeks after the policy’s adoption

on March 31, 2020.

 This longer lagged effect on mortality relative to cases is to be expected given the

incubation period from exposure to symptoms and time from first symptoms to acute respiratory

distress syndrome (ARDS), the latter of which may take up to 8 days (Wang et al. 2020).

Moreover, a more conservative synthetic control approach, shown in Appendix Figures 8a

through 8c, which requires pre-treatment mortality rate matches for every period through the sum

23
 In Appendix Figures 3a through 3c, we show synthetic control results when we use daily case rates rather than
cumulative case rates. This isolates a different local average treatment effect; that is, the effect of a SIPO on the rate
of change in the change in cumulative coronavirus cases. The results continue to provide evidence that California’s
SIPO reduced coronavirus-related mortality.

 26
You can also read