Caribbean Market Overview - Q3 2018 - CIBC
←
→
Page content transcription
If your browser does not render page correctly, please read the page content below

Caribbean Market Overview
         Q3 2018
GENERAL LEGAL DISCLAIMER
This communication has been prepared by CIBC FirstCaribbean International Bank (“FCIB”) and the Macro Strategy Desk within the Global Markets Group at CIBC Capital Markets .

CIBC LEGAL DISCLAIMER

CIBC CAPITAL MARKETS — MACRO STRATEGY
This communication, including any attachment(s), is confidential and has been prepared by the Macro Strategy Team and may include contributions from CIBC Economics, CIBC
Capital Markets Desk Strategists and the Research Department within the Global Markets Group at CIBC Capital Markets.
CIBC Capital Markets is a trademark brand name under which different legal entities provide different services. Products and/or services offered through CIBC Capital Markets
include products and/or services offered by the Canadian Imperial Bank of Commerce and various of its subsidiaries. Services offered by the Canadian Imperial Bank of Commerce
include corporate lending services, foreign exchange, money market instruments, structured notes, interest rate products and OTC derivatives. CIBC’s Foreign Exchange Disclosure
Statement relating to guidelines contained in the FX Global Code can be found at www.cibccm.com/fxdisclosure. Other products and services, such as exchange-traded equity
and equity options, fixed income securities and futures execution of Canadian securities are offered through directly or indirectly held by CIBC World Markets Inc. or other CIBC
subsidiaries as indicated below.
The contents of this communication are based on macro and issuer-specific analysis, issuer news, market events and general institutional desk discussion. The author(s) of this
communication is not a Research Analyst and this communication is not the product of any CIBC World Markets Inc. Research Department nor should it be construed as a Research
Report. The author(s) of this communication is not a person or company with actual, implied or apparent authority to act on behalf of any issuer mentioned in the communication.
The commentary and any attachments (other than any attached CIBC World Markets Inc. branded Research Reports) and opinions expressed herein are solely those of the individual
author(s), except where the author expressly states them to be the opinions of CIBC World Markets Inc. The author(s) may provide short-term trading views or ideas on issuers,
securities, commodities, currencies or other financial instruments but investors should not expect continuing analysis, views or discussion relating to the securities, securities,
commodities, currencies or other financial instruments discussed herein. Any information provided herein is not intended to represent an adequate basis for investors to make an
informed investment decision and is subject to change without notice. CIBC World Markets Inc., Canadian Imperial Bank of Commerce or its affiliates may, currently or at any time in
the future, engage in these trading strategies or hold positions in these issuers, securities, commodities, currencies or other financial instruments discussed in this communication
and may abandon such trading strategies or unwind such positions at any time without notice.
The contents of this message are tailored for particular client needs and accordingly, this message is intended for the specific recipient only. Any dissemination, re-distribution or
other use of this message or the market commentary contained herein by any recipient is unauthorized. If you are not the intended recipient, please reply to this e-mail and delete
this communication and any copies without forwarding them.
This report does not take into account the investment objectives, financial situation or specific needs of any particular client of CIBC. Before making an investment decision on the
basis of any information contained in this report, the recipient should consider whether such information is appropriate given the recipient’s particular investment needs, objectives
and financial circumstances. CIBC suggests that, prior to acting on any information contained herein, you contact one of our client advisers in your jurisdiction to discuss your
particular circumstances. Since the levels and bases of taxation can change, any reference in this report to the impact of taxation should not be construed as offering tax advice; as
with any transaction having potential tax implications, clients should consult with their own tax advisors. Past performance is not a guarantee of future results. The information and
any statistical data contained herein were obtained from sources that we believe to be reliable, but we do not represent that they are accurate or complete, and they should not be
relied upon as such. All estimates and opinions expressed herein constitute judgments as of the date of this report and are subject to change without notice. This report may provide
addresses of, or contain hyperlinks to, Internet web sites. CIBC has not reviewed the linked Internet web site of any third party and takes no responsibility for the contents thereof.
Each such address or hyperlink is provided solely for the recipient’s convenience and information, and the content of linked third-party web sites is not in any way incorporated into
this document. Recipients who choose to access such third-party web sites or follow such hyperlinks do so at their own risk.
Distribution in Hong Kong: This communication has been approved and is issued in Hong Kong by Canadian Imperial Bank of Commerce, Hong Kong Branch, a registered institution
under the Securities and Futures Ordinance (the “SFO”) to “professional investors” as defined in clauses (a) to (h) of the definition thereof set out in Schedule 1 of the SFO. Any
recipient in Hong Kong who has any questions or requires further information on any matter arising from or relating to this communication should contact Canadian Imperial Bank
of Commerce, Hong Kong Branch at Suite 3602, Cheung Kong Centre, 2 Queen’s Road Central, Hong Kong (telephone number: +852 2841 6111).
Distribution in Singapore: This communication is intended solely for distribution to accredited investors, expert investors and institutional investors (each, an “eligible recipients”).
Eligible recipients should contact Danny Tan at Canadian Imperial Bank of Commerce, Singapore Branch at 16 Collyer Quay #04-02 Singapore 049318 (telephone number + 65-6423
3806) in respect of any matter arising from or in connection with this report.
Distribution in Japan: This communication is distributed in Japan by CIBC World Markets (Japan) Inc.
Distribution in Australia: Communications concerning derivatives and foreign exchange contracts are distributed in Australia to “professional investors” within the meaning of the
Corporations Act 2001 by CIBC World Markets Inc. Communications concerning securities are distributed in Australia by CIBC Australia Ltd (License no. 240603; ACN 000 067 256)
to CIBC Capital Markets clients.
CIBC World Markets Inc. is a member of the Canadian Investor Protection Fund and the Investment Industry Regulatory Organization of Canada. In the United States, CIBC World
Markets Corp. is a member of the Financial Industry Regulatory Authority and the Securities Investor Protection Fund. CIBC World Markets plc is authorized by the Prudential
Regulation Authority and regulated by the Financial Conduct Authority and Prudential Regulation Authority. Canadian Imperial Bank of Commerce, Sydney Branch (ABN: 33 608 235
847), is an authorized foreign bank branch regulated by the Australian Prudential Regulation Authority (APRA). CIBC Australia Ltd (AFSL No: 240603) is regulated by the Australian
Securities and Investment Commission (“ASIC”). CIBC World Markets (Japan) Inc. is a member of the Japanese Securities Dealer Association. Canadian Imperial Bank of Commerce,
Hong Kong Branch, is a registered institution under the Securities and Futures Ordinance, Cap 571. Canadian Imperial Bank of Commerce, Singapore Branch, is an offshore bank
licensed and regulated by the Monetary Authority of Singapore.
Unauthorized use, distribution, duplication or disclosure without the prior written permission of CIBC World Markets Inc. is prohibited and may result in prosecution.

Caribbean Market Overview – Q3 2018

Table of Contents

Caribbean Market Review ......................................................................................................... 2
Caribbean Economic Review .................................................................................................. 11
Anguilla .................................................................................................................................... 13
Antigua and Barbuda ............................................................................................................... 15
Aruba ....................................................................................................................................... 17
The Bahamas .......................................................................................................................... 19
Barbados ................................................................................................................................. 21
Belize ....................................................................................................................................... 23
Bermuda .................................................................................................................................. 25
Cayman Islands ....................................................................................................................... 27
Costa Rica ............................................................................................................................... 30
Curaçao ................................................................................................................................... 32
Dominica ................................................................................................................................. 34
Dominican Republic ................................................................................................................ 36
El Salvador .............................................................................................................................. 38
Grenada .................................................................................................................................. 40
Guyana .................................................................................................................................... 42
Jamaica ................................................................................................................................... 44
Panama ................................................................................................................................... 47
St. Kitts and Nevis ................................................................................................................... 49
St. Lucia .................................................................................................................................. 51
Sint Maarten ............................................................................................................................ 53
St. Vincent and the Grenadines .............................................................................................. 55
Suriname ................................................................................................................................. 57
Trinidad and Tobago ............................................................................................................... 59
Turks and Caicos .................................................................................................................... 62
About CIBC ............................................................................................................................. 64
About CIBC FirstCaribbean ..................................................................................................... 65
Notes ....................................................................................................................................... 66

CIBC Capital Markets & CIBC FirstCaribbean International Bank                                                                   October 2018

Caribbean Market Overview – Q3 2018                                       1

Caribbean Market Review

CIBC Capital Markets & CIBC FirstCaribbean International Bank   October 2018

Caribbean Market Overview – Q3 2018                                                                                         2

Caribbean Market Review                                                                                     Luis Hurtado
                                                                                                           Macro Strategy
Summary

Emerging market credits traded with a risk premium reflecting ongoing trade concerns as the US imposed tariffs on its
closest allies and China. This situation subsided somewhat in the weeks leading to this publication as the US, Mexico,
and Canada have reached a new trade agreement in principle, but it still has to be ratified by their respective legislatures.
Nonetheless, trade war fears remain front and centre, as further moves against China by the current US administration
could put EM credits under additional pressure, especially those credits highly dependent on commodity prices. On the
monetary policy front, advanced economies’ monetary tightening continued their course, signalling a similar pace of rate
increases into 2019. Still, not a fertile outlook for EM in general terms, but particularly adverse for those credits with
significant US$ funding needs.
In the Caribbean and Central America, with the exception of JAMAN and BERMUDA, all credits widened further. The
main story of the region was the deterioration of COSTAR, as the odds of an even diluted reform diminished. Moreover,
the market’s concerns regarding the government’s ability to find sources of financing at reasonable rates increased as the
Central Bank approved buying three month treasury notes from the Ministry of Finance during the last week of
September. Considering the overall widening of Central American and Caribbean credits, DOMREP and PANAMA held
up relatively well. In DOMREP, the government announced its 2019 Budget with a deficit of 1.7% of GDP (vs. 2.2% in
2018) an optimistic proposal calling for an improvement year-over-year. Regarding issuance for next year, DOMREP will
have to finance around US$4bln, of which we expect US$3bln to come from external markets. In Panama, despite the
deceleration in growth, the credit has not shown any signs of weakness. We do expect growth to pick up in 2019 and the
electoral process to not bring any big surprises with respect to the country’s macro fundamentals. For JAMAN, we expect
the credit to maintain a strong performance, supported by its ability to meet the IMF’s targets and expectations of higher
growth in the short-term.
In the midst of default and falling FX reserves, the Government of Barbados and the IMF reached an agreement on a 4-
                                                                                        st
year US$290mln financing programme under the Extended Fund Facility on October 1 2018. The government’s
associated fiscal consolidation programme will target an initial primary surplus of 6% of GDP from 2019/20, and in
conjunction with proposed debt restructuring, targets a debt-to-GDP ratio of 60% by 2033.
PANAMA widened 18 bps on average since our last publication while DOMREP remained relatively flat, only increasing
14 bps on average during the same period. As stated above, economic growth was disappointing in H1 2018 in Panama;
however, we expect economic activity to rebound in the latter part of this year as construction recovers the time lost
during the SUNTRAC strike in April/May. Moreover, we expect copper production to improve the country’s external
account and act as of one of the main economic drivers in 2019. DOMREP’s amazing growth during H1 2018 has put the
country on track for 6% growth in 2018. We expect solid growth to continue into 2019, supporting the good performance of
the credit.
In El Salvador, the Minister of Finance Nelson Fuentes confirmed a 2019 deficit of around US$600mln and debt issuance
of up to US$1.4bln in 2019, which includes US$800mln to pay the ELSALV 19s. We think liability management issuance
is unlikely to get approved before the elections. While the FMLN was pushing for it, ARENA will be reluctant to provide the
FMLN government with any additional resources to boost its popularity ahead of the presidential election. Moreover, with
Bukele maintaining momentum and looking competitive, both ARENA and the FMLN will likely be reluctant to help an
eventual Bukele’s presidency and risk losing their negotiating power in congress. Therefore, we expect volatility to
increase in late 2018 and into 2019 and maintain a high level of caution on ELSALV.
On the other side of the spectrum, COSTAR widened 100 bps on average as fiscal concerns rose. Reform discussion
delays, reform dilution, extraordinary budgets, non-procedural debt issuance, strikes, and now the sale of treasury notes
to the Central bank all materialized since our last quarterly report. Moreover, some of our concerns regarding the
procedure of the reform in Congress resurfaced during the last week of September. Judges of the Supreme Court of
Justice argued that the reform would alter the operations and functioning of the justice system. This statement is very
important and worrisome as the Sala IV of the Supreme Court will decide if the fiscal reform followed a proper procedure
in Congress. The issue with this latest development is that the government will need 2/3rds of the votes in Congress to

CIBC Capital Markets & CIBC FirstCaribbean International Bank                                                  October 2018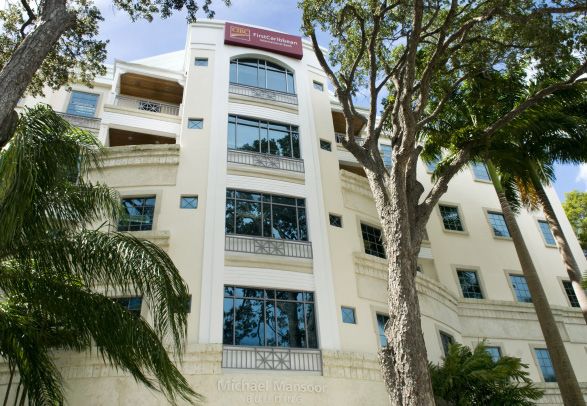
Caribbean Market Overview – Q3 2018 3
approve any law affecting the operations of the justice system if the court is not in favour. Currently, the government does
not have such support.
Bahamas: A rebound in tourism performance and preliminary indicators of construction activity suggest that y/y
growth in economic activity continued to accelerate year-to-date 2018. During January – May 2018, total visitor
arrivals to the Bahamas increased 3.1% y/y. Air arrivals rebounded 15.0% y/y as greater arrivals to New
Providence (up 17.6% y/y) and the Family Islands (up 11.8% y/y) more than offset a 4.4% y/y fall in air arrivals to
Grand Bahama. Preliminary construction indicators imply that construction activity likely improved y/y during Q2
2018. During the first eleven months of the fiscal year ending May 2018, the government reduced its fiscal deficit
by 29.2% y/y to US$211.9mln. Notwithstanding declines in domestic direct debt (down 3.8% y/y) and contingent
liabilities (down 3.4% y/y), a 49.7% y/y surge in direct foreign currency debt increased the total national debt by
9.2% y/y to US$7.95bln (about 65.3% of 2017 nominal GDP).
Barbados: During its H1 2018 review of the Barbados economy, the Central Bank of Barbados (CBB) suggested
that negative growth in the tourism, construction and distribution sectors reduced real GDP by 0.6% y/y. Real
value-added in tourism activity fell 2.3% y/y. The number of stay-over arrivals increased 3.4% y/y as arrivals from
the USA, Canada and the UK increased 8.9% y/y, 3% y/y and 3.6% y/y, respectively, but a persistent decline in
the average length of stay reduced total output in the sector over the period. Construction activity declined by
4.0% y/y and coincided with a 1.5% y/y fall in mining and quarrying output. While most other sectors recorded
negative economic growth, output in sugar and non-sugar agriculture each rebounded 24.1% y/y and 9.4% y/y,
respectively. The suspension of interest payments to external creditors and greater revenues from new and
higher taxes substantially reduced the government’s fiscal deficit by 92.4% y/y to US$5.2mln during the April –
June 2018 period. Latest CBB estimates suggest that gross public sector debt increased to 155.0% of GDP at Q2
2018 from 146.6% of GDP one year prior.
Bermuda: Notwithstanding strong growth in net external demand, the Government of Bermuda reported that
weaker consumption and gross capital formation reduced real GDP by 0.4% y/y during Q1 2018. Stronger tourist
arrivals likely further boosted services exports during the first eight months of 2018. A 5.3% y/y rise in airline
capacity contributed to a 6.5% y/y increase in total air arrivals, while total cruise arrivals advanced 5.8% y/y.
Aggregate consumption fell 0.5% y/y as a 1.5% y/y decline in household consumption more than offset a 3.2% y/y
rise in government final consumption. For the fiscal year ending March 2018, the Government of Bermuda’s
nominal fiscal deficit (including the contribution to the sinking fund) declined to US$119.2mln, down 34.5% y/y and
11.5% less than originally budgeted. Excluding the sinking fund contribution, the deficit fell 53.8% y/y to
US$57.1mln. Gross government debt increased 3.4% y/y to US$2.57bln as at March 2018. Furthermore, on April
26, Standard and Poor’s (S&P) revised its outlook on Bermuda’s A+ sovereign debt rating to ‘positive’ from
‘stable’. The Government of Bermuda projects that real GDP will likely expand between 1.5% and 2.0% y/y during
2018, while S&P projects growth at 1.8% during the same period.
Costa Rica: Q2 2018 GDP growth came in at 3.5 % y/y, 0.7 percentage points above the 2.8% posted in Q1
2018, but below Q1 2017’s 3.7% y/y increase. The sluggish growth experienced in H1 2018 was in line with the
monetary tightening implemented by the Banco Central of Costa Rica (BCCR), the government’s efforts to reduce
the precarious fiscal situation, and low consumer and business confidence in an uncertain environment driven by
the presidential elections in February. On the fiscal front, August central government revenue came in at
CRC311bln (up 3.43% y/y) and total expenses came in at CRC454bln (+12.7% y/y). With these numbers, the 12-
month primary deficit also deteriorated from the 2.51% of GDP posted in August 2017 to 3.2% y/y of GDP as of
August 2018. We maintain our 3.2% growth forecast, as the precarious fiscal situation keeps business and
consumer confidence at low levels. For 2019, we do not expect a big rebound in economic activity, especially as
households and firms adjust to higher taxes.
Dominican Republic: H1 2018 GDP growth landed at 6.7% y/y maintaining the solid performance observed
since Q4 2017. More recent data suggests the continuation of this solid growth performance in Q3, as August
economic activity came in at 6.5% y/y, following the 7.3% y/y and 6.5% y/y growth posted in June and July. Q2
2018 Non-financial Public Sector (NFPS) revenues reached DOP153.9bln, increasing 5.5% y/y, but well below
the 16.6% y/y gain posted a year earlier. On the other hand, Q2 2018 expenses came in at DOP148.9bln, down
1.2% y/y. The 12 month NFPS fiscal deficit reached DOP91.9bln or 2.5% of GDP while the primary deficit came in
CIBC Capital Markets & CIBC FirstCaribbean International Bank October 2018
Caribbean Market Overview – Q3 2018 4
at DOP22.5bln or 0.6% of GDP, both below the 3.0% and 1.1% deficits posted at the end of 2017. The solid
growth performance earlier that year has extended beyond our initial calculations. Hence, we are revising our
2018 growth forecast upward to 6.0%.
El Salvador: Q2 GDP growth came in at 2.5% y/y, down from the 2.9% increase posted in Q1 2018, but in line
with our growth estimate of 2.5% for 2018. Remittances continued to bode well for consumption growth as they
reached US$3.6bln for the January-August period, increasing 9.5% y/y, while household credit increased 4.0%
y/y during the same period. The numbers released by the Central Bank of El Salvador indicate that NFPS
revenue (including donations) reached US$3.7bln year-to-date in July, increasing 5.2% from the same period last
year. On the other hand, NFPS expenses increased 11.7%, reaching US$3.7bln year-to-date in July, while the
12-month primary surplus came in at US$121.13mln (0.5% of GDP).
Jamaica: The Statistical Institute of Jamaica estimates that real GDP growth accelerated to 2.2% y/y during Q2
2018 compared to growth of 1.4% y/y one quarter prior. Despite lower interest costs, a surge in capital
expenditure widened the Government of Jamaica’s fiscal deficit by 113.0% y/y to US$97.4mln during April –
August 2018. On July 20th 2018, citing ongoing fiscal consolidation, and improved institutional capacity and policy
effectiveness, Moody’s Investors Service improved their outlook on Jamaica’s ‘B3’ rated sovereign debt from
stable to positive. Similarly, two months later S&P revised their outlook on Jamaica’s ‘B’ rated debt to positive,
citing the sovereign’s greater progress in achieving macroeconomic stability and an improved external debt
burden. The Planning Institute of Jamaica projects that real GDP growth will likely end calendar year 2018
between 1.5% and 2.5% and accelerate to between 2.0% and 3.0% during the twelve months ended March 2019.
Panama: Q2 2018 GDP numbers confirmed the deceleration in economic growth coming in at 3.8% y/y, below
the 4.24% y/y posted in Q1 2018 and Q2 2017’s 5.2% y/y. More recent data suggests the extension of the
decelerating trend into Q3 2018 as July economic activity posted a mere 2.0% y/y increase, below the 2.83% y/y
rise in May and well below the 3.8% from July 2017. On the fiscal front, central government revenue for the H1
2018 period came in at US$3.6bln (up 0.3% y/y), while total expenses reached US$5.3bln, increasing 20.7% y/y.
With these numbers, Non-Financial Public sector (NFPS) revenues for the first half of 2018 came in at US$5.7bln,
down 0.8% y/y. Total expenses increased US$1bln or 17.6% y/y to US$6.8bln, while current savings reached
US$900mln (down 37.1% y/y). Hence, the nominal NFPS deficit came in at US$1.1bln or 1.6% of GDP, while the
primary deficit reached US$521mln or 0.8% of GDP. The fiscal picture for the rest of 2018 does not look as good
as in previous years. The government tried to get a waiver of US$500mln as it looks like it will not be able to meet
its adjusted deficit of 0.5% of GDP this year. This of course would restrict the government’s expenditures into H2
2018 and/or reduce market confidence in future targets.
Suriname: While the net demand for domestic goods and services worsened y/y during H1 2018, rapid growth in
investment goods imports and key commodity exports imply possible improvement in economic activity over the
period. A combination of greater receipts and lower spending in US$ terms narrowed the fiscal deficit by 14.6%
y/y to US$247.6mln (7.4% of GDP) during 2017. Data available as at June 2018 from the Suriname Bureau for
the State Debt suggests that the government’s total debt declined 7.6% y/y to US$2.41bln. External debt
increased 5.7% y/y to US$1.65bln, but domestic debt fell 27.5% y/y to US$756.1mln. Going forward, the IMF
expects that real GDP will likely expand by 1.4% y/y by the end of the year.
Trinidad and Tobago: Latest Central Bank of Trinidad and Tobago (CBTT) estimates suggest that, despite
persistent weakness in non-energy output, a strong rebound in energy output increased real GDP by 3.1% y/y
during Q1 2018. Since then, petroleum production continued to expand. Over the first nine months of the fiscal
year ended June 2018, the government reduced its fiscal deficit by 54.5% y/y to US$661.3mln. Central
government domestic debt and total contingent debt fell 3.6 percentage points y/y and 1.4 percentage points y/y
to 43.1% of GDP and 18.1% of GDP, but the central government’s external debt-to-GDP ratio advanced 1.3
percentage points y/y to 15.7% of GDP. Latest IMF projections suggest that, after likely rebounding by 1.0% y/y in
2018, real GDP will likely expand marginally by 0.9% y/y in 2019.
CIBC Capital Markets & CIBC FirstCaribbean International Bank October 2018
Caribbean Market Overview – Q3 2018                                                                                                                                               5

Chart 1                                                                                         Chart 2
High Yield - 10Y Against Benchmark                                                              Investment Grade - 10Y Against Benchmark
3170 bps                                                                                        390 bps                  PANAMA                 ARUBA               BAHAMA
                                       DOMREP              BARBAD                                                        BERMUD                 TRITOB
2670                                                                                            340
                                       COSTAR              JAMAN
2170                                   SURINM              ELSALV                               290

                                                                                                240
1670
                                                                                                190
1170
                                                                                                140
  670                                                                                            90

  170                                                                                            40
    Aug-17       Sep-17        Nov-17      Jan-18   Mar-18     May-18   Jul-18         Sep-18     Aug-17    Sep-17   Nov-17         Jan-18   Mar-18   May-18    Jul-18   Sep-18

Source: Bloomberg and CIBC Capital Markets – Macro Strategy.
10Y bonds are: COSTAR 4 3/8 04/30/25 BARBAD 7 08/04/22 DOMREP 5.95 01/25/27 JAMAN 6 3/4 04/28/28 ARUBA 4 5/8 09/14/23 BAHAMA 5 3/4 01/16/24 BERMUD 4.854 02/06/24
TRITOB 4 1/2 08/04/26 PANAMA 3 7/8 03/17/28 SURINM 9 ¼ 10/26/26 ELSALV 6 3/8 01/18/27

Chart 3
Caribbean Bonds Change in Yields Since Last Publication (July 19, 2018)
           BARBAD 7 1/4 12/15/21
            ELSALV 7 3/8 12/01/19
               BARBAD 7 08/04/22
           COSTAR 4 1/4 01/26/23
           BARBAD 6 5/8 12/05/35
           COSTAR 4 3/8 04/30/25
          COSTAR 7.158 03/12/45
               COSTAR 7 04/04/44
            ELSALV 5 7/8 01/30/25
            ELSALV 6 3/8 01/18/27
           COSTAR 5 5/8 04/30/43
            ELSALV 8 5/8 02/28/29
            ELSALV 7 3/4 01/24/23
            ELSALV 7.65 06/15/35
          COSTAR 9.995 08/01/20
            ELSALV 7 5/8 02/01/41
            TRITOB 4 1/2 08/04/26
          DOMREP 7 1/2 05/06/21
             ARUBA 4 5/8 09/14/23
            TRITOB 9 3/4 07/01/20
            TRITOB 4 3/8 01/16/24
             PANAMA 5.2 01/30/20
            ELSALV 7 5/8 09/21/34
           PANAMA 3 7/8 03/17/28
           PANAMA 7 1/8 01/29/26
             PANAMA 4.3 04/29/53
           PANAMA 3 3/4 03/16/25
           DOMREP 7.45 04/30/44
              PANAMA 4 09/22/24
             JAMAN 9 1/4 10/17/25
           PANAMA 4 1/2 05/15/47
           DOMREP 6.85 01/27/45
           CAYMAN 5.95 11/24/19
          BERMUD 5.603 07/20/20
           BAHAMA 6.95 11/20/29
          DOMREP 6 7/8 01/29/26
           PANAMA 8 7/8 09/30/27
          DOMREP 5 1/2 01/27/25
           PANAMA 9 3/8 04/01/29
           BAHAMA 5 3/4 01/16/24
            DOMREP 6.6 01/28/24
          DOMREP 8 5/8 04/20/27
          DOMREP 5 7/8 04/18/24
          BERMUD 4.138 01/03/23
             JAMAN 8 1/2 02/28/36
             JAMAN 7 7/8 07/28/45
          BERMUD 4.854 02/06/24
           BAHAMA 6 5/8 05/15/33
             JAMAN 7 5/8 07/09/25
                JAMAN 8 03/15/39
             JAMAN 6 3/4 04/28/28
           BAHAMA 7 1/8 04/02/38
           SURINM 9 1/4 10/26/26
                JAMAN 8 06/24/19
                                    -100                  0                      100                  200                     300                     400                 500

Source: Bloomberg and CIBC Capital Markets – Macro Strategy.

CIBC Capital Markets & CIBC FirstCaribbean International Bank                                                                                                  October 2018
Caribbean Market Overview – Q3 2018 6
Chart 4 Chart 5
Caribbean – Investment Grade Caribbean – High Yield
7 YTM 10 YTM
SURINM '26
BAHAMA '38
9
BAHAMA '29 BAHAMA' 33
6
8
DOMREP '44
TRITOB '27 DOMREP 4/20/27 DOMREP '45
BAHAMA '24 7 JAMAN '36
5 DOMREP '21 JAMAN '45
TRITOB '24 DOMREP '25
ARUBA '23 BERMUD '27 6 DOMREP 1/28/24
DOMREP 1/25/27 JAMAN '39
DOMREP '26
4 BERMUD '24
5
BERMUD '23 DOMREP 4/18/24 JAMAN 10/17/25
JAMAN 7/9/25
4
3
JAMAN '19
3
Modified Duration Modified Duration
2 2
2 4 6 8 10 12 0 2 4 6 8 10 12 14
Source: Bloomberg and CIBC Capital Markets – Macro Strategy. Source: Bloomberg and CIBC Capital Markets – Macro Strategy.
Chart 6 Chart 7
Central America – Panama, Costa Rica, and El ELSALV ‘23s vs. COSTAR ‘23s
Salvador
YTM 350 5.0
9
ELSALV '35 ELSALV '41 4.0
ELSALV '29
COSTAR '45 300
8 ELSALV '25 COSTAR '44
ELSALV '27 250 3.0
7 COSTAR '20 ELSALV '23
ELSALV '34 COSTAR '43
2.0
COSTAR '25 200
6 COSTAR '23 1.0
5 150
ELSALV '19 PANAMA '27
PANAMA '29
PANAMA '47 0.0
4 PANAMA '28 100
PANAMA 01/30/20 -1.0
PANAMA '25 PANAMA '53 0.5
3
PANAMA '26 50
-2.0
PANAMA '24
Spread -2.26
2 0 -3.0
Z-Score (RHS)
1 -50 -4.0
Modified Duration
0 -100 -5.0
0 2 4 6 8 10 12 14 16 18 Sep-17 Dec-17 Mar-18 Jun-18 Sep-18
Source: Bloomberg and CIBC Capital Markets – Macro Strategy. Source: Bloomberg and CIBC Capital Markets – Macro Strategy.
Chart 8 Chart 9
COSTAR ‘44s vs. DOMREP ‘44s PANAMA ‘24s vs. BAHAMA ‘24s and BERMUD ‘24s
150 COSTAR 44 - DOMREP 44 5.0 0
4.0
99.1 -50
100
3.0
2.40 PANAMA '24s - BAHAMA '24s
2.0 -100
50 PANAMA '24s - BERMUD '24s
1.0 -150
0 Spread 0.0
Z-Score (RHS) -200
-1.0
-50
-2.0 -250
-100 -3.0
-300
Sep-17 Dec-17 Mar-18 Jun-18 Sep-18
Sep-17 Dec-17 Mar-18 Jun-18 Sep-18
Source: Bloomberg and CIBC Capital Markets – Macro Strategy. Source: Bloomberg and CIBC Capital Markets – Macro Strategy.
CIBC Capital Markets & CIBC FirstCaribbean International Bank October 2018Caribbean Market Overview – Q3 2018 7
Table 1
Public Sector Fiscal Accounts and Debt 2018/19
Primary/Adjusted Nominal Gross Government Net Public Sector Real
2017/18 Balance Balance Debt Debt GDP Growth
% of GDP % of GDP % of GDP % of GDP % of GDP
Antigua and Barbuda -2.7% -5.9% 88.2% n.a. 3.9%
Aruba 3.1% -1.6% 74.7% 26.5% 0.3%
The Bahamas 0.2% -2.3% 53.9% 49.9% 2.5%
Barbados 3.3% -1.3% 123.6% 111.7% -0.5%
Belize 2.0% -1.5% 97.5% 93.1% 1.8%
Bermuda 0.6% -1.3% 40.7% -2.9% 1.8%
Cayman Islands 2.4% 1.5% 14.3% n.a. 2.2%
Costa Rica -3.5% -7.0% 54% n.a. 3.2%
Dominica -2.1% -5.5% 87.7% n.a. -14.1%
Dominican Republic -0.1% -2.5% 38.6% 27.5% 6.0%
El Salvador 0.1% -3.1 63.5% n.a. 2.5%
Grenada 5.6% 3.4% 65.0% n.a. 3.2%
Jamaica 7.0% -0.2% 98.3% 90.8% 1.4%
Panama -0.5% -2.0% 39% 35.0% 4.0%
St. Kitts and Nevis 0.9% -0.8% 60.3% n.a. 2.4%
St. Lucia -1.0% -4.6% 72.2% n.a. 2.1%
St. Vincent and the Grenadines 0.1% -2.0% 81.4% 78.1% 1.2%
Suriname -2.7% -5.0% 68.5% 66.1% 1.4%
Trinidad and Tobago -1.7% -4.6% 63.5% n.a. 0.9%
Sources: IMF, Bloomberg, CIBC Capital Markets - Macro Strategy, Cayman Islands' Economics and Statistics Office (ESO), Standard and Poor's.
NA: Not available.
Table 2
Ratings of Caribbean Sovereigns
Ratings Key
2017 Ratings Investment Grade High Yield
S&P Moody’s S&P Moody’s S&P Moody’s
Aruba BBB+ NA AAA Aaa BB+ Ba1
The Bahamas BB+ Baa3 AA+ Aa1 BB Ba2
Barbados SD Caa3 AA Aa2 BB- Ba3
Bermuda A+ A2 AA- Aa3 B B2
Cayman NA Aa3 A+ A1 B- B3
Costa Rica BB- Ba2 A A2 CCC+ Caa1
Dominican Republic BB- Ba3 A- A3 CCC Caa2
El Salvador CCC+ B3 BBB+ Baa1 CCC- Caa3
Jamaica B B3 BBB Baa2 CC Ca
Panama BBB Baa2 BBB- Baa3 C C
Suriname B B2 D
Trinidad and Tobago BBB+ Ba1
*-: On review for downgrade
CIBC Capital Markets & CIBC FirstCaribbean International Bank October 2018Caribbean Market Overview – Q3 2018 8
Table 3
Caribbean Bonds and Indicative Prices/Spreads (As of October 4, 2018)
Aruba
Bond Price Yield 3m Yield Change Z-Spread S&P Moody's Fitch
ARUBA 4 5/8 09/14/23 100.69 4.47% 38.89 119.20 BBB+ NR BBB-
Bahamas
Bond Price Yield 3m Yield Change Z-Spread S&P Moody's Fitch
BAHAMA 5 3/4 01/16/24 102.34 5.23% 7.22 203.99 BB+ Baa3 NR
BAHAMA 6.95 11/20/29 107.27 6.04% 16.13 271.47 BB+ Baa3 NR
BAHAMA 6 5/8 05/15/33 104.95 6.11% -8.89 277.37 BB+ Baa3 NR
BAHAMA 7 1/8 04/02/38 106.01 6.57% -11.74 320.94 BB+ Baa3 NR
Barbados
Bond Price Yield 3m Yield Change Z-Spread S&P Moody's Fitch
BARBAD 7 1/4 12/15/21 56.46 28.28% 426.08 #N/A N/A SD Caa3 NR
BARBAD 7 08/04/22 54.39 25.53% 178.62 #N/A N/A SD NA NR
BARBAD 6 5/8 12/05/35 55.87 12.94% 122.76 #N/A N/A SD Caa3 NR
Bermuda
Bond Price Yield 3m Yield Change Z-Spread S&P Moody's Fitch
BERMUD 5.603 07/20/20 103.57 3.51% 16.93 44.66 A+ A2 WD
BERMUD 4.138 01/03/23 101.60 3.72% -0.29 52.86 A+ A2 WD
BERMUD 4.854 02/06/24 104.28 3.95% -7.80 73.76 A+ A2 WD
BERMUD 3.717 01/25/27 95.30 4.40% 2.07 117.57 A+ A2 NA
Cayman Islands
Bond Price Yield 3m Yield Change Z-Spread S&P Moody's Fitch
CAYMAN 5.95 11/24/19 103.26 2.98% 17.54 -13.23 NR Aa3 NR
Costa Rica
Bond Price Yield 3m Yield Change Z-Spread S&P Moody's Fitch
COSTAR 9.995 08/01/20 108.00 5.30% 72.22 214.05 BB- Ba2 NR
COSTAR 4 1/4 01/26/23 92.03 6.40% 125.61 320.66 BB- Ba2 BB
COSTAR 4 3/8 04/30/25 88.94 6.47% 109.57 327.08 BB- Ba2 BB
COSTAR 5 5/8 04/30/43 80.72 7.33% 78.44 405.10 BB- Ba2 BB
COSTAR 7 04/04/44 90.89 7.83% 100.86 455.23 BB- Ba2 BB
COSTAR 7.158 03/12/45 91.80 7.90% 107.17 461.67 BB- Ba2 BB
Dominican Republic
Bond Price Yield 3m Yield Change Z-Spread S&P Moody's Fitch
DOMREP 7 1/2 05/06/21 104.54 5.58% 40.22 140.25 BB- Ba3 BB-
DOMREP 5 7/8 04/18/24 102.96 5.25% 3.46 194.28 BB- Ba3 BB-
DOMREP 6.6 01/28/24 105.66 5.36% 4.99 218.97 BB- Ba3 BB-
DOMREP 5 1/2 01/27/25 100.02 5.49% 11.31 227.62 BB- Ba3 BB-
DOMREP 6 7/8 01/29/26 106.73 5.73% 13.19 251.86 BB- Ba3 BB-
DOMREP 5.95 01/25/27 101.65 5.70% 5.62 246.32 BB- Ba3 BB-
DOMREP 8 5/8 04/20/27 113.45 6.54% 4.24 310.83 BB- Ba3 BB-
DOMREP 7.45 04/30/44 106.82 6.88% 18.88 359.66 BB- Ba3 BB-
DOMREP 6.85 01/27/45 100.96 6.77% 17.72 349.15 BB- Ba3 BB-
DOMREP 6 1/2 02/15/48 97.54 6.69% 15.37 341.87 BB- Ba3 BB-
El Salvador
Bond Price Yield 3m Yield Change Z-Spread S&P Moody's Fitch
ELSALV 7 3/8 12/01/19 101.21 6.25% 200.53 330.21 CCC+ B3 B-u
ELSALV 7 3/4 01/24/23 104.41 6.55% 73.78 335.89 CCC+ B3 B-u
ELSALV 5 7/8 01/30/25 93.55 7.16% 84.03 396.28 CCC+ B3 B-u
ELSALV 6 3/8 01/18/27 93.57 7.43% 82.81 421.01 CCC+ B3 B-u
ELSALV 8 5/8 02/28/29 106.06 7.76% 78.04 451.96 CCC+ B3 NA
ELSALV 7 5/8 09/21/34 101.68 7.44% 29.23 414.40 CCC+ B3 B-u
ELSALV 7.65 06/15/35 96.36 8.05% 73.11 475.24 CCC+ B3 B-u
ELSALV 7 5/8 02/01/41 96.18 7.99% 56.64 469.20 CCC+ B3 B-u
Jamaica
Bond Price Yield 3m Yield Change Z-Spread S&P Moody's Fitch
JAMAN 8 06/24/19 102.81 3.93% -54.29 81.37 B B3 Bu
JAMAN 7 5/8 07/09/25 115.20 4.95% -10.18 137.18 B B3 Bu
JAMAN 9 1/4 10/17/25 125.13 4.97% 18.11 176.97 B B3 Bu
JAMAN 6 3/4 04/28/28 110.35 5.35% -10.22 197.95 B B3 Bu
JAMAN 8 1/2 02/28/36 121.96 6.39% -6.81 308.64 B B3 Bu
JAMAN 8 03/15/39 118.23 6.39% -10.21 307.09 B B3 Bu
JAMAN 7 7/8 07/28/45 117.15 6.51% -7.35 323.83 B B3 Bu
CIBC Capital Markets & CIBC FirstCaribbean International Bank October 2018Caribbean Market Overview – Q3 2018 9
Panama
Bond Price Yield 3m Yield Change Z-Spread S&P Moody's Fitch
PANAMA 5.2 01/30/20 102.68 3.09% 30.43 13.22 BBB Baa2 BBB
PANAMA 4 09/22/24 101.22 3.77% 18.85 57.32 BBB Baa2 BBB
PANAMA 3 3/4 03/16/25 99.37 3.86% 20.95 66.82 BBB Baa2 BBB
PANAMA 7 1/8 01/29/26 118.90 4.10% 22.11 90.94 BBB Baa2 BBB
PANAMA 8 7/8 09/30/27 134.87 4.18% 12.04 94.96 BBB Baa2 BBB
PANAMA 3 7/8 03/17/28 98.65 4.05% 22.87 81.40 BBB Baa2 BBB
PANAMA 9 3/8 04/01/29 141.44 4.40% 7.77 115.30 BBB Baa2 BBB
PANAMA 6.7 01/26/36 123.73 4.68% 12.26 132.53 BBB Baa2 BBB
PANAMA 4 1/2 05/15/47 98.38 4.60% 18.00 133.23 BBB Baa2 BBB
PANAMA 4.3 04/29/53 94.42 4.63% 21.11 137.47 BBB Baa2 BBB
Suriname
Bond Price Yield 3m Yield Change Z-Spread S&P Moody's Fitch
SURINM 9 1/4 10/26/26 98.83 9.46% -17.16 623.65 B B2 NR
Trinidad and Tobago
Bond Price Yield 3m Yield Change Z-Spread S&P Moody's Fitch
TRITOB 9 3/4 07/01/20 110.26 3.57% 38.71 38.43 BBB+ Ba1 NR
TRITOB 4 3/8 01/16/24 98.04 4.80% 33.24 156.31 BBB+ Ba1 NR
TRITOB 4 1/2 08/04/26 94.15 5.43% 55.30 222.27 BBB+ Ba1 NR
Source: Bloomberg and CIBC Capital Markets – Macro Strategy.
CIBC Capital Markets & CIBC FirstCaribbean International Bank October 2018Caribbean Market Overview – Q3 2018 10 Caribbean Economic Review CIBC Capital Markets & CIBC FirstCaribbean International Bank October 2018
Caribbean Market Overview – Q3 2018                                                                                                                                                                                                            11

Caribbean Economic Review                                                                                                                                                                               Shane Lowe
                                                                                                                                                                                                  CIBC FirstCaribbean
The economic rebound in advanced economies continued into the second quarter of 2018. Annualised real GDP growth in
the US accelerated to 4.2% during Q2 2018, up from 2.2% one quarter earlier. The US Bureau of Economic Analysis
suggests that the faster rate of expansion benefited from faster growth in personal consumption, exports, and federal,
state, and local government spending, but suffered from slower growth in non-residential fixed investment and weaker
activity in private inventory investment. Similarly, growth in goods exports, household expenditure, housing investment,
and business capital investment accelerated Q2 2018 GDP growth in Canada to an annualised rate of 2.9%. In contrast,
growth in the UK remained modest (up 1.2% y/y during Q2 2018), while the challenging economic environment in
Venezuela persisted year-to-date. Finally, global crude oil and natural gas prices’ upward trend continued with the prices
of WTI crude oil and Henry Hub natural gas advancing 41.7% y/y and 3.4% y/y during August 2018.
Developments in economic activity in the Caribbean generally responded to global economic trends and external shocks
for the year-to-date 2018. Most markets experienced some expansion in real GDP, but those countries affected by
Hurricanes Irma and Maria in Q3 2017 and those who depend heavily on the UK or Venezuela for tourist arrivals
experienced either modest or negative economic growth over the period. Anguilla, Dominica, and St. Maarten all
witnessed contractions in total tourist arrivals of more than a third, and 2018 economic growth is projected to remain
negative in each of these markets after contracting in 2017. Moreover, ongoing fiscal contraction, economic uncertainty
and a steady decline in the length of stay and average tourist expenditures further reduced economic activity in UK tourist-
dependent Barbados during H1 2018, while sharp declines in stay-over arrivals from Venezuela to Aruba and Curaçao
constrained faster growth in tourist arrivals for the year-to-date. In sum, despite most markets experiencing some
expansion in arrivals thus far in 2018, aggregate stay-over arrivals declined 3.7% y/y during the first four months of 2018
compared to a more modest 1.4% y/y decline a year ago. In contrast, commodity producers generally benefited from more
favourable energy prices and increased production of some commodities as well as witnessed other positive signs of
economic growth during the period. Finally, surges in capital expenditure in some hurricane-affected markets likely
partially offset the fall-out from fewer tourist arrivals, but private sector construction activity likely led growth in overall
construction thus far in 2018.
Again, the effects of external developments influenced fiscal performances in many markets so far in 2018. Those
markets hit by Hurricanes Irma and Maria have lost revenue from weaker economic activity and/or substantially increased
expenditure related to reconstruction and rehabilitation post-disaster. In contrast, fiscal performance in the Bahamas
improved after large one-off expenditures post-Hurricane Matthew in 2016/17, while higher taxes and a suspension of
external interest payments improved the fiscal accounts in Barbados. Similarly, Trinidad and Tobago and St. Kitts and
Nevis experienced improved fiscal balances on account of greater global energy prices and domestic output, as well as
citizenship-by-investment inflows. Performances remained mixed in all other markets.
Chart 1                                                                                                                  Chart 2
Trends in Regional1 Tourist Arrivals                                                                                     Regional2 Loan Growth (y/y; %)
      9 12-mth moving          Total Stay-Over Arrivals (R)   (mln)                                                             20
      8 average                                                                                                                                      Retail Loans
                               Growth in Tourist Arrivals (L)
      7 growth (%)                                                                                                              15
                                                                                                                                                     Corporate Loans
      6
      5                                                                                                                         10
      4
      3                                                                                                                           5
      2
      1                                                                                                                           0
      0
     -1                                                                                                                          -5
     -2
     -3                                                                                                                        -10
       Apr-14 Oct-14 Apr-15 Oct-15 Apr-16 Oct-16 Apr-17 Oct-17 Apr-18                                                             Mar-14 Sep-14 Mar-15 Sep-15 Mar-16 Sep-16 Mar-17 Sep-17 Mar-18
Source: Caribbean Tourism Organization, Eastern Caribbean Central Bank and CIBC FirstCaribbean.                          Source: Regional authorities and CIBC FirstCaribbean.

1 Caribbean region includes: Anguilla, Antigua and Barbuda, Aruba, the Bahamas, Barbados, Belize, British Virgin Islands, Cayman Islands, Curaçao, Dominica, Grenada, Jamaica, St. Kitts and Nevis, St. Lucia,
St. Maarten and St. Vincent and the Grenadines.
2 Caribbean region includes: Anguilla, Antigua and Barbuda, Aruba, the Bahamas, Barbados, Belize, Curaçao, Dominica, Grenada, Jamaica, St. Kitts and Nevis, St. Lucia, St. Maarten, St. Vincent and the Grenadines, Trinidad and Tobago, and

Turks and Caicos Islands.

CIBC Capital Markets & CIBC FirstCaribbean International Bank                                                                                                                                                        October 2018
Caribbean Market Overview – Q3 2018 12
Rising global oil prices continued to influence trends in consumer prices and to a lesser extent FX reserves in 2018.
Consumer prices continued to rise in 2018 and the average inflation rate excluding Suriname reached 1.8% y/y (2.2% y/y
including Suriname) as at March 2018. Latest data suggest that inflation rates accelerated in most markets relative to the
corresponding period one year earlier, but have stabilised or declined for the year-to-date. Further, consumer prices
increased in all markets y/y except for St. Kitts and Nevis where prices fell just marginally. FX reserves generally
remained adequate by global benchmarks, except primarily in Barbados and Guyana. Faster imports than exports
widened the trade deficit in Guyana and reduced FX reserves to just over 2 months of imports, while a persistent decline
in reserves since 2012 culminated in FX reserves reaching 7 weeks of imports in June 2018, before the newly-elected
Government of Barbados opted to default on its external debt to reduce the chances of further FX reserves depletion and
currency devaluation. Finally, despite a recovery in energy exports, a net outflow of capital continues to keep FX reserves
in Trinidad and Tobago on a downward trajectory.
Regional loan growth accelerated during the first quarter of 2018, but faster deposit growth further increased excess
liquidity y/y over the same period. Total loans and advances increased 1.2% y/y as a 4.5% y/y increase in retail lending
eclipsed a 2.5% y/y fall in corporate loans. However, domestic deposits increased 6.5% y/y compared to 1.0% y/y over
the same period one year prior. Loan quality continues to improve in the larger markets, but has started to worsen in
hurricane-hit markets. However, capital adequacy remains above globally-accepted minimums.
With economic growth in North America accelerating year-to-date, and the IMF projecting that global GDP growth will
remain robust and broadly-based for the rest of 2018 and into 2019, economic activity will likely also expand across most
markets in the Caribbean in 2019. Those economies most affected by hurricanes will likely experience some recovery in
output in 2019 as tourism and agriculture value-added rebound, along with construction activity that continues to support
rebuilding and rehabilitation work. Other markets most dependent on US and Canadian tourists will likely benefit from
greater arrivals, while a sustained improvement in global energy prices, though more modest than over the last year,
bodes well for economic growth and the balance of payments for the region’s commodity exporters. Consumer prices,
supported by higher taxes in some markets, will thus probably continue on their upward trajectory. Finally, as Barbados
likely embarks on an IMF-financed fiscal consolidation programme, economic growth in that economy is expected to
remain subdued, but external buffers should recover with each successful, periodic IMF review. Public debt levels should
fall sharply once domestic and external debt restructurings are completed, but the nature of these restructurings and the
successful implementation of revenue measures, expenditure cuts, and structural reforms will determine the speed at
which the government regains access to international capital markets.
Chart 3
Regional3 Inflation and Intl. Commodity Prices (y/y; %)
5 90
Regional Inflation Rate (L) 70
4
50
3
30
2 10
-10
1
-30
0
-50
-1 -70
Mar-14 Sep-14 Mar-15 Sep-15 Mar-16 Sep-16 Mar-17 Sep-17 Mar-18
Source: Regional authorities, International Monetary Fund and CIBC FirstCaribbean.
* Average of U.K. Brent, Dubai and West Texas Intermediate + International Monetary Fund Food Index.
3Caribbean region includes Anguilla, Antigua and Barbuda, Aruba, Barbados, Belize, British Virgin Islands, Cayman Islands, Curaçao, Dominica, Grenada, Jamaica, St. Kitts and Nevis, St. Lucia, St. Maarten, St.
Vincent and the Grenadines and Trinidad and Tobago.
CIBC Capital Markets & CIBC FirstCaribbean International Bank October 2018Caribbean Market Overview – Q3 2018 13
Anguilla Shane Lowe
CIBC FirstCaribbean
Production, Prices, and Employment
Preliminary data from the Eastern Caribbean Central Bank (ECCB) suggest that the lingering effects of Hurricane Irma’s
passage during Q3 2017 further reduced economic activity y/y during the first half of 2018.
Tourist arrivals continue to plummet in the months following Hurricane Irma’s passage in Q3 2017. Declines in
stay-over arrivals (down 51.4% y/y) and excursionists (down 76.2% y/y) reduced total tourist arrivals by 65.0% y/y
during H1 2018. Stay-over arrivals from the USA, Canada, the UK, the Caribbean, and all other markets fell
57.5% y/y, 64.5% y/y, 45.2% y/y, 8.8% y/y, and 54.0% y/y. Consequently, visitor expenditure shrank by 41.7% y/y
over the same period.
Latest data imply mixed performances in investment during the first half of 2018. While the values of imports of
inedible crude materials, excluding fuels, and imports of machinery and transport equipment increased 47.5% y/y
and 50.3% y/y, the government reduced its spending on capital works by 33.8% over the same period. Total
exports rebounded by 12.4% y/y, but a 51.2% y/y surge in imports widened the merchandise trade deficit by
52.6% y/y to US$133.8mln.
Notwithstanding lower prices for food and non-alcoholic beverages (down 0.7% y/y), housing, utilities, gas and fuels
(down 0.4% y/y) and communication (down 0.7% y/y), a 5.7% y/y rise in transportation costs increased consumer prices
by 0.8% y/y in June 2018.
Developments in Financial Markets
Despite recovering loan growth, much faster deposit growth increased commercial bank excess liquidity y/y during Q1
2018 and pushed interest rates down over the same period.
Total loans and advances increased 3.0% y/y as a 1.5% y/y rise in retail loans supported a 5.0% y/y increase in
corporate lending. Consumer loans declined 0.8% y/y, but mortgages, business loans, and public sector loans
advanced 4.0% y/y, 5.1% y/y, and 2.4% y/y.
Higher retail (up 2.8% y/y), corporate (up 13.9% y/y), and non-resident (up 10.1% y/y) deposits increased total
deposits by 11.6% y/y.
A 4.2 percentage point y/y fall in the loan-to-deposit ratio to 50.3% implied that excess liquidity increased y/y.
Hence, the average interest rate spread widened 10 bps y/y to 7.78%. The weighted average lending and deposit
rates declined 17bps y/y and 27bps y/y to 9.87% and 2.09%, respectively.
Chart 1 Chart 2
Stay-Over Tourist Arrivals Inflation (y/y; %)
2,250 (US$/person) (000's) 90 6 All Items
85 Food
2,200 5 Fuel and Light
80
4
2,150 75
3
2,100 70
65 2
2,050 60 1
2,000 55 0
Visitor Expenditure/person - 12-month average (L)
50 -1
1,950 Stay-Over Arrivals (R) 45 -2
1,900 40 -3
Jun-14 Dec-14 Jun-15 Dec-15 Jun-16 Dec-16 Jun-17 Dec-17 Jun-18 2013Q2 2014Q2 2015Q2 2016Q2 2017Q2 2018Q2
Source: Caribbean Tourism Organization, Eastern Caribbean Central Bank and CIBC FirstCaribbean. Source: Eastern Caribbean Central Bank and CIBC FirstCaribbean.
CIBC Capital Markets & CIBC FirstCaribbean International Bank October 2018Caribbean Market Overview – Q3 2018 14
While financial stability indicators have improved since the resolution of two large insolvent banks, loan quality and
profitability have since started to trend downward. The non-performing loans to total loans ratio surged from 6.9% in Q1
2017 to 23.0% in Q1 2018, while the return on average assets ratio fell 1.3 percentage points y/y to 0.1%. The regulatory
capital to risk-weighted assets ratio improved marginally by 0.2 percentage points y/y to 10.6%.
Government Debt
Declines in tax revenue and increases in current expenditure contributed to a 79.8% y/y fall in the government’s fiscal
surplus to US$1.0mln during H1 2018.
Non-tax revenue expanded US$1.9mln y/y to US$7.1mln, but lower tax revenue (down US$6.8mln y/y to
US$29.5mln) reduced current revenue by US$4.9mln y/y to US$36.6mln. Taxes from international trade and
transactions increased US$2.6mln y/y to US$16.9mln, but taxes on income and profits, property, and domestic
goods and services fell US$0.2mln (7.9% y/y), US$0.6mln (49.0% y/y) and US$8.6mln (47.7% y/y), respectively.
Total grants received, much of which were likely associated with rebuilding and rehabilitation after Hurricane Irma,
increased US$1.1mln y/y to US$1.4mln.
In contrast, current expenditure increased US$0.9mln y/y to US$35.8mln. Personal emoluments, interest
payments, and transfers and subsidies rose US$0.3mln (1.8% y/y), US$0.4mln (14.5% y/y) and US$0.2mln (2.6%
y/y), but spending on goods and services declined US$0.1mln (0.7 y/y). However, capital expenditure and net
lending plunged 33.8% y/y to US$1.2mln.
The stock of public debt fell 6.3% y/y to US$191.6mln (68.1% of GDP) as at December 2017.
Outlook
After likely contracting by 5.0% y/y during 2018, the ECCB expects that rebounds in tourism (up 10.0% y/y) and transport,
storage and communication (up 10.0% y/y) will likely support ongoing recoveries in construction, mining and quarrying,
and wholesale and retail trade (each also up 10.0% y/y) to push real GDP growth to 7.1% in 2019. However, real GDP will
likely remain 6.2% lower than the value of production realised during 2016.
Chart 3 Chart 4
Public Sector Debt Outstanding Growth in Key Balances (y/y; %)
250 (US$mln) 20
10
200
0
150 -10
Loans
-20
Deposits
100
-30
50 -40
-50
0 -60
2013Q4 2014Q4 2015Q4 2016Q4 2017Q4 2013Q1 2014Q1 2015Q1 2016Q1 2017Q1 2018Q1
Source: Eastern Caribbean Central Bank and CIBC FirstCaribbean. Source: Eastern Caribbean Central Bank and CIBC FirstCaribbean.
CIBC Capital Markets & CIBC FirstCaribbean International Bank October 2018Caribbean Market Overview – Q3 2018 15
Antigua and Barbuda Shane Lowe
CIBC FirstCaribbean
Production, Prices, and Employment
Stronger tourist arrivals and expenditure and improved investment indicators point to likely greater economic activity
during H1 2018 relative to the same period one year earlier.
Thus far in 2018, a 7.6% y/y rebound in stay-over arrivals contributed to a reported 28.1% y/y expansion in visitor
expenditure over the first six months of 2018. Stay-over arrivals from the USA, Canada, and the Caribbean
increased 3.6% y/y, 81.5% y/y, and 7.7% y/y, but arrivals from the UK and other countries contracted 4.6% y/y
and 8.5% y/y. Similarly, the number of cruise ship passengers advanced 17.3% y/y, but those arriving by yacht fell
8.2% y/y. Consequently, the total number of visitors to the country increased 14.4% y/y.
Preliminary data suggest that investment activity likely improved during H1 2018. The values of imports of inedible
crude materials and imports of machinery and transport equipment advanced 102.6% y/y and 36.1% y/y, while the
government spent 99.3% more y/y in capital projects over the same period. Further, despite strong growth in
imports (up 28.2% y/y), a 181.1% y/y surge in merchandise exports narrowed the merchandise trade deficit by
10.0% y/y to US$200.2mln. Finally, increased stay-over and cruise arrivals, stronger construction performance,
and greater activity through the sea ports likely propelled real value-added in transport, storage and
communications higher over the same period.
Consumer prices increased 1.3% y/y in June 2018. The prices of food, and housing and utilities advanced 3.6% y/y and
2.2% y/y, but the cost of transportation and communication fell marginally by 0.1% y/y.
Developments in Financial Markets
Higher excess liquidity and lower loan delinquency combined to keep commercial bank profitability unchanged over the
four quarters ending Q1 2018.
Total loans and advances fell 0.6% y/y. A 6.8% y/y rise in consumer loans more than offset a 1.7% y/y contraction
in mortgages to push retail loans higher by 1.3% y/y, while a 3.4% y/y increase in public sector loans could not
mitigate a 6.7% y/y decline in business loans and pushed total corporate loans 2.5% lower y/y.
Higher retail (up 4.4% y/y) and corporate (up 19.8% y/y) balances outpaced a 4.7% y/y fall in non-resident
deposits and lifted total deposits 9.1% higher y/y.
The combination of falling loan balances and rising deposits reduced the loan-to-deposit ratio by 5.9 percentage
points y/y to 61.1%. However, lending and deposit rates declined just 3bps y/y and 1bp y/y to 9.0% and 1.6%.
Chart 1 Chart 2
Stay-Over Tourist Arrivals Inflation (y/y; %)
3,000 (US$/person) (000's) 270 All Items (L)
4 10
Food (L)
3 Fuel and Light (R)
260 5
2,500
2
0
250
1
2,000 -5
240 0
Visitor Expenditure/person (L) -10
1,500 -1
Stay-Over Arrivals (R) 230
-2 -15
1,000 220 -3 -20
Jun-14 Dec-14 Jun-15 Dec-15 Jun-16 Dec-16 Jun-17 Dec-17 Jun-18 2013Q2 2014Q2 2015Q2 2016Q2 2017Q2 2018Q2
Source: Eastern Caribbean Central Bank and CIBC FirstCaribbean, Caribbean Tourism Organization. Source: Eastern Caribbean Central Bank and CIBC FirstCaribbean.
CIBC Capital Markets & CIBC FirstCaribbean International Bank October 2018Caribbean Market Overview – Q3 2018 16
Profitability remained unchanged y/y between Q1 2017 and Q1 2018 – the return on assets ratio remained at
1.4%. Non-performing loans fell to 7.7% of gross loans from 8.4% four quarters earlier, and capital adequacy
increased further by 2.1 percentage points y/y to 38.0%.
Government Debt
An almost doubling in capital expenditure and net lending and a more than 50% fall in collections of non-tax revenues
contributed to a US$21.4mln widening of the government’s overall fiscal deficit to US$22.9mln during H1 2018.
Despite a US$2.7mln y/y (2.1% y/y) rise in tax receipts, a US$12.9mln (50.9% y/y) plummet in non-tax revenues
likely associated with lower citizenship-by-investment inflows reduced current revenue by US$10.2mln to
US$145.5mln. Taxes on property fell US$0.1mln (1.9% y/y), but taxes on income and profits, taxes on domestic
goods and services, and taxes on international trade and transactions expanded US$0.1mln (0.3% y/y),
US$0.7mln (1.1% y/y), and US$2.1mln (4.6% y/y).
The government increased spending on both current and capital expenditures over the first half of the year.
Current spending advanced US$1.5mln y/y to US$154.8mln, as increases in personal emoluments (up
US$7.1mln or 11.9% y/y), goods and services (up US$5.1mln or 22.9% y/y), and interest payments (up
US$0.4mln or 1.9% y/y) more than offset a US$11.0mln (21.9% y/y) reduction in transfers and subsidies.
Meanwhile, capital expenditures and net lending surged US$7.0mln y/y to US$14.1mln.
During the 12 months ending December 2017, total public debt increased 1.5% y/y to US$1.19bln (78.2% of GDP).
Outlook
The ECCB’s latest projections suggest that real GDP will likely expand by 3.9% y/y each in 2018 and 2019. Strong growth
in construction output (up 15.0% y/y in each year) will likely lead the acceleration in economic growth during those years,
but growth in tourism, and wholesale and retail trade will likely decelerate to 2.5% y/y and 0.5% y/y in 2019, from 5.1% y/y
and 1.5% y/y during 2018. Manufacturing output will also likely support economic growth and expand by 1.0% y/y during
each of 2018 and 2019.
Chart 3 Chart 4
Public Sector Debt Outstanding Growth in Key Balances (y/y; %)
1,300 (US$mln) 10 Loans
8 Deposits
1,250
6
1,200 4
2
1,150 0
-2
1,100
-4
1,050 -6
-8
1,000 -10
2013Q4 2014Q4 2015Q4 2016Q4 2017Q4 2013Q1 2014Q1 2015Q1 2016Q1 2017Q1 2018Q1
Source: Eastern Caribbean Central Bank and CIBC FirstCaribbean. Source: Eastern Caribbean Central Bank and CIBC FirstCaribbean.
CIBC Capital Markets & CIBC FirstCaribbean International Bank October 2018You can also read