An Introduction An Applied Perspective on Fairness, Accountability, Transparency, and Explainable AI - Dataiku
←
→
Page content transcription
If your browser does not render page correctly, please read the page content below

Co
                                      m
                                       pl
                                           im
An Introduction

                                           en
                                            ts
                                  da

                                                of
                                      ta
                                           iku
to Machine Learning
Interpretability
An Applied Perspective on Fairness,
Accountability, Transparency, and
Explainable AI

Patrick Hall & Navdeep Gill
An Introduction to Machine
  Learning Interpretability
  An Applied Perspective on Fairness,
      Accountability, Transparency,
                 and Explainable AI

                Patrick Hall and Navdeep Gill

     Beijing   Boston Farnham Sebastopol   Tokyo
An Introduction to Machine Learning Interpretability by Patrick Hall and Navdeep Gill Copyright © 2018 O’Reilly Media, Inc. All rights reserved. Printed in the United States of America. Published by O’Reilly Media, Inc., 1005 Gravenstein Highway North, Sebastopol, CA 95472. O’Reilly books may be purchased for educational, business, or sales promotional use. Online editions are also available for most titles (http://oreilly.com/safari). For more information, contact our corporate/institutional sales department: 800-998-9938 or corporate@oreilly.com. Editor: Nicole Tache Interior Designer: David Futato Production Editor: Nicholas Adams Cover Designer: Randy Comer Copyeditor: Octal Publishing, Inc. Illustrator: Rebecca Demarest April 2018: First Edition Revision History for the First Edition 2018-03-28: First Release The O’Reilly logo is a registered trademark of O’Reilly Media, Inc. An Introduction to Machine Learning Interpretability, the cover image, and related trade dress are trade‐ marks of O’Reilly Media, Inc. While the publisher and the authors have used good faith efforts to ensure that the information and instructions contained in this work are accurate, the publisher and the authors disclaim all responsibility for errors or omissions, including without limitation responsibility for damages resulting from the use of or reliance on this work. Use of the information and instructions contained in this work is at your own risk. If any code samples or other technology this work contains or describes is sub‐ ject to open source licenses or the intellectual property rights of others, it is your responsibility to ensure that your use thereof complies with such licenses and/or rights. 978-1-492-05029-2 [LSI]
Table of Contents

An Introduction to Machine Learning Interpretability. . . . . . . . . . . . . . . . 1
Machine Learning and Predictive Modeling in Practice                               2
Social and Commercial Motivations for Machine Learning
  Interpretability                                                                 4
The Multiplicity of Good Models and Model Locality                                 6
Accurate Models with Approximate Explanations                                      9
Defining Interpretability                                                         10
A Machine Learning Interpretability Taxonomy for Applied
  Practitioners                                                                   11
Common Interpretability Techniques                                                15
Testing Interpretability                                                          35
Machine Learning Interpretability in Action                                       36
Conclusion                                                                        37

                                                                                   iii
An Introduction to Machine
Learning Interpretability
Understanding and trusting models and their results is a hallmark of
good science. Scientists, engineers, physicians, researchers, and
humans in general have the need to understand and trust models
and modeling results that affect their work and their lives. However,
the forces of innovation and competition are now driving analysts
and data scientists to try ever-more complex predictive modeling
and machine learning algorithms. Such algorithms for machine
learning include gradient-boosted ensembles (GBM), artificial neu‐
ral networks (ANN), and random forests, among many others.
Many machine learning algorithms have been labeled “black box”
models because of their inscrutable inner-workings. What makes
these models accurate is what makes their predictions difficult to
understand: they are very complex. This is a fundamental trade-off.
These algorithms are typically more accurate for predicting nonlin‐
ear, faint, or rare phenomena. Unfortunately, more accuracy almost
always comes at the expense of interpretability, and interpretability
is crucial for business adoption, model documentation, regulatory
oversight, and human acceptance and trust.
The inherent trade-off between accuracy and interpretability in pre‐
dictive modeling can be a particularly vexing catch-22 for analysts
and data scientists working in regulated industries. Due to strenuous
regulatory and documentation requirements, data science professio‐
nals in the regulated verticals of banking, insurance, healthcare, and
other industries often feel locked into using traditional, linear mod‐
eling techniques to create their predictive models. So, how can you
use machine learning to improve the accuracy of your predictive
1models and increase the value they provide to your organization while still retaining some degree of interpretability? This report provides some answers to this question by introducing interpretable machine learning techniques, algorithms, and models. It discusses predictive modeling and machine learning from an applied perspective and puts forward social and commercial moti‐ vations for interpretability, fairness, accountability, and transpar‐ ency in machine learning. It defines interpretability, examines some of the major theoretical difficulties in the burgeoning field, and pro‐ vides a taxonomy for classifying and describing interpretable machine learning techniques. We then discuss many credible and practical machine learning interpretability techniques, consider test‐ ing of these interpretability techniques themselves, and, finally, we present a set of open source code examples for interpretability tech‐ niques. Machine Learning and Predictive Modeling in Practice Companies and organizations use machine learning and predictive models for a very wide variety of revenue- or value-generating applications. A tiny sample of such applications includes deciding whether to award someone a credit card or loan, deciding whether to release someone from a hospital, or generating custom recom‐ mendations for new products or services. Although many principles of applied machine learning are shared across industries, the prac‐ tice of machine learning at banks, insurance companies, healthcare providers and in other regulated industries is often quite different from machine learning as conceptualized in popular blogs, the news and technology media, and academia. It’s also somewhat different from the practice of machine learning in the technologically advanced and generally unregulated digital, ecommerce, FinTech, and internet verticals. Teaching and research in machine learning tend to put a central focus on algorithms, and the computer science, mathematics, and statistics of learning from data. Personal blogs and media outlets also tend to focus on algorithms and often with more hype and less rigor than in academia. In commercial practice, talent acquisition, data engineering, data security, hardened deployment of machine learning apps and systems, managing and monitoring an ever-increasing number of predictive models, modeling process 2 | An Introduction to Machine Learning Interpretability
documentation, and regulatory compliance often take precedence
over more academic concerns regarding machine learning algo‐
rithms[1].
Successful entities in both traditional enterprise and in digital,
ecommerce, FinTech, and internet verticals have developed pro‐
cesses for recruiting and retaining analytical talent, amassed vast
amounts of data, and engineered massive flows of data through cor‐
porate IT systems. Both types of entities have faced data security
challenges; both have learned to deploy the complex logic that
defines machine learning models into operational, public-facing IT
systems; and both are learning to manage the large number of pre‐
dictive and machine learning models required to stay competitive in
today’s data-driven commercial landscape. However, larger, more
established companies tend to practice statistics, analytics, and data
mining at the margins of their business to optimize revenue or allo‐
cation of other valuable assets. Digital, ecommerce, FinTech, and
internet companies, operating outside of most regulatory oversight,
and often with direct access to huge data stores and world-class tal‐
ent pools, have often made web-based data and machine learning
products central to their business.
In the context of applied machine learning, more regulated, and
often more traditional, companies tend to face a unique challenge.
They must use techniques, algorithms, and models that are simple
and transparent enough to allow for detailed documentation of
internal system mechanisms and in-depth analysis by government
regulators. Interpretable, fair, and transparent models are a serious
legal mandate in banking, insurance, healthcare, and other indus‐
tries. Some of the major regulatory statutes currently governing
these industries include the Civil Rights Acts of 1964 and 1991, the
Americans with Disabilities Act, the Genetic Information Nondis‐
crimination Act, the Health Insurance Portability and Accountabil‐
ity Act, the Equal Credit Opportunity Act, the Fair Credit Reporting
Act, the Fair Housing Act, Federal Reserve SR 11-7, and European
Union (EU) Greater Data Privacy Regulation (GDPR) Article 22[2].
Moreover, regulatory regimes are continuously changing, and these
regulatory regimes are key drivers of what constitutes interpretabil‐
ity in applied machine learning.

                         Machine Learning and Predictive Modeling in Practice   |   3
Social and Commercial Motivations for
Machine Learning Interpretability
The now-contemplated field of data science amounts to a superset of the
fields of statistics and machine learning, which adds some technology for
“scaling up” to “big data.” This chosen superset is motivated by commer‐
cial rather than intellectual developments. Choosing in this way is likely
to miss out on the really important intellectual event of the next 50
years.
—David Donoho[3]
Usage of AI and machine learning models is likely to become more
commonplace as larger swaths of the economy embrace automation
and data-driven decision making. Even though these predictive sys‐
tems can be quite accurate, they have been treated as inscrutable
black boxes in the past, that produce only numeric or categorical
predictions with no accompanying explanations. Unfortunately,
recent studies and recent events have drawn attention to mathemati‐
cal and sociological flaws in prominent machine learning systems,
but practitioners usually don’t have the appropriate tools to pry
open machine learning black boxes to debug and troubleshoot
them[4][5].
Although this report focuses mainly on the commercial aspects of
interpretable machine learning, it is always crucially important to
consider social motivations and impacts of data science, including
interpretability, fairness, accountability, and transparency in
machine learning. One of the greatest hopes for data science and
machine learning is simply increased convenience, automation, and
organization in our day-to-day lives. Even today, I am beginning to
see fully automated baggage scanners at airports and my phone is
constantly recommending new music that I actually like. As these
types of automation and conveniences grow more common,
machine learning engineers will need more and better tools to
debug these ever-more present, decision-making systems. As
machine learning begins to make a larger impact on everyday
human life, whether it’s just additional convenience or assisting in
serious, impactful, or historically fraught and life-altering decisions,
people will likely want to know how these automated decisions are
being made. This might be the most fundamental application of
machine learning interpretability, and some argue the EU GDPR is
4 | An Introduction to Machine Learning Interpretabilityalready legislating a “right to explanation” for EU citizens impacted
by algorithmic decisions[6].
Machine learning also promises quick, accurate, and unbiased deci‐
sion making in life-changing scenarios. Computers can theoretically
use machine learning to make objective, data-driven decisions in
critical situations like criminal convictions, medical diagnoses, and
college admissions, but interpretability, among other technological
advances, is needed to guarantee the promises of correctness and
objectivity. Without interpretability, accountability, and transpar‐
ency in machine learning decisions, there is no certainty that a
machine learning system is not simply relearning and reapplying
long-held, regrettable, and erroneous human biases. Nor are there
any assurances that human operators have not designed a machine
learning system to make intentionally prejudicial decisions.
Hacking and adversarial attacks on machine learning systems are
also a serious concern. Without real insight into a complex machine
learning system’s operational mechanisms, it can be very difficult to
determine whether its outputs have been altered by malicious hack‐
ing or whether its inputs can be changed to create unwanted or
unpredictable decisions. Researchers recently discovered that slight
changes, such as applying stickers, can prevent machine learning
systems from recognizing street signs[7]. Such adversarial attacks,
which require almost no software engineering expertise, can obvi‐
ously have severe consequences.
For traditional and often more-regulated commercial applications,
machine learning can enhance established analytical practices (typi‐
cally by increasing prediction accuracy over conventional but highly
interpretable linear models) or it can enable the incorporation of
unstructured data into analytical pursuits. In many industries, linear
models have long been the preferred tools for predictive modeling,
and many practitioners and decision-makers are simply suspicious
of machine learning. If nonlinear models—generated by training
machine learning algorithms—make more accurate predictions on
previously unseen data, this typically translates into improved finan‐
cial margins but only if the model is accepted by internal validation
teams and business partners and approved by external regulators.
Interpretability can increase transparency and trust in complex
machine learning models, and it can allow more sophisticated and
potentially more accurate nonlinear models to be used in place of
traditional linear models, even in some regulated dealings. Equifax’s
Social and Commercial Motivations for Machine Learning Interpretability | 5NeuroDecision is a great example of modifying a machine learning technique (an ANN) to be interpretable and using it to make meas‐ urably more accurate predictions than a linear model in a regulated application. To make automated credit-lending decisions, NeuroDe‐ cision uses ANNs with simple constraints, which are somewhat more accurate than conventional regression models and also pro‐ duce the regulator-mandated reason codes that explain the logic behind a credit-lending decision. NeuroDecision’s increased accu‐ racy could lead to credit lending in a broader portion of the market, such as new-to-credit consumers, than previously possible[1][8]. Less-traditional and typically less-regulated companies currently face a greatly reduced burden when it comes to creating fair, accountable, and transparent machine learning systems. For these companies, interpretability is often an important but secondary con‐ cern. Even though transparency into complex data and machine learning products might be necessary for internal debugging, valida‐ tion, or business adoption purposes, the world has been using Goo‐ gle’s search engine and Netflix’s movie recommendations for years without widespread demands to know why or how these machine learning systems generate their results. However, as the apps and systems that digital, ecommerce, FinTech, and internet companies create (often based on machine learning) continue to change from occasional conveniences or novelties into day-to-day necessities, consumer and public demand for interpretability, fairness, account‐ ability, and transparency in these products will likely increase. The Multiplicity of Good Models and Model Locality If machine learning can lead to more accurate models and eventu‐ ally financial gains, why isn’t everyone using interpretable machine learning? Simple answer: it’s fundamentally difficult and it’s a very new field of research. One of the most difficult mathematical prob‐ lems in interpretable machine learning goes by several names. In his seminal 2001 paper, Professor Leo Breiman of UC, Berkeley, coined the phrase: the multiplicity of good models[9]. Some in credit scoring refer to this phenomenon as model locality. It is well understood that for the same set of input variables and prediction targets, complex machine learning algorithms can produce multiple accurate models with very similar, but not the same, internal architectures. This 6 | An Introduction to Machine Learning Interpretability
alone is an obstacle to interpretation, but when using these types of
algorithms as interpretation tools or with interpretation tools, it is
important to remember that details of explanations can change
across multiple accurate models. Because of this systematic instabil‐
ity, multiple interpretability techniques should be used to derive
explanations for a single model, and practitioners are urged to seek
consistent results across multiple modeling and interpretation tech‐
niques.
Figures 1-1 and 1-2 are cartoon illustrations of the surfaces defined
by error functions for two fictitious predictive models. In Figure 1-1
the error function is representative of a traditional linear model’s
error function. The surface created by the error function in
Figure 1-1 is convex. It has a clear global minimum in three dimen‐
sions, meaning that given two input variables, such as a customer’s
income and a customer’s interest rate, the most accurate model
trained to predict loan defaults (or any other outcome) would
almost always give the same weight to each input in the prediction,
and the location of the minimum of the error function and the
weights for the inputs would be unlikely to change very much if the
model was retrained, even if the input data about customer’s income
and interest rate changed a little bit. (The actual numeric values for
the weights could be ascertained by tracing a straight line from min‐
imum of the error function pictured in Figure 1-1 to the interest rate
axis [the X axis] and income axis [the Y axis].)

Figure 1-1. An illustration of the error surface of a traditional linear
model. (Figure courtesy of H2O.ai.)

Because of the convex nature of the error surface for linear models,
there is basically only one best model, given some relatively stable

                             The Multiplicity of Good Models and Model Locality   |   7
set of inputs and a prediction target. The model associated with the error surface displayed in Figure 1-1 would be said to have strong model locality. Moreover, because the weighting of income versus interest rate is highly stable in the pictured error function and its associated linear model, explanations about how the function made decisions about loan defaults based on those two inputs would also be stable. More stable explanations are often considered more trust‐ worthy explanations. Figure 1-2 depicts a nonconvex error surface that is representative of the error function for a machine learning function with two inputs —for example, a customer’s income and a customer’s interest rate— and an output, such as the same customer’s probability of defaulting on a loan. This nonconvex error surface with no obvious global minimum implies there are many different ways a complex machine learning algorithm could learn to weigh a customer’s income and a customer’s interest rate to make a good decision about when they might default. Each of these different weightings would create a dif‐ ferent function for making loan default decisions, and each of these different functions would have different explanations. Less-stable explanations feel less trustworthy, but are less-stable explanations actually valuable and useful? The answer to this question is central to the value proposition of interpretable machine learning and is examined in the next section. Figure 1-2. An illustration of the error surface of a machine learning model. (Figure courtesy of H2O.ai.) 8 | An Introduction to Machine Learning Interpretability
Accurate Models with Approximate
Explanations
Due to many valid concerns, including the multiplicity of good
models, many researchers and practitioners deemed the complex,
intricate formulas created by training machine learning algorithms
to be uninterpretable for many years. Although great advances have
been made in recent years to make these often nonlinear, nonmono‐
tonic, and noncontinuous machine-learned response functions
more understandable[10][11], it is likely that such functions will
never be as directly or universally interpretable as more traditional
linear models.
Why consider machine learning approaches for inferential or
explanatory purposes? In general, linear models focus on under‐
standing and predicting average behavior, whereas machine-learned
response functions can often make accurate but more difficult to
explain predictions for subtler aspects of modeled phenomenon. In
a sense, linear models create very exact interpretations for approxi‐
mate models (see Figure 1-3).

Figure 1-3. A linear model, g(x), predicts the average number of pur‐
chases, given a customer’s age. The predictions can be inaccurate but
the explanations are straightforward and stable. (Figure courtesy of
H2O.ai.)

Whereas linear models account for global, average phenomena in a
dataset, machine learning models attempt to learn about the local
and nonlinear characteristics of a dataset and also tend to be evalu‐

                              Accurate Models with Approximate Explanations   |   9
ated in terms of predictive accuracy. The machine learning inter‐ pretability approach seeks to make approximate interpretations for these types of more exact models. After an accurate predictive model has been trained, it should then be examined from many dif‐ ferent viewpoints, including its ability to generate approximate explanations. As illustrated in Figure 1-4, it is possible that an approximate interpretation of a more exact model can have as much, or more, value and meaning than the exact interpretations provided by an approximate model. Additionally, the use of machine learning techniques for inferential or predictive purposes shouldn’t prevent us from using linear mod‐ els for interpretation. In fact, using local linear approximations of more complex machine-learned functions to derive explanations, as depicted in Figure 1-4, is one of the most popular current approaches. This technique has become known as local interpretable model-agnostic explanations (LIME), and several free and open source implementations of LIME are available for practitioners to evaluate[12]. Figure 1-4. A machine learning model, g(x), predicts the number of purchases, given a customer’s age, very accurately, nearly replicating the true, unknown signal-generating function, f(x). Although the explanations for this function are approximate, they are at least as useful, if not more so, than the linear model explanations in Figure 1-3. (Figure courtesy of H2O.ai.) Defining Interpretability Let’s take a step back now and offer a definition of interpretability, and also briefly introduce those groups at the forefront of machine learning interpretability research today. In the context of machine 10 | An Introduction to Machine Learning Interpretability
learning models and results, interpretability has been defined as “the
ability to explain or to present in understandable terms to a human.”
[13]. The latter might be the simplest definition of machine learning
interpretability, but there are several communities with different and
sophisticated notions of what interpretability is today and should be
in the future. Two of the most prominent groups pursuing interpret‐
ability research are a group of academics operating under the acro‐
nym FAT* and civilian and military researchers funded by the
Defense Advanced Research Projects Agency (DARPA). FAT* aca‐
demics (meaning fairness, accountability, and transparency in multi‐
ple artificial intelligence, machine learning, computer science, legal,
social science, and policy applications) are primarily focused on
promoting and enabling interpretability and fairness in algorithmic
decision-making systems with social and commercial impact.
DARPA-funded researchers seem primarily interested in increasing
interpretability in sophisticated pattern recognition models needed
for security applications. They tend to label their work explainable
AI, or XAI.

A Machine Learning Interpretability
Taxonomy for Applied Practitioners
Technical challenges as well as the needs and perspectives of differ‐
ent user communities make machine learning interpretability a sub‐
jective and complicated subject. Luckily, a previously defined
taxonomy has proven useful for characterizing the interpretability of
various popular explanatory techniques used in commercial data
mining, analytics, data science, and machine learning applica‐
tions[10]. The taxonomy describes models in terms of their com‐
plexity, and categorizes interpretability techniques by the global or
local scope of explanations they generate, the family of algorithms to
which they can be applied, and their ability to promote trust and
understanding.

A Scale for Interpretability
The complexity of a machine learning model is directly related to its
interpretability. Generally, the more complex the model, the more
difficult it is to interpret and explain. The number of weights or
rules in a model—or its Vapnik–Chervonenkis dimension, a more
formal measure—are good ways to quantify a model’s complexity.

            A Machine Learning Interpretability Taxonomy for Applied Practitioners   |   11
However, analyzing the functional form of a model is particularly
useful for commercial applications such as credit scoring. The fol‐
lowing list describes the functional forms of models and discusses
their degree of interpretability in various use cases.
High interpretability—linear, monotonic functions
Functions created by traditional regression algorithms are prob‐
ably the most interpretable class of models. We refer to these
models here as “linear and monotonic,” meaning that for a
change in any given input variable (or sometimes combination
or function of an input variable), the output of the response
function changes at a defined rate, in only one direction, and at
a magnitude represented by a readily available coefficient.
Monotonicity also enables intuitive and even automatic reason‐
ing about predictions. For instance, if a credit lender rejects
your credit card application, it can easily tell you why because
its probability-of-default model often assumes your credit score,
your account balances, and the length of your credit history are
monotonically related to your ability to pay your credit card bill.
When these explanations are created automatically, they are
typically called reason codes. Linear, monotonic functions play
another important role in machine learning interpretability.
Besides being highly interpretable themselves, linear and mono‐
tonic functions are also used in explanatory techniques, includ‐
ing the popular LIME approach.
Medium interpretability—nonlinear, monotonic functions
Although most machine-learned response functions are nonlin‐
ear, some can be constrained to be monotonic with respect to
any given independent variable. Although there is no single
coefficient that represents the change in the response function
output induced by a change in a single input variable, nonlinear
and monotonic functions do always change in one direction as a
single input variable changes. Nonlinear, monotonic response
functions usually allow for the generation of both reason codes
and relative variable importance measures. Nonlinear, mono‐
tonic response functions are therefore interpretable and poten‐
tially suitable for use in regulated applications.
Of course, there are linear, nonmonotonic machine-learned
response functions that can, for instance, be created by the mul‐
tivariate adaptive regression splines (MARS) approach. We do
not highlight these functions here. They tend to be less accurate
12 | An Introduction to Machine Learning Interpretabilitypredictors than purely nonlinear, nonmonotonic functions and
less directly interpretable than their completely monotonic
counterparts.
Low interpretability—nonlinear, nonmonotonic functions
Most machine learning algorithms create nonlinear, nonmono‐
tonic response functions. This class of functions is the most dif‐
ficult to interpret, as they can change in a positive and negative
direction and at a varying rate for any change in an input vari‐
able. Typically, the only standard interpretability measures these
functions provide are relative variable importance measures.
You should use a combination of several techniques, which we
present in the sections that follow, to interpret these extremely
complex models.
Global and Local Interpretability
It’s often important to understand the entire model that you’ve
trained on a global scale, and also to zoom into local regions of your
data or your predictions and derive local explanations. Global inter‐
pretations help us understand the inputs and their entire modeled
relationship with the prediction target, but global interpretations
can be highly approximate in some cases. Local interpretations help
us understand model predictions for a single row of data or a group
of similar rows. Because small sections of a machine-learned
response function are more likely to be linear, monotonic, or other‐
wise well-behaved, local explanations can be more accurate than
global explanations. It’s also very likely that the best explanations of
a machine learning model will come from combining the results of
global and local interpretation techniques. In subsequent sections
we will use the following descriptors to classify the scope of an inter‐
pretable machine learning approach:
Global interpretability
Some machine learning interpretability techniques facilitate
global explanations of machine learning algorithms, their
results, or the machine-learned relationship between the predic‐
tion target and the input variables.
Local interpretability
Local interpretations promote understanding of small regions
of the machine-learned relationship between the prediction tar‐
get and the input variables, such as clusters of input records and
A Machine Learning Interpretability Taxonomy for Applied Practitioners | 13their corresponding predictions, or deciles of predictions and
their corresponding input rows, or even single rows of data.
Model-Agnostic and Model-Specific Interpretability
Another important way to classify model interpretability techniques
is whether they are model agnostic, meaning they can be applied to
different types of machine learning algorithms, or model specific,
meaning techniques that are applicable only for a single type or class
of algorithm. For instance, the LIME technique is model agnostic
and can be used to interpret nearly any set of machine learning
inputs and machine learning predictions. On the other hand, the
technique known as treeinterpreter is model specific and can be
applied only to decision tree models. Although model-agnostic
interpretability techniques are convenient, and in some ways ideal,
they often rely on surrogate models or other approximations that
can degrade the accuracy of the explanations they provide. Model-
specific interpretation techniques tend to use the model to be inter‐
preted directly, leading to potentially more accurate explanations.
Understanding and Trust
Machine learning algorithms and the functions they create during
training are sophisticated, intricate, and opaque. Humans who
would like to use these models have basic, emotional needs to
understand and trust them because we rely on them for our liveli‐
hoods or because we need them to make important decisions. For
some users, technical descriptions of algorithms in textbooks and
journals provide enough insight to fully understand machine learn‐
ing models. For these users, cross-validation, error measures, and
assessment plots probably also provide enough information to trust
a model. Unfortunately, for many applied practitioners, the usual
definitions and assessments don’t often inspire full trust and under‐
standing in machine learning models and their results.
Trust and understanding are different phenomena, and both are
important. The techniques presented in the next section go beyond
standard assessment and diagnostic practices to engender greater
understanding and trust in complex models. These techniques
enhance understanding by either providing transparency and spe‐
cific insights into the mechanisms of the algorithms and the
functions they create or by providing detailed information and
accountability for the answers they provide. The techniques that fol‐
14 | An Introduction to Machine Learning Interpretabilitylow enhance trust by enabling users to observe or ensure the fair‐
ness, stability, and dependability of machine learning algorithms,
the functions they create, and the answers they generate.
Common Interpretability Techniques
Many credible techniques for training interpretable models and
gaining insights into model behavior and mechanisms have existed
for years. Many others have been put forward in a recent flurry of
research. This section of the report discusses many such interpreta‐
bility techniques in terms of the proposed machine learning inter‐
pretability taxonomy. The section begins by discussing data
visualization approaches because having a strong understanding of a
dataset is a first step toward validating, explaining, and trusting
models. We then present white-box modeling techniques, or models
with directly transparent inner workings, followed by techniques
that can generate explanations for the most complex types of predic‐
tive models such as model visualizations, reason codes, and variable
importance measures. We conclude the section by discussing
approaches for testing machine learning models for fairness, stabil‐
ity, and trustworthiness.
Seeing and Understanding Your Data
Seeing and understanding data is important for interpretable
machine learning because models represent data, and understanding
the contents of that data helps set reasonable expectations for model
behavior and output. Unfortunately, most real datasets are difficult
to see and understand because they have many variables and many
rows. Even though plotting many dimensions is technically possible,
doing so often detracts from, instead of enhances, human under‐
standing of complex datasets. Of course, there are many, many ways
to visualize datasets. We chose the techniques highlighted in Tables
1-1 and 1-2 and in Figure 1-5 because they help illustrate many
important aspects of a dataset in just two dimensions.
Table 1-1. A description of 2-D projection data visualization approaches
Technique: 2-D projections
Description: Projecting rows of a dataset from a usually high-dimensional original space into a
more visually understandable lower-dimensional space, ideally two or three dimensions.
Techniques to achieve this include Principal Components Analysis (PCA), Multidimensional Scaling
(MDS), t-Distributed Stochastic Neighbor Embedding (t-SNE), and Autoencoder Networks.
Common Interpretability Techniques | 15Suggested usage: The key idea is to represent the rows of a dataset in a meaningful low- dimensional space. Datasets containing images, text, or even business data with many variables can be difficult to visualize as a whole. These projection techniques enable high-dimensional datasets to be projected into representative low-dimensional spaces and visualized using the trusty old scatter plot technique. A high-quality projection visualized in a scatter plot should exhibit key structural elements of a dataset, such as clusters, hierarchy, sparsity, and outliers. 2-D projections are often used in fraud or anomaly detection to find outlying entities, like people, transactions, or computers, or unusual clusters of entities. References: Visualizing Data using t-SNE MDS, Cox, T.F., Cox, M.A.A. Multidimensional Scaling. Chapman and Hall. 2001. The Elements of Statistical Learning Reducing the Dimensionality of Data with Neural Networks OSS: h2o.ai R (various packages) scikit-learn (various functions) Global or local scope: Global and local. You can use most forms of visualizations to see a courser view of the entire dataset, or they can provide granular views of local portions of the dataset. Ideally, advanced visualization tool kits enable users to pan, zoom, and drill-down easily. Otherwise, users can plot different parts of the dataset at different scales themselves. Best-suited complexity: 2-D projections can Model specific or model agnostic: Model help us to understand very complex relationships agnostic; visualizing complex datasets with in datasets. many variables. Trust and understanding: Projections add a degree of trust if they are used to confirm machine learning modeling results. For instance, if known hierarchies, classes, or clusters exist in training or test datasets and these structures are visible in 2-D projections, it is possible to confirm that a machine learning model is labeling these structures correctly. A secondary check is to confirm that similar attributes of structures are projected relatively near one another and different attributes of structures are projected relatively far from one another. Consider a model used to classify or cluster marketing segments. It is reasonable to expect a machine learning model to label older, richer customers differently than younger, less affluent customers, and moreover to expect that these different groups should be relatively disjointed and compact in a projection, and relatively far from one another. Table 1-2. A description of the correlation graph data visualization approach Technique: Correlation graphs 16 | An Introduction to Machine Learning Interpretability
Description: A correlation graph is a two-dimensional representation of the relationships
(correlation) in a dataset. The authors create correlation graphs in which the nodes of the graph are
the variables in a dataset and the edge weights (thickness) between the nodes are defined by the
absolute values of their pairwise Pearson correlation. For visual simplicity, absolute weights below a
certain threshold are not displayed, the node size is determined by a node’s number of connections
(node degree), node color is determined by a graph community calculation, and node position is
defined by a graph force field algorithm. The correlation graph allows us to see groups of correlated
variables, identify irrelevant variables, and discover or verify important relationships that machine
learning models should incorporate, all in two dimensions.
Suggested usage: Correlation graphs are a very powerful tool for seeing and understanding
relationships (correlation) between variables in a dataset. They are especially powerful in text
mining or topic modeling to see the relationships between entities and ideas. Traditional network
graphs—a similar approach—are also popular for finding relationships between customers or
products in transactional data and for use in fraud detection to find unusual interactions between
entities like people or computers.
OSS:
Gephi
https://github.com/jphall663/corr_graph
Global or local scope: Global and local. You can use most forms of visualizations to see a courser
view of the entire dataset, or they can provide granular views of local portions of the dataset.
Ideally, advanced visualization tool kits enable users to pan, zoom, and drill-down easily.
Otherwise, users can plot different parts of the dataset at different scales themselves.
Best-suited complexity: Correlation graphs can        Model specific or model agnostic: Model
help us understand complex relationships but can      agnostic; visualizing complex datasets with
become difficult to understand with more than         many variables.
several thousand variables.
Trust and understanding: Correlation graphs promote understanding by displaying important
and complex relationships in a dataset. They can enhance trust in a model if variables with thick
connections to the target are important variables in the model, and we would expect a model to
learn that unconnected variables are not very important. Also, common sense relationships
displayed in the correlation graph should be reflected in a trustworthy model.

                                                      Common Interpretability Techniques         |   17
Figure 1-5. A data visualization, a correlation graph, that is helpful for enhancing trust and understanding in machine learning models because it displays important, complex relationships between variables in a dataset as edges and nodes in an undirected graph. (Figure cour‐ tesy of H2O.ai.) Techniques for Creating White-Box Models When starting a machine learning endeavor, it’s a best practice to determine to what degree interpretability is an important criterion for success. If interpretability is of paramount importance to the project’s outcome, it’s best to use an interpretable modeling techni‐ que from the beginning. The techniques described in Tables 1-3 through 1-8 will enable you to create highly transparent models, well-suited for regulated industry or other applications in which interpretability is of extreme importance. 18 | An Introduction to Machine Learning Interpretability
Table 1-3. A description of the decision tree white-box modeling approach
 Technique: Decision trees
 Description: Decision trees create a model that predicts the value of a target variable based on
 several input variables. Decision trees are directed graphs in which each interior node corresponds
 to an input variable; there are edges to child nodes for values of that input variable that create the
 highest target purity in each child. Each terminal node or leaf node represents a value of the target
 variable given the values of the input variables represented by the path from the root to the leaf.
 These paths can be visualized or explained with simple if-then rules.
 Suggested usage: Decision trees are great for training simple, transparent models on I.I.D. data
 —data where a unique customer, patient, product, or other entity is represented in each row. They
 are beneficial when the goal is to understand relationships between the input and target variable
 with “Boolean-like” logic. Decision trees can also be displayed graphically in a way that is easy for
 non-experts to interpret.
 References:
 Breiman, L., J. Friedman, C. J. Stone, and R. A. Olshen. Classification and regression trees. CRC press,
 1984.
 The Elements of Statistical Learning
 OSS:
 rpart
 scikit-learn (various functions)
 Global or local scope: Global.
 Best-suited complexity: Decision trees can             Model specific or model agnostic: Model
 create very complex nonlinear, nonmonotonic            specific; interpretability is a key motivating
 functions. For best interpretability, restrict to      factor for using decision-tree models.
 shallow depth and binary splits. Predictions can
 also be restricted to be monotonic with respect to
 input variable values.
 Trust and understanding: Increases trust and understanding because input to target mappings
 follow a decision structure that can be easily visualized and interpreted and compared to domain
 knowledge and reasonable expectations.

                                                         Common Interpretability Techniques          |      19
Table 1-4. A description of the XNN modeling approach Technique: eXplainable Neural Networks Description: Often considered the least transparent of black-box models, recent work in XNN implementation and explaining artificial neural network (ANN) predictions may render that notion of ANNs obsolete. Many of the breakthroughs in ANN explanation stem from the straightforward calculation of derivatives of the trained ANN response function with regard to input variables made possible by the proliferation of deep learning toolkits such as Tensorflow. These derivatives allow for the disaggregation of the trained ANN response function prediction into input variable contributions for any observation. Suggested usage: Explaining ANN predictions is impactful for at least two major reasons. While most users will be familiar with the widespread use of ANNs in pattern recognition, they are also used for more traditional data mining applications such as fraud detection, and even for regulated applications such as credit scoring. Moreover, ANNs can now be used as accurate and explainable surrogate models, potentially increasing the fidelity of both global and local surrogate model techniques. References: Ancona, M., E. Ceolini, C. Öztireli, and M. Gross. Towards Better Understanding of Gradient-based Attribution Methods for Deep Neural Networks, ICLR 2018. Vaughan, Joel, et al. Explainable Neural Networks Based on Additive Index Models . OSS: Skater (integrated gradients and layerwise relevance propagation) DeepLift Global or local scope: Typically local but can be both. Best-suited complexity: XNNs can be used to Model specific or model agnostic: As directly model extremely nonlinear, non- directly interpretable models, XNNs rely on monotonic phenomena or they can be used as model specific mechanisms. Used as surrogate surrogate models to explain other nonlinear, models, XNNs are model agnostic. non-monotonic models. Trust and understanding: XNN techniques are typically used to make ANN models themselves more understandable or as surrogate models to make other nonlinear models more understandable. 20 | An Introduction to Machine Learning Interpretability
Table 1-5. A description of the monotonic GBM white-box modeling
approach
 Technique: Monotonic gradient-boosted machines (GBMs)
 Description: Monotonicity constraints can turn difficult-to-interpret nonlinear, nonmonotonic
 models into highly interpretable, and possibly regulator-approved, nonlinear, monotonic models.
 One application of this can be achieved with monotonicity constraints in GBMs by enforcing a
 uniform splitting strategy in constituent decision trees, where binary splits of a variable in one
 direction always increase the average value of the dependent variable in the resultant child node,
 and binary splits of the variable in the other direction always decrease the average value of the
 dependent variable in the other resultant child node.
 Suggested usage: Potentially appropriate for most traditional data mining and predictive
 modeling tasks, even in regulated industries (no matter what a training data sample says,
 regulators might still want to see monotonic behavior) and for consistent reason code generation
 (consistent reason code generation is generally considered a gold standard of model
 interpretability).
 Reference:
 XGBoost Documentation
 OSS:
 XGBoost
 http://bit.ly/2IIRhh5
 https://github.com/h2oai/mli-resources/blob/master/notebooks/mono_xgboost.ipynb
 Global or local scope: Monotonicity               Best-suited complexity: Monotonic GBM’s
 constraints create globally interpretable         create nonlinear, monotonic response functions.
 response functions.
 Model specific or model agnostic: As              Trust and understanding: Understanding is
 implementations of monotonicity constraints       increased by enforcing straightforward
 vary for different types of models in practice,   relationships between input variables and the
 they are a model-specific interpretation          prediction target. Trust is increased when
 technique.                                        monotonic relationships, reason codes, and
                                                   detected interactions are parsimonious with
                                                   domain expertise or reasonable expectations.

Table 1-6. A description of alternative regression white-box modeling
approaches
 Technique: Logistic, elastic net, GAM, and quantile regression
 Description: These techniques use contemporary methods to augment traditional, linear modeling
 methods. Linear model interpretation techniques are highly sophisticated, typically model specific,
 and the inferential features and capabilities of linear models are rarely found in other classes of
 models. These types of models usually produce linear, monotonic response functions with globally
 interpretable results like those of traditional linear models but often with a boost in predictive
 accuracy.
 Suggested usage: Interpretability for regulated industries; these techniques are meant for
 practitioners who just can’t use complex machine learning algorithms to build predictive models
 because of interpretability concerns or who seek the most interpretable possible modeling results.

                                                      Common Interpretability Techniques        |     21
References:
The Elements of Statistical Learning
Koenker, R. Quantile regression (No. 38). Cambridge University Press, 2005.
OSS:
gam
glmnet
h2o.ai
quantreg
scikit-learn (various functions)
Global or local scope: Alternative regression Best-suited complexity: Alternative
techniques often produce globally interpretable regression functions are generally linear,
linear, monotonic functions that can be monotonic functions. However, GAM
interpreted using coefficient values or other approaches can create quite complex nonlinear
traditional regression measures and statistics. functions.
Model specific or model agnostic: Model specific.
Trust and understanding: The lessened assumption burden, the ability to select variables
without potentially problematic multiple statistical significance tests, the ability to incorporate
important but correlated predictors, the ability to fit nonlinear phenomena, or the ability to fit
different quantiles of the data’s conditional distribution (and not just the mean of the conditional
distribution) could lead to more accurate understanding of modeled phenomena. Basically, these
techniques are trusted linear models but used in new, different, and typically more robust ways.
Table 1-7. A description of rule-based white-box modeling approaches
Technique: Rule-based models
Description: A rule-based model is a type of model that is composed of many simple Boolean
statements that can be built by using expert knowledge or learning from real data.
Suggested usage: Useful in predictive modeling and fraud and anomaly detection when
interpretability is a priority and simple explanations for relationships between inputs and targets
are desired, but a linear model is not necessary. Often used in transactional data to find simple,
frequently occurring pairs or triplets of products in purchases.
Reference:
An Introduction to Data Mining, Chapter 6
OSS:
RuleFit
arules
FP-growth
Scalable Bayesian Rule Lists
Global or local scope: Rule-based models Best-suited complexity: Most rule-based models
can be both globally and locally are easy to follow for users because they obey
interpretable. Boolean logic (“if, then”), but they can model
extremely complex nonlinear, nonmonotonic
phenomena.
22 | An Introduction to Machine Learning InterpretabilityModel specific or model agnostic: Trust and understanding: Rule-based models
Model specific; can be highly interpretable increase understanding by creating straightforward,
if rules are restricted to simple Boolean rules that can be understood easily by users.
combinations of input variable values. Rule-based models increase trust when the
generated rules match domain knowledge or
reasonable expectations.
Table 1-8. A description of SLIM white-box modeling approaches
Technique: Supersparse Linear Integer Models (SLIMs)
Description: SLIMs create predictive models that require users to only add, subtract, or multiply
values associated with a handful of input variables to generate accurate predictions.
Suggested usage: SLIMs are perfect for serious situations in which interpretability and simplicity
are critical, similar to diagnosing newborn infant health using the well-known Agpar scale.
Reference:
Supersparse Linear Integer Models for Optimized Medical Scoring Systems
Software:
slim-python
Global or local scope: SLIMs are globally Best-suited complexity: SLIMs are simple, linear
interpretable. models.
Model specific or model agnostic: Model Trust and understanding: SLIMs enhance
specific; interpretability for SLIMs is understanding by breaking complex scenarios into
intrinsically linked to their linear nature and simple rules for handling system inputs. They
several model-specific optimization routines. increase trust when their predictions are accurate
and their rules reflect human domain knowledge or
reasonable expectations.
Techniques for Enhancing Interpretability in Complex
Machine Learning Models
In some machine learning projects, accuracy is more important than
interpretability, but some level of transparency is still desirable. In
other projects, dirty or unstructured input data rules out the use of
highly interpretable classical regression models, even if explainabil‐
ity is a necessary outcome of the project. The techniques described
here are meant to be used in these situations or other scenarios in
which explanations must be extracted from complex, nonlinear,
black-box models or decisioning systems. Many of these techniques
can also be used on more transparent white-box models to further
enhance interpretability.
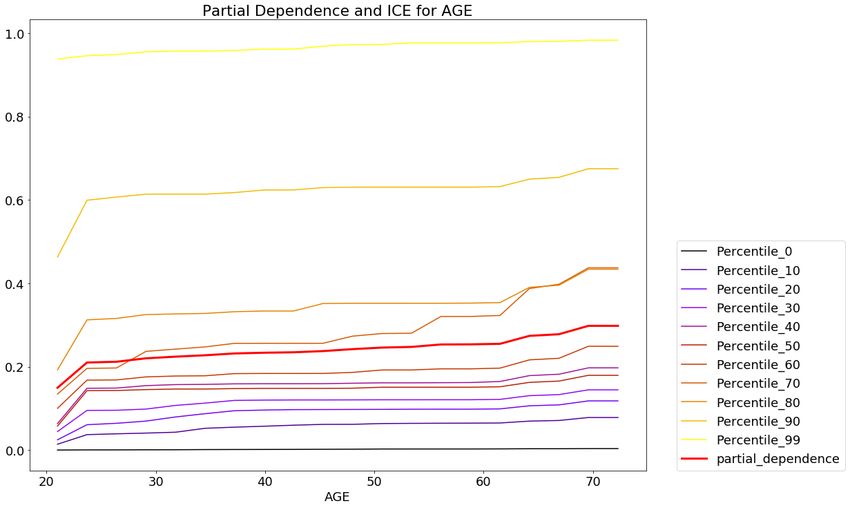
Common Interpretability Techniques | 23Seeing model mechanisms with model visualizations Model visualization techniques can provide graphical insights into the prediction behavior of nearly any black-box model and into the prediction mistakes they might make. A few popular model visuali‐ zations, including decision-tree surrogate models, individual condi‐ tional expectation plots, partial-dependence plots, and residual plots are presented in Tables 1-9 through 1-12 and in Figures 1-6 and 1-7. Surrogate models are simple models of more complex models, and decision-tree surrogate models (Figure 1-6) create an approximate overall flow chart of a complex model’s decision-making processes. Individual conditional expectation (ICE) plots and partial- dependence plots (Figure 1-7) provide a local and global view, respectively, into how a model’s predictions change based on certain input variables. Residual analysis provides a mechanism to investi‐ gate how black-box models make errors in their predictions while also highlighting anomalous data and outliers that might have undue influence on a model’s predictions. Table 1-9. A description of the decision-tree surrogate model visualization technique Technique: Decision-tree surrogates Description: A decision-tree surrogate model is a simple model that is used to explain a complex model. Decision-tree surrogate models are usually created by training a decision tree on the original inputs and predictions of a complex model. Variable importance, trends, and interactions displayed in the surrogate model are then assumed to be indicative of the internal mechanisms of the complex model. There are few, possibly no, theoretical guarantees that the simple surrogate model is highly representative of the more complex model. Suggested usage: Use decision-tree surrogate models to create approximate flow charts of a more complex model’s decision-making processes. References: Extracting Tree-Structured Representations of Trained Networks Interpreting Blackbox Models via Model Extraction OSS: http://bit.ly/2DL3Ip3 https://github.com/h2oai/mli-resources/blob/master/notebooks/dt_surrogate.ipynb Global or local scope: Generally, decision-tree surrogate models are global. The globally interpretable attributes of a simple model are used to explain global attributes of a more complex model. However, there is nothing to preclude fitting decision-tree surrogate models to more local regions of a complex model’s predictions and their corresponding input rows. 24 | An Introduction to Machine Learning Interpretability
Best-suited complexity: Surrogate models can          Model specific or model agnostic: Model
 help explain machine learning models of medium        agnostic.
 to high complexity, including nonlinear, monotonic
 or nonmonotonic models.
 Trust and understanding: Decision-tree surrogate models enhance trust when their variable
 importance, trends, and interactions are aligned with human domain knowledge and reasonable
 expectations of modeled phenomena. Decision-tree surrogate models enhance understanding
 because they provide insight into the internal mechanisms of complex models.

Figure 1-6. A model visualization, a decision-tree surrogate that illus‐
trates an approximate overall flowchart of the decision processes
learned by a more complex machine learning model. (Figure courtesy
of H2O.ai.)

Table 1-10. A description of the ICE plot model visualization technique
 Technique: Individual Conditional Expectation (ICE) plots
 Description: ICE plots, a newer and less well-known adaptation of partial-dependence plots, can
 be used to create local explanations using the same ideas as partial-dependence plots.

                                                      Common Interpretability Techniques     |     25
You can also read