INVESTMENT OPPORTUNITIES IN THE NEW ZEALAND CHOCOLATE INDUSTRY
←
→
Page content transcription
If your browser does not render page correctly, please read the page content below
INVESTMENT OPPORTUNITIES IN
THE NEW ZEALAND CHOCOLATE INDUSTRY
Part of Emerging Growth Opportunities, Food and Beverage Information Project
FINAL REPORT; v100a; completed late 2017; released March 2018
STEERING & GUIDANCE                                                                Projected market information, analyses and conclusions contained herein are         Unless otherwise noted, all photos used in this discussion document were
                                                                                   based (unless sourced otherwise) on the information described above and on          provided by the New Zealand Story resource (www.nzstory.govt.nz),
This project would not have been possible without the strong guidance of our       Coriolis’ judgment, and should not be construed as definitive forecasts or          purchased by Coriolis from a range of stock photography providers as
Steering Committee. In particular, we would like to thank Andrew McCallum          guarantees of future performance or results. Neither Coriolis nor its officers,     documented, or are low resolution, complete product/brand for illustrative
of MBIE for his tireless energy in keeping this project on track, while at the     directors, shareholders, employees or agents accept any responsibility or           purposes used under fair dealing/fair use for both “research and study” and
same time pushing us forward.                                                      liability with respect to this document.                                            “review and criticism”. Our usage of them complies with New Zealand law or
                                                                                                                                                                       their various license agreements.
Draft versions of parts of this document were distributed to key firms for         Coriolis wishes to draw your attention to the following limitations of the
comment, addition or correction. This was done in the form of emails and           Coriolis report “Emerging Growth Opportunities in the New Zealand                   Cover image: Shutterstock
phone calls. We thank those who helped us in this process for their time and       Chocolate Industry 2017“ (the Coriolis Report) including any accompanying
effort. We also thank those who provided their photos.                             presentation, appendices and commentary (the Coriolis Commentary):                  Where appropriate, this document is Copyright © 2017 Coriolis and MBIE.
                                                                                                                                                                       However, please feel welcome to use, refer to and cite this research.
We are grateful for all of the input we have received, but the report is ours      a. Coriolis has not been asked to independently verify or audit the
and any errors are our own.                                                        information or material provided to it by, or on behalf of the Client, or any of
                                                                                   the parties involved in the project;
Finally, we acknowledge the support of the Ministry of Business, Innovation
and Employment (MBIE), New Zealand Trade and Enterprise (NZTE) and the             b. the information contained in the Coriolis Report and any Coriolis
Ministry for Primary Industries (MPI). It is their funding that has made this      Commentary has been compiled from information and material supplied by
report possible.                                                                   third party sources and publicly available information which may (in part) be
                                                                                   inaccurate or incomplete;
CONSTRAINTS & INHERENT LIMITATIONS
                                                                                   c. Coriolis makes no representation, warranty or guarantee, whether express
This work was commissioned by the Ministry of Business, Innovation and             or implied, as to the quality, accuracy, reliability, currency or completeness of
Employment (MBIE) and prepared by Coriolis. This work is based on                  the information provided in the Coriolis Report and any Coriolis Commentary,
secondary market research, analysis of information available or provided to        or that reasonable care has been taken in compiling or preparing them;
Coriolis by our client, and a range of interviews with industry participants and
industry experts. Coriolis have not independently verified this information        d. the analysis contained in the Coriolis Report and any Coriolis Commentary
and make no representation or warranty, express or implied, that such              are subject to the key assumptions, further qualifications and limitations
information is accurate or complete.                                               included in the Coriolis Report and Coriolis Commentary, and are subject to
                                                                                   significant uncertainties and contingencies, some of which, if not all, are
The report is dated November 2017 and Coriolis accepts no liability for, and       outside the control of Coriolis; and
has not undertaken work in respect of, any event subsequent to that date,
which may affect the report.                                                       e. any Coriolis Commentary accompanying the Coriolis Report is an integral
                                                                                   part of interpreting the Coriolis Report. Consideration of the Coriolis Report
Key global trade data analysed in all sections of the F&B Information project      will be incomplete if it is reviewed in the absence of the Coriolis Commentary
are calculated and displayed in US$. This is done for a range of reasons:          and Coriolis conclusions may be misinterpreted if the Coriolis Report is
                                                                                   reviewed in absence of the Coriolis Commentary.
-   It is the currency most used in international trade
-   It allows for cross country comparisons (e.g. vs. Denmark)                     Coriolis is not responsible or liable in any way for any loss or damage
-   It removes the impact of NZD exchange rate variability                         incurred by any person or entity relying on the information in, and the
-   It is more comprehensible to non-NZ audiences (e.g. foreign investors)         Recipient unconditionally and irrevocably releases Coriolis from liability for
-   It is the currency in which the United Nations collects and tabulates          loss or damage of any kind whatsoever arising from, the Coriolis Report or
    global trade data                                                              Coriolis Commentary including without limitation judgments, opinions,
                                                                                   hypothesis, views, forecasts or any other outputs therein and any
Anyone should feel free to call the authors if any of the material cannot be       interpretation, opinion or conclusion that the Recipient may form as a result
understood or accessed. We always welcome opportunities to discuss our             of examining the Coriolis Report or Coriolis Commentary.
research with our readers and users.
                                                                                   The Coriolis Report and any Coriolis Commentary may not be relied upon by
                                                                                   the Recipient, and any use of, or reliance on that material is entirely at their
                                                                                   own risk. Coriolis shall have no liability for any loss or damage arising out of
                                                                                   any such use.
TABLE OF CONTENTS

INTRO                   01                   02                   03                    04                  05
Context &               Strategic            The World of         New Zealand           Key Markets         Key Firm
Conclusions             Vision               Chocolate                                                      Profiles

Pages 3-12              Pages 13-14          Pages 15-27          Pages 28-48           Pages 49-63         Pages 64+

+ Situation             + Strategic Vision   + History            + Production          + Market strategy   + Firm profiles

+ Objective                                  + The Process        + Supply chain        + Growth

+ Wider project                              + Global situation   + Regional activity   + Market mix

+ Methodology                                + Key markets        + Operations          + Market share

+ Scope & Definitions                        + Key competitors    + Megatrends          + Opportunities

+ Elevator Test

+ Drivers of success
                                                                                                            06 APPENDICES
+ SWOT

+ Supply chain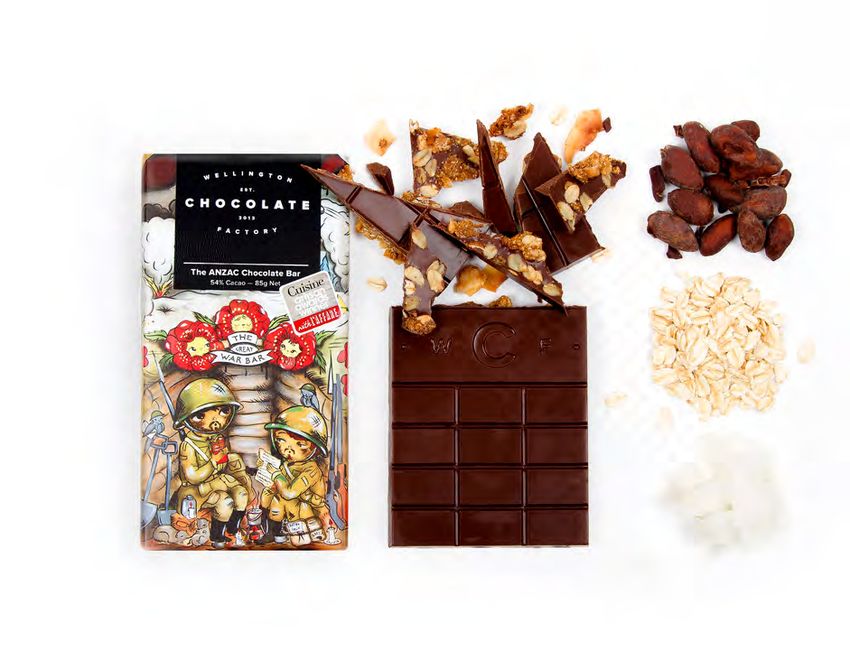
The objective of this project is to identify and profile Emerging Growth Opportunities (EGO) in New
Zealand’s food and beverage exports

SITUATION
                                            Industry and government recognise that       The research forms a part of – and builds
New Zealand has a clear comparative         high growth industries typically need new    on the information in - the wider Food &
advantage in food & beverage (and the       capital and new capabilities to continue     Beverage Information Project.
wider agricultural value chain). Food &     to grow and develop.
beverage exports total $29b and account                                                  AUDIENCE
for 43% of New Zealand’s total exports      OBJECTIVE
of goods and services.
                                                                                         The report is designed to be used by four
                                            The objective of the Emerging Growth         audiences:
New Zealand has a long history in           Opportunities research is to identify
producing and exporting food &              emerging high potential food and             - Investors (domestic or international)
beverages. However, New Zealand             beverage export categories from New
currently has only a limited number of      Zealand. Answering the question - What       - Industry participants (firms &
large export categories, namely dairy,      will be the next wine industry?                individuals)
beef, lamb, seafood, apples and more
recently kiwifruit. Wine has also emerged                                                - Government (across all roles and
in the last 20 years to become a billion    The research draws conclusions on
                                            potential industry strategic directions,       responsibilities)
dollar export category. Growth has come
from more volume but more importantly       highlights opportunities for further
                                            investment and identifies categories         - Scientific researchers (academic,
greater value.                                                                             government & corporate)
                                            which have the potential to contribute to
                                            the goal of substantially growing exports.
Past research as part of the Food &         The most promising categories are
Beverage Information Project (see           analysed further in separate reports (e.g.
Emerging Growth Opportunities 2012)         Chocolate).
identified a range of growing and
emerging export sectors.

                                                                                                                                     4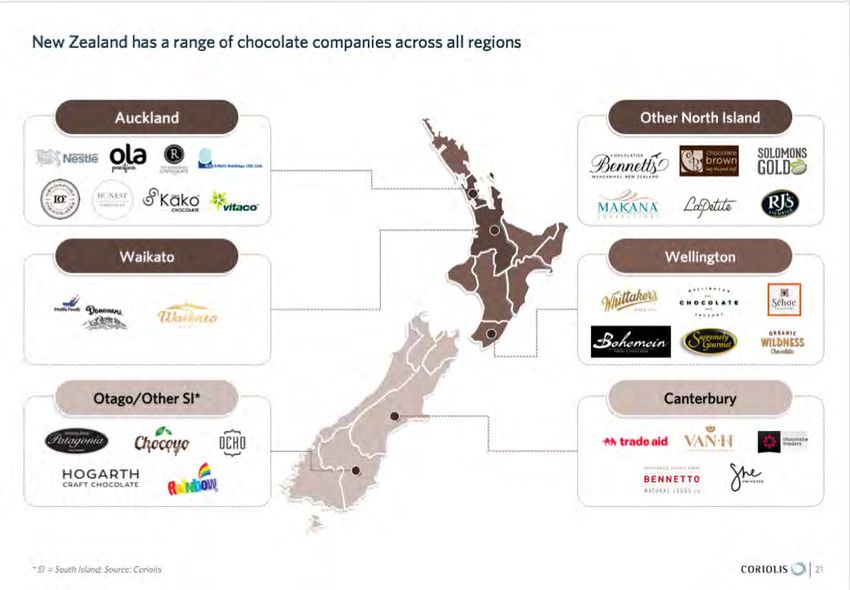
The Emerging Growth Opportunities (EGO) research is part of the wider New Zealand Food and Beverage
Information Project

                SECTOR REPORTS                             INVESTOR GUIDES   EMERGING MARKETS

www.foodandbeverage.govt.nz                                                                           5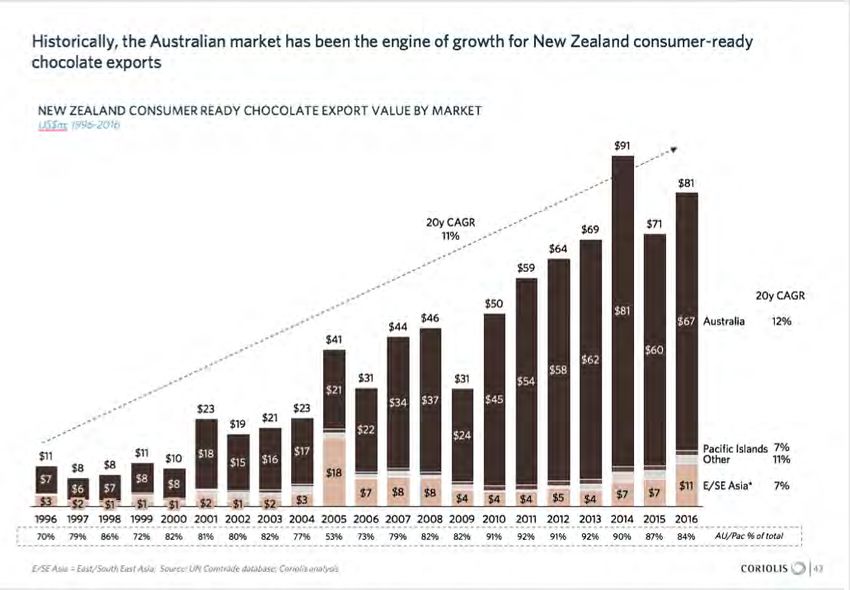
Chocolate emerged from a multi-stage industry screen (Stages I & II) designed to identify, develop &
highlight Emerging Growth Opportunities in New Zealand food and beverage exports

                  See related document for
                     details; available at
                www.foodandbeverage.govt.nz

                          Sta ge I                   Sta ge II                 Sta ge III                                                         You are
                          Pre limin a ry Sc re e n   Se co n d a ry Scre e n   De ve l o p                                                         here
                                                                               O p p o rtu n ities

                                                                                                                         Ch o co la t e , blo cks & m ixe d

                                                                                                                                 Fresh cherries
Initial input                Met criteria                 Met criteria              Identified       Explored in depth
 to process
                                594                            51                      20                   4                 Muesli bars, similar
   697
                                                                                                                         Flavoured beverages, other

                                                                                                                                                              6
DEFINITION This research is focused on chocolate bars and mixed chocolate exports

                                                                             PRODUCTS
                        CONFECTIONERY                                       CONTAINING
                                                                         COCOA/CHOCOLATE

                                                                                                    OTHER PRODUCTS
       SUGAR               CHEWING                                             COCOA
                                               CHOCOLATE                                              CONTAINING
    CONFECTIONERY            GUM                                              PRODUCTS
                                                                                                      CHOCOLATE
       HS170490             HS170410                                         Beans (HS1801)         Numerous trade codes
                                                                             Shells (HS1802)           as applicable
                                                                             Paste (HS1803)
                                                                             Butter (HS1804)
                                                                         Unsweet. Powder (HS1805)

                        BULK/INGREDIENT                                    MIXED (BAGS, BOXED
                                               BARS & BLOCKS
                         “CRUMB”, ETC.                                      GIFTING & OTHER)

                            HS180620        Filled/Enrobed (HS180631)             HS180690
                                           Solid/Not-Filled (HS180632)

                                           PROJECT FOCUS – CONSUMER READY CHOCOLATE

                                                                                                                           7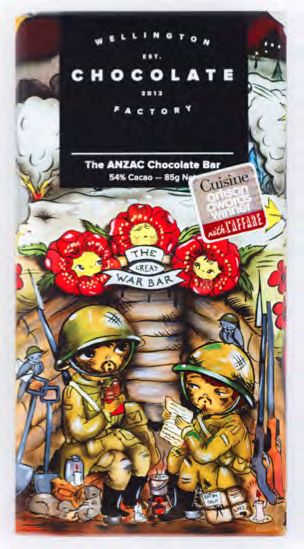
OUT OF SCOPE While this focus puts a number of categories out-of-scope, it is worth noting that New
Zealand has successful firms in all these areas

        COCOA PRODUCTS                                            COCOA POWDER                                     BAKING MIXES   SUGAR CONFECTIONERY

              BEVERAGES                                               MUESLI BARS                                    CEREALS      MANY OTHER PRODUCTS

Photo credit: fair use; low resolution; complete product/brand or promotional material for illustrative purposes                                        8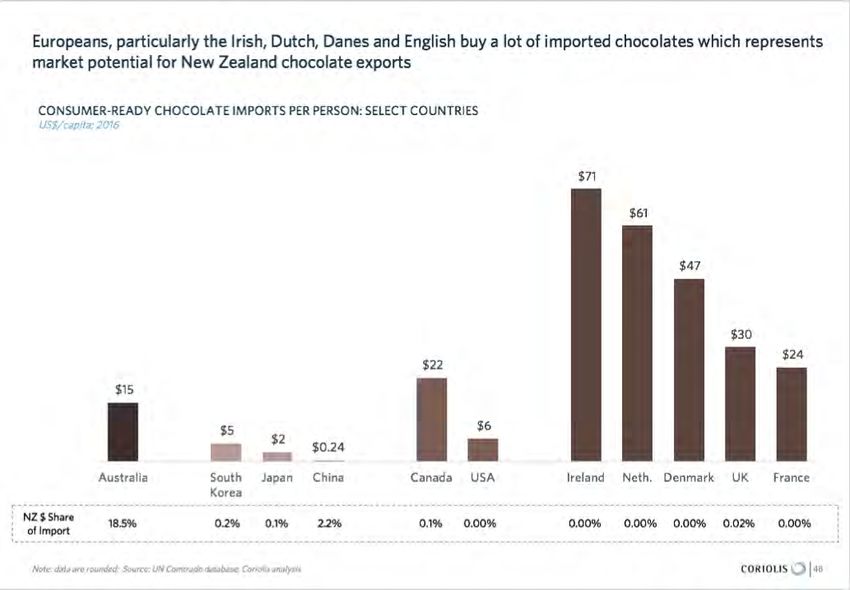
ELEVATOR TEST New Zealand chocolate exports can grow through a focus on premium positioning
DRIVERS OF SUCCESS New Zealand’s success in chocolate has three key drivers

              STRONG COUNTRY IMAGE                                                   EFFICIENT PEOPLE & SYSTEMS                                            LOCATION & MARKETS

                          Comparable to                                                              Trusted by                                                   Well located for
                           Switzerland                                                               consumers                                                        growth

-     “Brand NZ” is strong with clear iconic imagery                       -   Long history of chocolate production                            -   Proximity to East & South-East Asian markets

-     On par with or exceeding Switzerland, Belgium,                       -   High levels of product innovation                               -   CER* agreement with Australia
      the USA and Germany
                                                                           -   Historically focused on the domestic market, now                -   Market access across Asia
-     Recognised and valued by target consumers                                rapidly pivoting to export
                                                                                                                                               -   NZ was the first developed country to sign a free
-     Unique to NZ plants and flavours                                     -   Large pool of skilled technical people                              trade deal with China (2008)

-     Secure production in an isolated location                            -   Strong systems and support networks
      protected by natural barriers

    * Closer Economic Relationship; Source: photo credit (purchased or creative commons (Dollar Photo Club; Shutterstock; freenzphotos.com))                                                           10
SWOT ANALYSIS New Zealand has a growing niche position in the global chocolate trade; success will
come from continued innovation and sales-and-marketing execution
STRENGTHS WEAKNESSES
- Abundant supply of sugar (NZ Sugar) and numerous unique raw materials as - Small size of domestic market
ingredients; ready access to global cocoa bean and powder supplies
- Distance to major high value markets (e.g. relative to Switzerland to Germany)
- Largest global exporter of dairy ingredients
- Limited pool of domestic or resident capital
- Known and trusted supplier of safe and secure ingredients and products to most
- Small domestic private equity sector
major global food & beverage multinationals
- Limited number of highly experienced chocolatiers and chocolate makers
- Robust regulatory system ensures food produced is safe and suitable
- No rich food cultural heritage or tradition to draw from for new product
- Lower cost structure than Australia or the United States
development (vs. France or Italy)
- Low/no corruption, rule of law, efficient court system
- Need to import tropical ingredients (i.e. cocoa); similar to other major producers
- Welcoming of foreign investment; very few rules or limits
- Exchange rate variability
- Strong local manufacturing/process technology skills
- “NZ Inc.” failing to collectively nurture emerging Horizon 2 products to scale
- Customer/consumer awareness, particularly in Asia, of New Zealand as a source
of quality, wholesome foods
- International surveys highlight high levels of innovation and entrepreneurship
- Close proximity to fast growing Asian markets
OPPORTUNITIES ISSUES/THREATS/RISKS
- Growth of Asian middle class; increasing wealth in Asia - Competitors with lower costs and greater economies of scale
- Changing global weather patterns (also a threat) - Continued consolidation of global multinationals leading to hollowing out their
local offices (both a big challenge and a huge opportunity)
- Rich countries of Europe pricing themselves “out of the game”
- The boom/bust economic cycle expresses itself in China
- Large and growing demand for products with soft characteristics (e.g. sustainable)
- A number of alternative channels for processed foods
- Leverage success of New Zealand food industry; build on awareness of New
Zealand in processed foods
- Growth of busy lifestyles and convenience foods
- Medium-sized NZ firms collaborating on marketing and sales in new markets
11SUPPLY CHAIN New Zealand has a simple confectionery supply chain that delivers chocolate to consumers
in New Zealand and elsewhere
SIMPLIFIED MODEL OF NEW ZEALAND CONFECTIONERY SUPPLY CHAIN
Model; 2017
D om e s tic
O w n re ta il or
m a rket
d ire c t s a le s
Imported Cocoa Confectionery
Manufacturing
Ind us tria l/
Beans
Chocolate Ing re d ie nt
Powder
Butter Conve nie nc e ,
Sugar Conf.
S upe rm a rke ts
& othe r re ta il
Sugar
Chewing Gum
S ouve nir, D uty
Free &
Confectionery D is trib utor S p e c ia lis t
Imports
Dairy Wholesalers w hole s a le r
F ood s e rvic e
Fruit & Nuts
Freight & D is trib utor Conve nie nc e ,
Logistics w hole s a le r1 S upe rm a rke ts
Flavours, colours, (in- m a rk e t) & othe r re ta il
other ingredients
Ind us tria l/
Ing re d ie nt
Inte rna tiona l
m a rkets
1. There may be one or more layers of wholesaling, depending on product or market; some wholesale functions may be captive inside retailers or foodservice operators; Source: Coriolis 12Potential Strategic
Vision
01Following success in premium wine and honey exports, New Zealand is well positioned for success with
premium chocolate
STRATEGIC VISION
Vision: Create a differentiated position in premium chocolate with unique New Zealand characteristics
Develop unique Focus on select
New Zealand Build execution Innovate developed markets
chocolate style capabilities rapidly with high premium
or formulation chocolate consumption
- Bring innovation and new - Increase production capacity - Win through rapid new - “Follow in footsteps” of wine
thinking to the industry product launch and honey
- Sales, marketing & promotion
- Leverage unique New - Fast follow emerging global - Initially the Anglo-Saxon Five:
Zealand flavours (e.g. native - Product development trends Australia, United Kingdom,
flora, feijoa, kiwifruit, Ireland, Canada, United
tamarillo, sauvignon blanc) - Procurement & logistics - Move and change faster States
than slow moving large
- Wrap this in a full brand competitors
story; consider flagship retail
stores to tell this story to key
consumers and opinion
leaders
14The World of Chocolate
+ History
+ The Process
02
+ Global situation
+ Key markets
+ Key competitorsThe chocolate industry has a very long history; cocoa was consumed initially by the Mesoamericans in
1900BC
CHOCOLATE TIMELINE
Key events
13 00-15 00’s 16 00-1800
1828
Aztecs start to make Chocolate starts
Cocoa powder & 184 7
chocolate and use in to be made in EU
butter invented First chocolate 1879
ceremonies and beans and USA
in Switzerland bar is made in Lindt invent the
A D 250-9 00 as currency England “Fry’s” conche (smooth
Mayans make
chocolate)
19 00-5 00BC chocolate
Mesoamericans
discover how to
make chocolate 15 00’s 1700’s
drink 1829 189 4
Chocolate comes Hanon’s first
Cadbury start Hershey’s factory
to Spain from USA powered
selling cocoa 186 1 opens in USA
South America chocolate
powder Nestle invent
factory
milk chocolate
bars 19 11
2008
Mars candy
Mars project
2005 factory opens
mapped the cacao 19 9 6
John Nanci made
genome Robert Steinberg
first small batch
(US) coined phrase
chocolate machines
bean to bar 19 25
2010 New York Cocoa
Madre’s “tree to Exchange
bar” developed in established
Hawaii
2005 19 9 0s
2000 19 9 6 Valrhona pioneered
Amano Artisan
Merger makes Barry single origin chocolate
Chocolate sold to Beginning of the
Artisan chocolate Callebaut the largest
Hershey $50m
movement chocolate and cocoa
products manufacturer
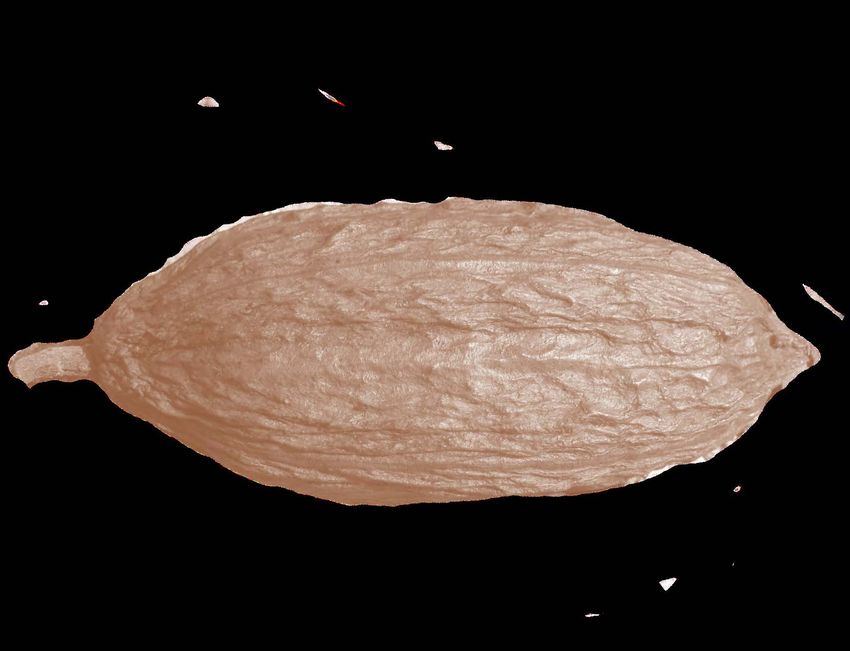
Source: Coriolis 16Cocoa beans can be produced in a narrow zone across the centre of the planet (20 degrees north and south
of the equator)
APPROXIMATE REGIONS WHERE COCOA PLANTS CAN BE GROWN COMMERCIALLY
Conceptual model; 2017
ORIGIN
Source: Coriolis analysis of production data 17Large scale retail chocolate is a processed product that flows through multiple processing stages before it
reaches the consumer
GLOBAL INDUSTRIAL COCOA/CHOCOLATE SUPPLY CHAIN
Model; 2017 Sugar Sugar
Milk Milk
Fats Fats
Other Other
POWDER SECONDARY
MIXES CHOCOLATE
COCOA
MANUFACTURERS
POWDER RETAIL
54%
ROASTING COMPOUNDS FOOD
COCOA COCOA COCOA
GRINDING/ /FILLINGS MANUFACTURERS
FARMING DRY & FERMENT LIQUOR
PROCESSING
THE BEAN
COCOA
BUTTER FOODSERVICE
46% CHOCOLATE GOURMET
COUVERTURE
COCOA PROCESSING PRIMARY/BULK SECONDARY
CHOCOLATE CHOCOLATE
MANUFACTURING MANUFACTURING
MANUFACTURING
Source: Coriolis from a wide range of sources 18Firms participate at various stages along the chocolate making process, depending on their business model,
equipment and scale
BASIC CHOCOLATE PRODUCTION PROCESS
Key stages
- Theobroma cacao botanical name of cacao
TREE TO BAR
C O C O A PL A NT A T I O N - Genetics: Criollo, Forastero, Trinitario, Nacional (10 genetic families)
- Plantations located 20 degrees above and below the equator
- Scoop out 30-50 seeds/pod
HA R V E S T & F E R ME NT - Fermented 3-7 days (decrease astringency)
- Dried to 7% moisture ON PLANTATION
BEAN TO BAR
- Beans dried via large ovens to clothes driers EXPORT TO
ROAST - Removes acidity ”FACTORY”
- Temperature and timing affects taste
- Crack beans
CRACK, SORT & WINNOW - Sort between the husks and nibs (winnowing)
- Grind nibs into particles with melangeur to produce “liquor”
GRIND, MILL & REFINE - Regrind with sugar and ingredients added refine in ball mill, to smooth
- Mix and shine with conche to smooth further
- Heated and cooled
TEMPER - Mould or form
CHOCOLATIER
- Package & sell finished product
RETAIL OR
- Package & sell wholesale ingredients
FURTHER PROCESSING
Source: Coriolis 19Cocoa bean production is concentrated in Africa (66%), particularly the Ivory Coast (32%) and Ghana
(19%), followed by South America (17%), Indonesia (16%) and the Pacific
SHARE OF GLOBAL COCOA BEAN PRODUCTION BY COUNTRY
% of tonnes; 2014
Other Africa
Africa 2%
66% Cameroon Nigeria
6% 6%
Ghana
19% Indonesia
16%
Other S/SE
Asia
1%
Papua New Guinea
1%
Brazil
Other Pacific
6%
0%
Côte d'Ivoire Other Ecuador
32% Americas 4%
7%
TOTAL = 4,450k tonnes
Source: UN FAO; Coriolis analysis and classifications 20Chocolate manufacturers capture about a third (35%) of the total value chain (or five times what the farmer
gets)
SIMPLIFIED CHOCOLATE VALUE CHAIN FROM FARMER THROUGH TO CONSUMER
% of final value excluding GST or sales tax; 2015
44%
100%
35%
8%
2%
4%
7%
Cocoa Farmer Origination & taxes Transport, storage & trade Grinder /Processor Manufacturing costs Retail margins Final Price
(At convenience retail;
supermarkets lower)
Source: Cocoa Barometer 2015 p34-35; Oxfam; Coriolis analysis 21Primary processing of cocoa – which occurs both in producing countries and in key markets – is relatively
concentrated
% OF GLOBAL COCOA GRINDING CAPACITY GLOBAL GRINDING OF COCOA BEANS BY COUNTRY
%; FY15/16 Tonnes; 000; 2014/15
Barry Callebaut
Other
Cargill Asia/Oceania
Netherlands
8% 12%
Malaysia
Olam Other Africa 5%
2%
Blommer Indonesia
Germany
8%
10%
Mondelez
Guan Chong Ghana
6%
Ecom Cocoa Other Europe
15%
BT Cocoa Cote d'Ivoire
13%
Nestle
United States
Transmar Group Brazil Other 10%
5% Americas
6%
Others
TOTAL = 4,152 t (000)
Source: Barry Callebaut FY15/16 Roadshow presentation; ICCO Annual Report 2014/15 22Following harvest and initial processing, cocoa flows to large factories in low risk Western countries for
further processing
COCOA PRODUCERS PROCESSORS & EXPORTERS
153
135 131
108
Euromoney 95 86
Country Risk
Score 53
41
31
16 19 15 11 14
3 9
154 146 146
134 127
Corruption 110
Perceptions
Index Rank 69 62
41
25 22 22 15 8 7 1
Côte d'Ivoire
Ghana
Cameroon
Nigeria
Brazil
Ecuador
Indonesia
Papua New
Poland
France
Belgium
USA
Germany
Switzerland
Netherlands
New Zealand
Guinea
Source: Euromoney Country Risk data; Corruption Perception Index data; Coriolis analysis 23Production of industrial chocolate is relatively concentrated and is typically located in low risk regions where
the major producers are based (e.g. Netherlands, Germany Belgium, Switzerland)
% OF OPEN MARKET INDUSTRIAL CHOCOLATE SALES GLOBAL CONSUMER CHOCOLATE SALES BY REGION
%; FY15/16 %; 2015
Excludes other uses
Barry Callebaut
Cargill
North America
20%
Blommer
Latin America
Fuji Oil 13%
Mid East &
Puratos Africa
4%
Cemoi
Irca
Asia
Clasen 17%
Europe
Kerry Group 44%
Guittard
Australasia
2%
Others
TOTAL = US$102,600m
Excludes own processing
Source: Barry Callebaut FY15/16 Roadshow presentation 24The global consumer chocolate market is polarised with a small number of large firms (the Top 10 control
~50%) and a large number of small firms
GLOBAL CONSUMER CHOCOLATE CONFECTIONERY WHOLESALE SALES BY KEY FIRMS
% of industry turnover; 2016
Nestle $9,280 9%
Ferrero $8,201 8%
Mondelez $8,061 8%
Mars $11,888 11%
Hershey $7,387 7%
Lindt & Sprungli $3,798 4%
Meiji $1,503 1%
Ezaki Glico $946 1%
CEMOI $902 1%
Other $50,018 49% Arcor $613 1%
TOTAL = US$102,600m
Source: ICCO; Candy Industry; Hardman Agribusiness; Coriolis analysis 25Chocolate brands can be segmented into two broad categories: large global corporates control the static
everyday energy bars and a range of innovators are driving premium/luxury
EVERYDAY/ENERGY BARS “NEW PREMIUM”/LUXURY/INDULGENCE
Static-to-declining across developed world Growing globally
Ch a ra ct e rist ics Ch a ra ct e rist ics
- Primarily global brands executing global strategies - Primarily regional specialists with small core range
- Three key drivers: - Nimble and flexible manufacturing; fast following trends
1. Convenience (located at checkouts in petrol, convenience and - Key drivers include :
supermarkets); success = control of impulse purchase hot zones 1. Passion, personality and authenticity; a “real” story
2. Price (often targeting a specific price point) 2. Not mass produced; handcrafted; small batches; limited quantity
3. Brand (well known, traditional, mid-market) 3. “Good” ingredients: natural, organic, ethical, clean
- Trying to address growth of premium (e.g. fair trade) 4. Experiential retail or foodservice experience; gourmet retail
5. Affordable luxury; “costs more and is worth it”
Source: photo credit (firms or fair use/fair dealing; low resolution; complete product/brand for illustrative purposes); various published articles; Coriolis analysis 26In particular, premium consumers are looking for “clean” labels (without additives) and products made with
“real” ingredients; this appears to have a strong fit with Brand New Zealand positioning
Sugar, Peanuts, Glucose Syrup, Skimmed Milk Powder, Cocoa
Butter, Cocoa Mass, Sunflower Oil, Palm Fat, Lactose, Whey
Powder (from Milk), Milk Fat, Emulsifier (Soya Lecithin), Salt,
Coconut Oil, Egg White Powder, Natural Vanilla Extract,
Hydrolysed Milk Protein, Milk Chocolate contains Milk Solids
14% minimum, Milk Chocolate contains Vegetable Fats in
addition to Cocoa Butter
Source: photo credit (firms or fair use/fair dealing; low resolution; complete product/brand for illustrative purposes); various published articles; Coriolis analysis 27New Zealand Chocolate
Industry
+Production +Operations
+Supply chain +Megatrends
03
+Regional activityNew Zealand has a long history in chocolate across three broad eras of development
PIONEER ERA (1860’s-1930’s) PRODUCTION ERA (1930’s-1990’s) INNOVATION ERA (2000’s+)
Creating Seeking Scale Innovating
- Range of chocolate and confectionery firms - Global multinationals acquire and invest in New - Spread of premium, authentic production
founded across New Zealand Zealand confectionery firms concepts and systems from wine to beer to coffee
to chocolate
- Griffins 1864 - Cadbury > Hudsons
- Hudsons 1868 - Nestle > Heards - New generation of innovators attracted to
- Whittakers 1899 - Nabisco > Griffins industry bringing new sensibilities
- Southern Cross 1900 - Nestle > Rowntree Mackintosh
- Huia 1901 - New processes and technologies reduce scale
- Heards 1914 - Significant investment in new factories and factory requirements and barriers to entry
- Mackintosh Caley Phoenix 1926 upgrades; primarily focused on scale production
seeking to utilise low cost ingredients (e.g. dairy) - Range of innovative new products launched
- Focused on replacing imports with domestic
production - Nestle Milo dairy/chocolate drink - Cocoa declared a “superfood”
- Cadbury dairy chocolate “crumb”
- Firms were small and primarily targeting the - Embracing iconic New Zealand flavours and
domestic market - Emergence of iconic “Kiwi” flavoured gift values; often tied in with Pacific region sourcing
chocolates through growth in tourism
Source: Coriolis; photo credit (old images out of copyright; Shutterstock; fair use; low resolution; complete product/brand or promotional material for illustrative purposes) 29The New Zealand confectionery industry is again creating new firms
NUMBER OF CHOCOLATE & CONFECTIONERY MANUFACTURERS IN NEW ZEALAND
Firms; 1860-2015
120 INNOVATION
PIONEER ERA (1860’s-1930’s) PRODUCTION ERA (1930’s-1990’s)
ERA (2000+)
100
CAGR
3%
CAGR
80 0.2%
60
CAGR
7%
40
20
0
1860
1865
1870
1875
1880
1885
1991
1896
1901
1905
1910
1915
1920
1923
1930
1935
1940
1945
1948
1953
1960
1965
1968
1974
1979
1984
1990
1995
2001
2005
2009
2015
CAGR Compound Annual Growth Rate; data is year given or nearest census; Source: Department of Statistics; Statistics NZ; Coriolis analysis 30New firms are continuously being formed
IDENTIFIED SIGNIFICANT CURRENT NEW ZEALAND CHOCOLATE FIRMS BY DECADE OF ESTABLISHMENT
Count; n=47; 1896-2017
22
Excludes: multinationals and sugar confectionary firms
11
9
3
1 1
pre 1900s 1970s 1980s 1990s 2000s 2010s
Note: date of entry into chocolate manufacturing is used for Healtheries,Trade Aid; Source: company websites; New Zealand Companies Office; Coriolis analysis 31Firms participating in the New Zealand confectionery industry can be broadly segmented into six groups
GLOBAL MULTINATIONALS NEW ZEALAND FIRMS
OUT OF SCOPE NEW ZEALAND CHOCOLATE MANUFACTURING INDUSTRY
SOLD THROUGH WHOLESALE MANUFACTURE IN MID/LARGE MID/LARGE EMERGING
DISTRIBUTORS SALES OPERATION NEW ZEALAND BRANDED COMMODITY INNOVATORS
EXAMPLE FIRMS
32Firms are also split into Bean to Bar and Chocolatiers using couverture
BEAN TO BAR CHOCOLATIERS USING COUVERTURE
*
*
“Some of our products only have two ingredients, we “We are looking for a consistent base product and we add our magic.”
want the beans to come through.”
“We find amazing products that really complement the chocolate.”
“We source all our beans from our plantations.”
“Barry Callebaut chocolate is always consistent.”
* Select range 33The industry is spread across the country, with long term growth occurring across most regions
# OF CONFECTIONERY MANUFACTURERS BY REGION # OF CONFECTIONERY MANUFACTURERS BY REGION
Operating units; 2000-2016 Operating units; 2016
120
Otago
100 9%
Auckland
Auckland Canterbury
80
29% 12%
Waikato
60 Other South
Island
Other North Island 6%
40
Wellington
Wellington 12%
Waikato
Other S. Island 9%
20
Canterbury
Other North
Otago Island
23%
2000
2001
2002
2003
2004
2005
2006
2007
2008
2009
2010
2011
2012
2013
2014
2015
2016
TOTAL = 102 operating units
(aka. “front doors” or geographic units)
Source: Statistics NZ; Coriolis classification and analysis 34New Zealand has a range of chocolate companies across all regions
Auckland O ther N orth I s land
W aikat o W elling t on
Otago/Other S I* C anterbury
* SI = South Island; Source: Coriolis 35The New Zealand confectionery industry is growing in unit numbers, employees per unit and total
employment
NUMBER OF OPERATING UNITS AVERAGE EMPLOYEES/UNIT INDUSTRY EMPLOYMENT
Actual; 2001-2016 Headcount/firm; 2001-2016 Headcount; 2001-2016
15y CAGR
1% 15y CAGR
15y CAGR 2500 3%
2% 25
100
2000
20
80
1500
15
60
10 1000
40
5 500
20
0 0 0
2001
2002
2003
2004
2005
2006
2007
2008
2009
2010
2011
2012
2013
2014
2015
2016
2001
2002
2003
2004
2005
2006
2007
2008
2009
2010
2011
2012
2013
2014
2015
2016
2001
2002
2003
2004
2005
2006
2007
2008
2009
2010
2011
2012
2013
2014
2015
2016
Note: data are a Coriolis synthesis; existing data has disagreements in places; Source: UN FAO; Plant & Food Fresh Facts; Statistics NZ; Coriolis analysis 36New Zealand produces four broad types of retail “consumption” chocolate
HS180631 HS180632 HS180690
1. BARS/BLOCKS 2. FILLED/ENROBED 3. MIXED/BAGGED 4. GIFTING
Solid bars of chocolate in Bars of chocolate containing other Bags or boxes of chocolates which are Premium boxed assorted chocolates
consumer-ready sizes fillings in consumer-ready sizes typically individually wrapped designed primarily for gifting
Two distinct sub-segments: - Primarily sold through - Sold through a wide range of retail
supermarkets and discounters outlets, from duty free to
- Everyday/Energy bars (40-50g) confectioners, department stores
sold primarily through convenience - Promoted and pushed heavily at to high end supermarkets
stores, vending machines and in Halloween; large off-aisle displays
checkout areas; typically - Promoted and pushed heavily
consumed immediately - Limited range other times of year; around key holidays, particularly
positioned as sharing packs Valentines Day, Mother’s Day
- Premium bars/blocks (100-200g)
sold through a wider range of - Market can be further segmented
retailers; often with inclusions; into everyday gifting and premium
typically consumed later or special occasion gifting
- Growing focus on sales to tourists
Source: photo credit (fair use/fair dealing; low resolution; complete product/brand for illustrative purposes); various published articles; Coriolis analysis 371. SOLID BLOCK/BAR New Zealand makes a range of block/bar chocolate products Source: photo credit (fair use/fair dealing; low resolution; complete product/brand for illustrative purposes); various published articles; Coriolis analysis 38
2. ENROBED/FILLED/INCLUSIONS New Zealand makes a range of enrobed and enriched chocolate
products

Source: photo credit (fair use/fair dealing; low resolution; complete product/brand for illustrative purposes); various published articles; Coriolis analysis   39
3. MULTI-PACK New Zealand makes a range of multi-pack chocolate products

Source: photo credit (fair use/fair dealing; low resolution; complete product/brand for illustrative purposes); various published articles; Coriolis analysis   40
4. GIFTING PACK New Zealand makes a selection of gifting pack chocolate products

Source: photo credit (fair use/fair dealing; low resolution; complete product/brand for illustrative purposes); various published articles; Coriolis analysis   41
Four global consumer mega-trends are driving growth and new product development in chocolate (and wider
food & beverage industry)
                                                                        FOUR CONSUMER FOOD & BEVERAGE MEGA-TRENDS

           EASY & CONVENIENT                                    LIFESTYLE & WELLNESS                                AUTHENTIC & RESPONSIBLE                                    SENSORY & INDULGENT

    I am trying to achieve work-life balance and           I am concerned about my wellness and am                I am mindful of where my food comes from               I like to indulge in rich and sumptuous living
        need quick-and-easy meal solutions                       trying to live a positive lifestyle                       and how it is produced                                  beyond the bare necessities

−     Dramatic increase in female participation        −    Mid-high income countries experiencing an         −    Dramatic global shift to city living;             −     Growing income polarisation into “haves
      in the workforce globally                             aging population                                       1800=3%, 1900=14%, 2015=50%;                            and have-nots”
                                                                                                                   developed nations 75%+; 400 cities 1m+
−     Consumers working longer hours to                −    Spread of Western lifestyle and Western                                                                  −     Strong emerging trend to premium (and
      maintain relative income                              diseases of affluence (e.g. diabetes)             −    Loss of attachment to the land and food                 discount) at the expense of the mid-market
                                                                                                                   production – growth of artisan and craft
−     Work hours no longer just "9 to 5"; food         −    Ongoing waves of media hype around fad                                                                   −     Emerging middle class across developing
      needs at all times (e.g. night shift)                 diets and new "superfoods"                        −    Ongoing "rights revolution”, fair trade to              world driving consumption growth
                                                                                                                   direct trade
                                                       −    Food presented and viewed as both the                                                                    −     Incredible power of food and beverages in
                                                            problem and the solution                          −    Ongoing waves of food scares around food                many social settings
                                                                                                                   quality, contamination, additives

−     May represent a need for an immediate            −    May be addressing specific conditions (e.g.       −    May target specific foods perceived as high       −     May range from "everyday luxury" to an
      solution (e.g. thirst, hunger)                        oats to lower cholesterol)                             risk, unethical or visible (e.g. coffee, cacao,         occasional "treat”
                                                                                                                   eggs)
−     May represent an easy solution to a future       −    May target a specific family member (e.g.                                                                −     May be used to demonstrate social status,
      challenge (e.g. single serves for children's          grandparent)                                      −    May target a specific family member (e.g.               taste or style
      lunches)                                                                                                     mother)
                                                       −    May reflect wider worldview                                                                              −     Gifting culture in Asia around premium,
                                                                                                                                                                           luxury items

Source: Boston Consulting Group; Datamonitor; photo credit (purchased from stock providers); Coriolis research and analysis                                                                                               42
To the first of the four, New Zealand chocolate manufacturers are on-trend for making
things easy and convenient for consumers
EASY & CONVENIENT
CHOCOLATE-FOCUSED “COFFEE” SHOPS ONLINE/DIRECT RETAILING
Following on from the success of premium coffee shops, there is an emerging Providing busy consumers - and consumers from elsewhere on the planet – an
move towards cocoa/chocolate focused outlets. opportunity to quickly and conveniently order.
EXAMPLE
Most NZ chocolate
firms offer this service
Source: photo credit (firm promotional images or fair use/fair dealing; low resolution; complete product/brand for illustrative purposes); various published articles; Coriolis analysis 43Second, New Zealand chocolate manufacturers are on-trend for lifestyle & wellness
LIFESTYLE & WELLNESS
DARK CHOCOLATE AS SUPERFOOD LOW SUGAR/SUGAR FREE
Dark chocolate is rich in flavonoids, antioxidants that may lower blood pressure, Traditional chocolate products are energy dense foods. Emergence of new
improve blood flow, and boost overall heart wellness. In response, manufacturers naturally derived sweeteners enabling manufacturers to offer products with lower
are making products with high cocoa levels. energy levels.
80% cocoa solids 100% cocoa
Source: photo credit (firms or fair use/fair dealing; low resolution; complete product/brand for illustrative purposes); various published articles; Coriolis analysis 44Third, New Zealand chocolate manufacturers are on-trend for authentic and
responsible production through buying fair trade cocoa beans…
AUTHENTIC & RESPONSIBLE
ETHICAL/SUSTAINABLE/FAIR TRADE/DIRECT TRADE
Chocolate growers receive a very small percentage of the final retail price. Fair trade products seek to return more to the farmer.
“We are certified “Ola Pasefika supports
“We’re helping talented “We are… committed to
Fairtrade… We focus on village growers in
people around the world su p p o rt in g t h e lo ca l
all-natural, F a irt ra d e Samoa and other Pacific
im p ro ve t h e ir live s “At the Wellington co m m u n it ie s in the
c e rt ifie d a n d fu lly Islands via d ire ct t ra d e .
through trade… making Chocolate Factory we Solomons Islands. The
t ra ce a ble p ro d u ct s – We now have a large
the world a better place make organic, e t h ica lly makers of Solomons
and not just because it’s number of village
for both producers and t ra d e d , bean to bar Gold aspire to
nice, but because it’s growers who we pay
consumers and there chocolate of the highest significantly contribute
vital to the ongoing premium price for
are so many ways you quality..” to the resurgence of
wellbeing of the people cacao; that go directly
can be a part of this cacao exports from the
and the world we live to help growers’
revolutionary change. ” Solomon Islands.
in.” families.”
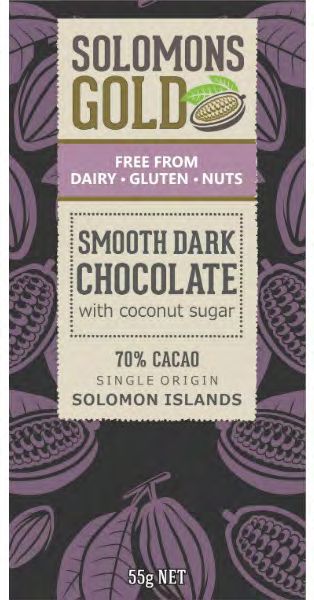
45… and through local/regional sourcing from the Pacific region…
AUTHENTIC & RESPONSIBLE
PACIFIC SOURCING
The Pacific Islands are emerging as a new cocoa producing region and have strong cultural ties with New Zealand
FIJI PAPUA NEW GUINEA SOLOMON IS. SAMOA
Source: photo credit (firms or fair use/fair dealing; low resolution; complete product/brand for illustrative purposes); various published articles; Coriolis analysis 46… as well as through embracing authentic and iconic New Zealand imagery
AUTHENTIC & RESPONSIBLE
ICONIC SCENERY ICONIC NEW ZEALAND “KIWIANA”
New Zealand has a distinct landscape known to New Zealand has developed a distinct, unique identity with a range of iconic
locals, tourists and many consumers. images
Source: photo credit (firms or fair use/fair dealing; low resolution; complete product/brand for illustrative purposes); various published articles; Coriolis analysis 47Finally, New Zealand chocolate manufacturers are on-trend for producing
sensory and indulgent products
SENSORY & INDULGENT PRODUCTS
SINGLE ESTATE UNIQUE NEW ZEALAND FLAVOURS
Due to its being an isolated island nation, New Zealand has a range of unique
There is a growing global trend to marketing premium and super-premium
plants and flavours. New Zealand’s innovative fruitgrowers have also named and
chocolates as single estate (similar to wine)
commercialised a range of new fruits.
“Made from beans from the “Made from beans from the Moa
Akesson Estate of Northern Estate in Upolo, Samoa“
Madagascar“
Source: photo credit (firms or fair use/fair dealing; low resolution; complete product/brand for illustrative purposes); various published articles; Coriolis analysis 48These trends drive new product development, through (1) packaging, (2) product, (3) category and (4)
channel innovation; in practice however, success invariably comes down to implementation and execution
CONSUMER FACING INNOVATION IN THE FOOD & BEVERAGE INDUSTRY FROM TREND TO EXECUTION
Simplified model; 2017
EASY & CONVENIENT LIFESTYLE & WELLNESS AUTHENTIC & RESPONSIBLE SENSORY & INDULGENT
CONSUMER FOOD & BEVERAGE MEGA-TRENDS
NEW PRODUCT DEVELOPMENT
1. PACKAGING INNOVATION 2. PRODUCT INNOVATION 3. CATEGORY INNOVATION 4. CHANNEL INNOVATION
Usage Flavour Line extension Foodservice offer
Shelf-life Formulation/recipe Creation of new category Duty free
Convenience New/different ingredients New temperature state Non-foods retail offer
Appearance Source/origin Vending
New materials Production system Internet/Home delivery
Manufacturing process Own retail stores
IMPLEMENTATION & EXECUTION
Source: Coriolis 49Key Markets for
NZ Chocolate
+ Market strategy
+ Growth
04
+ Market mix
+ Market share
+ OpportunitiesThe New Zealand chocolate industry needs to maintain and grow the Australian market, while developing
opportunities in high value E/SE* Asian and Western markets
Australia China North America
Pacific Islands Singapore/Malaysia United Kingdom
Other E/SE Asia Europe
REGIONAL MARKETS E/SE ASIA MARKETS EUROPE/NORTH AMERICAN MARKETS
Expand channel penetration Leverage country image Fix underperformance
Gain share Position as premium Recreate wine success
- Improve shelf presence in convenience for - Increase awareness of NZ as a source of - Need a unique product/position to avoid a
everyday (e.g. Whittakers Peanut Slab) chocolate (not just “meat and dairy”) “coals to Newcastle” challenge; suggest
unique New Zealand flavours
- Gain share across premium channels - Focus on seasonal gift giving, particularly
(department stores, gourmet specialists) Valentines Day and Chinese New Year - Develop a plan to succeed in the UK
(CNY) market; lessons from wine and honey
- Initially focus on areas with large
expatriate population - Position NZ as premium - Expand model to Europe and North
America
*E/SE East /South East; Source: photo credit (purchased from stock providers) 51New Zealand has growing consumer ready (C.R.) chocolate exports, driven by volume increases (20y CAGR
8%) and moderate price increases (20y CAGR 3%), leading to strong export growth (20y CAGR 11%)
NZ C.R. CHOCOLATE EXPORT VOLUME AVERAGE EXPORT PRICE PER KILOGRAM NZ C.R. CHOCOLATE EXPORT VALUE
Tonnes; 1996-2016 US$; not inflation adjusted; 1996-2016 US$m; 1996-2016
14 $8 $100
20y CAGR 20y CAGR
20y CAGR 3% 11%
8% $90
$7
12
$80
$6
10 $70
x =
$5
$60
8
$4 $50
6
$40
$3
4 $30
$2
$20
2
$1
$10
0 $0 $0
1996
1998
2000
2002
2004
2006
2008
2010
2012
2014
2016
1996
1998
2000
2002
2004
2006
2008
2010
2012
2014
2016
1996
1998
2000
2002
2004
2006
2008
2010
2012
2014
2016
Note: C.R. = Consumer Ready (i.e. excluding bulk/industrial); Source: UN Comtrade database; Coriolis analysis 52Consumer ready chocolate accounts for a quarter of New Zealand exports of snacks across the wider
snacking platform
VALUE OF NEW ZEALAND EXPORTS ACROSS WIDER “SNACKING” PLATFORM
US$m; 2016
Cocoa products $2 1%
Bulk
Ice Cream chocolate Consumer-ready chocolate
$28 9% $22 7% $81m
Block/Bar
$22 7% 26%
Biscuits $31 10%
Enrobed $21 7%
Mixed/other $39 12%
Crackers $71 23%
Muesli Bars
$23 7%
Sugar confectionery $49
Chewing gum $7 2% 15%
TOTAL = US$315m in exports in 2016
Source: UN Comtrade database; Coriolis classification and analysis 53Consumer ready chocolate is growing (20y CAGR 11%), with all types growing, especially enrobed (20y
CAGR 16%)
NEW ZEALAND CONSUMER-READY CHOCOLATE EXPORT VALUE BY TYPE
US$m; 1996-2016
$91
$81
$19
20y CAGR
20y CAGR $71
11% $69 $22 Block/Bar 9%
$64
$12
$12
$59 $5
$5 $32
$50
$16
$46 $3 $21 Enrobed 16%
$44 $17 $24 $26
$41 $6
$2 $9 $13
$11 $31 $31
$18
$3 $14 $3
$23 $23
$0 $21 $1 $9
$19 $11 $43
$0 $40 $39 Mixed/other 10%
$1 $37
$13 $12 $34 $33 $33
$11 $8 $11 $28
$11 $10
$8 $1 $22 $23
$8 $0 $19
$4 $2 $5 $5 $17
$1 $2 $2
$1 $10 $10 $9 $11
$6 $5 $5 $5 $5
1996 1997 1998 1999 2000 2001 2002 2003 2004 2005 2006 2007 2008 2009 2010 2011 2012 2013 2014 2015 2016
Source: UN Comtrade database; Coriolis classification and analysis 54In general all products are achieving modest price increases, chocolate export prices per kilogram by type
appear to broadly track in-line
AVERAGE EXPORT PRICE FOR CONSUMER-READY CHOCOLATE BY TYPE
US$; FOB; 1996-2016
$10.00
$9.00 20y CAGR
Enrobed 3%
$8.00
$7.00
Mixed/other 3%
Block chocolate 2%
$6.00
$5.00
$4.00
$3.00
$2.00
$1.00
$0.00
1996 1997 1998 1999 2000 2001 2002 2003 2004 2005 2006 2007 2008 2009 2010 2011 2012 2013 2014 2015 2016
Note: Data are calendar years and uses HS96 trade code 180690, 180632 & 180631; Source: UN Comtrade database; Coriolis analysis 55Australia is by far the largest market (82%) for New Zealand consumer-ready chocolate exports, followed
by E/SE Asia (14%); all other market are small at present
VALUE OF NEW ZEALAND CONSUMER-READY CHOCOLATE EXPORTS BY MARKET
US$m; 2016
Pacific Islands $1 2%
Australia $67 82% North America $1 1%
Europe $0 0%
Other $0 0%
SE Asia $3 4%
NA/ME/CA* $1 1%
East Asia $8 10%
TOTAL = US$81m in exports in 2016
NA/ME/CA = North Africa, Middle East, Central Asia; Source: UN Comtrade database; Coriolis classification and analysis 56Historically, the Australian market has been the engine of growth for New Zealand consumer-ready
chocolate exports
NEW ZEALAND CONSUMER READY CHOCOLATE EXPORT VALUE BY MARKET
US$m; 1996-2016
$91
$81
20y CAGR $71
$69
11%
$64
$59
20y CAGR
$50
$81
$46 $67 Australia 12%
$44
$41
$60
$62
$58
$31 $31 $54
$21
$34 $37 $45
$23 $23
$21
$19
$22 $24
$11 $18 $17 Pacific Islands 7%
$11 $10 $16 Other 11%
$8 $15
$8 $18
$7 $8
$6 $7 $8 $11 E/SE Asia* 7%
$7 $8 $8 $7 $7
$3 $3 $4 $4 $4 $5 $4
$2 $1 $1 $1 $2 $1 $2
1996 1997 1998 1999 2000 2001 2002 2003 2004 2005 2006 2007 2008 2009 2010 2011 2012 2013 2014 2015 2016
70% 79% 86% 72% 82% 81% 80% 82% 77% 53% 73% 79% 82% 82% 91% 92% 91% 92% 90% 87% 84% AU/Pac % of total
E/SE Asia = East/South East Asia; Source: UN Comtrade database; Coriolis analysis 57The average price realised by New Zealand exports varies between markets
NEW ZEALAND AVERAGE REALISED PRICE OF C.R. CHOCOLATE EXPORT BY MARKET
US$; FOB; 2006-2016
$15.00
10y CAGR
NA/ME/CA 11%
Japan 9%
$10.00 Singapore 6%
Europe 7%
China 5%
South Korea 11%
Malaysia
Hong Kong 10%
Australia 9%
North America 2%
$5.00
$0.00
2006 2007 2008 2009 2010 2011 2012 2013 2014 2015 2016
Note: Data are calendar years and uses HS96 trade code 180690, 180632 & 180631; Source: UN Comtrade database; Coriolis analysis 58Looking at share of New Zealand’s exports by market beyond the local Australia/Pacific region highlights
reliance on E/SE Asia, particularly China
SHARE OF C.R. CHOCOLATE EXPORT VALUE IN SECONDARY MARKETS
US$m; 1996-2016
100% 0% 0% 0% 0% 0% 0% 0% 0% 2%
3% 3% 5% 4%
7% 6% 5% 4% 2% 1%
9% 9% 8% 2%
11% 2%
14% 14%
90%
24% 7% 26%
28% 8%
2%
80% 11% 28%
20y Change
12%
13%
42% 2% 54% China +47%
70% 26%
12% 12% 40%
7% 58% 59% 57%
15% 10%
73%
61%
60% 68% 21%
9% 8% 66% 15%
88% 76%
0% 84%
23% 10%
50% 9%
18% 24% 5%
2% Japan -59%
11% 15%
25%
40% 1% 24% 10% Other E/SE Asia +5%
21%
8% 2% 5%
22%
10% 12% 4% Singapore -11%
30% 5% 14%
1% 13%
7% 5% 23%
17%
46% 7% 15% Malaysia +11%
1%
20% 39% 10%
15% 16%
27% 3% 18%
16% 21% 14%
22% 1% 7%
4% 21% 0%
3% 2% 8% NA/ME/CA +1%
10% 4% 21% 21% 2%
4% 14% 3% 0% 5%
15% 1% 1% 2% 1% Other +1%
11% 9% 5% 0%
3% 5% 4% 3% 3% Europe +3%
8% 0% 6% 4%
3% 2% 0%
1% 0% 6% 4%
0% 0%
2% 2% 0%
1% 0%
1% 2% 1% 4% 4% 4% North America +4%
0% 0% 0% 1% 0% 1% 1% 1% 1% 1% 2%
1996 1997 1998 1999 2000 2001 2002 2003 2004 2005 2006 2007 2008 2009 2010 2011 2012 2013 2014 2015 2016
Note: Data are calendar years and uses HS96 trade code 180690, 180632 & 180631; Source: UN Comtrade database; Coriolis analysis 59New Zealand achieves good market share (13.5%) in its local Australia/Pacific region; beyond this, the
global market is virtually untapped
NEW ZEALAND CONSUMER-READY CHOCOLATE VALUE BY MARKET
US$m; 1996-2016
Import
value
share
% of US$;
2016
Others 86.5%
99.4% 99.6% 99.9% 100.0% 100.0% 100.0% 100.0% 100.0%
NZ Share 13.5%
0.6% 0.4% 0.1% 0.0% 0.0% 0.0% 0.0% 0.0%
AU/Pacific
East Asia
SE Asia
NA/ME/CA
S. Asia
North America
SS Africa
Europe
C/S America
Proportional to total market import value in US$; 2016
Source: UN Comtrade database; Coriolis analysis 60Chocolate imports per capita are highly correlated with income; rich countries import a lot of chocolate and
poor countries do not
FOCUS HERE
GLOBAL CONSUMER-READY CHOCOLATE IMPORTS
Netherlands Luxembourg
Belgium Austria
Ireland
$100.00 Hong Kong SAR
Denmark
United Arab Emirates Macau SAR
Antarctica
Imports per United Kingdom Singapore
Switzerland
per capita; Kuwait Sweden
Norway
Canada
US$/resident; France Qatar
Finland Bermuda
2016 (Note: Portugal
Saudi Arabia Germany Australia
Logarithmic
scale) $10.00 Spain
Italy
USA San Marino
South Korea
Taiwan
Malaysia Japan
Fiji
Russia
Samoa
$1.00
Brazil
Nepal
Vietnam
Indonesia China
Afghanistan
$0.10 Malawi
North Korea
India
Eritrea
$0.01
$100 $1,000 $10,000 $100,000
GDP per capita; US$/resident; 2016 (Note: Logarithmic scale)
Source: CIA World Fact Book; UN Comtrade database; Coriolis analysis 61Europeans, particularly the Irish, Dutch, Danes and English, buy a lot of imported chocolates which
represents market potential for New Zealand chocolate exports
CONSUMER-READY CHOCOLATE IMPORTS PER PERSON: SELECT COUNTRIES
US$/capita; 2016
$71
$61
$47
$30
$24
$22
$15
$5 $6
$2
$0.24
Australia South Japan China Canada USA Ireland Neth. Denmark UK France
Korea
NZ $ Share
18.5% 0.2% 0.1% 2.2% 0.1% 0.00% 0.00% 0.00% 0.00% 0.02% 0.00%
of Import
Note: data are rounded; Source: UN Comtrade database; Coriolis analysis 62New Zealand is capable of achieving significant market share in premium products, as wine and honey have
shown; consumer-ready chocolate is underperforming outside Australia
NEW ZEALAND VALUE SHARE OF IMPORTS OF SELECT PRODUCTS IN SELECT MARKETS
% of US$; VFD as reported receiver; 2016
BOTTLE WINE HONEY CONSUMER CHOCOLATE
Australia 64% 62% 19%
Ireland 10% 8% 0%
United Kingdom 8% 29% 0%
USA 8% 4% 0%
Singapore 7% 59% 0%
Chocolate clearly
Canada 5% 19% 0% underperform outside
Australia
UAE 3% 3% 0%
Suggest a “straw man”
1% 0% 2-3% share target
France 3% across these markets
Sweden 3% 0% 0%
Malaysia 3% 16% 2%
South Korea 1% 30% 0%
Japan 1% 19% 0%
VFD = Value for duty; Source: UN Comtrade database; Coriolis analysis 63Taking the U.K. as an example, New Zealand should target between 2% and 5% market share, which would
equate to ~$35 million to $87 million in export sales respectively to the U.K.
UNITED KINGDOM CHOCOLATE IMPORT VALUE BY SOURCE COUNTRY
US$m; VFD; 2016
Netherlands Belgium
$182 $137
11% 8% Lithuania
Italy
$94 $28
France 5% 2%
$186
11%
Other Europe Other
$112 $14
6% 1% New Zealand
$0 Versus:
Ireland
USA $38 2% 0% 2% = $35m
$192 Canada
11% 5% = $87m
$0
0%
Germany
Poland $451
$300 26%
17%
TOTAL = US$1,734m
Note: As reported UK Customs; value for duty; Source: UN Comtrade; Coriolis analysis 64Key NZ Chocolate
Firms
+ Firm Profiles
05BENNETTO NATURAL FOODS CO BENNETTS OF MANGAWHAI BOHEMEIN FRESH CHOCOLATES CHOCOLATE BROWN
Lucy Bennetto Mary Bennett Jiri (George) Havlik Susan Vize
Owner Owner Owner Owner
DESCRIPTION: Premium drinking chocolate bars DESCRIPTION: Handmade artisan chocolates; DESCRIPTION: Premium chocolatier; use Barry DESCRIPTION: Chocolate chocolatier; retail,
manufacturer; expanding into eating chocolate in flagship store & café in Mangawhai Village; Callebaut chocolate; retail stores in Auckland, wholesale and corporate sales; onsite café and retail
2018; manufactured at FoodSouth; organic, fair Retail store at Smith & Caughey’s Auckland city; Wellington; purpose built factory in Miramar; 248 store; Callebaut couverture; established in
trade, Peruvian Criollio cocoa Focus on NZ ingredients and flavours. products Geraldine, moved to Queenstown and then to
Warkworth
KEY PRODUCTS: Drinking chocolate bar, hot KEY PRODUCTS: Boxed chocolates, chocolate bars, KEY PRODUCTS: Boxed chocolates; chocolate fish KEY PRODUCTS: Boxed chocolates; chocolate bars,
chocolate powders, chocolate bars (Oct 2018) nougat, marshmallow fudge, confectionery
OWNERSHIP: NZ; Private (Bennetto) OWNERSHIP: NZ; Private (Bennett Family) OWNERSHIP: NZ; Private (Havlik) OWNERSHIP: NZ; Private (Vize)
COMPANY NUMBER: 2374269 COMPANY NUMBER: 1056085 COMPANY NUMBER: 1517944 COMPANY NUMBER: 5698687
ADDRESS: 63 Cleveland Street, ADDRESS: 52 Moir Street, ADDRESS: 127 C Park Road, ADDRESS: 6 Mill Lane,
Christchurch Mangawhai Village Miramar Warkworth
PHONE: +64 3 386 3528 PHONE: +61 9 431 5500 PHONE: +64 4 891 1052 PHONE: +64 9 422 2677
WEBSITE: www.bennetto.co.nz WEBSITE: www.bom.co.nz WEBSITE: www.bohemein.co.nz WEBSITE: www.chocolatebrown.co.nz
YEAR FORMED: 2010 YEAR FORMED: 1998 YEAR FORMED: 2005 YEAR FORMED: 2007
STAFF EMPLOYED: 2 STAFF EMPLOYED: 40 (12 factory) STAFF EMPLOYED: 17 STAFF EMPLOYED: 30
REVENUE: >$1m REVENUE: $2-5m (all businesses) REVENUE: $1-5m* REVENUE: $1-3m*
COMPANY HIGHLIGHTS: National distribution in COMPANY HIGHLIGHTS: State-of-the-art COMPANY HIGHLIGHTS: COMPANY HIGHLIGHTS:
Australia, new organic eating chocolate range destination in Mangawhai Village; NZ distributor of
launched in Nov ‘17 Belcolade chocolate
* Estimate; Source: various companies annual financial statements (NZ Companies Office or company website); various press releases and news articles; Coriolis analysis 66CHOCOLATE TRADERS CHOCOLATES ARE US CHOCOYO DEVONPORT CHOCOLATES
Irene Gillies Leanne Petersen Yoann Martichon Stephanie Everitt
Managing Director Owner Owner Managing Director
DESCRIPTION: Premium chocolate manufacturers DESCRIPTION: Customised chocolate DESCRIPTION: Premium chocolate manufacturer; DESCRIPTION: Boutique chocolatier and some bean
and wholesalers; customised chocolates for manufacturer; focus on corporate embossing and emphasis on local ingredients to bar chocolate manufacturing; based in
corporate sales; factory in Christchurch; uses Barry souvenir chocolates Devonport; retail store onsite and in Auckland; one
Callebaut chocolate of the biggest and oldest handmade chocolate
companies in New Zealand; 20t production per
annum
KEY PRODUCTS: Chocolate bars, boxed chocolates KEY PRODUCTS: Chocolate bars, embossed thins, KEY PRODUCTS: Boxed chocolates, chocolate KEY PRODUCTS: Boxed chocolates, chocolate bars
confectionery hazelnut spread
OWNERSHIP: NZ; Private (Gilles, Brown) OWNERSHIP: NZ; Private (Stewart, Petersen) OWNERSHIP: NZ; Private (Martichon) OWNERSHIP: NZ; Private (Everitt)
COMPANY NUMBER: 3579891 COMPANY NUMBER: 5223681 COMPANY NUMBER: TBD COMPANY NUMBER: 1137390
ADDRESS: 205 Robinsons Road, ADDRESS: 6A Dakota Drive, ADDRESS: 3/38 North Road, ADDRESS: 17 Wynyard Street,
Ladbrooks Whitianga Nelson Devonport, Auckland
PHONE: +64 3 943 9222 PHONE: +64 7 866 4063 PHONE: +64 27 974 1213 PHONE: +64 9 445 6001
WEBSITE: www.chocolatetraders.co.nz WEBSITE: www.chocolatesareus.co.nz WEBSITE: www.chocoyo.co.nz WEBSITE: www.devonportchocolates.co.nz
YEAR FORMED: 1990 YEAR FORMED: 1988 YEAR FORMED: 2015 YEAR FORMED: 1991
STAFF EMPLOYED: TBD STAFF EMPLOYED: TBD STAFF EMPLOYED: TBD STAFF EMPLOYED: 15
REVENUE: $1-5m* REVENUE: $1-5m* REVENUE:You can also read