Post-nesting migrations of Galápagos green turtles Chelonia mydas in relation to oceanographic conditions: integrating satellite telemetry with ...
←
→
Page content transcription
If your browser does not render page correctly, please read the page content below

Vol. Preprint, 2007                      ENDANGERED SPECIES RESEARCH
                                                                                                         Published online December 7, 2007
    doi: 10.3354/esr00066                          Endang Species Res

                                                                                                                    OPEN
                                                                                                                    ACCESS
THEME SECTION

              Post-nesting migrations of Galápagos
          green turtles Chelonia mydas in relation to
         oceanographic conditions: integrating satellite
           telemetry with remotely sensed ocean data
         Jeffrey A. Seminoff1,*, Patricia Zárate2, Michael Coyne3, David G. Foley4, 5,
                      Denise Parker1, Boyd N. Lyon6,†, Peter H. Dutton1
     1
      NOAA-National Marine Fisheries Service, Southwest Fisheries Science Center, 8604 La Jolla Shores Dr., La Jolla,
                                                    California 92037, USA
                    2
                     Charles Darwin Research Station, Puerto Ayora, Santa Cruz, Galápagos Islands, Ecuador
                         3
                          SEATURTLE.ORG, 1 Southampton Place, Durham, North Carolina 27705, USA
     4
       Joint Institute for Marine and Atmospheric Research, University of Hawai’i at Manoa, 1000 Pope Road, Honolulu,
                                                      Hawai’i 96822, USA
     5
      NOAA Fisheries, Environmental Research Division, Southwest Fisheries Science Center, 1352 Lighthouse Avenue,
                                          Pacific Grove, California 93950-2097, USA
              6
               Department of Biology, University of Central Florida, PO Box 162368, Orlando, Florida 32816, USA

         ABSTRACT: Post-nesting movements of 12 green turtles from the Galápagos Islands (Ecuador) were
         tracked with satellite telemetry during the 2003 and 2005 nesting seasons. To illuminate potential
         environmental influences on turtle movements we compared tracks with a variety of remotely sensed
         oceanographic variables including sea surface temperature (SST), SST front probability, surface
         height anomaly, surface current, and surface chlorophyll a concentration. Three distinct post-nesting
         migratory strategies were observed, including oceanic migration to Central America (Type A1 move-
         ments, n = 3), residency within the Galápagos (Type A2 movements, n = 2), and movement into oceanic
         waters southwest of the Galápagos (Type B movements, n = 7). Two turtles migrating to Central Amer-
         ica reached neritic foraging areas in Nicaragua and Panama that were 1500 and 1542 km, respectively,
         from their nesting sites, and one resident turtle established a foraging home range 75 km from its final
         nesting site. Oceanic movements occurred in waters with a mean SST of 26.5°C and mean surface
         chlorophyll a concentration of 0.18 mg m– 3, whereas neritic movements were in waters with a mean
         SST of 24.3°C and mean surface chlorophyll a concentration of 0.47 mg m– 3. All turtles accessed SST
         frontal zones at a greater rate than their availability, and at least 2 turtles conducted movements in the
         oceanic zone that were indicative of foraging activity. This is the first report of migratory corridors for
         Galápagos green turtles, confirming prior flipper tagging data that show that the Galápagos is a
         source rookery for green turtles in coastal areas of Central America. The high proportion of green tur-
         tles departing the Galápagos (83%) indicates that marine fisheries bycatch and directed hunting on
         this stock outside the Galápagos may impact this population more than previously believed, and
         underscores the need for multi-national conservation efforts that combat these threats.

         KEY WORDS: Black turtle · Chelonia agassizii · Cheloniidae · Chlorophyll a · Eastern Tropical Pacific
         Ocean · Frontal zones · Migration · Sea surface temperature · Sea surface height anomaly
                              Resale or republication not permitted without written consent of the publisher

*Email: jeffrey.seminoff@noaa.gov                                       © Inter-Research 2007 · www.int-res.com
†
Deceased. Please see Dedication following Acknowledgements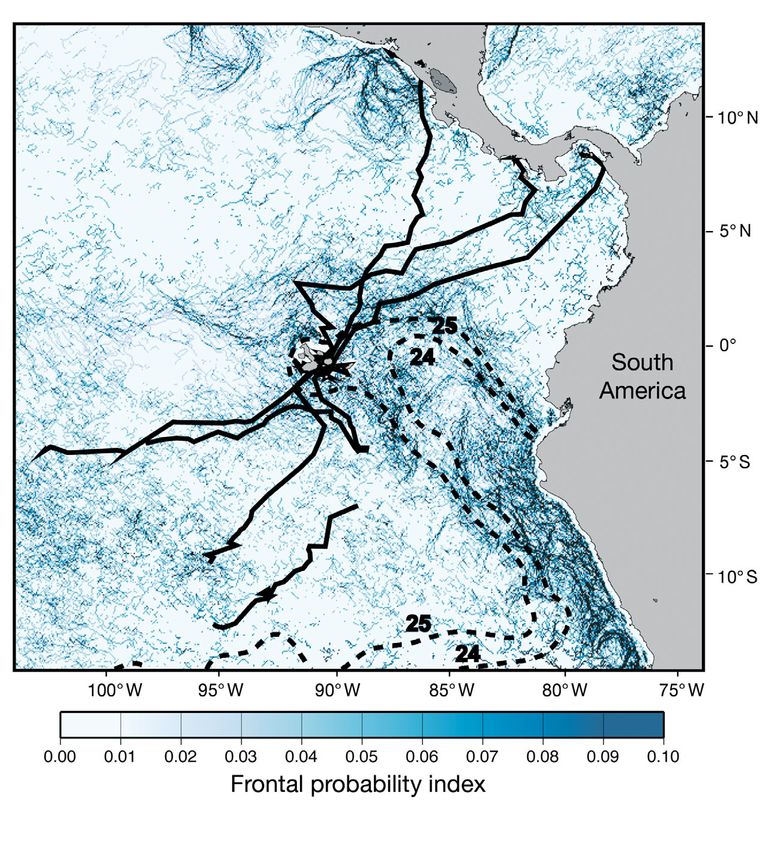
2                                         Endang Species Res 3: preprint, 2007

                   INTRODUCTION                               tures can be highly informative for developing predic-
                                                              tive models of sea turtle habitat use; however, there is
   Green turtles Chelonia mydas are highly migratory          an obvious need for additional data from a variety of
and undertake complex movements through geo-                  marine species and ocean regions to determine the
graphically disparate habitats during their life cycle        efficacy of such modeling efforts.
(Musick & Limpus 1997, Plotkin 2003). The periodic               The Eastern Tropical Pacific Ocean (ETP) is an area
migration of hundreds to thousands of kilometers              with complex topography and substantial spatio-
between breeding and foraging areas by adults is a            temporal variability in oceanographic characteristics
prominent feature of their life history. The long-            (Chavez et al. 1999, Fieldler 2002a). Oceanic waters
distance movements of green turtles were first re-            in this region contain several biological hotspots,
solved with flipper tagging (Carr et al. 1978, Alvarado       including the nutrient-enriched Galápagos plume
& Figueroa 1992) and more recently with genetic               (Palacios 2002), the shoaling thermocline of the Costa
analyses (Bass et al. 2006, Dethmers et al. 2006). The        Rica Dome (Fiedler 2002b), and the Peruvian coastal
use of satellite telemetry has expanded this under-           upwelling region (Strub et al. 1995, 1998). Such meso-
standing, revealing foraging area destinations of             scale features can be important areas of aggregation
migrating post-nesting turtles as well as providing           for a variety of marine organisms (Worm et al. 2005,
information on migratory routes, travel speeds, and           Pennington et al. 2006), but their persistence is dra-
dive behavior (Cheng 2000, Godley et al. 2002, Hays et        matically impacted by the El Niño Southern Oscillation
al. 2002, Craig et al. 2004, Kennett et al. 2004, Troëng      (ENSO). This 3 to 6 yr cycle within the coupled ocean-
et al. 2005, Blumenthal et al. 2006). Further, because        atmosphere system of the tropical Pacific brings in-
satellite telemetry yields spatio-temporal patterns of        creased surface water temperatures and lower primary
turtle distribution, the resultant migratory tracks can       productivity, both of which have profound biological
be integrated with remotely sensed data to elucidate          consequences (Chavez et al. 1999). This variability in
the underlying oceanographic conditions that may              oceanographic conditions coupled with the presence of
influence sea turtle habitat use.                             numerous well-described biological hotspots provides
   Understanding such factors is critical for improving       an ideal opportunity to examine the effects of ocean
management and conservation initiatives for sea tur-          climate on large, tractable marine species. As the ETP
tles. While basic environmental features such as              is a region of high use by sea turtles, this taxon is a
bathymetry, sea surface temperature (SST), and sur-           prime candidate for commencing such studies. Satel-
face currents have been linked to sea turtle move-            lite telemetry studies have described movements of
ments (Morreale et al. 1996, Hays et al. 2001, Luschi et      olive ridley turtles Lepidochelys olivacea and leather-
al. 2003, Pelletier et al. 2003, Etnoyer et al. 2006), the    back turtles Dermochelys coriacea in relation to
mechanisms underlying these relationships are inade-          bathymetry in the area (Plotkin et al. 1995, Morreale et
quately understood. Dynamic mesoscale processes               al. 1996), but so far no studies have examined turtle
such as SST and chlorophyll fronts — areas of interface       movements in relation to other oceanographic condi-
between 2 dissimilar water masses — are known to              tions in the ETP, although Saba et al. (2007) examined
strongly affect water column primary and secondary            leatherback nesting biology relative to oceanography
productivity (Olson et al. 1994, Palacios et al. 2006),       in the region.
and their status as prey aggregation zones suggests              Prominent in this area are the Galápagos Islands
that they too may influence sea turtle movements. For         (hereafter referred to as the Galápagos), a 19-island
example, juvenile loggerhead turtles Caretta caretta in       archipelago located ~1000 km from coastal Ecuador
the North Pacific have been shown to forage in the            (Fig. 1). The Galápagos are among the most important
Kuroshio Extension Bifurcation Region during periods          nesting areas for green turtles in the ETP, and turtles
of high surface chlorophyll (Polovina et al. 2006); when      are afforded protection by the 138 000 km2 Galápagos
waters become vertically stratified and surface chloro-       Biological Reserve of Marine Resources, which regu-
phyll levels decrease, they move farther north to the         lates fishing pressures and provides marine habitat
Transition Zone Chlorophyll Front region — a well-            and nesting beach protection (Heylings et al. 2002).
described biological hotspot and an important oceanic         Flipper tagging programs (Green & Ortiz-Crespo 1982,
foraging destination for a variety of marine taxa (e.g.       Green 1984, Zárate & Dutton 2002) and genetic data
Polovina et al. 2000, 2001). Frontal zones have also          (P. H. Dutton unpubl. data) have shown that green tur-
been described as important foraging zones for large          tles nesting in the Galápagos move to foraging areas
whales (Doniol-Valcroze et al. 2007) and commercially         both within the archipelago and along the continental
targeted species such as tuna and swordfish (Fiedler &        shelf of Central and South America. However,
Bernard 1987, Podesta et al. 1993). Knowledge of the          although Galápagos green turtles evidently cross
spatio-temporal persistence of these mesoscale fea-           oceanic areas to reach mainland coastal habitats,
Seminoff et al.: Post-nesting migrations of Chelonia mydas 3
nothing is known about their migratory corridors, nor which transmissions are turned on/off to maximize
are there data on how these turtles are affected by battery life) were 12/48 for 3 of the PTTs and 24/24
oceanographic conditions. Further, with fewer than 30 for one of the PTTs. For the ST-20 transmitters, duty
long distance (>1000 km) tag returns of the ~14 000 cycles were 24/0 for Days 1 to 45, 12/25 for Days 46
green turtles that have been tagged (Green 1984, to 70, and 6/25 for Day 71 to end of tag life. Battery
Zárate & Dutton 2002), there are sparse data on the rel- life was further prolonged by the presence of a salt-
ative importance of various coastal foraging sites for water-activated switch that prevented transmissions
this nesting stock. during immersion. Transmitters were affixed to the
Knowledge about the oceanic movements and forag- highest point of each turtle’s carapace using fiber-
ing area destinations of Galápagos green turtles can glass cloth and polyester resin (Balazs et al. 1996)
elucidate their susceptibility to human impacts such as after surfaces had been cleansed of grease and
fisheries bycatch and targeted capture and can also debris. Each unit was oriented with the antenna to
illuminate the areas of greatest need for conservation the rear, with a roll of Kevlar® attached anterior to
efforts. In the present study, we use satellite telemetry the antenna to protect its base.
to track the post-nesting movements of green turtles Turtle positions were determined with the Argos
from the Galápagos and compare these movement system, which categorized each location message
paths with a range of remotely sensed oceanic parame- received into one of 6 location classes (LC): 3, 2, 1,
ters. Our goals were to (1) quantify the proportion of 0, A, and B (Appendix 1). Argos assigns accuracy esti-
green turtles that depart the Galápagos after nesting mations of 1000 m for LC 0. No accuracy
foraging area destinations, and (3) determine which, if estimation is provided for LC A or LC B. However,
any, oceanographic features influenced the move- rather than limiting our track construction to the use
ments of green turtles. Besides providing information of LCs with optimal accuracy estimates (i.e. LC 3, 2,
on green turtles per se, our results will also have gen- and 1), we instead used a series of filters that excluded
eral relevance for the understanding of oceanographic biologically unreasonable results for travel speed
influences on other sea turtle species in the ETP. (> 5 km h–1) or indicated turning angles that did not
conform to a directional track line (4 Endang Species Res 3: preprint, 2007
The Argos locations were analyzed using Satellite (delineated by 13° N, 13° S, 102° W, and the coast of
Tracking and Analysis Tool (STAT) (Coyne & Godley Central and South America). The FPI used herein is
2005) and were mapped using MapTool and Generic derived through a combination of gradient threshold
Mapping Tools (Wessel & Smith 1991). The tracks from tests and along-front feature tracking algorithms (e.g.
each turtle were partitioned based on
the relationship between the time since 2000
deployment and distance from release Type A1 Type A2
point (i.e. displacement plot; Blumen-
1500 CM9 CM1
thal et al. 2006; our Fig. 2). The curves
CM10 CM8
of these displacement plots showed
1000 CM12
distinct inflections that corresponded
with changes in travel speed as turtles
Displacement (km)
commenced and/or completed migra- 500
tory movements. Post-nesting migra-
tions were considered to start on the 0
day coinciding with the beginning of a 2000
positive slope lasting > 25 d in the dis- Type B-western Type B-southern
placement curve and, for turtles moving CM2 CM3
1500
to Central America, migration was
CM5 CM4
considered to have been completed on
1000 CM11 CM6
the day that the positive slope reached
asymptote. A migration straightness CM7
index (MSI) was calculated for each 500
turtle’s migratory movements, based on
the ratio of straight line distance 0
between first and last oceanic Argos 0 25 50 75 100 0 25 50 75 100
locations to the total oceanic track Deployment duration (d)
length (Luschi et al. 1998, Godley et al.
Fig. 2. Chelonia mydas. Displacement plots for green turtles tagged in the
2002). We determined mean travel
–1
Galápagos Islands
speed (km d ) in each zone using the
travel speeds of each successive track
segment within the zone separated by Table 1. Satellite data extracted along the track of each turtle. These ocean
≥12 h. Mean ± SE are given unless oth- satellite data products were extracted from the OceanWatch Thematic Real-
time Environmental Distributed Data System (THREDDS). MODIS: Moderate
erwise noted.
Resolution Imaging Spectrometer; GOES: Geostationary Operational Environ-
Satellite data. We compared the mental Spacecraft; POES: Polar-orbiting Operational Environmental Space-
tracks of each turtle with information on craft; AMSR: Advanced Microwave Scanning Radimeter; AVHRR: Advanced
bathymetry, SST, SST front probability, Very-High Resolution Radiometer; GFO: Geosat Follow-On; OSCAR: Ocean
geostrophic surface currents, sea sur- Surface Currents Analyses; SST: Sea surface temperature; FPI: Frontal Proba-
bility Index; SSHa: sea surface height anomaly. When >1 sensor is used, the
face height anomaly (SSHa), and sur-
data format is a blended product. In addition, bathymetric data were collected
face chlorophyll a (chl a) concentration. via the General Bathymetric Chart of the Oceans (GEBCO), a global
Bathymetric values for the region were topographic dataset with one minute (1’) spatial resolution
determined with the General Bathy-
metric Chart of the Oceans (GEBCO; Parameter Spacecraft Environmental Spatial Composite
www.ngdc.noaa.gov/mgg/gebco/; IOC, sensor grid duration (d)
IHO, BODC 2003). SST data were
obtained from 4 sources (Table 1), and Surface chl a Aqua MODIS 0.05° × 0.05° 08
were blended with weighted averages SST Aqua MODIS 0.1° × 0.1° 05
AMSR-E 0.1° × 0.1° 05
based on the nominal errors for each
GOES Imager 0.1° × 0.1° 05
dataset. SST fronts were determined POES AVHRR 0.1° × 0.1° 05
using a Frontal Probability Index (FPI; FPI GOES Imager 0.05° × 0.05° 014
Breaker et al. 2005, Castelao et al. SSHa Jason-1 GFO 0.25° × 0.25° ~10
2005), calculated as the fraction of days Envisat 0.25° × 0.25° ~10
in a given 14 d period for which fronts Ocean currents OSCAR - real time 1.0° × 1.0° 010
are detected within each 0.05° × 0.05° Bathymetry GEBCO 1’ 0–
(~5.5 × 5.5 km) cell in the study areaSeminoff et al.: Post-nesting migrations of Chelonia mydas 5 Canny 1986, Cayula & Cornillon 1995) applied to the Data Access Protocol (OPeNDAP) and analyzed using daily SST data obtained from the Imager (Table 1). The Matlab (Mathworks). advantage of this dataset over other SST data sources is the high frequency of the images (48 d–1), which greatly helps to mitigate the obscuring effects of clouds RESULTS (Castelao et al. 2005). Sea surface current (geostrophic velocity vector) and SSHa data were obtained from the Three distinct post-nesting migratory strategies Centre National d’études Spatiales Aviso/Altimetry were observed, the patterns of which we classify fol- project (www.aviso.oceanobs.com; Ducet et al. 2000). lowing the nomenclature of Godley et al. (2007, this Satellite-derived chl a pigment concentration data Theme Section [TS]). Three turtles conducted oceanic were collected by the Moderate Resolution Imaging migrations to access neritic foraging areas along the Spectrometer (MODIS) and obtained from NASA God- Pacific coast of Central America (hereafter referred to dard Space Flight Center, Ocean Color Project (http:// as Type A1 movements), 2 turtles remained in the oceancolor.gsfc.nasa.gov). See Table 1 for a summary Galápagos (Type A2 movements), and 7 turtles moved of the spacecrafts, environmental sensors, and spatial into oceanic waters southwest of the Galápagos (Type and temporal resolutions for each of the remotely B movements) (Table 2, Figs. 2 & 3). Among turtles sensed oceanographic datasets. conducting Type B movements, there was a tendency Statistical analysis. Argos-derived migration paths for their departures from the Galápagos to be largely were compared to environmental conditions in 3 west- or south-bound (Type B-western and Type B- ways. To determine the water depth along each track southern, respectively; Table 2, Figs. 2 & 3); however, line, satellite tracks were overlaid on bathymetric because we are unaware of the final destinations of charts; locations in waters ≥200 m deep were consid- these turtles, all movements are classified as Type B ered ‘oceanic’, whereas those in water < 200 m were due to their mutual occurrence in oceanic waters. considered neritic. To evaluate turtle movements in There was a significant difference in body size among relation to surface currents and SSHa, we constructed groups (Kruskal-Wallis H = 31.93, p < 0.0001); turtles animations in MapTool of the oceanic movements by engaging in Type A1 movements were the largest, turtles tagged in 2005, with each frame representing while those conducting Type A2 movements were the successive Argos turtle locations overlayed on the smallest. spatio-temporally coincident oceanographic data (see Figs. A1 to A7 in Appendix 2, available as Supple- mentary Material online at www.int-res.com/articles/ Type A1 movements suppl/n003pp11_apps/). We determined the surface chl a concentration, SSHa, SST, and SST frontal prob- The 3 turtles that migrated to neritic habitats of ability at each Argos-derived turtle location and also Central America (Turtles CM9, CM10, and CM12) con- calculated the mean for each oceanographic variable ducted oceanic migrations that lasted from 31.3 to within a box (0.2° longitude × 0.2° latitude × 5 to 10 d) 53.7 d (Table 2). Turtle CM9, the largest tracked turtle centered at the time and position of each satellite (96.5 cm CCL), moved northeast along the Cocos Ridge transmission and taken to represent the available for ~900 km and past the Nocoya Peninsula (Costa habitat adjacent to each turtle location. The overall Rica) en route to a neritic site just south of the Gulf of mean values in neritic and oceanic zones for each Fonseca (Nicaragua). Turtle CM10 moved along a oceanographic variable were compared using 1-way direct route (MSI = 0.95) past Malpelo Island (Colom- analysis of variance (ANOVA). We also used ANOVA bia) and into neritic waters of the Gulf of Panama. to compare FPI at Argos locations in the Galápagos Turtle CM12 traveled over the Cocos Ridge for neritic, oceanic, and mainland neritic zones with the ~1000 km, initially heading northwest away from the mean FPI for each respective zone within the entire Galápagos then turning northeast en route to the ridge study area. A non-parametric Kruskal-Wallis test was extending south of Panama, which it followed into the used to confirm the results of the ANOVA for FPI, as Gulf of Chiriquí (Panama). The mean travel speeds this index occurs in a non-continuous, non-normal of turtles conducting Type A1 movements were signif- data distribution (Hollander & Wolfe 1999). Ocean icantly slower in neritic waters of Central America satellite data products used for ANOVA were (20.6 ± 6.0 km d–1) compared to oceanic waters (46.2 ± extracted from the OceanWatch Thematic Real-time 5.5 km d–1) (t = 9.9, p = 0.03, Table 2). This decrease Environmental Distributed Data System (THREDDS) was particularly evident for Turtles CM9 and CM10, hosted by the Environmental Research Division of the both of which we believe reached their foraging area NOAA Fisheries’ Southwest Fisheries Science Center destinations based on the shorter daily travel distances using the program Open-source Project for a Network at the end of their tracks (Fig. 4).
6                                             Endang Species Res 3: preprint, 2007

Table 2. Post-nesting movement summary. Turtles are grouped according to post-nesting migratory strategy, and movements are
summarized as number of days (d), distance (km), and mean speed (km d–1) in each zone. Migration straightness index (MSI)
                       is provided for oceanic movements. CCL: curved carapace length (cm); (–): no data

 Turtle    CCL        Galápagos neritic                    Oceanic                    Mainland neritic        Overall
           (cm)    Duration Distance Speed      Duration Distance Speed MSI       Duration Distance Speed Duration Distance
                                    (km d–1)                                                       (km d–1)

 Type A1
  CM9      96.5      11.1    192.3    17.3        53.7    1894.2   35.2    0.79       5.3   049.9   09.4       70.2   2136.3
  CM10     93.0      27.2    361.7    13.3        31.0    1630.4   52.6    0.95       7.5   171.9   22.8       65.7   2164.0
  CM12     81.0      45.1    390.0    08.6        37.3    1901.8   50.9    0.70       7.8   233.1   29.7       90.3   2524.9
 Type A2
  CM1      74.7      47.9   1396.10   29.1          –        –         –    –          –      –      –         47.9   1396.1
  CM8      71.6      69.0    691.9    10.3          –        –         –    –          –      –      –         69.0   0691.9
 Type B-western
  CM2     80.5       29.2     70      02.9        30.0    1231.7   41.0    0.95         –     –      –         59.1   1301.7
  CM5     87.2        7.9    143.7    18.1        54.5    1912.1   35.1    0.50        –      –      –         62.5   2055.8
  CM11    83.0        9.1    205.6    22.7        58.5    1534.8   26.2    0.87        –      –      –         67.6   1740.4
 Type B-southern
  CM3      89.0      85.5    501.7    05.9        14.8    0397.4   26.9    0.99        –      –      –      100.30    0899.1
  CM4      86.5       –        –       –          58.5    1662.5   32.4    0.60        –      –      –       58.5     1662.5
  CM6      82.6       –        –       –          33.8    1404.5   44.7    0.75        –      –      –       33.8     1404.5
  CM7a     78.0       –        –       –          40.1    1217.0   30.3      –         –      –      –       62.1     1903.5
 a
  CM7 data based on partial track (Days 23 to 62); no MSI calculated

                    Type A2 movements                              this route after first moving in waters south of the Galá-
                                                                   pagos for the first 49 d of its deployment. At their final
    The 2 turtles remaining in the Galápagos (Turtles              Argos-derived locations, these 3 turtles were at dis-
 CM1 and CM8) were tracked for 49.1 to 69.0 d and vis-             tances of 952 to 1331 km from the Galápagos and still
 ited coastal areas of at least 5 different islands, but did       moving west at travel speeds of 25 to 50 km d–1 (Fig. 4).
 not nest again (Fig. 3). Turtle CM1 moved 1396.1 km               The turtles conducting Type B-southern movements
 after departing the Barahona nesting beach, and trav-             (Turtles CM2, CM4, CM6, and CM7) were last tracked
 eled at a mean speed of 29.1 km d–1 during the track-             at distances of 395 to 1247 km from the Galápagos
 ing period (Table 2). Upon the final Argos transmis-              (Type B-southern in Fig. 3). However, the track for Tur-
 sion, Turtle CM1 was moving along the outer edge of               tle CM3 was too short to provide useful information,
 the Galápagos (water depth > 500 m) at a travel speed             while that of Turtle CM7 (the turtle tracked the farthest
 > 45 km d–1 and had not yet associated with a neritic             south) was missing the initial 23 d of track due to trans-
 foraging habitat. In contrast, Turtle CM8, the smallest           mitter malfunction, thus preventing a full understand-
 turtle tracked (71.6 cm CCL), moved to a neritic forag-           ing of this turtle’s oceanic movements. Nevertheless,
 ing area along the north coast of Floreana Island that            Turtles CM4, CM6, and CM7 were not always moving
 was 75 km from its nesting site on Isabela Island                 away from the Galápagos while tracked and each
 (Fig. 3). The mean travel speed for Turtle CM8 during             maintained their location in the oceanic zone for at
 its 49 d at this foraging area was 7.3 ± 1.2 km d–1, com-         least 2 successive Argos transmissions on one or more
 pared to a mean travel speed of 17.7 ± 2.9 km d–1 dur-            occasions. This is particularly evident for Turtle CM4,
 ing the 19 d prior to its arrival at this site.                   which moved within a confined oceanographic area
                                                                   centered on 8° S, 92° W for 15 d at the end of its track-
                                                                   ing duration (Figs. 2 & 3).
                    Type B movements

   The 7 turtles that departed the Galápagos to the                                   Oceanographic features
 southwest did so within 0 to 85.5 d of tagging and were
 tracked for 14.8 to 58.5 d in oceanic waters (Table 2).             Integrating the oceanic movements of green turtles
 Turtles CM2 and CM11 moved to the west along a con-               with geostrophic surface currents indicates that their
 sistent trajectory (MSI = 0.95 and 0.87, respectively;            movements oriented both with and against prevailing
 Type B-western in Fig. 3). Turtle CM5 also followed               currents. Geostrophic current animations for Type A1
Seminoff et al.: Post-nesting migrations of Chelonia mydas 7
Fig. 3. Chelonia mydas. Satellite-tracked post-nesting movements of green turtles nesting in the Galápagos. Circular labels
correspond to each of the 12 tracked turtles (i.e. 1 = CM1). Contour lines denote 2500 m water depth increments for Type A1
and Type B movements, and 500 m depth increments for Type A2 movements. Maps constructed with MapTool
movements depict the westward-flowing Northern flow along the edge of counter-clockwise rotating
Equatorial Current (NEC) extending from the Galápa- eddies. The initial movements of Turtle CM12 to the
gos to ~4° N, as well as the eastward-flowing Northern northwest were in concordance with the NEC and at
Equatorial Countercurrent (NECC) south of the NEC ~3° N this turtle turned to the northeast and traveled
(see Figs. A1 to A3 in Appendix 2). During the initial largely in the same direction as surface currents, mov-
portions of northbound movements by Turtles CM9 ing along the edges of a series of eddies as it pro-
(Fig. A1, Appendix 2) and CM10 (Fig. A2, Appendix 2), gressed toward the coast of Central America (Fig. A3,
both turtles swam against NECC counter-clockwise Appendix 2). The movements by Turtles CM9, CM10
rotating eddies (CM9 until 8° N and CM10 until 3.8° N) and CM12 to the northwest upon arriving in neritic
and thereafter moved in concordance with northward waters may be reflective of compensatory navigation8 Endang Species Res 3: preprint, 2007
Type A1 Type A2
100 100
CM9 CM1
75 75
50 50
Travel speed (km d–1)
25 25
0 0
Travel speed (km d–1)
100 100
CM10 CM8
75 75
50 50
25 25
0 0
0 20 40 60 80 100
100 Deployment duration (d)
CM12
75
50
Type B-southern
100
25 CM3
75
0
0 20 40 60 80 100 50
Deployment duration (d)
25
0
Type B-western
100 100
CM2 CM4
75 75
50
Travel speed (km d–1)
50
25 25
0 0
Travel speed (km d–1)
100 100
CM10 CM6
75 75
50 50
25 25
0 0
100 100
CM11 CM7
75 75
50 50
25 25
0 0
0 20 40 60 80 100 0 20 40 60 80 100
Deployment duration (d) Deployment duration (d)
Fig. 4. Chelonia mydas. Swim speeds during satellite-tracked movement of green turtles in the Galápagos Islands
after being pushed to the east during migrations. If so, (SEC) for the entirety of their respective tracking
this suggests that the east-bound NECC and its various durations. Turtle CM5 also moved in parallel to the
filaments were the most influential surface currents SEC for the final 13.5 d of its track, after becoming
north of the Galápagos. entrained in east-flowing surface waters and moving
Type B movements were also variably oriented to southeast for the first 21 d after leaving the Galápagos
prevailing surface currents. Turtles CM2 and CM11 (Fig. A5, Appendix 2). At its southernmost location,
(Fig. A4, Appendix 2) swam in concordance with Turtle CM5 meandered for 11 d in a very small area
the westward-flowing Southern Equatorial Current and its travel speed slowed to 34.3 ± 6.0 km d–1 com-Seminoff et al.: Post-nesting migrations of Chelonia mydas 9
pared to 43.5 ± 6.1 km d–1 during earlier
movements and 50.8 ± 6.2 km d–1 during
later movements. The remaining Type B
movements were more variable in rela-
tion to surface currents and there was no
apparent major influence by the SEC or
other surface currents. Instead, Turtles
CM6 and CM7 (Figs. A6 & A7, respec-
tively, Appendix 2) appeared to move
substantial distances against the prevail-
ing currents.
As turtles moved between neritic and
oceanic zones, they encountered sub-
stantially different oceanographic condi-
tions. A comparison of oceanographic
variables in waters adjacent to Argos
locations showed that these oceanic and
neritic areas had significantly different
values for SST, FPI, SSHa (p < 0.0001),
but were not different in terms of surface
chl a concentration, although we note
that this latter relationship was only mar-
ginally insignificant (p = 0.074; Table 3).
Likewise, the Argos-derived turtle loca-
Fig. 5. Comparison of oceanographic variables at each Argos-derived green
tions in neritic and oceanic zones had turtle location. (a,c) Surface chlorophyll a concentrations and (b,d) sea
significantly different values for SST, surface temperature (SST) in the (a,b) oceanic and (c,d) neritic zones
SSHa, and chl a concentration (p < 0.05),
although there was no observed differ-
ence for SST front probability (p = 0.76; Table 3). The respect to the thermal environment, green turtles
significant difference in mean surface chl a concentra- rarely occupied areas with SST ≤24.0°C, and mean
tion at Argos locations in the neritic (0.47 ± 0.22 mg SST along the oceanic portion of the turtles’ move-
m– 3) and oceanic zones (0.18 ± 0.06 mg m– 3) despite the ments was > 2°C warmer than that for their neritic
consistency in mean concentration in available waters movements (Fig. 5b,d). Selectivity for thermal condi-
of the neritic and oceanic zones (0.35 ± 0.007 and tions was also indicated by the propensity of green
0.34 ± 0.001 mg m– 3, respectively) suggests that chl a turtles to access SST frontal zones at rates greater than
concentrations may have influenced turtles differently their availability; i.e. FPI at Argos locations was higher
in these 2 zones (Table 3). In support, the range of than mean FPI in each respective zone (i.e. Galápagos
chl a concentrations experienced by turtles was neritic, oceanic, Central America neritic) within the
much broader in the neritic zone (Fig. 5a,c). With study area (Table 4).
Table 3. Comparisons of oceanographic conditions in neritic and oceanic zones for all Argos-derived turtle locations as well as the
means within a box (0.2° longitude × 0.2° latitude × 5 to 10 d) centered at the time and position of each satellite transmission and
taken to represent the available habitat (i.e. background) adjacent to each turtle location
Oceanographic Data set Neritic Oceanic F-value Significance
variable n Mean SE n Mean SE (p)
Surface chl a Argos locations 146 0.47 0.014 194 0.18 0.013 237 < 0.0001
Background 5.6 × 10⁴ 0.35 0.007 2.7 × 10⁶ 0.339 0.001 3.2 0.074
SST Argos locations 146 24.27 0.146 194 26.51 0.128 133 < 0.0001
Background 1391 24.23 0.07 6.4 × 10⁴ 26.31 0.010 924 < 0.0001
FPI Argos locations 146 0.051 0.0078 194 0.0475 0.0067 0.1 0.7556
Background 2642 0.0453 0.0019 1.1 × 10⁵ 0.0232 0.0003 129 < 0.0001
SSHa Argos locations 146 –0.0077 0.0038 194 0.0051 0.0033 6.47 0.01
Background 784 –0.0319 0.0021 2.4 × 10⁴ –0.009 0.0004 116 < 0.000110 Endang Species Res 3: preprint, 2007
Table 4. SST Frontal Probability Index (FPI) for Argos locations and back- the range of habitat types occupied dur-
ground values for neritic and oceanic habitats in the Eastern Tropical Pacific. ing non-reproductive periods may con-
FPI values were calculated as the fraction of days in a given 14 d period for
tribute to their stability over geologic
which fronts are detected within each 0.05° × 0.05° (~5.5 × 5.5 km) cell in the
study area (delineated by 13° N, 13° S, 102° W, and the coast of Central and time scales by buffering against cata-
South America). All F values denote 95% significance strophic oceanographic events (e.g.
ENSO, red tide) that affect nesting fre-
FPI location Data type N Mean ± SD F p quency and abundance.
The observed variation in post-nest-
All regions Argos locations 199 0.0925 ± 0.007 ing migratory strategy raises intriguing
Background 1.12 × 10⁵ 0.0237 ± 0.0003 questions about the evolution of migra-
Comparison 96.3 < 0.0001
tion in sea turtles. Although little is
Galápagos Argos locations 85 0.087 ± 0.0131
neritic Background 2641 0.0453 ± 0.0023 known about how sea turtles choose
Comparison 69.4 < 0.0001 foraging sites, at least some green tur-
Oceanic Argos locations 101 0.092 ± 0.01 tles are philopatric to specific foraging
Background 1.09 × 10⁵ 0.024 ± 0.003 habitats, returning to the same sites
Comparison 45.3 < 0.0001 after nesting, year after year (Limpus et
Mainland Argos locations 13 0.138 ± 0.011 al. 1992, Godley et al. 2002, Broderick
neritic Background 5400 0.004 ± 0.005
Comparison 123 < 0.0001
et al. 2007). If these are within the same
ocean regions to which the turtles
recruit during hatchling and pelagic
juvenile dispersal, then explaining the
DISCUSSION migration routes and preferred foraging areas would
benefit from focused examination of these dispersal
Migratory strategies mechanisms. Surface currents have been shown to
play an important role in hatchling transport (Carr &
The mosaic of post-nesting migration strategies for Meylan 1980, Bass et al. 2006), and the flow of 4 major
Galápagos green turtles, which included north-bound current systems (i.e. NEC, NECC, SEC, Peru Current)
migration to Central America, residency in the Galápa- near the Galápagos may facilitate long-distance dis-
gos, and dispersal to oceanic waters southwest of the persal in multiple directions. The numerous current
Galápagos, highlights the substantial flexibility in filaments and eddies generated by these convergences
migratory routes and foraging area destinations for this may also result in dispersal over only a very short
nesting population. Variability of migratory strategies distance from the nesting beach.
and foraging habitat affinities within nesting popula- Upon recruitment to a foraging area, our results sug-
tions is an emerging theme among satellite telemetry gest that local conditions can profoundly affect the
studies of sea turtles (see review by Godley et al. 2007). growth and size-at-maturity of sea turtles. It is interest-
For green turtles, such flexibility has previously been ing to note that the 2 resident turtles (Type A2 movement
reported for nesting populations in Japan (Hatase et al. group) were the smallest turtles tracked during this
2006) and the Mediterranean (Godley et al. 2003). study. Although we urge caution due to the small sample
Among other hard-shelled turtles this trait has been size, we suggest that their small body size may be due to
found in olive ridley turtles nesting in northern Aus- the high green turtle density in Galápagos foraging
tralia, which migrate to coastal, continental shelf and habitats and the subsequent poor food availability
continental slope feeding habitats (Whiting et al. (Zárate 2007) from which the effects on growth were
2007). The occupation of diverse foraging habitats perhaps enhanced as a result of foraging area philopatry.
after nesting is perhaps most common in loggerheads, Adverse density-dependent effects on green turtle
as dedicated oceanic and neritic foragers have been growth rate have been reported for green turtles in the
documented among nesting populations in Japan Bahamas (Bjorndal et al. 2000) and the fact that juvenile
(Hatase et al. 2002) and the Cape Verde Islands growth rates in the Galápagos are among the slowest in
(Hawkes et al. 2006). Loggerheads nesting in North green turtles studied to date (≤0.5 cm yr–1; Green 1993)
Carolina, USA, also show foraging area flexibility, with suggests that density-dependent factors may be ongoing
some females accessing temperate northern waters in this region. Phenotypically linked dichotomies in
during summer months and others remaining in more foraging areas, with larger turtles remaining in coastal
southern, warm-water areas for the entirety of their habitats and smaller turtles occupying oceanic foraging
tracking periods (Hawkes et al. 2007). Although the zones, have been reported for loggerheads from the
immense spatial scale of such movements may create Cape Verde Islands (Hawkes et al. 2006) and Japan
challenges for conserving these nesting populations, (Hatase et al. 2002). Consistent with our reasoning, theSeminoff et al.: Post-nesting migrations of Chelonia mydas 11 smaller size of oceanic loggerheads from Japan is ~5° N to ~5° S is driven to the west by the prevailing believed to be the result of poorer food availability easterly trade winds. The maximum speed of the SEC (Hatase et al. 2002). Why smaller turtles would be pre- in this area reaches 25 cm s–1 (Kessler 2006) or 53 to sent in Galápagos neritic versus oceanic waters as 82% of the overall average speeds of Turtles CM2, reported by Hatase et al. (2002) is unresolved. However, CM5, and CM11. The nearly identical west-bound the smaller body size of resident turtles in our study, movements of these turtles may thus reflect surface coupled with the prevalence of Type B movements current-facilitated and bearing-mediated movements (oceanic occupancy), suggests that oceanic foraging may towards known foraging areas outside the ETP. East be more energetically beneficial than neritic foraging for Pacific green turtles (based on mitochondrial DNA Galápagos green turtles. To further examine the ener- data; Kuroyanagi et al. 1999) have been found in the getic consequences of remaining in the Galápagos, it western Pacific, and turtles with western Pacific would be interesting to compare the reproductive mtDNA haplotypes are regularly sighted in the Galá- periodicity of residents and migrants, since the rate of pagos (known locally as yellow turtles; Fritts 1981a, P. nutrient uptake is a major determinant of the interbreed- H. Dutton unpubl. data), indicating that transPacific ing interval (Bjorndal 1985). movement of green turtles occurs in both directions. If Although prior flipper tagging efforts have demon- Turtles CM2, CM5, and CM11 continued along the strated the movement of green turtles from the Galá- west –southwest trajectory, the nearest neritic habitats pagos to the coast of Central America (Green 1984), they would encounter are in French Polynesia, still this is the first study to reveal the specific migratory ~2500 km from where the 3 turtles last transmitted. corridors that are used. The Cocos Ridge and, to a At the rate of travel measured when PTT transmis- lesser extent, the ridge extending south of Panama sions ceased (26.2 to 41.0 km d–1), these turtles would appear to be important features associated with green require an additional 70 to 95 d to reach this destina- turtle movements to Central America (Type A1 move- tion. This ~ 4000 km migration would represent one of ment group). Although we do not know how these the longest post-nesting migrations known for green bathymetric features are detected, they may promote turtles in terms of total distance and duration. oceanographic conditions that are beneficial to migrat- ing turtles. It is interesting that the Cocos Ridge also demarks the primary migratory corridor for leather- Linking satellite tracks with oceanoghraphy back turtles departing nesting beaches in Costa Rica (Morreale et al. 1996). However, it is also possible that Green turtles moving in oceanic zones as well as ner- these ridges do not directly or indirectly influence itic zones in the Galápagos and Central America com- green turtle movements and are instead relevant only monly associated with SST frontal zones. The affinity because of their presence along the most direct routes to these frontal areas is underscored by the fact that between the Galápagos and the preferred foraging the ETP is a region of relatively low frontal activity areas for each turtle. In the absence of surface current (Eden & Timmerman 2004). However, this result influences on open-ocean migration, it is reasonable to should be viewed cautiously since there is a temporal expect a nutrient-depleted post-nesting turtle to access discontinuity between the background FPI calculation its foraging area by the most direct route possible in (averaged over 14 d) and FPI at turtle locations (instan- order to minimize the energetic cost of migration. taneous for 1 d) in any one 0.05° × 0.05° cell. Neverthe- Indeed, the Pacific coastal areas of Central America less, although it is not certain that turtles associated are highly productive and host numerous foraging with fronts per se, they at least maintained affinity to hotspots for green turtles (Cornelius 1982, Amorocho & areas of more frequent front activity. The strategy used Reina 2007). by green turtles to associate with these areas is Whereas green turtles moving to the north were en unclear, although it is unlikely that they were able to route to neritic destinations along the coast of Central detect the fronts at distances of 10s to 100s of km and America, the functions of green turtle movements to actively navigate to them. Instead, we believe that tur- the southwest of the Galápagos are less clear. We tles engaged with frontal zones opportunistically, and acknowledge that some of these turtles may have remained in such areas only if prey resources were eventually returned to the Galápagos neritic, but adequate. Most fronts in this region result from cur- because all were still moving away from the Galápagos rent- or wind-induced upwellings, which increase bio- at the last satellite transmission we believe this is logical productivity (Fiedler 2002a) and may result in unlikely. Based on geostrophic current plots, it is greater food abundance in surface waters for sea tur- apparent that the westbound movements of turtles tles and other higher order consumers. Thus, by departing the Galápagos in 2003 and 2005 were exploiting frontal areas, green turtles may decrease assisted by the SEC, of which the surface layer from prey search times and increase their feeding effi-
12                                          Endang Species Res 3: preprint, 2007

ciency. To further elucidate green turtle use of frontal          swim countercurrent in other areas during this study.
zones, it would be helpful to know more about their               With respect to SST, Godley et al. (2002) reported a
diving profiles during association with these areas to            marked shift in diving behavior by migrating green
determine if their dives are shallower than when occu-            turtles in the Mediterranean when mean sea tempera-
pying waters away from thermal fronts.                            tures dropped below 25°C, further supporting the like-
  Although SST frontal areas may constitute important             lihood that green turtles from the Galápagos avoided
oceanic foraging habitats for green turtles, the absence          the PCUR due to its low surface temperatures. Interest-
of east-bound movements toward the coast of South                 ingly, turtles in the Galápagos neritic appear willing to
America — an area of substantial frontal activity                 experience colder water, perhaps the result of a
(Fig. 6) — suggests that SST fronts may only be impor-            greater thermal tolerance during internesting behav-
tant if the associated temperatures are within an opti-           ior, but also possibly due to smaller-scale movements
mal range. Known as the Peruvian Coastal Upwelling                by turtles in these areas and the correspondingly lesser
Region (PCUR), the waters east of the Galápagos are               opportunity to choose specific water temperatures. It
among the coldest and most productive within the ETP              would be interesting to conduct telemetry studies of
(Pennington et al. 2006). Considering that this area              Galápagos green turtles during periods of elevated
was dominated by waters ≤25°C during the 2005 track-              SST (i.e. ENSO) to determine if turtles are more likely
ing season (Fig. 6), this temperature may represent the           to access waters east of the Galápagos during these
thermal threshold below which migrating green turtles             periods. If so, these warming episodes may provide a
actively avoid surface waters. We acknowledge that                mechanism for green turtles to access foraging habitats
the lack of movements into the PCUR may be an arti-               along the coast of South America.
fact of small sample size or perhaps because accessing               In addition to thermal conditions, sea surface chl a
this area would require swimming against the prevail-             concentration appears to be an oceanographic variable
ing SEC and Peru Current. However, we doubt that                  that influenced green turtle movements. Oceanic
surface currents were a major factor in this lack of east-        migrations occurred in waters with a mean sea surface
ward movements since green turtles were found to                  chl a concentration of 0.18 mg m– 3 and Argos locations
                                                                                   were tightly grouped around the 0.2 mg
                                                                                   m– 3 surface chl a contour. This is consis-
                                                                                   tent with satellite-tracked movements
                                                                                   of loggerhead turtles foraging along the
                                                                                   North Pacific transition zone chloro-
                                                                                   phyll front (TZCF) (Polovina et al. 2001).
                                                                                   The 0.2 mg m– 3 surface chl a contour is
                                                                                   considered a proxy for identifying the
                                                                                   convergence zone between the strati-
                                                                                   fied low surface chl a (< 0.15 mg m– 3)
                                                                                   waters and the high surface chl a
                                                                                   (> 0.3 mg m– 3) vertically mixed waters
                                                                                   (Polovina et al. 2000, 2001). This con-
                                                                                   vergence zone is biologically important
                                                                                   since the intersection of these 2 chloro-
                                                                                   phyll masses often results in the in-
                                                                                   creased abundance of zooplankton and
                                                                                   other buoyant organisms (Olson et al.
                                                                                   1994, Polovina et al. 2000, 2001, Gra-
                                                                                   ham et al. 2001) that constitute impor-
                                                                                   tant food resources for marine preda-
                                                                                   tors. However, it should also be noted
                                                                                   that the attenuation of light underwater
                                                                                   increases exponentially with surface chl
                                                                                   a (Smith & Baker 1978), the result being
                                                                                   that waters with a surface chl a concen-
                                                                                   tration of 0.2 mg m– 3 are relatively clear,
                                                                                   and likely beneficial to visual predators
Fig. 6. Chelonia mydas. Green turtle post-nesting paths (continuous black lines)   such as sea turtles. Thus, the affinity of
in 2005 in relation to frontal zones and SST contour locations (dashed lines)      green turtles to waters with a 0.2 mg
Seminoff et al.: Post-nesting migrations of Chelonia mydas 13
m– 3 surface chl a concentration may
simply indicate their preference for
clear water.
The localized movements of green tur-
tles in areas south of the Galápagos, cou-
pled with their association with prey-
conducive surface chlorophyll levels
and SST fronts, underscores the likeli-
hood that at least some green turtles for-
aged in oceanic waters during tracking
efforts. Oceanic foraging by green tur- Fig. 7. Jurisdictional waters occupied by green turtles during post-nesting
tles has been demonstrated via stable movements tracked with satellite telemetry
isotope analyses by Hatase et al. (2006).
Parker & Balazs (in press) analyzed stomachs of green Rican longline fisheries operating east of the Galápa-
turtles bycaught in oceanic zones of the central Pacific gos. Green turtles are also the second most common
and found a variety of oceanic prey species such as sea sea turtle species bycaught in Peruvian artisanal shark
jellies Pyrosoma sp., commonly found at the surface, longline fisheries (Kelez-Sara et al. 2006) and Colom-
gooseneck barnacles Lepas sp., which adhere to float- bian shrimp trawl fisheries (Amorocho et al. 2005), and
ing objects, and Janthina sp., a gastropod that occurs at have been killed as the result of bycatch in artisanal
the sea surface with the assistance of a gas-filled float, fisheries in Panama (P. Zarate unpubl. data) and Chile
as well as > 20 additional oceanic species. Green turtles (M. Donoso pers. comm.). Together, these threats may
captured in pelagic zones off mainland Ecuador and have substantial negative effects on the Galápagos
Peru have had stomachs filled with fish eggs (Fritts nesting population. A decline in the annual number of
1981b, Hays-Brown & Brown 1982). However, despite nesting females from 2000 to 2006 at the 4 primary
this evidence of oceanic foraging by green turtles, the beaches (Zárate 2007) suggests that the consequences
strategies used to access oceanic prey resources remain of these effects are apparent at the nesting beaches.
poorly understood. To study this behavior we encour- Global conservation efforts have largely focused on
age additional satellite telemetry efforts that employ nesting beaches, representing only a fraction of marine
GPS and dive-profiling technology to reveal the exact turtle life history, but it is now clear that safeguarding
locations of green turtles in relation to oceanographic the migratory corridors and neritic foraging areas is
features as well as depict the actual diving activity and essential. Fortunately, there are several sea turtle con-
surfacing intervals in these areas. servation initiatives ongoing in the ETP that may help
protect sea turtles. Those turtles traveling north from
the Galápagos to areas near Cocos Island (Costa Rica),
Conservation implications Coiba Island (Panama), and Gorgona and Malpelo
Islands (Colombia) are legally protected by the Marine
Green turtles nesting within the Galápagos are pro- Conservation and Sustainable Development Corridor,
tected by the Galápagos Biological Reserve of Marine an initiative of the governments of Costa Rica, Panama,
Resources; however, after nesting, the majority of tur- Colombia, and Ecuador which promotes sustainable
tles swim to distant foraging areas that have less highly management of marine resources within this part of
regulated and largely unmanaged exploitation of sea the ETP. The Eastern Tropical Pacific Seascape Project
turtles (e.g. Chacón 2002). Turtles tracked during the is a complementary effort by non-governmental orga-
present study traveled for substantial periods in inter- nizations which aims to protect a variety of marine ver-
national waters and entered jurisdictional waters of 5 tebrate species within this same area (UNESCO 2006).
Latin American nations (Fig. 7), all of which have been Additional international instruments such as the Inter-
shown to have ongoing human impacts on sea turtles American Tropical Tuna Commission (IATTC) and
in neritic foraging areas (Cornelius 1982, Chacón 2002, Inter-American Convention for the Protection and
Amorocho et al. 2005). Although not visited by green Conservation of Sea Turtles (IAC) are also designed to
turtles during this study, coastal regions in Peru and lessen the effects on sea turtles from fisheries and
mainland Ecuador also have high levels of directed other human impacts. While clearly no single law or
take (de Paz et al. 2002, M. Helvey pers. comm.), fur- treaty can be 100% effective at minimizing anthro-
ther underscoring the widespread nature of green tur- pogenic impacts on sea turtles, these international
tle hunting in the ETP. With regard to bycapture in agreements and laws provide a framework within
fisheries gear, Arauz et al. (2000) describe a catch per which conservation advances can be made. However,
unit effort of 0.85 green turtles per 100 hooks in Costa there is also a need for a broad-based, cohesive sea14 Endang Species Res 3: preprint, 2007
turtle conservation plan that targets all sea turtle spe- the Caribbean and Atlantic: impact of currents and behav-
cies occurring in the ETP. The Permanent Commission ior on dispersal. J Hered 97:346–354
Bjorndal KA (1985) Nutritional ecology of sea turtles. Copeia
of the South Pacific, under the Lima Convention, has
1985:736–751
developed an Action Plan for Sea Turtles in the South- Bjorndal KA, Bolten AB, Chaloupka MY (2000) Green turtle
east Pacific (CPPS 2006), and is perhaps the most rele- somatic growth model: evidence for density dependence.
vant of the international instruments in this region Ecol Appl 10:269–282
since all 5 nations from Panama to Chile are signato- Blumenthal JM, Solomon JL, Bell CD, Austin TJ and others
(2006) Satellite tracking highlights the need for interna-
ries. However, the successful implementation of this tional cooperation in marine turtle management. Endang
plan will require additional data on sea turtle biology Species Res 2:51–61
and fisheries impacts as well as explicit discussion of Breaker LC, Mavor TP, Broenkow WW (2005) Mapping and
the viable solutions to the ongoing problems. Clearly, monitoring large-scale ocean fronts off the California
Coast using imagery from the GOES-10 geostationary
such an effort would benefit from the participation and
satellite. Publ T-056, California Sea Grant College Pro-
input of a diverse group including sea turtle biologists, gram, University of California, San Diego, La Jolla, CA
wildlife managers, economists, fishers, and policy Broderick AC, Coyne MS, Fuller WJ, Glen F, Godley BJ
experts to address the growing challenges. (2007) Fidelity and over-wintering of sea turtles. Proc R
Soc Lond B Biol Sci 274:1533–1538
Canny J (1986) A computational approach to edge-detection.
Acknowledgements. We thank C. Chasiluisa, M. Chica, IEEE Trans Pattern Anal Mach Intell 8:679–698
M. Farias, C. Hasbun, R. LeRoux, and N. de Paz for their assis- Carr A, Meylan AB (1980) Evidence of passive migration of
tance with this project. Logistic and financial support was green turtle hatchlings in Sargassum. Copeia 1980: 366–368
provided by the Charles Darwin Research Station and Carr A, Carr MH, Meylan AB (1978) The ecology and migra-
NOAA-National Marine Fisheries Service. We also thank tions of sea turtles, 7. The west Caribbean green turtle
R. Arauz, G. Balazs, M. Chaloupka, B. Godley, R. Kennett, colony. Bull Am Mus Nat Hist 162:1–46
and Y. Matsuzawa for providing information for this paper. Castelao RM, Barth JA, Mavor TP (2005) Flow-topography
B. Godley, B. Wallace and 4 anonymous reviewers provided interactions in the northern California Current System
valuable comments that helped improve earlier versions of observed from geostationary satellite data. Geophys Res
this manuscript. Research permits were provided by the Galá- Lett 32:L24612
pagos Biological Reserve of Marine Resources. Cayula JF, Cornillon P (1995) Multi-image edge detection for
Dedication. This article is dedicated to our friend and col- SST images. J Atmos Ocean Technol 12:821–829
league Boyd Nathaniel Lyon (1969–2006). Boyd was taken Chacón D (2002) Assessment about the trade of sea turtles
from us much too early, while doing one of the things he loved and their products in the Central American isthmus. Red
most: researching the in-water ecology of green turtles. He Regional para la Conservación de last Tortugas Marinas
was among the best and brightest rising stars and was able to en Centroamérica. San José, Costa Rica
touch the lives of many fellow researchers during his years as Chavez FP, Strutton PG, Friederich GE, Feely RA, Feldman
part of our research community. His passion, attention to GC, Foley DG, McPhaden MJ (1999) Biological and chem-
detail, and robust spirit is an inspiration to all. ical response of the equatorial Pacific Ocean to the
1997–98 El Niño. Science 286:2126–2131
Cheng IJ (2000) Post nesting migrations of green turtles (Che-
LITERATURE CITED lonian mydas) at Wan-An Island, Penghu Archipelago,
Taiwan. Mar Biol 137:747–754
Alvarado J, Figueroa A (1992) Recapturas post-anidatorias de Cornelius SE (1982) Status of sea turtles along the Pacific
hembras de tortuga marina negra (Chelonia agassizi) mar- coast of Middle America. In: Bjorndal KA (ed) Biology and
cadas en Michoacan, Mexico. Biotropica 24:560–566 conservation of sea turtles. Smithsonian Institute Press,
Amorocho DF, Reina RD (2007) Feeding ecology of the East Washington, DC, p 211–219
Pacific green sea turtle Chelonia mydas agassizii at Gorg- Coyne MC, Godley BJ (2005) Satellite Tracking and Analysis
ona National Park, Colombia. Endang Species Res 3:43–51 Tool (STAT): an integrated system for archiving, analyzing
Amorocho D, Barreto L, Zapata L (2005) Disminución del im- and mapping animal tracking data. Mar Ecol Prog Ser 301:
pacto por captura incidental en tortugas marinas con el uso 1–7
de anzuelos curvos.Informe Técnico WWF-Colombia, Cali CPPS (Comisión Permanente del Pacífico Sur) (2006) Plan de
Arauz R, Rodríguez O, Vargas R, Segura A (2000) Incidental Acción para la Protección del Medio Marino y Áreas
capture of sea turtles by Costa Rica’s longline fleet. In: Costeras del Pacífico Sudeste. Comisión Permanente del
Kalb H, Wibbels T (compilers) Proceedings of the 19th Pacífico Sur, Guayaquil, Ecuador
Annual Symposium on Sea Turtle Biology and Conserva- Craig P, Parker D, Brainard R, Rice M, Balazs G (2004)
tion. NOAA Tech Memo NMFS-SEFSC-443, National Migrations of green turtles in the central South Pacific.
Marine Fisheries Service, Miami, FL, p 21–26 Biol Conserv 116:433–438
Balazs GH, Miya RK, Beaver SC (1996) Procedures to attach a de Paz N, Reyes J, Echegaray M (2002) Datos sobre captura,
satellite transmitter to the carapace of an adult green sea comercio y biología de tortugas marinas en el área de
turtle, Chelonia mydas. In: Keinath JA, Barnard DE, Pisco-Paracas. In: Mendo J, Wolf M (eds) Jornada Cientí-
Musick JA, Bell BA (compilers) Proceedings of the 15th fica Reserva Nacional de Paracas. Universidad Nacional
Annual Symposium on Sea Turtle Biology and Conserva- Agraria La Molina, Lima, p 125–129
tion, NOAA Tech Memo, NMFS-SEFSC-387, National Dethmers KEM, Broderick D, Moritz C, FitzSimmons NN and
Marine Fisheries Service, Miami, FL, p 21–26 others (2006) The genetic structure of Australasian green
Bass AL, Epperly SP, Braun-McNeill J (2006) Green turtle turtles (Chelonia mydas): exploring the geographical scale
(Chelonia mydas) foraging and nesting aggregations in of genetic exchange. Mol Ecol 15:3931–3946You can also read