David I. Little, Kay Holtzmann, Erich R. Gundlach, and Yakov Galperin
←
→
Page content transcription
If your browser does not render page correctly, please read the page content below
Sediment Hydrocarbons in Former Mangrove
                                 Areas, Southern Ogoniland, Eastern Niger Delta,                                                14
                                 Nigeria

                                 David I. Little, Kay Holtzmann, Erich R. Gundlach, and Yakov Galperin

   Abstract                                                               procedures, photography and qualitative record-keeping.
   The sediments and former mangrove areas near the town of               SCAT was calibrated using quantitative sediment sampling.
   Bodo in the Niger Delta are highly contaminated in the                 These parallel activities were to investigate the degree of
   upper 20 cm by oil residues. The oil pollution resulting               contamination, to help plan the cleanup, and to compare the
   from two spills of approximately 10,000 t of Bonny Light               situation before and after cleanup.
   crude oil in 2008 from the Trans-Niger Pipeline (TNP)                      Total,    aliphatic    and    aromatic     hydrocarbon
   killed mangroves in more than 1000 ha of local creeks.                 concentrations were determined using Gas Chromatogra-
   The impact of pollution in 2008 was exacerbated from late              phy with Flame Ionization Detector (GC-FID). The results
   2009 by increased transport and artisanal refining of crude             show the highly contaminated status of the sediments near
   oil stolen from tapped pipelines. It has been controversial            Bodo in August 2015. Only one (1) of thirty-two (32) sur-
   which source of impact is the more relevant. Areas still               face sediment samples (0–5 cm) showed a concentration
   contaminated include traditional fishing resources used by              of Total Petroleum Hydrocarbons (TPH in the C5–C44
   local communities. After years of preliminary engagement               hydrocarbon range) below the Nigerian regulatory limit
   to build trust among stakeholders, the Bodo Mediation                  of 5000 mg/kg. Six (6) samples showed concentrations
   Initiative (BMI) was constituted formally in October 2013              between 5000 and 10,000 mg/kg, seven (7) samples
   to conduct cleanup of sediments in the impacted mangrove               ranged between 10,000 and 20,000 mg/kg, fifteen
   areas in an act of community self-management. This was to              (15) between 20,000 and 100,000 mg/kg, and three
   be accomplished with assistance from Shell Petroleum                   (3) were contaminated at levels above 100,000 mg/kg.
   Development Company (SPDC) and mediation by the                        Fifty-five (55) samples were taken at two different depths
   Dutch mission, federal and local government agencies,                  (0–5 cm and 15–20 cm), including the surface dataset.
   with advice from the United Nations Environment                        Although concentrations of TPH, aliphatic and aromatic
   Programme (UNEP). The BMI then planned and undertook                   hydrocarbons in the equivalent C12–C44 range (EC12–
   a preliminary Shoreline Cleanup Assessment Technique                   EC44) were elevated in surface and subsurface samples,
   (SCAT) survey of the residual oil. SCAT is an internation-             thirteen (13) of the subsurface samples had TPH
   ally accepted visual survey method using standardized field             concentrations below the Nigerian regulatory limit of
                                                                          5000 mg/kg. TPH concentrations in three (3) subsurface
                                                                          samples showed concentrations between 5000 and
                                                                          10,000 mg/kg, ten (10) samples ranged between 10,000
                                                                          and 20,000 mg/kg, and six (6) between 20,000 and
                                                                          100,000 mg/kg. The differences between surface and sub-
D. I. Little (*)                                                          surface mean concentrations of TPH, aliphatic and
Swavesey, Cambridge, Cambridgeshire, UK                                   aromatics fraction were each statistically significant
K. Holtzmann                                                              ( p < 0.01). The decreased concentrations from the surface
Berlin, Germany                                                           towards deeper strata within the fine-grained sediments
E. R. Gundlach                                                            were as expected in the absence of significant deposition
E-Tech International Inc, Boulder, CO, USA                                of new sediment above the oil spill layer. For the lower
Y. Galperin                                                               molecular weight fraction of aromatics (EC5–EC12) the
Environmental Geochemistry Consulting, Moorpark, CA, USA                  trends were different. This fraction was detected in fifty-
e-mail: ygalperin@geochemconsulting.com

# Springer International Publishing AG, part of Springer Nature 2018                                                             323
C. Makowski, C. W. Finkl (eds.), Threats to Mangrove Forests, Coastal Research Library 25,
https://doi.org/10.1007/978-3-319-73016-5_14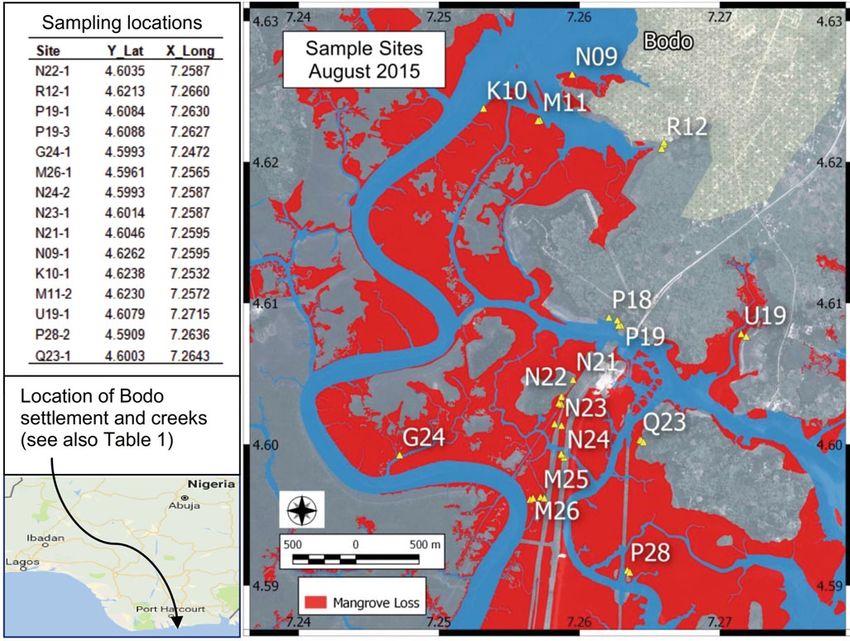
324                                                                                                             D. I. Little et al.

   five (55) samples in much lower concentrations overall,          (NNPC) by RPI (1985), and in 1996 by the Niger Delta
   and with only twenty (20) samples exceeding 1 mg/kg,            Environmental Survey (1997), an industry-funded non-gov-
   and seven (7) exceeding 5 mg/kg of which six (6) were           ernment organisation (NGO). In 2007, UNEP was asked by
   subsurface samples. Also, in the case of lighter aromatics,     the federal government of Nigeria to conduct a detailed
   the mean concentrations increased significantly with depth       survey of oil industry environmental and potential health
   ( p < 0.01) due to their higher volatility and potential for    impacts in Ogoniland (LGAs Gokana, Eleme, Tai and
   penetrating fine-grained sediments compared to the               Khana). The UNEP findings were published (UNEP 2011)
   heavier hydrocarbons.                                           and an overview of conditions on higher land and groundwa-
       The Polycyclic Aromatic Hydrocarbons (PAH)                  ter as well as intertidal mangrove areas is given below:
   concentrations determined by Gas Chromatography-
   Mass Spectrometry (GC-MS) in 55 samples ranged
   widely with no significant difference with depth.
   Although none exceeded the Nigerian regulatory limit of
   40 mg/kg, fifteen (15) samples of which seven (7) were in          Box 14.1. UNEP Environmental Assessment of Ogoniland
   the subsurface, exceeded Environment Canada sediment              – Sediment and groundwater were found to be
   quality guidelines for the sum of sixteen PAHs (ƩPAH16).            contaminated by aliphatic and aromatic
   A forensics evaluation of the available PAH data suggests           hydrocarbons mostly within and adjacent to the
   the following sources of PAHs: petroleum, combustion of             Right-of-Way (RoW) of onshore pipelines. During
   petroleum, and combustion products from wood and                    construction, the foundation bedding of the
   grass. This mixture illustrates inputs from both oil industry       pipelines was composed of loosened and/or made
   and illegal refinery activities, overprinted on a baseline of        ground (usually coarse sandy material). This bed-
   traditional biomass fuels. The SCAT and hydrocarbons                ding forms a hydraulic high compared to the ambi-
   results can be used to design practical cleanup and moni-           ent undisturbed sediment, which has a lower
   toring actions and to assess health risks for people                permeability. Due to this hydraulic gradient the
   ingesting or exposed to oil above an acceptable daily               RoW bed often functions as a trap for spilled oil.
   intake. Recommendations include preparing for the man-            – Regression       modeling,      correlation     and
   grove restoration, addressing possible human health                 non-hierarchical cluster analyses of the analytical
   impacts, better law enforcement, and improving employ-              data revealed that contamination with aromatic
   ment opportunities in Bodo.                                         hydrocarbons was locally still very high in samples
                                                                       taken from both recent and years-old spill sites.
   Keywords                                                            Contamination was influenced by the intensity and
   Bodo · Contaminated sediments · Intervention values · Oil           age of the impact, and by the depth of the ground-
   spill cleanup · PAH isomer fingerprinting · Potential health         water table (Thiergärtner and Holtzmann 2014).
   risk · UNEP environmental assessment                              – UNEP criticised the remediation procedures typi-
                                                                       cally being used in Ogoniland. Remediation is car-
                                                                       ried out mostly by contractors which are not
                                                                       instructed to apply state-of-the-art techniques and
14.1     Introduction                                                  have often not been supervised adequately. One of
                                                                       the most frequent remediation techniques applied by
14.1.1 Background                                                      SPDC in Ogoniland is Remediation by Natural
                                                                       Attenuation (RENA). This is a form of land-
Bodo is a town located in Rivers State, Nigeria with a                 farming, involving the excavation and/or aeration
population total of about 69,000 inhabitants including outly-          of polluted material and the degradation of the
ing settlements (Pegg and Zabbey 2013). The study area is in           hydrocarbons within the sediment under atmo-
south Ogoniland, near Port Harcourt on the Bonny River in              spheric conditions, sometimes enhanced by nutrient
the eastern Niger Delta and bordering the Atlantic Ocean.              fluids (bioremediation). In many cases, RENA has
Bodo is in Gokana Local Government Area (LGA) which has                failed because insufficiently degraded hydrocarbons
a population of 228,828 (2006 census). Figure 14.1 shows the           in backfilled material led to additional contamina-
location of Bodo.                                                      tion hazards for the population (UNEP 2011;
   Environmental reviews and surveys of the Niger Delta                Thiergärtner and Holtzmann 2014).
were carried out in 1983 for SPDC by Baker (1983), in
1983–1985 for the Nigerian National Petroleum Corporation                                                         (continued)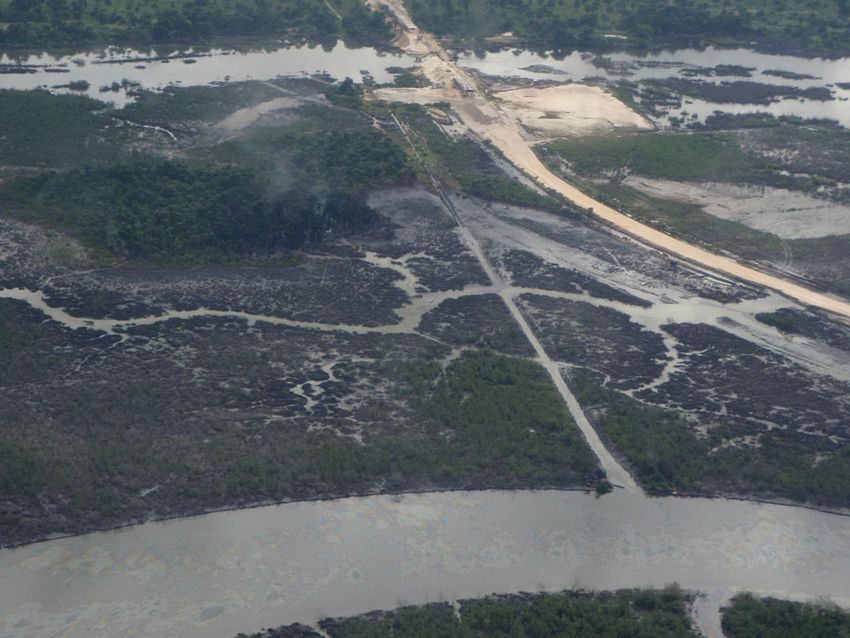
14    Sediment Hydrocarbons in Former Mangrove Areas, Southern Ogoniland, Eastern Niger. . .                                     325

                                                                     the way for the Bodo Mediation Initiative (BMI) during its
     Box 14.1 (continued)                                            intensive survey of Ogoniland, including the Bodo area
     – Groundwater of the upper aquifer was found to be              (UNEP 2011). Implementation of the wider UNEP
       highly contaminated locally. However, a fully rep-            recommendations was announced on 2 June 2016, and on
       resentative analytical screening of the water quality         4 August 2016 the President of Nigeria established a
       in hand dug wells, the main source for potable water          Governing Council and Trust Fund.
       in Ogoniland, was not performed.                                 Major sources of oil contamination in the area include two
     – Although systematic health questionnaires were                operational spills in 2008 prior to the UNEP field work. These
       conducted and sources of health risk were correctly           spills were caused by pipeline corrosion and resulted in man-
       identified, no epidemiological effects of the contam-          grove losses along the TNP crossing Bodo (Gundlach 2013).
       ination on the health of the population were proven.          The mangrove losses in the area of the present chemistry
       This was not achievable mainly because a compre-              sampling are shown in Fig. 14.1 (Gundlach 2017 this volume).
       hensive physical and medical examination of the               From 2012, the Embassy of The Netherlands in Abuja in
       local population was not included in the survey.              conjunction with leading NGOs began the BMI to facilitate
     – Analytical investigation of the tissue of fish and             cleanup and restoration of sediments in former mangroves near
       shellfish from local markets showed that hydrocar-             Bodo instead of waiting for an unpredictable outcome from a
       bon concentrations were compliant with current                legal process in a United Kingdom court. Supported by the
       environmental quality standards and generally                 Nigerian and Dutch governments, in October 2013 the BMI
       lower than 1983 levels in samples collected in the            started the formal process for planning and implementation of
       field (Baker 1983). In contrast, the most                      cleanup. An out-of-court settlement was reached in December
       contaminated fishing areas in 2010 were being                  2014 between the Bodo community and SPDC that led to
       avoided by fishermen.                                          payment of compensation for the entire affected area of the
     – Plants and agricultural products were not analysed            creek, including 1000 ha of mangroves. A remediation project
       chemically. However, plants showed symptoms of                team was established by the BMI with local, national and
       stress, for instance degraded growth, which might             international experts, regulators, church leaders, NGOs and a
       be ascribed to contaminated sediment and soils                UNEP observer, together with employees of SPDC. A primary
       close to the roots.                                           objective of remediation is to reduce sediment contamination
     – UNEP recommended the establishment of an Envi-                to a level that facilitates recovery of the mangrove habitat and
       ronmental Restoration Fund for Ogoniland, with                local livelihoods, either naturally or by transplanting mangrove
       estimated costs for the first 5 years of 1 billion US          seedlings cultivated in nurseries.
       $. This included implementation of: emergency                    The project area in the Niger Delta consists of intertidal
       measures (e.g., alternative drinking water sources            sediments dominated by silts and clays, and bisected by tidal
       for those communities with a contaminated water               channels mostly accessible only by boat (Figs. 14.2, 14.3 and
       supply); clean-up of contaminated land and inter-             14.4). To prepare for the cleanup, the BMI decided to inves-
       tidal sediments; mangrove transplants and restora-            tigate the difficult ground conditions using a visual survey
       tion; and accompanying monitoring measures.                   methodology, consistent with the internationally-accepted
                                                                     Shoreline Cleanup Assessment Technique (SCAT; Owens
                                                                     and Sergy 1994; Owens and Sergy 2003). The BMI has
                                                                     successfully brought together the stakeholders and in 2015
   The studies described above were not baseline surveys             conducted preliminary surveys using a multi-disciplinary
designed to show before-after and control-impact (BACI)              SCAT approach. It also engaged international cleanup
effects, because oil had already been discovered in 1956 at          contractors supported by experienced national companies.
Oloibiri-1, and the TNP from Bomu to Bonny was                       Despite all field operations being stopped by violent agitation
constructed in 1965. Soon after, oil was a central cause of          in October 2015, the BMI has maintained the technical and
the disastrous Biafran war, and oil pollution and social             logistical capability to plan and implement the cleanup and
problems were among its legacies. Eighty-nine (89) produc-           restoration of the degraded Bodo mangrove ecosystem.
ing oil wells were completed in Ogoniland by 1993 when               SCAT fieldwork resumed in September 2017.
SPDC production was halted by civil unrest. There have been             The BMI decided to verify and calibrate the SCAT
many false starts to the cleanup of oil spills in the Niger          findings by commissioning analyses of samples for
Delta, in particular in Ogoniland due to a history of protest        hydrocarbons in sediments taken from the areas of affected
against SPDC. Nevertheless, UNEP successfully prepared               mangroves near Bodo. The aim of this contribution is to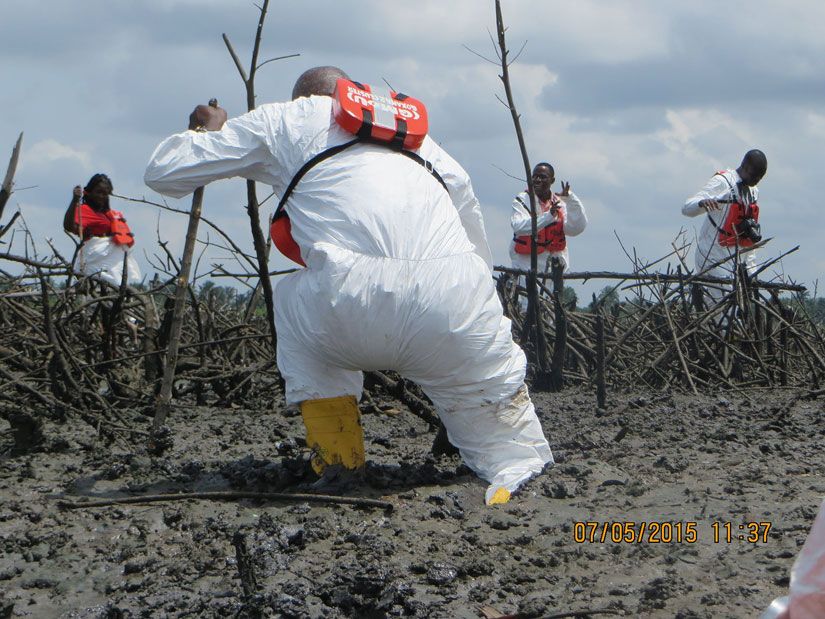
326                                                                                                      D. I. Little et al.

Fig. 14.1 August 2015 sampling sites near Bodo; mangrove loss defined by Gundlach (this volume)

Fig. 14.2 Typical views of oil-killed mangroves in the Bodo study area, 1 May 2015 (Credit: D. Little)
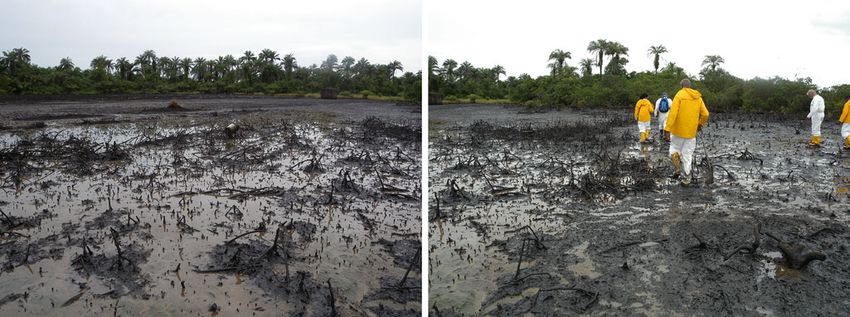
14   Sediment Hydrocarbons in Former Mangrove Areas, Southern Ogoniland, Eastern Niger. . .                                               327

Fig. 14.3 Difficult working area on fine-grained and low shear-strength mudflats among dead mangroves, 7 May 2015 (Credit: M. Bonte)

Fig. 14.4 Oiled mangroves indicate tidal range; Nipa palms Nypa fruticans (Asian invasive species) and terrestrial vegetation visible (Credit:
D. Little)
328                                                                                                                D. I. Little et al.

present and discuss the analytical results of the first sampling    creek confluences towards the Bonny River in the south. In
campaign in August 2015.                                           1983, the invasive Nipa palm Nypa fruticans was observed
                                                                   mainly in the Forcados area, and only at one of a total of
                                                                   twenty-seven (27) sites in the Bodo area, where it is now
14.1.2 Natural Environment Baseline                                more common. Since 1983 these and other ecologically
                                                                   important aspects of the Bodo area have been subject to
In January–February 1983 an environmental study of five             habitat scale and cascading impacts intensifying after 2008
SPDC-operated areas in the Niger Delta was conducted by            (Figs. 14.1, 14.2, 14.3 and 14.4). The mangroves formerly
Baker (1983). This included the area of the present chemistry      provided a firm substrate and shelter for a rich community of
sampling on the intertidal mudflats near Bodo. The sediments        invertebrates such as the oyster Crassostrea gasar, the fiddler
were described as consisting of accretional poorly-sorted          crab Uca tangeri and other crabs at 86–90% of sites. Addi-
medium to very fine silts (59–99%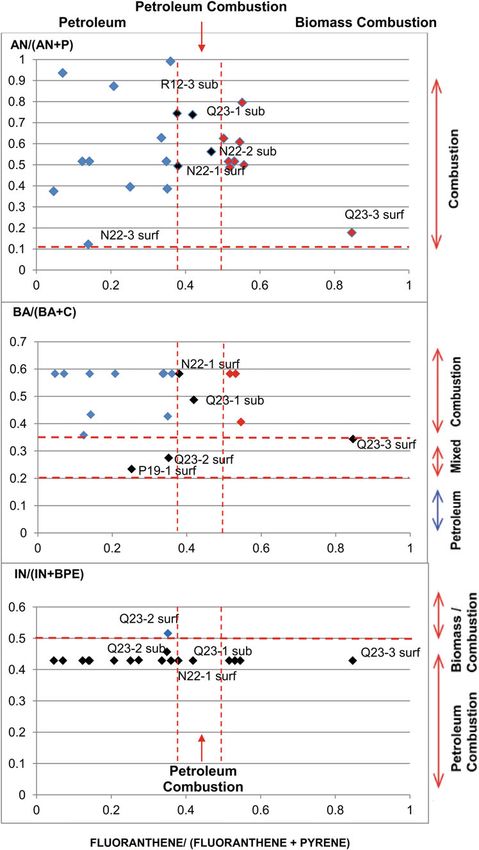
14   Sediment Hydrocarbons in Former Mangrove Areas, Southern Ogoniland, Eastern Niger. . .                                    329

obtained using different methods to the 1983 and 2010 data           Summary Form’, and transferred onto maps. In total, fifty-
that better represent the baseline conditions for comparison         two (52) SCAT sites were surveyed in twenty-nine (29) grid
with the August 2015 survey, albeit at a different set of            cells during 2015.
sampling sites (see Discussion).

                                                                     14.2.2 Chemistry Sampling and Analyses
14.2     Methodology
                                                                     The BMI determined that sampling and chemical analysis
14.2.1 Shoreline Cleanup Assessment                                  should not be carried out for each SCAT location surveyed.
       Technique (SCAT)                                              Instead, samples were collected from a selection of sixteen
                                                                     (16) grid cells to establish representative pre- and post-
The methodology for the May–August 2015 survey cam-                  remediation hydrocarbon concentrations. The BMI advised
paign was based on two multi-discipline SCAT surveys and             the project team to conduct the sampling of the designated
an analytical chemistry investigation in parallel with SCAT.         1000 ha remediation area in order to calibrate and verify the
Initially used in 1988 in the ‘Nestucca’ spill and developed         SCAT data, using multiple samples taken within the same
fully during the 1989 ‘Exxon Valdez’ spill, SCAT is now an           grid pattern as used in the SCAT surveys. Another primary
accepted, codified and internationally established survey             rationale for the chemistry survey was to assess the hydrocar-
methodology (Owens and Sergy 1994; Owens and Sergy                   bon concentration in the sediment below which mangroves
2003). Areas contaminated by oil spills are investigated by          can survive, regenerate or recolonize.
multi-disciplinary teams visually assessing factors such as              The ‘Bodo Creek Chemical Sampling and Analysis Proto-
colour, form and degree of oiling, depths of sediment pene-          col’ was prepared by a Shell employee with input and support
tration, and obvious biological impacts, but without neces-          from a technical sub-group drawn from the BMI (Bonte
sarily taking numerous sediment samples for analyses. SCAT           2015). The aim of this exercise was to organize the operations
surveys provide a characterization of the severity of oil con-       according to international best practices and to be consistent
tamination and build consensus on a recommended cleanup              with SPDC’s ‘Oil Spill Response and Remediation Manage-
methodology. In this case, the SCAT surveys utilized a               ment System’ (SPDC 2013). The samples were collected by a
200  200 m grid pattern. The sediment sampling followed             Nigerian company (Geoterrain Nigeria Limited) according to
this plan in order to link the analytical chemistry results to the   a plan agreed by the BMI. Figure 14.1 and Table 14.1 show
field oiling conditions, character and severity, and to justify       the sample site coordinates and dates, arranged primarily
the proposed cleanup strategy. Before and after cleanup              along the TNP. The total number of samples was 57, with
SCAT surveys will be the primary line of evidence to docu-           less data being reported for some parameters due to ‘non-
ment project success. It was proposed to select a number of          detect’ values in the laboratory. Samples were sent under
sites representing the variability in severity of contamination      chain-of-custody to ALcontrol an ISO 17025 accredited lab-
(e.g., ‘heavily oiled’ sites to ‘rainbow sheen only’).               oratory in the United Kingdom. Key analytical parameters
    In May 2015, a preliminary (‘pre-SCAT’) campaign was             included:
conducted during 1 week in the Bodo area to plan the main
campaign for August 2015 (Gundlach 2015a). SCAT was                  – Methyl tert-Butyl Ether (MTBE), Benzene, Toluene, Eth-
chosen to prepare the cleanup contractors for the field                 ylbenzene, Xylenes (BTEX);
conditions in the project area and to enable them to apply           – Low molecular weight aromatics fraction (C5–C12);
the appropriate remediation technologies for different site          – Total Aliphatics (C12–C44) and aliphatics within specified
conditions. It was thus the first attempt to develop a broad            carbon number ranges;
cleanup plan, including the segmentation and prioritisation of       – Total Aromatics (EC12–EC44) and aromatics within equiv-
the affected area. SCAT also should enable the contractors to          alent carbon number ranges;
apply the optimal safety and precautionary measures for the          – Total Petroleum Hydrocarbons (TPH C5–C44); and
work force, including personal protective equipment (PPE).           – Polycyclic Aromatic Hydrocarbons (PAH) as individual
    The aims of the survey undertaken in August 2015 “were             and total concentrations of the 16 parent PAHs from the
to (a) define areas that can be cleaned during the first phase of        US Environmental Protection Agency (USEPA) Priority
cleanup, (b) provide an overview of different habitats and             Pollutant     List    (Naphthalene,      Acenaphthylene,
levels of oiling, and (c) continue SCAT field training of               Acenaphthene, Fluorene, Phenanthrene, Anthracene,
participants” (Gundlach 2015b). The data collected in both             Fluoranthene, Pyrene, Benz(a)anthracene, Chrysene,
surveys were noted in the field on the ‘Shoreline Oiling                Benzo(b)fluoranthene, Benzo(k)fluoranthene, Benzo(a)
330 D. I. Little et al.
Table 14.1 Surface (0–5 cm) sediment sampling locations, dates, contaminants (mg/kg) and SCAT data
Grid Coordinates Date Laboratory data SCAT fieldwork data
Site Lat Long 2015 TPH ΣPAH16 Surface Subsurface Sediment type
N22-1 4.6035 7.2587 13/08 60,000 16.7 TB BO, PFP Chikoko mud
N22-2 4.6034 7.2587 13/08 99,500 16.7 TB BO, PFP Chikoko mud
N22-3 4.6029 7.2587 13/08 24,400 1.6 AP, FR BO, PFP Chikoko mud
N22-4 4.6029 7.2585 13/08 25,500 5.7 NO BO, PFP Chikoko mud
R12-1 4.6213 7.2660 14/08 7700 1.0 SS SS, PFP Mud + algal mat
R12-2 4.6210 7.2659 14/08 27,700 0.8 BO BO, PFP Soft mud over chikoko
R12-3 4.6214 7.2660 14/08 81,100 12.6 BO BO, PFP Soft mud + algal mat
P19-1 4.6084 7.2630 17/08 54,900 10.0 AP BO, SS, PFP Chikoko mud
P19-2 4.6084 7.2628 17/08 6410 1.0 TB BO, PFP Mud + dead organics
P19-3 4.6088 7.2627 17/08 75,000 9.0 BO BRO, PFP Mud mixed with leaves
P18-2 4.6089 7.2621 17/08 88,500 24.2 BO BO, PFP Chikoko mud + algal mat
G24-1 4.5993 7.2472 18/08 26,700 n/d NO BO, SS, PFP Chikoko mud
M26-1 4.5961 7.2565 18/08 7110 n/d NO BO, SS, PFP Chikoko mud
M26-2 4.5962 7.2567 18/08 17,700 0.6 NO BO, SS, PFP Chikoko mud
M25-3 4.5963 7.2572 18/08 16,400 4.6 NO BO, SS, PFP Chikoko mud
M26-4 4.5962 7.2575 18/08 15,000 5.7 NO BO, OP Chikoko mud
N24-2 4.5993 7.2587 20/08 111,000 19.9 TB BO, OP Mud + algal mat
N24-3 4.5993 7.2587 20/08 17,200 0.9 NO BO, PFP Chikoko mud + algal mat
N23-1 4.6014 7.2587 20/08 9570 0.2 SS BRO, PFP Silty sand, chikoko, algal mat
N23-2 4.6015 7.2582 20/08 66,600 n/d TB, SS BRO, OP Chikoko mud + algal mat
N21-1 4.6046 7.2595 20/08 8720 7.0 FR BO, OP Sand + roots
N09-1 4.6262 7.2595 21/08 135,000 1.2 SS BO, OP Chikoko mud + algal mat
K10-1 4.6238 7.2532 21/08 22,500 0.6 SS BO, PFP Chikoko mud + algal mat
M11-1 4.6290 7.2571 21/08 117,000 0.6 TB, AP BO, PFP Clay
M11-2 4.6230 7.2572 21/08 96,400 19.8 NO BO, BRO, PFP Chikoko mud + algal mat
U19-1 4.6079 7.2715 25/08 12,800 0.6 SS SS, PFP Chikoko
U19-2 4.6077 7.2719 25/08 3650 n/d NO BO, PFP Chikoko mud + algal mat
P28-1 4.5911 7.2634 25/08 80,700 1.2 AP BO, OP Clay + Chikoko + asphalt
P28-2 4.5909 7.2636 25/08 6130 0.6 NO BO, SS, PFP Chikoko mud + algal mat
Q23-1 4.6003 7.2643 25/08 16,300 1.3 SS BRO, OP Sand + chikoko
Q23-2 4.6003 7.2644 25/08 25,800 3.3 TB BO, PFP Sand, chikoko, asphalt, algal mat
Q23-3 4.6002 7.2646 25/08 12,600 3.8 FR BO, OP Brown silty sand
SCAT oiling codes: TB tar or tarballs, AP asphalt pavement, FR fresh oil, OP oil-filled pores, PFP partially-filled pores, BO black oil, BRO brown
oil, SS silver/rainbow sheen, NO no oil, Chikoko mangrove peat, n/d not detected; sampling site grid locations corrected to those plotted by SPDC
Geomatics Department
pyrene, Indeno(1,2,3-cd)pyrene, Dibenzo(a,h)anthracene, modified). The volatile petroleum hydrocarbons (C5–C12
and Benzo(g,h,i)perylene). gasoline range) and BTEX were analyzed using static head
space extraction (EPA Methods 8020 and 8260 modified). In
addition, the laboratory reported TPH results in the risk-
The above scope was specified by the technical sub-group based specified carbon number ranges for aliphatic and aro-
convened by BMI. The selected laboratory had been used by matic hydrocarbons (TPHCWG 1997). Quality assurance/
UNEP in 2010 for TPH determinations. Their methods were quality control (QA/QC) was in terms of percentage recovery
also comparable to those used by Baker (1983): pooling of of compounds from analytical QC samples run with the field
five (5) composite surficial samples, storage at 20 C, samples: surrogate recoveries were between 81% and 111%
solvent extraction, separation, and analysis by GC-FID. and generally well inside the statistical lower and upper
Petroleum hydrocarbons were extracted using a microwave- control limits.
assisted solvent extraction method (EPA 3546). The analysis The laboratory work also included some analytes typically
of extractable total petroleum hydrocarbons (TPH, in the C5– used in petroleum fingerprinting studies. However, it was
C44 range) was using GC-FID (EPA Method 8015 modified) assumed that most of the pollution detected would be
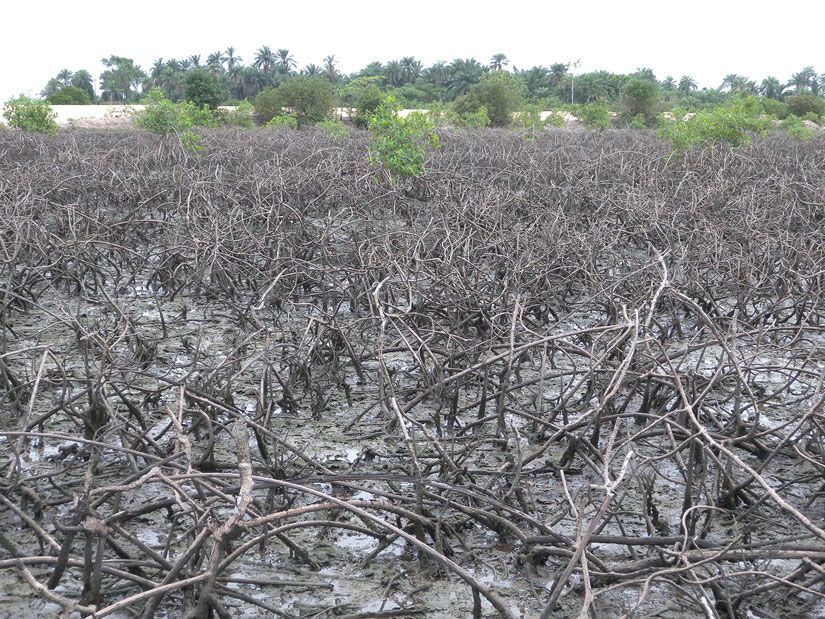
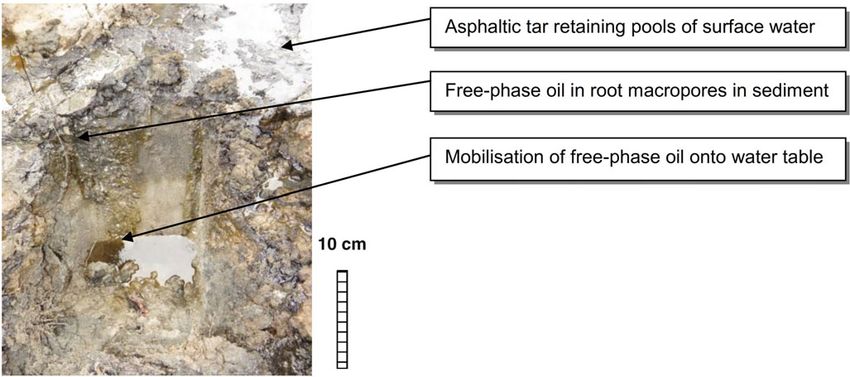
and PAH was analyzed using GC-MS (EPA Method 8270 Bonny Light crude oil, and so standard USEPA-type14 Sediment Hydrocarbons in Former Mangrove Areas, Southern Ogoniland, Eastern Niger. . . 331 procedures were followed, rather than specialised hydrocar- recently in Owaza, Niger Delta by Faboya et al. (2016). bon fingerprinting methodology (Stout and Wang 2016). The This would provide fingerprinting tools even for samples data obtained did not allow for a detailed environmental where most n-alkanes are biodegraded. forensics level of interpretation. For example, chro- matographic resolution by carbon range numbers did not identify individual alkane peaks, preventing reliable evalua- 14.3 Results tion of the petroleum type(s) in the samples analysed. In addition, since the gas chromatograms were presented in a 14.3.1 Summary of SCAT Survey Results format normalised to the highest peak, the chromatograms were often too small scale to be useful for fingerprinting by During the pre-SCAT survey in May 2015 teams visited visual comparison. In some cases the only identifiable peaks seventeen (17) impacted sites, documenting the variability were the added internal standards, and contaminant peaks of surface and subsurface oil occurrence and behaviour characteristic of the sample were hard to discern. (Fig. 14.5). Observations included: “dead mangrove plants, The individual PAH concentrations in some of the hydrocarbon impacted sediments to varying degrees from oil samples were below the laboratory detection limits, and sheen to weathered crude in form of asphaltic tar, burnt eleven (11) total PAH values were below the detection limits. carbonized residue and free-phase oil, and evidence of regen- In addition, the PAH analytes did not include alkylated eration of dead mangrove vegetation where re-oiling has homologues. This selection was based on the correct assump- been minimised” (Gundlach 2015a). tion that, apart from the alkylated naphthalene and The August SCAT survey provided an inventory of dibenzothiophene, these compounds are present at very low phenotypes of contaminated mangroves in the area: “The levels in the non-weathered crude oil. However, illegal very large extent of oiling and required cleanup was again refineries exist in many parts of the Niger Delta, including noted by survey participants. All sites surveyed during 87 sites in Bodo West and 60 in Bodo East (Gundlach this August 2015 need some level of cleanup, particularly related volume). When the light ends of crude oil are distilled off to reducing the level of oiling in soft muddy sediment” then the residual materials contain elevated levels of (Gundlach 2015b). SCAT observations of oiling and sedi- alkylated homologues. Without the alkylated homologues, ment types in August 2015 are given in Table 14.1 for those only parent high molecular weight PAHs are reported, sites sampled in parallel for chemistry (Fig. 14.1). Addition- which limits the fingerprinting value of the analytical data. ally, mangrove loss was observed in each of the thirteen In future, high resolution GC-FID chromatograms and (13) scat grid cells that were not yet sampled. All but two GC-MS outputs with selected ion chromatograms of repre- of these were within the designated 1000 ha remediation area. sentative samples should be included, as has been done Fig. 14.5 SCAT pit showing surface asphaltic tar, mobilisation of free-phase oil into sediment macropores and onto the water table (Credit: M. Bonte)
332                                                                                                                   D. I. Little et al.

Full results of the SCAT surveys carried out by the BMI in            17,015 mg/kg; EC5–EC12 aromatics fraction 3.26 mg/kg;
2015 are given by Gundlach (2017).                                    and PAH16 6.11 mg/kg (n ¼ 28, except TPH n ¼ 32, and
                                                                      PAH n ¼ 27).
                                                                    – In the subsurface 15–20 cm the mean concentrations
14.3.2 Chemistry Results                                              were: TPH 14,601 mg/kg; Aliphatics 7702 mg/kg;
                                                                      Aromatics 4288 mg/kg; EC5–EC12 aromatics fraction
14.3.2.1 Surface Samples                                              9.28 mg/kg; and PAH16 5.09 mg/kg (n ¼ 27, except
Site locations sampled from 13 to 25 August 2015 are shown            TPH n ¼ 32, and PAH n ¼ 23).
in Fig. 14.1 and analytical results are given in Table 14.1         – In both depth strata combined the mean concentrations
along with field information from SCAT.                                were: TPH 28,904 mg/kg; Aliphatics 16,531 mg/kg;
   Thirty two (32) sediment samples were taken from fifteen            Aromatics 10,767 mg/kg; EC5–EC12 aromatics fraction
(15) grid locations at a depth interval of 0–5 cm. At these sites     6.16 mg/kg; and PAH16 5.65 mg/kg (n ¼ 55, except
only one (1) of the 32 surface sediment samples showed a TPH          TPH n ¼ 64, and PAH n ¼ 50).
(C5–C44 range) concentration below the Nigerian regulatory
limit value of 5000 mg/kg (see Discussion). Six (6) samples             The TPH concentrations in the sediments of the Bodo area
had concentrations between 5000 and 10,000 mg/kg; seven             ranged over almost three (3) orders of magnitude; from
(7) samples ranged between 10,000 and 20,000 mg/kg; fifteen          163 mg/kg at R12 (subsurface sample) to 135,000 mg/kg at
(15) between 20,000 and 100,000 mg/kg; and three (3) samples        N09 (surface sample). Although the low end of the present
exceeded 100,000 mg/kg (Table 14.1).                                range in TPH concentrations is similar to the background
   There was general agreement between visual SCAT                  concentrations found in 1983 and slightly less than in 2010,
observations and chemistry data. However, due to oil                the high end of the range in oil content (13.5% of the sedi-
weathering and the presence of algal mats, the sediment             ment mass) is not an outlier, and indeed only one surface
surface often appeared cleaner than when pits were dug to           sample was below the regulatory limit of 5000 mg/kg. This
reveal fresh oil in the subsurface (e.g., especially all sites in   emphasizes the severity and persistence of the 2008 Bodo
grid cell M26, but also N22-4, G24 and P28-2). Table 14.1           pipeline oil spills, and the subsequent spills due to other
shows that in the subsurface 15–20 cm layer, of thirty              illegal activity.
(30) observations that were made of ‘black oil’ or ‘brown
oil’ (SCAT oiling codes BO and BRO), twenty-four (24) of            14.3.2.3 Further Data Evaluation
them corresponded with TPH concentrations >10,000 mg/               With such a wide range of data, it is difficult to express
kg in the surface layer. This fully confirmed the SCAT               meaningful measures of central tendency, such as arithmetic
finding of severe oiling.                                            means. Under these circumstances, to make valid comparisons
                                                                    between the surface and subsurface layers, samples need to be
14.3.2.2 Surface and Subsurface                                     compared at the same locations and the variability of the TPH
            Samples Compared                                        data needs further evaluation. The ratio of the standard devia-
Because TPH (as well as aliphatic, aromatic fractions and           tion (SD) to the mean of samples in each depth layer at each
PAH) concentrations were also high in the deeper sampling           site was calculated (where n ¼ 2 or more, noting that sites P18,
interval, at thirteen (13) grid locations 55 samples were taken     G24, K10, N09 and N21 had only one sample per depth).
in two different depths (0–5 cm and 15–20 cm). These data               When expressed as a percentage, each of these ratios
from surface and subsurface are given in Tables 14.2 and            represents a dimensionless coefficient of variation
14.3 respectively. Data for TPH and the sum of PAH16                (CV) where CV ¼ SD  100/mean. For surface 0–5 cm
correspond with the above surface dataset (Table 14.1), but         samples the CV ranged from 13.7% (M11) to 122% (P28)
for N23 and N24 data were not available for aromatic and            and the mean was 67%. In the subsurface 15–20 cm samples
aliphatic fractions.                                                the CV ranged from 20% (U19) to 132% (N23), with a
   Of the subsurface total of 32 samples, thirteen (13) samples     similar mean of 58%. The overall similarity of the CVs in
had TPH concentrations below the regulatory limit of                terms of depth in the sediment was encouraging, but the size
5000 mg/kg. TPH concentrations in three (3) subsurface              and range of CVs underlined the intense patchiness of oil
samples were between 5000 and 10,000 mg/kg, ten                     distribution in the mangrove sediments of the Bodo area.
(10) samples were between 10,000 and 20,000 mg/kg, and              Although reduced by taking composite samples, this patchi-
six (6) between 20,000 and 100,000 mg/kg (Table 14.3). In           ness is normal in coastal sedimentary systems, due to the
summary:                                                            unpredictable oil distribution at the time of the spill and
                                                                    subsequently to variable oil penetration down macropores
– In the surface 0–5 cm the mean concentrations were:
  TPH 43,208 mg/kg; Aliphatics 25,045 mg/kg; Aromatics
14 Sediment Hydrocarbons in Former Mangrove Areas, Southern Ogoniland, Eastern Niger. . . 333
Table 14.2 TPH, Aliphatics (C12–C44), Aromatics (EC12–EC44), Aromatics (EC5–EC12) fraction and SPAH16 data for surface (0–5 cm) sediment
samples taken from 15 grids in August 2015
mg/kg μg/kg
Surface sample TPH Aliphatics Aromatics Aromatics EC5–EC12 ΣPAH16
N22-1 60,000 35,400 24,600 0.14 16,700
N22-2 99,500 68,900 30,600 0.18 16,700
N22-3 24,400 12,500 11,900 0.59 1570
N22-4 25,500 17,000 8460 0.27 5660
R12-1 7770 4310 3460 0.62 1030
R12-2 27,700 16,000 11,700 1.68 794
R12-3 88,100 70,100 18,100 1.86 12,600
P19-1 54,900 36,400 18,400 0.19 10,000
P19-2 6410 4430 1990 0.32 962
P19-3 75,000 36,400 38,600 0.39 8980
P18-2 88,500 48,700 39,700 0.13 24,200
G24-1 26,700 14,900 11,800 0.06 n/d
M26-1 7110 4730 2380 0.12 n/d
M26-2 17,700 11,100 6590 0.07 590
M26-3 16,400 9310 7060 0.3 4600
M26-4 15,000 10,400 4590 0.87 5710
N24-2 111,000 n/a n/a n/a 19,900
N24-3 17,200 n/a n/a n/a 875
N23-1 9570 n/a n/a n/a 236
N23-2 66,600 n/a n/a n/a n/d
N21-1 8720 5780 2660 73.54 6980
N09-1 135,000 73,200 61,900 0.82 1180
K10-1 22,500 13,400 9090 0.33 590
M11-1 117,000 61,200 55,500 0.12 590
M11-2 96,400 42,100 54,300 4.44 19,800
U19-1 12,800 8710 4080 0.03 590
U19-2 3650 2330 1320 0.02 n/d
P28-1 80,700 54,500 26,200 2.06 1180
P28-2 6130 3510 2620 0.95 590
Q23-1 16,300 10,300 6070 0.57 1340
Q23-2 25,800 17,900 7860 0.39 3330
Q23-3 12,600 7750 4890 0.11 3820
Means 43,208 25,045 17,015 3.26 6111
In bold: TPH concentration >5000 mg/kg limit value (EGASPIN) and PAH16 concentration >7070 μg/kg Probable Effects Level (Environment
Canada; note that the EGASPIN limit value of 40,000 μg/kg was not exceeded)
n/d not detected, n/a data not available
such as plant root channels and infaunal burrows (Howard 14.3.2.4 TPH, Aliphatic and Aromatic
and Little 1987; Kingston et al. 2000). Hydrocarbons Statistical Results
To compare the widely-ranging contaminant Although aromatic hydrocarbons concentrations were signifi-
concentrations in relation to the sample depth it was thus cantly higher in the surface than subsurface using the
necessary to log10-transform the data. This was done to reduce parametric t-test, the similar vertical differences in mean
the samples’ variances in relation to their means, and helps to TPH and aliphatic hydrocarbons could not be tested because
approach the normal distribution permitting use of a of the high variance ratios (shown by the F-test) of the samples
parametric t-test. Tables 14.2 and 14.3 respectively show the even after log10-transformation. Nor could non-parametric
surface and subsurface data. Note that the individual data alternatives to the t-test be used (e.g., Wilcoxon’s test for
points were rounded by the laboratory to three significant matched pairs and Mann-Whitney U-test), because the fre-
figures, and so in Tables 14.2 and 14.3 the data for separated quency distributions differed in skewness between the surface
fractions of aliphatics and aromatics do not always sum and subsurface samples (see “Discussion”). However, when
exactly to the respective values for TPH (C5–C44). measurements constitute a matched pair, the matched pairs
t-test can be used. Despite the necessary omission of the few334 D. I. Little et al.
Table 14.3 TPH, aliphatics (C12–C44), aromatics (EC12–EC44), aromatics (EC5–EC12) fraction and SPAH16 data for subsurface (15–20 cm)
sediment samples (n ¼ 27) taken from 13 grids in August 2015
mg/kg μg/kg
Subsurface sample TPH Aliphatics Aromatics Aromatics EC5-EC12 ΣPAH16
N22-2 2430 1610 815 0.48 539
N22-3 3070 1980 1090 3.31 976
N22-4 1610 1030 576 0.18 2890
R12-1 163 76.2 86.6 0.03 n/d
R12-2 4880 3150 1720 2.6 1020
R12-3 19,600 14,500 5140 2.64 2320
P19-1 21,900 16,500 5390 0.89 7700
P19-2 4710 2860 1840 0.74 2070
P19-3 13,600 8780 4820 0.51 1630
P18-2 2500 1590 910 0.2 320
G24-1 17,100 10,200 6890 2.89 2200
M26-1 17,100 10,600 6470 9.42 3880
M26-2 23,300 13,900 9310 9.99 2020
M26-3 7820 5530 2200 32.31 8500
M26-4 6520 3590 2910 8.02 521
N24-1 17,000 n/a n/a n/a 10,300
N24-2 19,800 n/a n/a n/a 20,500
N24-3 89,500 n/a n/a n/a 22,800
N23-1 531 n/a n/a n/a 590
N23-2 16,000 n/a n/a n/a n/d
N21-1 5070 3010 1590 150.9 7850
N09-1 71,700 45,000 26,700 1.07 1180
K10-1 14,200 9320 4860 1.64 n/d
M11-1 12,600 8640 4000 1.16 1560
M11-2 29,500 17,900 11,600 3.96 n/d
U19-1 215 107 108 0.11 n/d
U19-2 287 174 113 n/d n/d
P28-1 2050 1270 768 1.27 n/d
P28-2 1290 662 630 0.22 n/d
Q23-1 25,300 15,200 10,100 0.64 14,200
Q23-2 11,700 8380 3370 0.12 1540
Q23-3 4180 2390 1770 5.93 n/d
Means 14,601 7702 4288 9.28 5092
In bold: TPH concentration >5000 mg/kg limit value (EGASPIN) and PAH16 concentration >7070 μg/kg Probable Effects Level (Environment
Canada; note that EGASPIN limit value of 40,000 μg/kg was not exceeded)
n/d not detected, n/a data not available
unpaired samples, this is a more sensitive test, and for consis- 14.3.2.5 Light Aromatics Fraction Statistical Result
tency it was used on all the hydrocarbons data. Using the matched pairs t-test the difference between the two
The t-test for matched pairs of log10-transformed data sediment layers in terms of mean aromatic hydrocarbons in
indicated that the difference between the mean TPH (C5– the carbon number range between EC5 and EC12 was found
C44) concentrations of the surface 0–5 cm layer and the to be statistically significant at p < 0.01 (t ¼ 3.01, 25 d.f.).
subsurface 15–20 cm layer was statistically significant at However, in contrast to the TPH, aliphatic and higher molec-
p < 0.01 (t ¼ 5.73 at 30 degrees of freedom, d.f.). The ular weight aromatic hydrocarbons, in the case of the EC5–
difference between the two sediment layers in terms of EC12 aromatics the subsurface layer was significantly more
mean C12–C44 aliphatic hydrocarbons was statistically signif- contaminated than the surface layer.
icant at p < 0.01 (t ¼ 5.57, 26 d.f.). The vertical difference in This is a function of the volatility of light aromatic
mean EC12–EC44 aromatic hydrocarbons was also statisti- compounds that would have evaporated quickly from the
cally significant at p < 0.01 (t ¼ 5.92, 26 d.f.). sediment surface after spillage, and partly due to the ability
of lighter aromatics to penetrate fine-grained sediments more14 Sediment Hydrocarbons in Former Mangrove Areas, Southern Ogoniland, Eastern Niger. . . 335
easily than heavier hydrocarbons. Recent rapid sediment source of PAHs, their input is outweighed by oil spills from
deposition could also bury lighter hydrocarbons, but is not several pipeline tappings and at new illegal refineries causing
a likely factor because deposition rates since the spill would further mangrove impacts documented in cumulative losses
have had to be very high. mapped using satellite imagery and aerial photography from
late 2009 (Gundlach this volume).
14.3.2.6 PAHs Results and Sources A third PAHs source was biomass combustion from both
In the surface layers of six sampling sites, the PAH16 natural and anthropogenic forest fires, and domestic fires.
concentrations were 24.2 mg/kg (P18), 19.9 mg/kg (N24), Although of minor interest to the problem of cleanup, bio-
19.8 mg/kg (M11), 16.7 mg/kg (two samples at N22), mass combustion was sub-dominant at N09, N21, Q23, M26,
12.6 mg/kg (R12), 10.0 and 8.98 mg/kg (P19). These P18, P19 and U19, usually in surface samples, but at N09 and
PAH16 levels are very high and exceed international sedi- P18 in both surface and subsurface samples. This suggests
ment quality guidelines (Environment Canada 7.07 mg/kg that in addition to oil fires, the burning of wood and grass
Probable Effects Level; PEL). Although sample variances (and coal, although most unlikely in Bodo) has contributed to
of total PAH16 were sufficiently close to proceed with the the PAHs geochemical signature for some considerable time.
t-test, the difference in mean concentrations between the This is typical of rural areas undergoing forest clearance for
surface and subsurface layers was found not to be statisti- agriculture, and with the use of wood fuel in domestic
cally significant (t ¼ 0.98). The matched pairs t-test also was cooking. UNEP (2011) showed the health risk of indoor
not significant (t ¼ 0.64). Indeed, subsurface PAHs cooking fuels in Ogoniland.
concentrations were also found in excess of PEL as follows:
22.8, 20.5 and 10.3 mg/kg (N24), 14.2 mg/kg (Q23), 14.3.2.7 Additional Contaminant Source Indicators
8.5 mg/kg (M26), 7.85 mg/kg (N21), and 7.7 mg/kg (P19). Many of the above site-by-site patterns agreed well with
In contrast to these high values, there had been no PAH16 other source indicators such as MTBE and volatile aromatic
concentrations exceeding PEL measured in Bodo 0–10 cm hydrocarbons (BTEX). Although reported as being below the
sediments in 2010 (Lindén and Pålsson 2013). limit of detection at most sites, where they were detectable,
The probable source types of the PAHs are shown in these contaminants often occurred at much higher
Fig. 14.6. The sectors of the graph pertaining to each poten- concentrations in the subsurface sediment layer.
tial source type such as petroleum, combustion products of For BTEX at N21 the subsurface concentration
petroleum and biomass burning are each marked according to (0.052 mg/kg) was five times more than at the surface.
the work of Yunker et al. (2002), as modified by Oros and Examples of MTBE enrichment include N21 (surface and
Ross (2004), Costa and Sauer (2005), Stout and Wang subsurface) and M26 (subsurface, as high as 0.96 mg/kg).
(2016), and Little and Galperin (2017). MTBE is a refined fuel blending component and therefore a
Despite many samples being at or below detection limits precise indicator of contamination by spilled petrol. It was
for individual PAHs, the double ratio cross-plots in Fig. 14.6 introduced to replace the lead additives in petrol that were
clearly show that in about half the samples the PAH was banned in Nigeria in 2005. It is likely that the MTBE
petroleum-derived, as would be expected near the SPDC indicates the increasing use of petrol in the creeks since
pipeline spills of 2008 and oil theft and spillage of Bonny then by small vessels, including security craft, and perhaps
Light crude oil at Bodo. In addition, the geochemical influ- those servicing illegal refineries.
ence of petroleum combustion at illegal refinery sites was For light aromatic EC5–EC12 fractions at M26 the subsur-
seen at Q23 and at N22 (surface and subsurface at both sites). face mean concentration (14.94 mg/kg, n ¼ 4) was over forty
At Q23 the total PAHs concentration reached 14.2 mg/kg in (40) times more than in the surface. In both the surface and
one subsurface sample. In the surface sample at N22 (surface) subsurface of M26 the gas chromatograms showed fresh
and also at R12 (subsurface) near Bodo waterfont, isomer petrogenic inputs in the range C12–C16. In addition, the
ratios transitional between petroleum and petroleum combus- range of relatively fresh oil input up to C21 was seen in
tion were observed. chromatograms of samples from N21, G24, N22, M26, P19
However, acute atmospheric fallout across the region is and R12 (subsurface), and less obviously from N22, M26,
also produced by oil industry flaring and well tests, tyre P19 and R12 (surface).
burning (pers. com. Pålsson) and chronic emissions from Over time, all these lighter hydrocarbons not only evap-
vehicles and industries in Port Harcourt and Eleme such as orate, but they can also penetrate the sediment and
oil refining and petrochemicals (UNEP 2011) and cement, could mobilise heavier molecules including PAHs into
paint and fertiliser (NDES 1997). Although all these are deeper sediment layers, further reducing their biodegrada-
partly responsible for petroleum combustion as a secondary tion rates.336 D. I. Little et al. Fig. 14.6 Ratios of Anthracene/ (Anthracene + Phenanthrene) [AN/(AN+P)], Benz[a] anthracene/(Benz[a]anthracene + Chrysene) [BA/(BA+C)], Indeno(1,2,3-cd)pyrene/(Indeno [1,2,3-cd]pyrene + Benzo[g,h,i] perylene) [IN/(IN+BPE)] each plotted against Fluoranthene/ (Fluoranthene + Pyrene) [FL/(FL +PY)] showing main PAH source types in the Bodo area sediments (after Yunker et al. 2002); for sample identities see Tables 14.2 and 14.3; data points in line are at limit of detection; all data are colour-coded: blue ¼ petroleum from oil spills including those resulting from the 2008 pipeline failures and illegal refinery sites; black ¼ petroleum combustion from regional oil industry flaring, vehicular and industrial emissions and local illegal refinery sites; and red ¼ biomass combustion (wood, grass)
14   Sediment Hydrocarbons in Former Mangrove Areas, Southern Ogoniland, Eastern Niger. . .                                                  337

Fig. 14.7 Aerial view of Kpador Channel near Bodo showing                failed road-building projects before the 2008 spills, and from illegal
continuously-oiled mangroves in the intertidal zone, with mobile free-   refineries since those spills (smoke and blackened trees left of center),
phase oil in the creeks; also showing impacts from pipeline RoWs and     17 April 2010 (Credit: J. Pålsson)

                                                                         kg (2010), and another three-fold increase in mean TPH
14.4      Discussion                                                     concentration to 28,904 mg/kg took place by 2015. To estab-
                                                                         lish whether these apparent changes were due to the incom-
The surveyed area near Bodo which includes the typical                   parability of the methods, the minimum TPH concentrations
substrates of the mangroves is extremely contaminated by                 in Bodo sediments were compared between 1983, 2010 and
residues of crude oil, either released into the environment              2015. The GC-FID traces give an indication of the back-
after accidental oil spills and leaks, or due to illegal activities      ground TPH status in the area, with a relatively low Unre-
such as oil theft from pipelines and the artisanal refining of the        solved Complex Mixture (UCM) of weathered petroleum and
stolen oil. In 2015 oil was observed across the intertidal man-          some biogenic resolved peaks. The background
grove habitat surface, and also draining into creeks, although           concentrations ranged from 110 mg/kg (1983), to 279 mg/
not generally as seriously as was seen on 17 April 2010                  kg (2010), and 163 mg/kg (2015). This background stability
(Fig. 14.7, showing the area of sampling stations N21 - N24              through time suggests reasonable comparability between the
inclusive, see Fig. 14.1). However, it has not always been like          methods.
this, and the contamination is patchy. This patchiness is impor-             Whereas the sampling and analytical methods used were
tant to understand if the future cleanup is to avoid adding to the       broadly comparable between all three of these surveys, the
impact of the original oil by physically removing too much of            intertidal field site locations within Bodo were different, and
the relatively clean subsurface layers during cleanup, as found          thus not directly comparable, as follows:
in other oil spill cleanups (Little et al. 2003). A range of cleanup
methods will be required, often in combination, rather than total        – 1983: northern Bodo south to Kpador channel/Bonny
sediment removal (Gundlach 2017).                                          River confluence (Baker 1983);
    The mean TPH concentration appears to have increased                 – 2010: across tidal regions of southern Gokana LGA (Lin-
by almost three times from 2690 mg/kg (1983) to 7500 mg/                   dén and Pålsson 2013); and
338 D. I. Little et al.
– 2015: the present survey of the Bodo TNP pipeline spills suggests in this case that cleanup should selectively remove
area targeted for cleanup (Fig. 14.1). the 0–5 cm layer of highly contaminated sediments. How-
ever, there are important caveats on the use of the preliminary
It was found in the analysis of over 660 samples from chemistry data in calibration of SCAT when considering
UNEP surveys across Ogoniland in 2010 that frequency decisions on cleanup, such as: (a) if the most highly
distributions of contaminant concentrations were strongly contaminated layer is between 5 and 15 cm; (b) if the most
left-skewed with 91% of all samples being less contaminated highly contaminated layer is deeper than 20 cm; and (c) if the
than the TPH limit value of 5000 mg/kg. This large number contaminated site is in close proximity to a sensitive receptor
of samples included inland soils and deeper layers sampled (e.g., Bodo waterfront).
using hand augers (Thiergärtner and Holtzmann 2014). The above cleanup recommendation from the preliminary
However, of those surface 0–10 cm depth samples taken samples is not a prescriptive protocol and it should not be
in 2010 in the intertidal zone closest to Bodo, the equivalent extrapolated to other areas. This is a key point because the
percentage of left-skewness for TPH was 33%14 Sediment Hydrocarbons in Former Mangrove Areas, Southern Ogoniland, Eastern Niger. . . 339
sources of contaminants demonstrate the need for forensics This was recognized by the BMI when they agreed that the
quality hydrocarbon analyses in a subset of the sites sampled, aim was to reduce oiling levels to those that would support
not least because of the need to understand pathways and then the establishment or transplantation and growth of mangrove
prevent adverse impacts on human health. In the mangrove seedlings. Ecological restoration will also depend on correct
sediments of the Calabar River a similar mix of PAH sources definition of the ecological goals, and this will require
was found using isomer ratios, but apparently without addi- detailed understanding of the inter-dependent mangrove spe-
tional input from illegal refineries (Oyo-Ita et al. 2013). cies assemblages, communities and habitats. A cause for
In 1983, Bodo West was the most exploited of the five optimism is that a group of whimbrel Numenius phaeopus
SPDC areas observed in terms of wood cutting (45% of sites), was observed by the authors at Bodo on 1 May 2015,
oyster gathering and fishing (50% of sites), activities that indicating the functional importance of the ecosystem as a
depend on sustainable reources. Apart from the physical stopover for long-distance migrant birds. Conversely, the
presence of the oil production facilities and one spill site in increased role of alien invasive species such as Nipa palm
Bodo West, no general biological impacts were attributed in in the ecosystem is a major concern. It is fortunate that much
1983 to the oil industry (Dixon 1983). With evidence of oil of the essential knowledge is to be found in Bodo (Zabbey
industry presence at 32% of sites, Bodo West was less et al. 2010, 2014, 2017, in press; Zabbey 2012; Zabbey and
affected by oil industry disturbance than Forcados (37% of Malaquias 2013; Pegg and Zabbey 2013; Zabbey and Uyi
sites) and by urbanization and industry at Warri (27% of 2014; Zabbey and Tanee 2016).
sites). The Bodo pipeline spills in 2008 and a subsequent Further constraints on applying the above-mentioned inter-
increase in oil theft, transport and illegal refining have in vention value include the fact that it was established for
combination caused catastrophic, habitat-scale and ongoing unweathered hydrocarbons. Additionally, it is based on the
mangrove ecosystem impacts (Gundlach this volume). ‘Dutch list’ (underlying EGASPIN) and is defined for a stan-
The environmental situation in the Bodo area is clearly not dard terrestrial soil type with 10% organic matter and 25%
beneficial for local people as well as the ecosystem clay. This is different from the deltaic sediments in the
supporting them. To put this subjective assessment in a mangroves, which consist of marine and coastal fine-grained
comprehensive context, an environmental quality standard sediments. Although not so much the case in Bodo as in other
(EQS) could be derived scientifically and used for compari- areas of the delta (e.g., Warri), the sediments are often affected
son with analytical results. There are intervention values used by dredge spoils or composed of made ground of widely
internationally for certain (parent) PAHs, and for single light differing organic content and granulometry (Fig. 14.7).
aromatic compounds, such as benzene (EC6). In The UNEP (2011) pointed out that not having separate values
Netherlands an intervention value of 1 mg/kg benzene in defined in EGASPIN for triggering and closing out remedial
soil is used (Into Dutch Soil 2014). However, there are no interventions was a loophole that allowed negligible cleanup
EQS for low molecular weight aromatics (EC5–EC12) to be accepted. Criticism of EGASPIN has also focused on
fractions. The derivation of an EQS for chemical substances the high TPH intervention value of 5000 mg/kg, and on the
is a sophisticated process, influenced by chemistry, toxicol- lack of limits on individual PAHs especially Benzo(a)pyrene
ogy, epidemiology, phenomena such as metabolism, interac- (IUCN 2013). A valid starting point to protecting the local
tion of chemical compounds, and other factors that in population is to focus on those areas, transfer pathways and
combination affect the probability of adverse effects. activities presenting the highest potential human exposure to
Official evaluation criteria for sediment contamination in toxic and persistent hydrocarbons. The elevated hydrocarbon
Nigeria are set by DPR (1991): “Environmental Guidelines concentrations in sites R12 and N09 are within a few hundred
and Standards for the Petroleum Industry in Nigeria meters of human receptors in Bodo.
(EGASPIN)”. Because of the relevance of the oil industry The intervention value for TPH of 5000 mg/kg in sedi-
to environmental impacts and the dominance of the Dutch ment adopted by DPR for comparison with the measured
company Shell in the oil-producing areas, EQSs from The concentrations gives a good sense of the magnitude of the
Netherlands have been generally adopted by EGASPIN pollution in the intertidal sediment. In contrast, the interven-
(Ministerie van VROM 2000). EGASPIN defines interven- tion value for PAH16 of 40 mg/kg is too high by international
tion values as those that indicate “the quality for which the standards (Tables 14.2 and 14.3). By considering the envi-
functionality of the sediment for human, animal and plant life ronmental regulatory standards of Nigeria and in conjunction
is, or is threatened with being, seriously impaired. with SCAT, the analytical results will need to be interpreted
Concentrations in excess of the intervention values corre- ecologically to derive recommendations regarding the net
spond to serious contamination”. However, compared to the environmental benefit of remediation of the
control of oil and chemical pollution, the conservation of oil-contaminated sediment. This focus will help to minimize
biodiversity and management of adverse ecological impacts any extra impacts from cleanup in soft sediments, and to
are not the focus of EGASPIN (IUCN 2013).340 D. I. Little et al.
avoid further unnecessary delays in the restoration of 14.6 Recommendations
mangroves and livelihoods in the Bodo area.
Using public health and demographic data (NPC 2004),
recent work has compared siblings conceived before and
14.5 Conclusions after onshore Nigerian oil spills; the study showed that neo-
natal mortality rates doubled after spills nearby (Bruederle
Intertidal surface sediments near Bodo are widely and and Hodler 2017). Therefore, an answer is needed to this
severely oiled since the 2008 pipeline spills, and in areas legitimate question: “Is the existing contamination of the
known to be subject to increases since 2009 in oil theft and Bodo area lethal only for mangroves and the associated
illegal refinery activities. Of the total of sixty-four fauna, or does it also endanger the health of the local peo-
(64) samples taken at two depths (0–5 cm and 15–20 cm), ple?” Independent health officials should evaluate the chem-
in the surface sediment all but one sample had a TPH con- istry data as soon as possible to determine the best course of
centration well above 5000 mg/kg, the EGASPIN regulatory action to protect the local people from any ongoing exposure
limit. In contrast, thirteen (13) samples in the deeper layer to toxins of unknown but potentially significant magnitude.
had TPH concentrations below the 5000 mg/kg limit. This recommendation is made because of the very high
Although contamination by TPH, aliphatic and aromatic sediment concentrations of aromatics (EC5–EC44) and other
hydrocarbons was moderate to high in the deeper layer, it hydrocarbons, especially PAHs. The factors determining the
was shown statistically to be significantly lower than in the hazard posed by toxic substances are a function not only of
extremely contaminated surface layer. their concentrations and distribution, but also of pathways
Whereas TPH, aliphatic and aromatic hydrocarbon and duration of exposure. The pathways are demonstrable for
fractions decrease in concentrations from the surface towards mangroves, their epifauna, and sedentary infauna in
deeper sediment as expected, the trends for the lower molec- contaminated sediments all under tidal submersion twice
ular weight aromatics differ. The latter are detected in much daily, but remain unclear for the Bodo human population
lower concentrations, with only twenty (20) out of 55 samples (e.g., via skin contact, inhalation and ingestion). When the
found at >1 mg/kg. In most samples, the concentrations of sediments begin to respond to remediation and the restored
lighter aromatics increase with greater depth in contrast to the mangrove system undergoes recolonization by edible fauna,
case of heavier hydrocarbons. This was as would be expected the present avoidance of contaminated areas by fishermen
from surface evaporation and also due to chromatographic may cease, and exposure to food-borne contaminants could
separation during oil infiltration, washing and draining then resume. To the extent that anyone still relies on
through intertidal sediments. potentially-contaminated water for drinking and household
Polycyclic aromatic hydrocarbons (PAH16) use, they should be provided with clean water until remedia-
concentrations range widely, with the higher values tion is complete, as recommended by UNEP (2011).
of PAH16 raising the possibility of potential health risk for The first appropriate and apparently obvious response is to
any people exposed to the pollution. It should be recalled that remediate the Bodo intertidal and shoreline sediments in
seven (7) of the individual PAHs are classified by USEPA as accordance with applicable Nigerian laws and guidance
probable human carcinogens, but this risk and the pathways (i.e. EGASPIN). From the work of the BMI, this chapter is
of human exposure at Bodo are still not adequately a contribution to such a response. A properly designed confi-
quantified. Ecological risk is better understood in that the dential medical screening programme and epidemiological
sediment PAH16 concentrations in 55 samples show that investigation might also be among the appropriate responses
international sediment quality guidelines are exceeded in to contamination in Bodo, and similar recommendations
fifteen (15) samples, of which seven (7) are in the subsurface. were made for Ogoniland by UNEP (2011). The UNEP
This explains ongoing adverse ecological impacts. studies were not able to consider fully the exposure scenarios
A preliminary forensics evaluation of the available typical for the Bodo area such as the consumption of
PAH data suggests the following likely sources of PAHs contaminated water and seafood, children fishing and bathing
in the area: petroleum, combustion of petroleum, and com- in the creeks, and local people working there now or in the
bustion products from biomass (wood, grass). Such sources past. The latter exposure scenarios should include those
typify inputs from oil industry spills and illegal refinery whose work on-site has been legal or illegal, with or without
activities, overprinted on a baseline of traditional biomass appropriate Personal Protective Equipment.
fuel usage. The petroleum and petroleum combustion inputs The PPE provided for the work force should be protective
are consistent with the lingering effects of the 2008 SPDC against a release of volatile hydrocarbons from subsurface
spills and the increase in oil theft and illegal refining layers once the surface layer (0–5 cm) has been removed
since then. during cleanup. The provision of hand-held gas detectorsYou can also read