Covid-19 Discourse on Twitter: How the Topics, Sentiments, Subjectivity, and Figurative Frames Changed Over Time - arXiv
←
→
Page content transcription
If your browser does not render page correctly, please read the page content below
ORIGINAL RESEARCH
                                                                                                                                           published: 16 March 2021
                                                                                                                                  doi: 10.3389/fcomm.2021.651997

                                           Covid-19 Discourse on Twitter: How
                                           the Topics, Sentiments, Subjectivity,
                                           and Figurative Frames Changed Over
                                           Time
                                           Philipp Wicke 1 and Marianna M. Bolognesi 2*
                                           1
                                            Creative Language Systems, School of Computer Science, University College Dublin, Dublin, Ireland, 2 Department of
                                           Modern Languages, Literatures, and Culture, University Bologna, Bologna, Italy

                                           The words we use to talk about the current epidemiological crisis on social media can
                                           inform us on how we are conceptualizing the pandemic and how we are reacting to its
                                           development. This paper provides an extensive explorative analysis of how the discourse
                                           about Covid-19 reported on Twitter changes through time, focusing on the first wave of
                                           this pandemic. Based on an extensive corpus of tweets (produced between 20th March
                                           and 1st July 2020) first we show how the topics associated with the development of
                         Edited by:
                                           the pandemic changed through time, using topic modeling. Second, we show how the
              Natalie Danielle Baker,      sentiment polarity of the language used in the tweets changed from a relatively positive
        Sam Houston State University,      valence during the first lockdown, toward a more negative valence in correspondence
                       United States
                                           with the reopening. Third we show how the average subjectivity of the tweets increased
                        Reviewed by:
                Claire Connolly Knox,      linearly and fourth, how the popular and frequently used figurative frame of WAR changed
          University of Central Florida,   when real riots and fights entered the discourse.
                         United States
                              Qian Hu,     Keywords: twitter, corpus analysis, covid-19, topic modeling, sentiment analysis, figurative framing
          University of Central Florida,
                         United States
                 *Correspondence:          INTRODUCTION
               Marianna M. Bolognesi
                m.bolognesi@unibo.it       Covid-19 was first officially reported by the Chinese authorities as a virus originated in Wuhan city,
                                           Hubei province in China, on 31st December 2019. According to official notifications of the World
                   Specialty section:      Health Organization (2020), while we revise this manuscript the disease has infected more than 106
         This article was submitted to     million people worldwide, killing more than 2.3 million lives.
           Disaster Communications,           The issues related to the development of the global pandemic are challenging and complex,
               a section of the journal
                                           because they carry deep consequences not only in the medical, but also the social, economic,
          Frontiers in Communication
                                           political, and behavioral domains. While the recent release of different types of vaccines suggest
         Received: 11 January 2021         that we might be experiencing the last phases of this health crisis, the consequences of such a
        Accepted: 22 February 2021
                                           long-lasting worldwide pandemic will be certainly seen beyond the actual end of the medical
         Published: 16 March 2021
                                           emergency and in various aspects of our lives.
                            Citation:         Online discourse on Twitter, in this regard, has recently attracted a number of contributions,
   Wicke P and Bolognesi MM (2021)
                                           because the texts (the tweets) found on this platform are considered to be a good proxy for the
  Covid-19 Discourse on Twitter: How
  the Topics, Sentiments, Subjectivity,
                                           public opinion and perception related to the pandemic that we are currently experiencing (Bruns
 and Figurative Frames Changed Over        and Weller, 2016). It follows that understanding and interpreting such discourse, its evolution
    Time. Front. Commun. 6:651997.         over time, and its interdependence with real-world events can help us understand how people
   doi: 10.3389/fcomm.2021.651997          conceptualize and react to the global crisis.

Frontiers in Communication | www.frontiersin.org                                 1                                           March 2021 | Volume 6 | Article 651997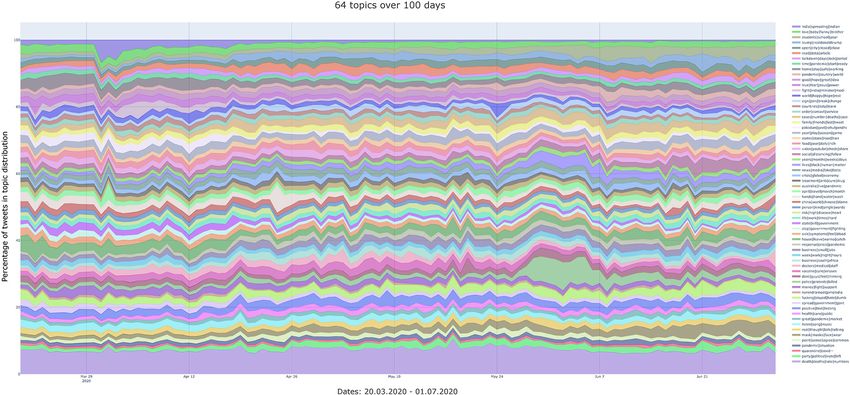
Wicke and Bolognesi                                                                                                   Covid-19 Discourse on Twitter

    In particular, understanding how the topics discussed on             1. Which topics are discussed on Twitter in relation to Covid
Twitter in relation to the pandemic change over time can be                 and how do they change over time, with the development of
crucial for understanding what aspects of the crisis are perceived          the pandemic?
to be more salient and important for the population (Zhou                2. What valence (sentiment polarity) emerges from the tweets
et al., 2020). In a very recent study Wicke and Bolognesi                   about Covid and how does it change over time?
(2020) analyzed the topics of discussion in a corpus of tweets           3. How does the subjectivity of the tweets (i.e., opinion-based
that covered 2 months (20th March−20th May 2020). In the                    focus, vs. the objective fact-based focus) change over time?
discussion of their findings, the authors suggest that topics are        4. How does the use of the pervasive figurative framing of WAR
likely to change over time. Therefore, adding a temporal dynamic            change over time?
to the topic modeling analysis may provide a clearer view of
                                                                         Following the research questions outlined above, we formulated
how the pandemic is processed in the minds of the speakers and
                                                                         the following hypotheses.
discussed on Twitter.
    Mining the sentiment polarity of tweets through the analysis         1. TOPICS: The pandemic is in constant development and
of words used therein can provide precious information about                change. The topics of discussion on Twitter are likely to
how social measures such as travel bans, social distancing, and so          change accordingly, in concurrence with the most recent
forth have been taken in by the population during the first wave.           events associated with Covid-19. We therefore predict
By seeing potential changes in the sentiment polarity through               that different topic models, based on different degrees of
time, and interpreting them in relation with major events and               granularity will capture different events covered by the media
governmental decisions issued during the first wave, it may                 and the press, related to Covid-19.
become possible to predict how similar measures are going to             2. SENTIMENT POLARITY: The corpus of tweets on which the
affect us now that we are experiencing a new wave.                          current analysis is performed contains mainly data produced
    If tweets that contain language loaded with affective                   by American English users, collected between 20th March
information are likely to express opinions rather than facts,               (first official day of lockdown in many States) and 1st July
then they therefore tend to be subjective rather than objective.            2020. In this period of time the number of active cases
Mining the amount of affective information (positive or negative)           increased steadily in the USA, according to the World Health
associated with the language used in the tweets can shed light on           Organization (2020). We therefore expect to find an increase
the temporal dynamics of the overall subjectivity of the tweets.            in the negative feelings associated with the tweets, over time.
In other words, it will be possible to observe the distribution          3. SUBJECTIVITY: Because of the development of the
of fact-based vs. opinion-based tweets over time (De Smedt                  pandemic, and the increase of the daily cases, and of the
and Daelemans, 2012). This type of analysis can provide an                  (possibly) negative feelings emerging from the tweets,
interesting indicator of our eagerness to report, trust, and                we expect the tweets to contain an increasing number of
discuss facts and potential objective information, as opposed               words loaded with affective content. It follows that we
to opinions.                                                                expect the tweets to be increasingly opinion-based (loaded
    Finally, understanding how a specific conceptual framing used           with emotion), rather than fact-based (neutral), with the
in the discourse about Covid on Twitter changes over time                   progressing of the epidemic.
can provide a different type of indirect measure of people’s             4. FRAMING: We do not have a specific hypothesis in mind in
attitude toward the pandemic. In particular, previous research              relation to this research question, but we expect to observe
has shown that various sensitive topics such as cancer, drugs,              possible changes in the way in which the WAR frame is used to
crime, and epidemics are typically framed using the pervasive               talk about the virus. In particular, while words such as “fight”
metaphorical frame of WAR (Flusberg et al., 2017; Thibodeau                 and “war” may continue to be frequently used, we might
et al., 2017; Wicke and Bolognesi, 2020). In some cases, however,           observe new words within this frame becoming common in
the use of war-related terms to talk about sensitive topics has             the Covid discourse. This would suggest that the lexical tools
been proven to have negative effects on the people directly                 used to frame the Covid discourse have been extended and
affected by the problem under discussion. For example, using                developed, to confirm the centrality and pervasiveness of the
war-related terms to talk about cancer affects patients’ general            WAR figurative frame.
attitude toward their own medical condition (Hendricks et al.,
                                                                         The remainder of the paper is organized as follows: after a
2018). Conversely, the use of alternative, more positive frames,
                                                                         brief overview of related work on these topics, we proceed by
such as JOURNEY or DANCE, can positively affect patients’
                                                                         addressing each research question in order, explaining methods,
attitude and general well-being. Since previous work has shown
                                                                         results, and discussion of the data related to each analysis. Finally,
that, generally speaking, the WAR frame is particularly frequent
                                                                         we take all the results together and provide a final general
in the discourse about Covid-19 (Wicke and Bolognesi, 2020), we
                                                                         discussion of our findings.
hereby explore how the distribution of the lexical units within
this figurative frame change over time, to possibly cover and
express topics associated with the new stages of the pandemic,           THEORETICAL BACKGROUND AND
in a temporal perspective.                                               RELATED WORK
    In line with the variables outlined above, the research
questions addressed in this study can be summarized                      The information encoded in the short texts produced by private
as follows:                                                              internet users on Twitter (the tweets) provides useful clues that

Frontiers in Communication | www.frontiersin.org                     2                                       March 2021 | Volume 6 | Article 651997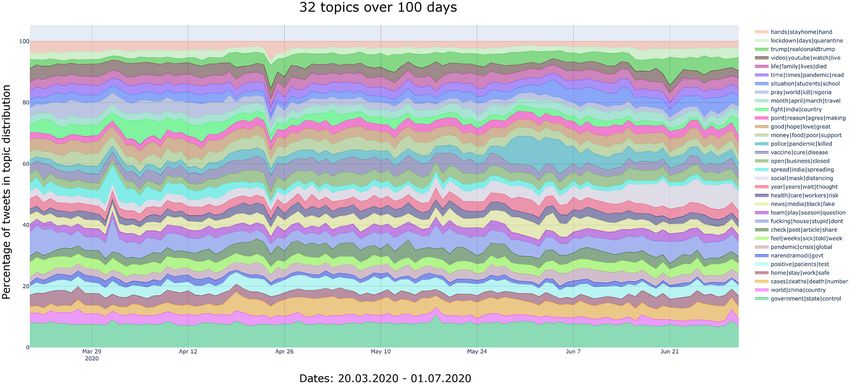
Wicke and Bolognesi                                                                                                    Covid-19 Discourse on Twitter

in some cases can be used by experts. A growing body of research           instead, analyzed the topics related to the discourse around the
on social media discourse associated with disasters and crises             Ebola outbreak, in 2014, and in particular after a case of Ebola was
is based on Twitter. Yeo et al. (2018) for instance, reported              diagnosed on US soil. The authors reported that the main topics
a study of social media discourse about the 2016 Southern                  of concern for the American public were the symptoms and
Louisiana flooding in which they used Twitter data to construct            lifespan of the virus, the disease transfer and contraction, whether
a response communication network and show culture-specific                 it was safe to travel, and how they could protect themselves from
characteristics of this discourse. In a more recent study, Yeo             the disease. In a parallel study, Tran and Lee (2016) built Ebola-
et al. tracked topics, sentiments, and patterns on longitudinal            related information propagation models to mine the information
Twitter data on the same phenomenon (Yeo et al., 2020). Thanks             encoded in the tweets about Ebola and explored how such
to this analysis they provided an overview of the long-term                information is distributed across the following six topics: 1. Ebola
crisis recovery with respect to the dominant voices, sentiments,           cases in the US, 2. Ebola outbreak in the world, 3. fear and prayer,
and participants’ numbers. The authors highlighted the need                4. Ebola spread and warning, 5. jokes, swearing, and disapproval
for long-term recovery communication, utilizing social media,              of jokes and 6. impact of Ebola to daily life. The authors found
and supporting local voices after a disaster. A spatiotemporal             that the second topic had the lowest focus, while the fifth and
analysis of the Twitter discourse about Hurricane Matthew has              sixth had the highest. Finally, in a very recent study, Park et al.
been conducted by Martín et al. (2017). The authors conducted a            (2020) propose a topic analysis related to the discourse around
temporal analysis and tracked disaster-related tweets over a week          Covid on Twitter, analyzing a corpus of Indian, South Korean,
for different states in the US in order to correlate the distance to       Vietnamese, and Iranian tweets in a temporal perspective. The
the hurricane with Twitter activity. With a fine-grained analysis          authors report some cultural differences, showing that in Iran
they were able to observe evacuees and traveling information               and Vietnam, unlike in South Korea, the number of tweets did
during the development of this disaster, which allowed them to             not correlate with the dates of specific events taking place in
check evacuation compliance.                                               these countries, which were used by the authors as baselines.
    In relation to previous epidemics, the linguistic data extracted       In a temporal analysis they report that the official epidemic
from Twitter has been correlated with the actual spreading                 phases issued by governments do not match well with the online
of the virus, showing that the number of tweets discussing                 attention on the epidemic. Nonetheless, the authors compared
flu-symptoms predicted the official statistics about the virus             similarities in major topics across these countries over time and
spread such as those published by Centers for Disease Control              found that in Iran, Vietnam, and India, the peak of the daily
and Prevention and the Health Protection Agency (Culotta,                  tweet trend preceded the peak of the daily confirmed cases. This
2010). Quantitative analyses of linguistic data been conducted             suggests that mining tweets can help to monitor public attention
during the development of various types of diseases to mine                toward the diffusion of the epidemic.
the information that internet users encode in language, while                  Finally, Twitter-based studies that use topic modeling
experiencing medical crises such as the dengue fever in Brazil             techniques or sentiment analysis are starting to appear in relation
(Gomide et al., 2011), the Zika disease (Wirz et al., 2018; Pruss          to the Covid discourse. However, to the best of our knowledge,
et al., 2019), the measles outbreak in the Netherlands in 2013             they appear to use a significantly different methodology. Those
(Mollema et al., 2015), and more recently, the Coronavirus                 works include Sentiment Analysis with Deep Learning Classifiers
epidemic (Wicke and Bolognesi, 2020).                                      (Chakraborty et al., 2020; Li et al., 2020), a time-span of
                                                                           much fewer days (Abd-Alrazaq et al., 2020; Xue et al., 2020),
Topics                                                                     and analyses of specific emotions without topic models (Lwin
In relation to the spreading of the Zika virus in 2015, Miller             et al., 2020; Mathur et al., 2020). Because topic modeling is an
and colleagues (Miller et al., 2017) used a combination of                 exploratory, bottom-up, data-driven technique of data mining,
natural language processing and machine learning techniques                we believe that a broader and more explorative approach, that
to determine the distribution of topics in relation to four                takes into account multiple topic modeling solutions and a longer
characteristics of Zika: symptoms, transmission, prevention, and           time span, may provide better insights on the themes discussed by
treatment. The authors reported the most persistent concerns               Twitter users over time.
or misconceptions regarding the Zika virus extracted from the
corpus of tweets, and provided a complex map of topics that
emerged from the analysis. For example, in relation to the                 Sentiment Polarity
prevention of the virus spreading, they observed the emergence             Many of these linguistic studies based on social media discourse
of the following topics: need for control, and prevention of               have the aim to mine the sentiments of the population that
spread, need for money, ways to prevent spread, bill to get funds,         is experiencing a pandemic, by understanding people’s feelings
and research. In a different study, Pruss et al. (2019) provided a         toward the topics related to the disease. For example, Mollema
cross-linguistic analysis of the discourse around the Zika virus,          and colleagues found that during the measles outbreak in
based on a corpus of tweets in three different languages (Spanish,         the Netherlands in 2013 many Twitter users were extremely
Portuguese, and English). Using a multilingual topic model, the            frustrated because of the increasing number of citizens that
authors identified key topics of discussion across the languages           refused to vaccinate for, among others, religious reasons. The
and their distribution, demonstrating that the Zika outbreak was           measles outbreak in the Netherlands began among Orthodox
discussed differently around the world. Lazard and colleagues,             Protestants who often refuse vaccination for religious reasons.

Frontiers in Communication | www.frontiersin.org                       3                                      March 2021 | Volume 6 | Article 651997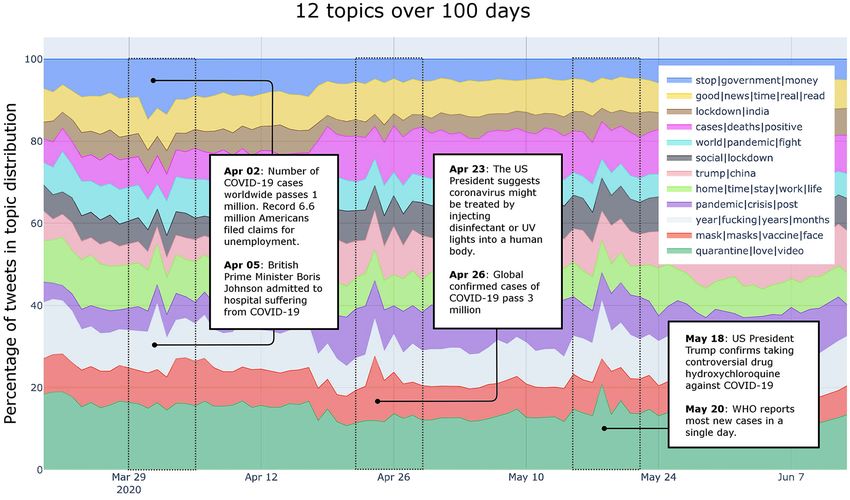
Wicke and Bolognesi                                                                                                      Covid-19 Discourse on Twitter

   The main distinction among sentiments observed within                     that have a neutral connotation, that is, those texts that are not
a given text is between positive and negative feelings. This                 subjective, need to be filtered out (Liu, 2010). This is usually
dimension is commonly defined as emotional valence in                        done in order to ensure that only opinionated information is
cognitive science and cognitive psychology, and more typically               processed by a classifier that can distinguish between positive
defined as sentiment polarity in the machine-learning subfield               and negative feelings. A thorough review of the methods and the
called sentiment analysis. The exploration of the emotional                  challenges involved in distinguishing between facts and opinions
valence encoded in the tweets has been used in some cases                    for sentiment analysis lies beyond the scope of the present
to predict future behavior, for example to predict whether a                 paper (but see Chaturvedi et al., 2018 for a literature review).
customer was likely to use a given service a second time,                    The following heuristic might summarize how subjectivity and
under the assumption that a positive feedback left on Twitter                sentiment polarity are related to one another: the more a
would imply that a client might be more inclined to use that                 text includes words that are loaded with (positive or negative)
service again. In the case of political messaging during electoral           emotional content, the more that text is arguably subjective, as
campaigns, positive feedback might correlate with voters’ support            it expresses personal opinions, beliefs, and sentiments toward
for a specific candidate. In some cases, as pointed out by recent            a specific topic. Conversely, texts that feature neutral words,
studies, social media analyses during crisis situations may be used          not loaded with emotions, are likely to be more informative
to investigate real-time public opinion and thus help authorities            and objective.
to gain insight for quickly deciding for the best assistance policies
to be taken (Mathur et al., 2020).                                           Framing
   Temporal analyses of sentiments expressed in Twitter data                 In cognitive linguistics and communication sciences, and in
have been previously done on a variety of topics, including                  particular in metaphor studies, public discourse is often analyzed
the FIFA Confederations Cup in Brazil (Alves et al., 2014), the              in relation to different figurative and literal communicative
changes in voters’ feelings during the US elections (Paul et al.,            framings (Burgers et al., 2016). A frame is hereby defined
2017) and the changes of sentiments on a monthly, daily and                  as a selection of some aspects of a perceived reality, which
hourly level across different geographical regions (Hu et al.,               taken together make a standpoint from which a topic can be
2019).                                                                       seen. Such a standpoint is “constructed to promote a particular
                                                                             problem definition, causal interpretation, moral evaluation,
Opinions                                                                     and/or treatment recommendation for the item described”
As suggested by Liu (2010), facts are objective expressions about            (Entman, 1993. p. 53). Within this definition of framing,
events, entities, and their properties, whereas opinions are usually         metaphors may be used to establish a perspective on a given
subjective expressions that describe sentiments, appraisals,                 topic. In health-related discourse, for example, “war-metaphors”
feelings toward events, entities, and their properties. Research             are often used to talk about illnesses and treatments. For instance,
on subjectivity detection, that is, the distinction between texts            in a pioneering work, Sontag and Broun (1977) described and
that express opinions and texts that express facts is becoming               criticized the popular use of war metaphors to talk about cancer,
increasingly central in various fields, such as computer science,            a topic of research recently investigated also by Semino et al.
journalism, sociology, and political science (see Chatterjee et al.,         (2017). Their argumentation suggested that the use of military
2018 for a review). The reasons for this interest are varied.                metaphors bears negative implications for clinical patients (see
There are business-related issues, such as companies interested in           also Hendricks et al., 2018). Nevertheless, military metaphors
understanding whether consumers have strong opinions toward                  are widely used and highly conventionalized, for their ability
a specific brand or whether instead they are indifferent. Politics           to provide a very effective structural framework that can be
is another field where many use data to understand whether a                 used to communicate about abstract topics, usually characterized
specific candidate triggers opinions or leaves voters indifferent.           by a strong negative emotional valence. Military metaphors, as
    Distinguishing fact-based and opinion-based texts in social              suggested by Flusberg et al. (2017) draw on basic knowledge that
media is an operation usually performed by different types of                everyone has, even though for most people this is not knowledge
analysts to fulfill different goals. Detecting fact-based texts in the       coming from first-hand experience. These metaphors are very
wild (thus filtering out opinion-based texts) is an operation that           efficient in expressing the urgency associated with a very negative
can be performed by analysts interested in detecting events and              situation, and the necessity for actions to be taken, in order to
capturing factual data, for the automated and fast identification            achieve an outcome quickly. As recently reported by Wicke and
of (for example) breaking news from social media streams.                    Bolognesi (2020) this frame is also frequently used to talk about
Conversely, detecting opinion-based texts in the wild is an                  Covid-19 on Twitter. As the authors show, the WAR frame (and
operation that enables analysts to capture users’ beliefs and                thus war-related metaphors) is much more commonly used than
feelings. This is usually done by companies to develop marketing             alternative figurative frames that can be found in the discourse
strategies toward their brand. In both types of tasks, Twitter has           about Covid. The authors also show that the most commonly
been used as a valuable resource of linguistic data for fact and             used lexical units related to the WAR framing are “fighting,”
opinion data mining (Li et al., 2012).                                       “fight,” “battle,” and “combat.” This may be attributed to the stage
    Subjectivity detection is a major subtask involved in sentiment          of the pandemic during which the study was conducted (peaks
analysis (Chaturvedi et al., 2018). Before analyzing the positive            of the first wave, March–April 2020). As the authors suggest,
and negative feelings involved in a corpus of texts, those texts             it could be the case that different stages in the development of

Frontiers in Communication | www.frontiersin.org                         4                                      March 2021 | Volume 6 | Article 651997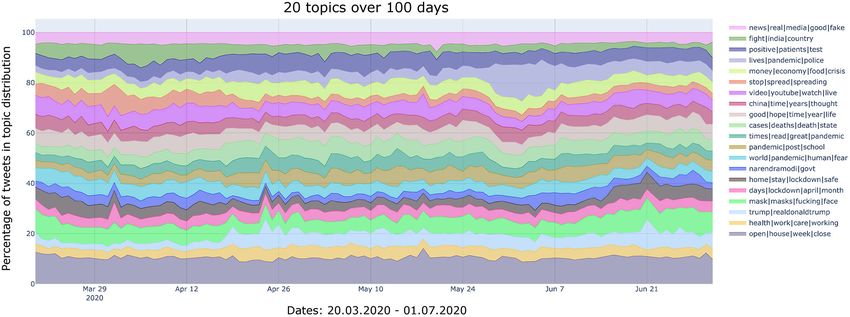
Wicke and Bolognesi                                                                                                               Covid-19 Discourse on Twitter

the pandemic are characterized by different uses of the WAR                       identified by the algorithm. The categories are defined by words
framing, in relation to Covid. For example, it could be the                       that have the strongest co-occurrence with each other.
case that new lexical units within the WAR framing become                             The processing and modeling pipeline can be summarized
frequently used, to express aspects of the sociocultural situation                as follows:
that were previously non-existent. These intuitions are tested in
                                                                                  • Stopword removal: the most common English words, e.g. “a,”
the present study, in section How Does the Figurative Framing of
                                                                                    “the,” “but,” are filtered out, based on established stopword lists
WAR Change Over Time?
                                                                                    (Stone et al., 2011; Wei et al., 2015; NLTK3 ).
                                                                                  • Tokenization: by means of the NLTK Tweet Tokenizer4
WHICH TOPICS ARE DISCUSSED ON                                                     • Gibbs Sampling: by means of the Mallet library (Rehurek
TWITTER IN RELATION TO COVID-19 AND                                                 and Sojka, 2010) for Gensim to apply Gibbs Sampling in our
                                                                                    LDA training.
HOW DO THEY CHANGE OVER TIME WITH                                                 • Number of topics: we explored all topic modeling solutions
THE DEVELOPMENT OF THE PANDEMIC?                                                    from topic number N = 2, 3, 4 . . . to N = 32, and then a highly
                                                                                    granular solution, N = 64. Based on the coherence measure
Methods
                                                                                    of the cluster solutions Cv (Syed and Spruit, 2017) we retained
Data Acquisition
                                                                                    the best solutions.
Twitter counts around 152 million active users worldwide
(Statista, 2020). Through the publicly accessible Application                     Internal topic coherence is evaluated through the elbow method:
Programming Interface (API) services, the platform allows                         all topic numbers are plotted in relation to their internal
analysts to mine the tweets that users post online, in compliance                 coherence and the selected solutions are those in which the
with the privacy regulations set by the platform programmers.                     function shows a clear bend, suggesting that for the next solution
According to the official Twitter redistribution policy1 it is not                the coherence slope drops significantly. For the purpose of this
allowed to share tweets and the metadata associated with them                     study, we aimed at picking 4 different cluster solutions that
(user’s name, date, etc.), but only tweet IDs, user IDs, and other                vary in their degree of granularity. We partitioned the data into
meta-information alone.                                                           a smaller and into a larger number of topics in order to see
    Based on the extensive resource of tweet IDs collected by                     potential differences emerge between a broad analysis and a more
Lamsal (2020), we created a subcorpus of Covid-related tweets.                    fine grained analysis of the topics within our corpus.
The original dataset of tweets IDs collected by Lamsal contains
3–4 million tweets per day, in English, retrieved from Twitter                    Temporal Analysis
based on a list of 90+ keywords that are possibly related to Covid,               Figure 1 displays the steps involved in the topic modeling based
such as “corona,” “coronavirus,” or “pandemic.”2 This resource                    on the corpus of Covid-related tweets. The 100 groups of
contains tweets and retweets, as well as all tweets produced                      daily tweets were fed into the topic modeling algorithm, which
by any tweeter. For the purpose of constructing a balanced,                       provides the probability distribution for each tweet to belong to
representative, and computationally manageable corpus of tweets                   a certain topic. The result of the temporal modeling analysis is
stemming from this extensive archive, we sampled 150,000 tweets                   a series of clusters for each topic, for each day in the corpus.
per day from Lamsal’s resource. From each sample we retained                      Based on these temporal distributions we provide an analysis of
only one tweet per user and dropped retweets. Keeping only one                    the observed patterns co-occurring with events in the news.
tweet per user allowed us to balance compulsive tweeters and less
involved Twitter users, thus preserving the representativeness
and balance of the language used on Twitter to talk about                         Results
Covid. The resulting corpus, on which the current analyses                        Following the process pipeline depicted in Figure 1, we created
were performed, contains 1,698,254 tweets from individual users                   32 LDA models, each with a different number of topics. The
(without retweets), produced between 20.03.2020 and 01.07.2020.                   evaluation of the Cv coherence measure revealed an elbow of the
                                                                                  function for N = 20 (see a plot of the curve on the Open Science
Topic Modeling                                                                    Framework OSF platform repository5 for this paper). In addition
The topic modeling analysis hereby implemented builds on an                       to this, we selected a model that allowed for a broader analysis
approach presented by Wicke and Bolognesi (2020), that uses                       of the topics, hence a smaller number of (more inclusive) topics.
Latent Dirichlet Allocation (LDA) (Blei et al., 2003). The standard               Based on our previous experience with topic modeling and the
LDA algorithm is an unsupervised machine learning algorithm                       coherence value function we selected N = 12, together with
that aims to describe samples of data in terms of heterogeneous                   N = 32 for the fine-grained solution, and N = 64, our most fine
categories. Since the LDA algorithm is unsupervised, the analysts                 grained solution. It should be noted that the LDA algorithm itself
need to specify the amount of topics to be modeled. For example,                  involves some degree of randomness and therefore it is likely to
by specifying N = 4, each tweet in the corpus will receive                        obtain different models, even when trained on the same data. Yet,
a likelihood to belong to one of four categories automatically
                                                                                  3 https://www.nltk.org/book/ch02.html#code-unusual
1 https://developer.twitter.com/en/developer-terms/policy                         4 https://www.nltk.org/_modules/nltk/tokenize/casual.html#TweetTokenizer
2 https://ieee-dataport.org/open-access/coronavirus-covid-19-tweets-dataset       5 https://osf.io/v523j/?view_only=63f03e24d48c4d58af1793e0f04ce28b

Frontiers in Communication | www.frontiersin.org                              5                                          March 2021 | Volume 6 | Article 651997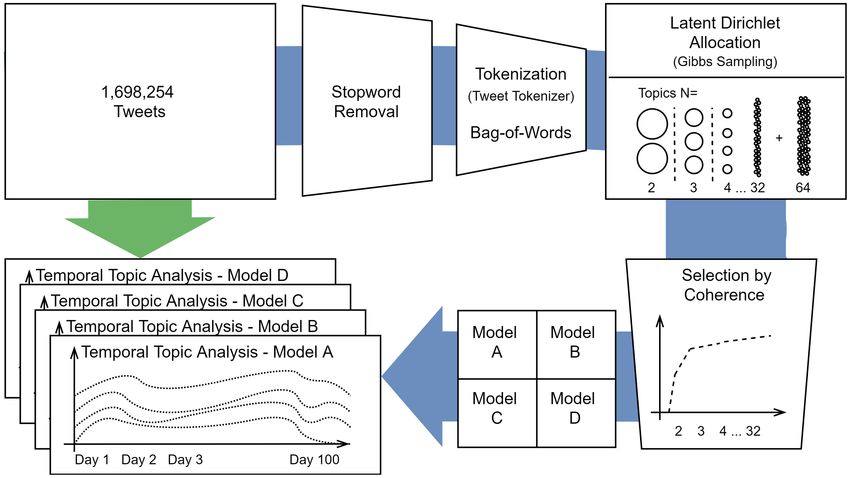
Wicke and Bolognesi Covid-19 Discourse on Twitter
FIGURE 1 | Processing pipeline for the constructed corpus. This corpus of tweets follows one path with processing steps, topic modeling and model selection (blue
arrow). On the other path (green arrow), the same corpus is presented to the models in order to create four temporal topic analysis over 100 days with different
resolutions i.e., different topic numbers.
our selection is based on the evaluation of the coherence measure informed by official statements released by the World Health
in order to mitigate the statistical randomness. Organization (2020).
Model A (N = 12), B (N = 20), C (N = 32), and D (N = In the first week of April, we observe a change in the topics
64) are stored in the OSF online repository, where the plots can “stop|government|money” and “year|fucking|years|months.” We
be dynamically explored using an interactive web-service that we interpret this in relation to a major event that took place on
created using pyLDAvis6 (Sievert and Shirley, 2014). the second of April: A record of 6.6 million Americans filed
In order to capture the temporal dynamics involved in the claims for unemployment.7 As a consequence, we argue, the
discourse, the groups of tweets collected for each of the 100 days first week of April had a strong impact on people’s opinion
(an average of 12,598 tweets per day, once the corpus is filtered on continued/stopping government financial aid throughout the
for retweets and unique users) were fed into the topic modeling upcoming months/year.
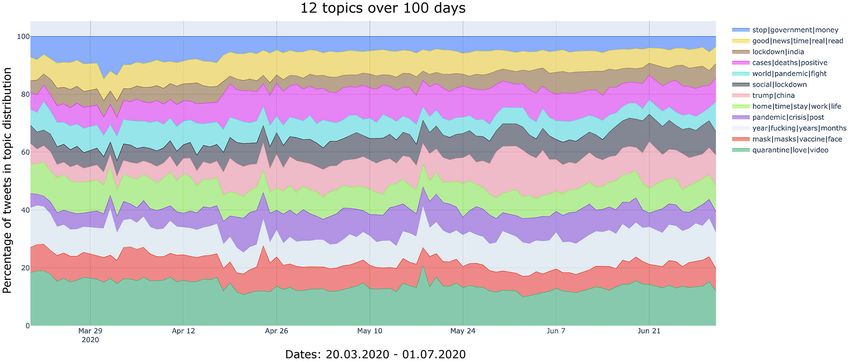
algorithm. Figures 2–5 illustrate the four analyses displaying The fourth week of April shows a strong increase for the topic
the temporal line on the horizontal axis, the topics as different “mask|masks|vaccine|face”. The following additional keywords
chromatic shades on the vertical axes, and the proportion of are associated with this topic: “kill,” “cure,” “disease,” “human,”
tweets within each topic (day by day) is represented by the “wear,” “person,” “treatment,” “wearing,” “body,” “science,” “light,”
colored areas. The labels in the legend for each topic consist of “research,” “sense,” “common,” and “study.” Comparing this topic
the top 3 or 4 most important words within each topic. These with the news reported by the press, it appears that on 23rd
are visible in larger fonts in the interactive versions of these topic April Donald Trump suggested (ironically or otherwise) that
modeling solutions. coronavirus might be treated by injecting disinfectant or by UV
Figure 2 displayed the less granular topic modeling analysis lights.8 It is likely that this comment triggered the increased
(N = 12), which is likely to capture broader and more generic discussion on Twitter about common sense, science, and effective
topics associated with the discourse about Covid-19. Three main treatment (such as masks, vaccines, face masks).
observations can be made, based on the changes in the colored The 20 topics solution shows the following trends:
areas. In Figure 6 we have highlighted those three bands, which
• The topic marked as “home|stay|lockdown” displays a large
occurred roughly in the first week of April, fourth week of
portion of tweets in March; then the concentration decreases,
April and fourth week of May. The pandemic-related events
to finally increase again in June. These trends might be related
we correlate with the results of the topic modeling are being
7 https://www.bls.gov/opub/ted/2020/unemployment-rate-rises-to-record-high-
6N = 12: https://bit.ly/35PkIMt, N = 20: https://bit.ly/3iLIlcC, N = 32: https://bit. 14-point-7-percent-in-april-2020.htm?view_full
ly/3hKqZvw 8 https://www.bbc.com/news/world-us-canada-52407177
Frontiers in Communication | www.frontiersin.org 6 March 2021 | Volume 6 | Article 651997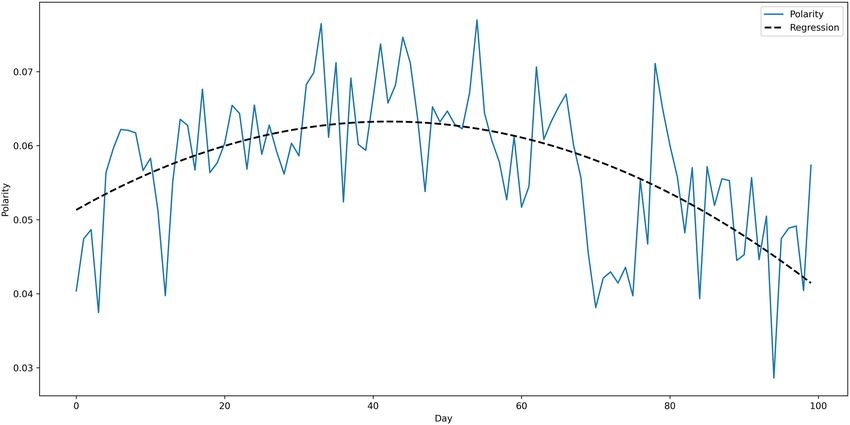
Wicke and Bolognesi                                                                                                               Covid-19 Discourse on Twitter

 FIGURE 2 | Temporal development of the topics (N = 12 topics, 100 days). Interactive version: https://bit.ly/3cfDq0V.

 FIGURE 3 | Temporal development of the topics (N = 20 topics, 100 days). Interactive version: https://bit.ly/2FNACwb.

  to the “Stay at home” guidelines issued by the WHO on 12th                          • A substantial concentration of tweets is observed in early
  March and updated and extended on 29th March.                                         April, in the topic labeled as “fight|India|country.” This is
• In the first half of April there is a concentration of tweets                         when the virus started to spread exponentially in this country.
  in the topic labeled as “stop|spread|spreading.” We interpret                       • An increase of tweets in the topic labeled with the
  this as a reaction to some notifications issued by the WHO,                           keyword “narendramodi” (Narendra Modi is the Indian Prime
  such as the confirmation of over 1 million cases of COVID-                            minister) can be observed around the first half of June, when
  19 reported on 4th April 2020, the updated guidance on how                            the spreading of the virus was particularly fast in this country,
  to use masks on 6th April, and the publication of a draft                             and the Prime Minister was appearing often in the media,
  landscape of COVID-19 candidate vaccines on 11th April.                               with messages related to the pandemic. Moreover, in the
  In relation to this, the increased concentration of tweets in                         beginning of June he held summits with authorities in France
  the topic labeled as “positive|patients|test” around the end of                       and in the USA. Finally, another peak can be observed around
  April/beginning of May, might be related to the fact that in                          the 28th June. We interpret this as an anticipation of the
  this period the USA became the first country in the world to hit                      major event that took place on the 30th June, when Modi
  1M cases.                                                                             addressed the whole nation with a strong message, explaining

Frontiers in Communication | www.frontiersin.org                                  7                                      March 2021 | Volume 6 | Article 651997
Wicke and Bolognesi                                                                                                               Covid-19 Discourse on Twitter

 FIGURE 4 | Temporal development of the topics (N = 32 topics, 100 days). Interactive version: https://bit.ly/35RotkG.

 FIGURE 5 | Temporal development of the topics (N = 64 topics, 100 days). Interactive version: https://bit.ly/3kx6XGo.

  that people had become more irresponsible and careless about                          statement by Donald Trump in which he was floating the
  COVID-19 prevention guidelines since the start of their first                         idea (ironically or otherwise) of ingesting disinfectants as a
  “Unlock 1.0.”9                                                                        potential coronavirus treatment. The latter date corresponds
• The topic labeled as “Trump” displays three main peaks of                             to the date in which he held his first campaign rally since the
  tweets, on 24th and 26th April, as well as on 21st June.                              US coronavirus lockdown began, in front of a smaller than
  The first two dates correspond to the days that followed the                          expected crowd in Tulsa, Oklahoma.
                                                                                      • Finally, a crucial topic, previously undocumented in the
9 https://www.oneindia.com/india/key-takeaways-from-pm-modi-s-address-to-               N = 12 solution, becomes particularly relevant around the end
nation-on-june-30-3112740.html                                                          of May. This topic is labeled as “lives|pandemic|police” and

Frontiers in Communication | www.frontiersin.org                                  8                                      March 2021 | Volume 6 | Article 651997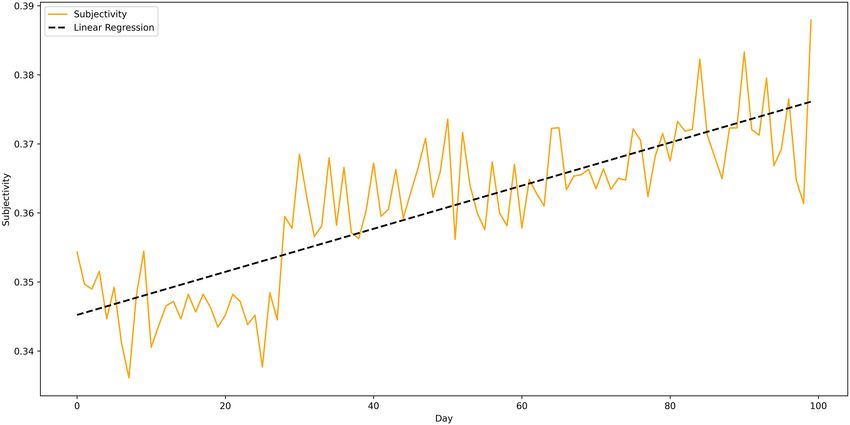
Wicke and Bolognesi                                                                                                                     Covid-19 Discourse on Twitter

 FIGURE 6 | Event-related analysis of the N = 12 topic development. The three bands (first week of April, fourth week of April and fourth week of May) have been
 highlighted, and possible correlated events are provided in labeled text boxes.

   its appearance collides with the murder of African American                          specific guidelines for Public Health and Social Measures for
   George Floyd, by police officers. This is further described in                       the COVID-19 Pandemic.
   relation to the most fine-grained topic solution, N = 64.                          • A substantial increase of tweets within the topic
                                                                                        “social|mask|distancing” observed in June, concurrently
We also acknowledge a couple of concentrations of
                                                                                        with the gradual reopening of various countries and the need
tweets on 18th May in the topics labeled, respectively, as
                                                                                        to remind people to keep safe distance.
“video|Youtube|watch|live” and “open|house|week|close,” for
which we were not able to identify any specific event that may be                     Finally, the N = 64 topic development provides the most fine-
associated with this specific date.                                                   grained analysis of the topics. These are reported in Figure 7.
   The N = 32 cluster solution, which is more fine-grained than                       Here it can be observed that many events already mentioned in
the previous solutions described above, displays a few interesting                    the previous analyses are captured also by this model. Moreover,
trends in addition to those emerging from previous analyses:                          the more detailed analysis reveals an increase of the topic
                                                                                      “india|spreading|indian” around the 31st March, in addition
• A peak of tweets can be noted on 18th May on the topic
                                                                                      to the peaks observed and described in the previous models.
  “government|state|control,” which may precede by a couple of
                                                                                      Around this time India and Pakistan intensified their efforts to
  days the official CDC announcement (probably leaked by the
                                                                                      contact-tracing participants of the Tablighi Jamaat coronavirus
  press a few days before its official release). This peak coincides
                                                                                      hotspot in Delhi with more than 4,000 confirmed cases.11 We
  with the introduction of a Community Mitigation Framework
                                                                                      therefore take this feature of the N = 64 model as a good
  that includes updated guidance for communities, schools,
                                                                                      example of the topic modeling capturing local events with a
  workplaces, and events to mitigate the spread of COVID-19.10
                                                                                      greater number of topics.
  This is also related to a peak in the topic “vaccine|cure|disease,”
                                                                                         Focusing on the latter half of the 100 days, we can explore how
  observed on 19th May.
                                                                                      apparently unrelated topics are entering the Covid-19 discourse.
• A peak of tweets on the topic “fucking|house|stupid” is
                                                                                      For example, on Saturday 23rd May we can observe an increase
  observed on 1st April, when the WHO issued a report with

                                                                                      11 https://www.washingtonpost.com/world/asia_pacific/india-
10 https://www.cdc.gov/coronavirus/2019-ncov/downloads/php/CDC-Activities-            coronavirus-tablighi-jamaat-delhi/2020/04/02/abdc5af0-7386-11ea-ad9b-
Initiatives-for-COVID-19-Response.pdf                                                 254ec99993bc_story.html

Frontiers in Communication | www.frontiersin.org                                  9                                            March 2021 | Volume 6 | Article 651997
Wicke and Bolognesi Covid-19 Discourse on Twitter
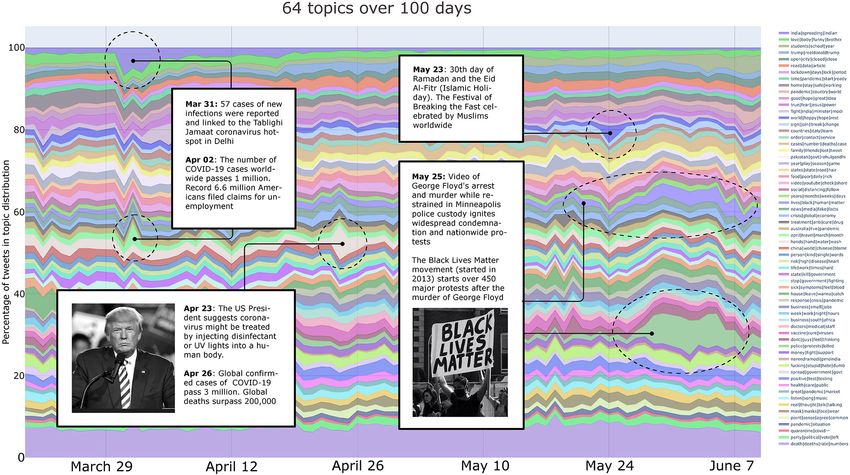
FIGURE 7 | Event-related analysis of the N = 64 topic development. The related events (white boxes) are linked to anomalies, peaks in the topic development (circular
marks). Photograph left: Donald Trump speaking with supporters at a campaign rally (Credit: Gage Skidmore. Under CC A-SA 2.0 Generic License. Desaturated.)
Photograph right: Black Lives Matter protest (Credit: Kety Duran @ketyduran).
for the topic labeled “world|happy|hope|rest.” Upon closer Matter (BLM) movement has gained momentum after the
investigation of the topic model, we identify the related topic murder of George Floyd. Also, this topic is discussed in relation
words: “allah,” “pray,” “save,” “bless,” “month,” and “protect”. This to Covid-19.
might refer to the end of Ramadan and the Eid Al-Fitr (festival
of breaking the fast), since it correlates directly with the words Discussion
“month,” “pray,” “allah,” and “bless.” These topics at first sight The topic analyses show different trends. The less granular
might appear to be unrelated to COVID-19. However, these are analysis, based on a limited number of topics (N = 12) shows a
extracted from tweets that feature one or more of the COVID-19- macro distinction into topics of discussion, where general themes
related keywords. Tweeters are therefore likely to have expressed emerge. Conversely, the more the number of topics increases, the
some connection between these events and the pandemic. more the tweets are partitioned into smaller clusters, which are
Finally, on the 25th May a video of African American George more thematically coherent and seem to capture more specific
Floyd’s arrest and murder while under restraint in Minneapolis events reported by the media and discussed by the Twitter
police custody shows the moment when he was pinned to the users. Overlaps can be observed as well, across the various topic
ground by a police officer for 8 min and 46 s. This video ignited modeling solutions, with some trends emerging in generic as well
widespread condemnation and Nationwide protests in the U.S. as in more granular topic models. Nevertheless, we showed that a
In Figure 7, despite the large number of topics displayed, we can multiple approach to the data partitioning provides a better view
clearly observe how this event has affected the discourse about into the data trends.
the COVID-19 pandemic. On the 25th May the topic labeled The explorative nature of the topic modeling approach allows
“police|protests|killed” shows a great concentration of tweets. analysts to mine large collections of linguistic data in a bottom-
The most important words in this topic are: “police,” “protests,” up manner, to observe tendencies of language use emerging from
“killed,” “dead,” “protest,” “thousands,” “killing,” “mass,” “riots,” authentic texts. However, it should be acknowledged that the
and “protesting.” Although it might appear that this topic is association of linguistic trends to specific events reported in the
related to a different set of events, it is worth remembering news, is an interpretative process subject to a degree of variability.
that all the tweets on which the analysis is performed showcase Although we based our interpretations on the keywords emerged
a keyword associated to Covid-19 and its variants. At the from the topic models and on major sources of information such
same time, the graph shows an increase for the topic labeled as the WHO and the CDC websites, in principle it could be
“lives|black|human|matter,” which indicates how the Black Lives argued that different (but related) events reported in the media
Frontiers in Communication | www.frontiersin.org 10 March 2021 | Volume 6 | Article 651997Wicke and Bolognesi Covid-19 Discourse on Twitter
might have explained the changes in topics observed though our could only explain 8.8% of the variance of the data (R2 :
topic modeling analyses. 0.088, p > 0.003, F-statistic = 9.480). Therefore, we modeled a
polynomial function of second degree (Figure 8, curved dashed
black line) with f (x) = 0.0513+0.0006x−0.000007x2 . Assuming
WHAT VALENCE EMERGES FROM THE
this non-linear correlation between time and polarity is a better
TWEETS ABOUT COVID-19 AND HOW fit (R2 : 0.356, p < 0.001, F-statistic = 26.81), and explains 35.6%
DOES IT CHANGE OVER TIME? of the variance. Notably, higher polynomials provide even better
fit, yet they do not serve our investigation to identify a simple
Methods trend and can overfit our data.
For each of the 100 days in our corpus, the average polarity of the
As Figure 8 shows, the sentiment scores are displayed on an
words used in the tweets was assessed using the TextBlob library
inverted U shape, which suggests that the sentiments expressed
(Loria et al., 2014). The obtained polarity score was a numeric
by the tweets are increasingly positive from the beginning of our
value within the range [−1.0, 1.0] where −1.0 represents a very
timeframe to averagely the middle of the interval (therefore, from
negative sentiment and 1.0 represents a very positive sentiment.
20 March to the beginning of May) and then drop toward the
TextBlob’s sentiment analysis (previously applied to Twitter
negative end of the valence spectrum.
data, see Hawkins et al., 2016, Reynard and Shirgaokar, 2019) is
based on the Pattern library, which uses a lexicon of hand-tagged
adjectives, with values for polarity and subjectivity (De Smedt and Discussion
Daelemans, 2012). The overall sentiment polarity over 100 days emerging from the
After calculating the sentiment scores, we identified the tweets in the corpus is slightly positive (>0). The polynomial
most appropriate function to describe the change of sentiment regression indicates that the average sentiment is increasingly
emerging from the distribution of the tweets over time. For that, more positive during the first 40 days of the pandemic, while
we started by using a polynomial regression (f (x) = β0 + β1 x1 + it drops dramatically in the second half of the timeframe.
β2 x2 + . . . + βN xN + ε where ε is an unobserved random error). We interpret this trend in the following way. Within the first
Specifically, we performed an ordinary least-squares regression month of the pandemic, the general attitude of the population
for an increasing polynomial degree until we explained much of tended to be slightly optimistic. These first 40 days refer to the
the data variance with significant confidence. last 10 days of March and the whole month of April. Many
countries during this period were in lockdown, and despite the
Results fear toward the unknown situation, a positive attitude, even
Figure 8 reports the average polarity scores for each of the 100 though only verbally expressed in the tweets, might have been
days in the corpus. A linear function (f (x) = 0.0622 − 0.0001x) a form of mutual encouragement. This is the period in time
FIGURE 8 | Average polarity scores for the tweets over the 100 days. Fitted polynomial regression to approximate the development of polarity over time is depicted
as a dashed black line.
Frontiers in Communication | www.frontiersin.org 11 March 2021 | Volume 6 | Article 651997Wicke and Bolognesi Covid-19 Discourse on Twitter
where a series of positively framed hashtags began to emerge, from tweets that express sarcastic comments toward the current
such as #StayHome, #FlattenThe Curve, #StayHomeSavesLives, situation, which might need to be classified as negative even
encouraging people to embrace the difficult situation and hold though they feature words loaded with positive feelings.
on tight, in order to fight together against the virus. This is
the type of attitude expressed by the collective mind, emerging HOW DOES THE SUBJECTIVITY OF THE
from Twitter. An example that summarizes this attitude is the
following tweet, which was anonymized, in compliance with the
TWEETS (I.E., OPINION-BASED FOCUS,
Twitter regulations: VS. THE OBJECTIVE FACT-BASED FOCUS)
CHANGE OVER TIME?
“Probably for the best, don’t need everyone’s grubby hands
digging in them spreading corona virus around. #brightside” (20th Methods
March 2020) The TextBlob tool for Sentiment Analysis provides a subjectivity
score in addition to the polarity score. The subjectivity score is
It should be noticed that during this first phase (March/early in the range [0.0, 1.0] where 0.0 is very objective (facts) and
April), the financial and societal repercussions of the lockdown 1.0 is very subjective (opinions). As for the previous analysis,
were not yet as obvious and impactful as in the latter half we averaged the subjectivity scores for each day and then
of the 100 days (May/June). During the later dates in fact, we identified the most appropriate function to describe the
the attitude in the collective mind of the population dropped changes in subjectivity. For that, we used an ordinary least-
substantially, toward a much more negative end. The following squares regression for an increasing polynomial degree until the
tweet exemplifies this trend (polarized toward the negative end): function could explain a large portion of data variance with
significant confidence.
“Bullshit!!! Our country is the worst in the world for the pandemic
because of you, not China. Stop blaming everyone else & trying to
Results
defect blame. The state of our country is your fault & yours alone. The result for the subjectivity score over 100 days is depicted in
RESIGN!!!” (1st July 2020) Figure 9. A linear regression for the subjectivity scores indicated
a good fit. The linear regression f (x) = 0.3452 + 0.0003x showed
This trend toward negative sentiments arguably signals a change R2 = 0.69, F-statistics = 1.06e−26 and highly significant p <
in the general well-being of the population in relation to the 0.0001, implying that about 69% of the variability in subjectivity
current pandemic. In line with previous research, we believe that scores is explained by passing days.
keeping track of the polarity of the sentiments expressed on social Here we report an exemplar tweet produced on 20th March,
media may be beneficial to health practitioners and politicians. which is associated with a value of 0 subjectivity, which means
They could potentially understand what will be the most effective that the text is likely expressing facts rather than opinions, and it
measures to contrast the degeneration of the general well-being of is objective rather than subjective:
the population. For example, it may be suggested that restrictive
measures such as hard lockdowns imposed in during period “things corona has done to us: made us wash our hands canceled
allergy season/ coughing and sneezing otherwize people think we
when the general feelings are particularly negative, may lead to
are possessed” (20th March 2020)
extreme and undesirable individual and collective actions.
As a caveat of our analysis, it should be acknowledged the fact
This tweet expresses substantially factual information, even
that TextBlob (as many other lexical approaches to sentiment
though colored with a quite humoristic nuance. This type of
analysis) does not distinguish genuine positive sentiments from
objectivity can be compared with the following tweet, also
sarcastic ones. This is an open issue in sentiment analysis, and
produced on 20th March, and also colored with a humoristic
a major bottleneck in machine learning in general, which is
nuance, in which the author indicates a different type of
currently being tackled by scholars that are developing tools
consequence associated with Covid-19:
for the automatic detection of sarcasm and irony (Ghosh and
Veale, 2016, Reyes et al., 2013). The issue is exemplified by the
“a guy just messaged me and said “if corona doesn’t take you out
following tweet: can i?” literally the worst thing coronavirus has done is fuel men’s
terrible flirting rhetoric” (20th March 2020)
“Best healthcare system in the world ” (1st July 2020)
The latter tweet is one of the few examples of tweets associated
While the average polarity of this tweet leans toward the positive with high subjectivity scores, produced early in our time frame
end, the pragmatics of this message and the use of specific (20th March). Comparing the former with the latter tweet, it
emoji that express negative emotions such as skepticism and becomes clear why the former tweet scores low on subjectivity:
frustration, suggests that the user is being sarcastic. Therefore, while in the first case Covid-19 is associated with washing
the tweet would need to be interpreted as emotionally negative. hands and avoiding sneezing (even though canceling allergy
The real polarity of the tweet is, in this case, carried by the emoji, season is a hyperbolic statement), in the second case Covid-
rather than by the verbal text. Further research might need to 19 is associated with fueling men’s terrible flirting rhetoric.
disentangle genuinely positive tweets related to the pandemic The negative judgment toward specific flirting techniques is
Frontiers in Communication | www.frontiersin.org 12 March 2021 | Volume 6 | Article 651997Wicke and Bolognesi Covid-19 Discourse on Twitter
FIGURE 9 | Average subjectivity scores for the tweets over the 100 days. Fitted linear regression to approximate the development of subjectivity over time is depicted
as a dashed black line.
arguably subjective, and so it is the attribution of its responsibility “maybe being stupid is a pre-existing condition that makes you
to Covid-19. susceptible to the corona virus?” (1st July 2020)
An example of tweet that scores in the middle of the
subjectivity scale (subjectivity = 0.5), posted on 10th May, in the In this tweet, the high subjectivity is given by the fact that the
middle of our time frame, is the following: tweeter introduces the statement with a “maybe,” which signals
a possibility, which in turn suggests that this is an opinion, and
then proposes stupidity (a highly subjective human trait) as a
“I want to say Trump but Covid-19 is a bigger threat to the world”
pre-existing condition possibly associated with Covid-19.
(10th May 2020)
Discussion
This tweet, as most tweets, uses elliptical language in which words The subjectivity analysis displayed in Figure 9 shows that with
and punctuation are omitted. From a pragmatic perspective this the development of the pandemic, Twitter users tend to focus
opens up the field to various possible interpretations. In our more on their own introspections and to express increasingly
opinion, this tweet seems to express two meanings: [1]. Trump more (subjective) opinions than (objective) facts. In other words,
is a big threat to the world, and [2]. Covid-19 is a bigger threat the subjectivity of the tweets increases linearly, as a function of
to the world than Trump. These two meanings are expressed time, as we had hypothesized.
linguistically in a way that helps the tweeter build a rather Taken together with the previous analysis, the subjectivity and
sophisticated argumentation. First, the tweeter suggestes to the polarity trends suggest that in the beginning of the pandemic
reader that she thinks that Trump is a big threat to the world. Twitter users tended to communicate and rely on facts. They
She expresses this statement as an opinion (“I want to say. . . ”). expressed little emotional content, which was initially averagely
Then, the tweeter introduces the second part as an assertive negative. It is possible that this was characterized by feelings
statement (Covid-19 is a bigger threat to the world than Trump). of fear toward the unknown situation. This initial negativity
Here the tweeter wants the reader to take this statement as was followed by a positive trend concurrent with the lockdown
an objective, factual piece of information. In this construction, measures that characterized several English-speaking countries.
the first statement contributes to build the perceived objectivity During these weeks, despite the difficulties experienced by many
expressed in the second statement. As a result, the average families, it is possible that a sense of community and need for
subjectivity of the tweet scores a medium value. mutual encouragement led Twitter users to post tweets that were
Finally, an example of a tweet produced on 1st July (end of the on average more positively valenced than those posted in the
time frame), associated with a high subjectivity value (subjectivity previous weeks. The trend dropped again toward the negative
= 1) is the following: end of the scale around the end of April, through May and June.
Frontiers in Communication | www.frontiersin.org 13 March 2021 | Volume 6 | Article 651997You can also read