Absorption of 5G Radiation in Brain Tissue as a Function of Frequency, Power and Time
←
→
Page content transcription
If your browser does not render page correctly, please read the page content below
Received June 2, 2020, accepted June 7, 2020, date of publication June 12, 2020, date of current version July 2, 2020.
Digital Object Identifier 10.1109/ACCESS.2020.3002183

Absorption of 5G Radiation in Brain Tissue as
a Function of Frequency, Power and Time
DAVID H. GULTEKIN                    1,2   AND PETER H. SIEGEL                  2,3,4 ,   (Life Fellow, IEEE)
1 Zuckerman   Mind Brain Behavior Institute, Columbia University, New York City, NY 10027, USA
2 THz Global, La Cañada Flintridge, CA 91011, USA
3 Jet Propulsion Laboratory, National Aeronautics and Space Administration, Pasadena, CA 91109, USA
4 Department of Electrical Engineering, California Institute of Technology, Pasadena, CA 91125, USA

Corresponding authors: David H. Gultekin (dg3155@columbia.edu) and Peter H. Siegel (phs@caltech.edu)
This work was supported by THz Global.

  ABSTRACT The rapid release of 5G wireless communications networks has spurred renewed concerns
  regarding the interactions of higher radiofrequency (RF) radiation with living species. We examine RF
  exposure and absorption in ex vivo bovine brain tissue and a brain simulating gel at three frequencies:
  1.9 GHz, 4 GHz and 39 GHz that are relevant to current (4G), and upcoming (5G) spectra. We introduce
  a highly sensitive thermal method for the assessment of radiation exposure, and derive experimentally,
  accurate relations between the temperature rise (1T ), specific absorption rate (SAR) and the incident power
  density (F), and tabulate the coefficients, 1T /1F and 1(SAR)/1F, as a function of frequency, depth and
  time. This new method provides both 1T and SAR applicable to the frequency range below and above
  6 GHz as shown at 1.9, 4 and 39 GHz, and demonstrates the most sensitive experimental assessment of brain
  tissue exposure to millimeter-wave radiation to date, with a detection limit of 1 mW. We examine the beam
  penetration, absorption and thermal diffusion at representative 4G and 5G frequencies and show that the
  RF heating increases rapidly with frequency due to decreasing RF source wavelength and increasing power
  density with the same incident power and exposure time. We also show the temperature effects of continuous
  wave, rapid pulse sequences and single pulses with varying pulse duration, and we employ electromagnetic
  modeling to map the field distributions in the tissue. Finally, using this new methodology, we measure the
  thermal diffusivity of ex vivo bovine brain tissue experimentally.

  INDEX TERMS 4G, 5G, microwaves, millimeter-waves, wireless, RF absorption, RF safety, RF heating,
  bovine brain tissue, Triton gel.

I. RESEARCH MOTIVATION                                                                         extensive information and communications technologies has
There is an increasing trend to implement information and                                      set up an intense international competition for acquiring the
communications technologies with much higher data trans-                                       all-embracing infrastructure with strong implications for eco-
mission rates. More than half of the world’s population is now                                 nomic growth, defense and national security [3]–[5].
online, and nearly the entire world population is within the                                      The overall data capacity depends on the cell density, spec-
reach of a mobile cellular network [1], [2]. The forthcom-                                     tral efficiency and frequency bandwidth. Current technical
ing fifth generation (5G) wireless communications system                                       performance requirements need both new radio broadcast
will extend the existing networks beyond the already nearly                                    technologies and much broader spectrum [1], [2]. A preferred
seven billion current cell phone users and into the realm of                                   method for realizing the spectrum requirements is to use
the Internet of Things, potentially linking trillions of wire-                                 higher frequencies, specifically the millimeter-wave bands
less devices [1], [2]. The identified 5G use cases are based                                   between 30 and 300 GHz. Also, increasing the frequency and
largely on enhanced mobile broadband, massive machine-to-                                      decreasing the corresponding wavelength allows for minia-
machine communications and ultra-reliable and low latency                                      turization of antennas, base stations and wireless-enabled
communications [1], [2]. The strategic importance of such                                      devices, making them more suitable for enhancing the cell
                                                                                               density. However, millimeter waves have short ranges of
   The associate editor coordinating the review of this manuscript and                         propagation, they are absorbed by water vapor and oxygen
approving it for publication was Derek Abbott            .                                     in the atmosphere, by vegetation, very strongly by water

                     This work is licensed under a Creative Commons Attribution 4.0 License. For more information, see https://creativecommons.org/licenses/by/4.0/
VOLUME 8, 2020                                                                                                                                                        115593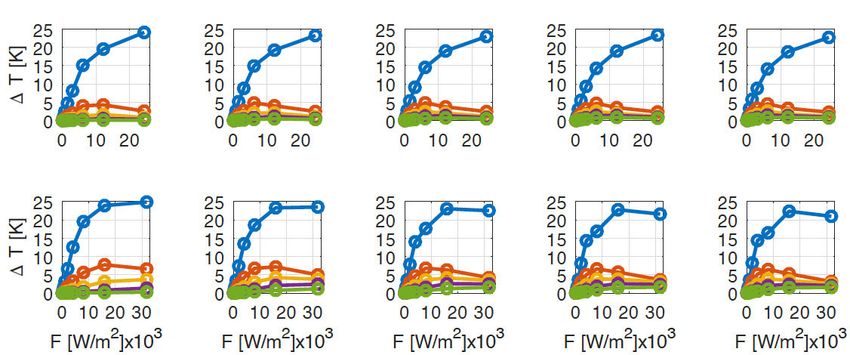
D. H. Gultekin, P. H. Siegel: Absorption of 5G Radiation in Brain Tissue as a Function of Frequency, Power and Time

in the tissues of people and animals, and they are readily                estimate the absorption at very low RF power levels. Setting
reflected off, and scattered by, small metallic and dielectric            such thresholds would then no longer be a subject of debate.
objects, urban clutter and large manmade and natural struc-               Ultimately, the temperature effects on physical, chemical,
tures [6]–[8]. Overcoming these limitations by increasing                 electrochemical and biological processes are complex and
the cell density, increases cell interference and necessitates            may register as positive, negative or null effects in specific
higher directivity and hence higher power density. Increasing             tissues or organisms [44], [45].
the frequency and bandwidth requires significant spectral                     Despite the controversies over studies of existing wire-
fencing at the expense of other applications.                             less systems up to 1.9 GHz (4G), the beam penetration,
   Currently, the sub-6 GHz spectrum is very crowded, and                 absorption and thermal diffusion effects of millimeter-waves
already includes 3G/4G cellular, GPS, Wi-Fi, L-band satel-                (5G) in tissues differ significantly from 4G values. Although,
lite, S-band and C-band radars and other allocations. In order            it is common to extrapolate lower frequency absorption and
to reduce the interference and power requirements, and to                 temperature rise by relying on pre-measured tissue dielec-
improve the range and spectral efficiency, one solution for 5G            tric characteristics and electromagnetic models to set safety
is network densification, which employs a massive number                  requirements throughout the millimeter-wave bands, such
of smaller cells and a massive number of smaller antennas                 models do not generally take into account detailed RF beam
in each base station with high directivity electronic beam                characteristics, thermal diffusion and convection, or specific
forming and steering capabilities [9]. The number of transmit             exposure geometries and conditions. We believe there is both
and receive antennas per base station will typically increase             a clear need, and a lot to learn by introducing simple exper-
with increasing frequency for indoor hotspots as well as to               imental methods that extend the lower frequency investiga-
enable dense urban and rural mobile broadband coverage.                   tions on specific tissues over the entire 5G frequency range.
Upcoming mobile communication networks will use multi-
band radios with a combination of low, mid and high band                  II. INTRODUCTION TO THIS STUDY
frequencies to optimize the coverage and capacity [10]. As of             In earlier work, the effects of microwave radiation on the
today, the allocated bands have been broadly specified as                 brain metabolic activities in human volunteers exposed to
below or above 6 GHz and labeled as: low-band (600, 800                   cell phone radiation were studied in vivo by Positron Emis-
and 900 MHz); mid-band (2.5, 3.5 and 3.7-4.2 GHz); and                    sion Tomography (PET) [46], and we studied, by Magnetic
high-band (24, 26, 28, 37, 39, 42 and 47 GHz) with remaining              Resonance Imaging (MRI), the absorption characteristics
unlicensed bands above 95 GHz [10].                                       of 1.9 GHz radiation in ex vivo bovine brain tissue exposed to
   Despite standards set by the FCC and RF communities,                   a realistic cell phone antenna by measuring the temperature as
absorption of electromagnetic radiation in biological tissues             a function of power and exposure time [47]. Cell damage and
has been, and continues to be, a public concern [11]–[16].                cell death rate are a function of temperature and time of the
This will become more so with the upcoming deployment of                  exposure [48], [49]. There is a growing interest in using the
large numbers of higher frequency and higher power devices                temperature-time diagrams and thermal dosimetry to assess
with increased directionality as 5G rolls out. Some of the rel-           power absorption in biological tissue as a measure of safety.
evant early studies have tried to accurately assess biological            The SAR varies spatially and temporally in the tissue and it
interactions and effective absorption rates of high frequency             often requires averaging over a prescribed mass or volume.
RF with both humans and animal models [17]–[38].                          The measurement of SAR by thermal methods is also com-
   There are also ongoing studies that assess the established             plicated and it requires the determination of thermal transport
guidelines [39], [40] for exposure to the upcoming 5G high                parameters [47], [50]–[52] to assess SAR accurately.
frequency bands. Recently, the International Commission on                   In this paper, we extend and compare our earlier 1.9 GHz
Non-Ionizing Radiation Protection (ICNIRP) revised their                  study [47] and characterize the fundamentals of absorption
guidelines and the Institute of Electrical and Electronics                and subsequent heating of both microwave and millimeter-
Engineers (IEEE) revised the C95.1 standard so as to use the              wave radiation in ex vivo bovine brain tissue and a gel sim-
specific absorption rate (SAR) below 6 GHz and absorbed                   ulant as a function of frequency, power, exposure time, and
power density (PD) above 6 GHz [39], [40]. The current                    penetration depth at 1.9 GHz (overlap with 4G), 4 GHz (lower
approaches taken generally, use direct measurement of radi-               end of the 5G band) and 39 GHz (high end of the 5G band).
ation from the transmitting devices through a probe moving                We use a very simple and flexible test system with accu-
in a three-dimensional grid in a tissue simulating fluid [41]             rately characterized, single mode rectangular waveguide RF
or use modeling and software simulations to predict SAR                   power insertion, which has well-defined and well-confined
in biological media [42]. Although, the research community                beam characteristics. We introduce an easy to implement,
continues to debate between thermal and nonthermal effects                and very accurate tissue embedded thermal measurement
of absorbed radiation at particular SAR levels [43], we pro-              method, capable of measuring both temperature rise (1T )
pose that such distinctions may essentially be related to the             and specific absorption rate (SAR) versus incident power
detection limits of absorption in biological tissue at very low           density (F), universally applicable to the entire 4G and 5G
levels. Once an accurate dependence of the thermal constants              frequency range without making the distinctions below and
and mechanisms are established, it is possible to accurately              above 6 GHz.

115594                                                                                                                                   VOLUME 8, 2020
D. H. Gultekin, P. H. Siegel: Absorption of 5G Radiation in Brain Tissue as a Function of Frequency, Power and Time
There have been a number of prior studies in the microwave
and millimeter-wave bands on the dielectric properties of
brain tissue [53]–[56], tissue and head modeling [57]–[60]
and RF energy exposure modeling [61]–[68]. Here, we study
simultaneously the effects of beam penetration, absorption
and thermal diffusion in brain tissue through real-time tem-
perature measurements during the irradiation. This study
provides a broad range of experimental measurements in
the tissue that can be useful for computational RF exposure
modeling and simulations.
We derive experimentally very accurate thermal coef-
ficients (1T /1F and 1(SAR)/1F) versus frequency and
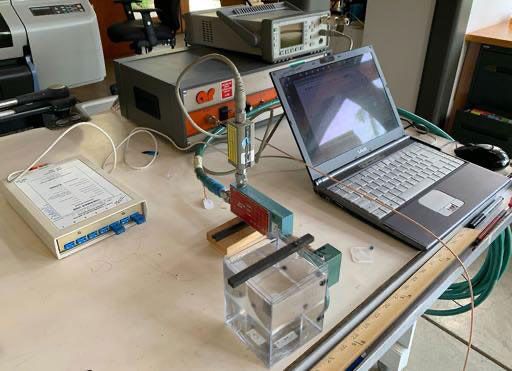
depth in the tissue, and correlate with well-defined RF beam FIGURE 1. Experimental setup showing the waveguides (1.9, 4 and
39 GHz), specially fabricated wooden holders, plexiglass cubes containing
pattern distribution and penetration. We believe that our brain and gel, thermocouples, signal generators and radiofrequency
very carefully calibrated temperature versus depth profiles, amplifiers.
well-defined RF beam patterns and incident power density
values, and simple and flexible RF test system are unique but
widely applicable. Our experimentally derived and tabulated [71], [72], the waveguides were always oriented so that the
1T /1F and 1(SAR)/1F coefficients at each frequency can electric field had minimal coupling to the embedded thermo-
be used to assess the magnitude of heating and specific couple wires. Specific details for each exposure frequency
absorption rate at any depth given the power exposure, even follow the sample descriptions.
to values which would normally be below measurable lev- For this study, three single mode rectangular waveguides
els using standard thermal sensors. We show that the use (WR) with internal dimensions (ID) and aperture areas (A)
of common gel simulants that have been employed for 4G (WR-430, pass band 1.7-2.6 GHz, ID: 109.2 × 54.6 mm,
experiments are applicable only over a low range of power A: 5962.3 mm2 ; WR-187, pass band 3.95-5.85 GHz, ID:
and exposure time for 5G frequency bands, especially in the 47.5 × 22.1 mm, A: 1049.8 mm2 ; and WR-28, pass band
millimeter-wave range. 26.5-40 GHz, ID: 7.1 × 3.6 mm, A: 25.6 mm2 ) were used
We also show experimentally, the effects of rapid pulsing for beam forming and directing the microwave power into
of the RF power at different pulse lengths (1 µs, 1 ms and 1 s) the medium in a well determined exposure pattern (see
at 50% duty cycle in the gel and single pulses of short (1 s) Appendix). The waveguides were operated at frequencies
and long (30 s) duration with on/off RF cycles in both brain of 1.9 GHz, 4 GHz and 39 GHz corresponding to wavelengths
tissue and gel. Using our measurements here and our prior of 157.8 mm, 74.9 mm and 7.7 mm, respectively. They were
MRI studies to derive thermal parameters [47], [50], [51], held tightly, and in a predetermined position, against the
[69], [70], we derive an accurate thermal diffusivity coeffi- sample cubes using rubber bands and wooden (low thermal
cient for the ex vivo bovine brain tissue. These measurements constant) positioning jigs. The waveguide E-field was ori-
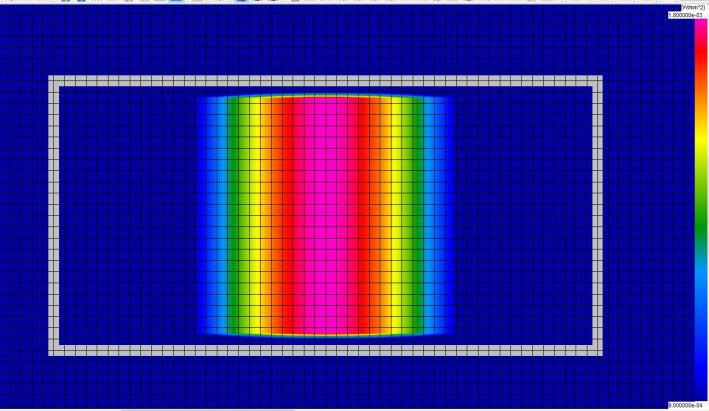
are supported by finite difference time domain simulations ented so that it was always perpendicular to the plane of
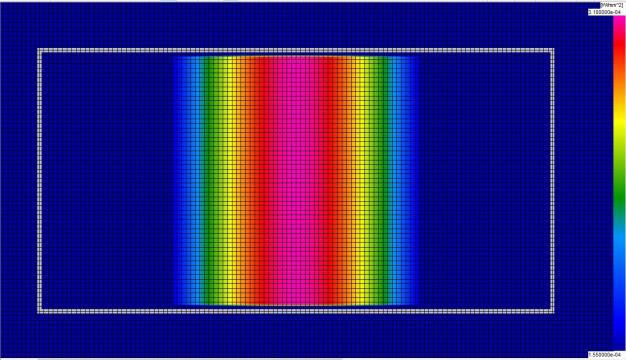
(Appendix) showing in detail, the distribution of RF source the embedded thermocouple wires, and no coupling of RF
power with depth and surface area in the tissue. power to the wires themselves was detectable. The thermo-
couple tips were positioned at the end of their glass capillary
III. DETAILED EXPERIMENTAL METHODS tube holders and aligned to the axial center of the different
A compact and frequency agile experimental system was waveguides.
designed to study the absorption of electromagnetic waves in Depending on the aperture size of the waveguides, three
ex vivo brain and brain equivalent gels as a function of power, different PMMA plastic cubes were utilized. At 1.9 GHz,
frequency and exposure time. Fig. 1 shows the experimental a cube with ID: 147 × 147 × 147 mm and 3 mm wall thick-
setup. The brain and gel samples were contained in thin wall ness, held the gel and required a total of 7 individual bovine
cubic plastic Poly(methyl methacrylate) (PMMA) containers brains each of which was approximately 450 g. A cube, with
and illuminated with RF through the container walls using ID: 96 × 96 × 124 mm and 2.25 mm wall thickness, was used
standard TE10 mode rectangular waveguides. The sample for the gel and the brain at 4 GHz and 39 GHz. This cube was
temperature was monitored axially along the center of the filled by approximately 3 bovine brains. Also, a cube, with
waveguide aperture with inserted thermocouples housed in ID: 84 × 84 × 109 mm and 1.9 mm wall thickness was used
glass capillary tubes. The incident microwave power was pre- just for the gel measurements at 39 GHz at the lower power
calibrated at the waveguide output and derived from a variety levels.
of synthesized continuous wave sources and power amplifiers The reflection coefficients (Rs ) were measured as 0.092,
that were connected to the waveguides through coaxial cable. 0.116 and 0.086 for the plastic walls alone, and as 0.47,
Since the brain tissue and gel samples have no preferential 0.45 and 0.37 for the plastic walls and brain tissue combined,
polarization direction at these wavelengths [19], [25], [26], and using an FDTD simulator, the 10dB power (0.9P), spot
VOLUME 8, 2020 115595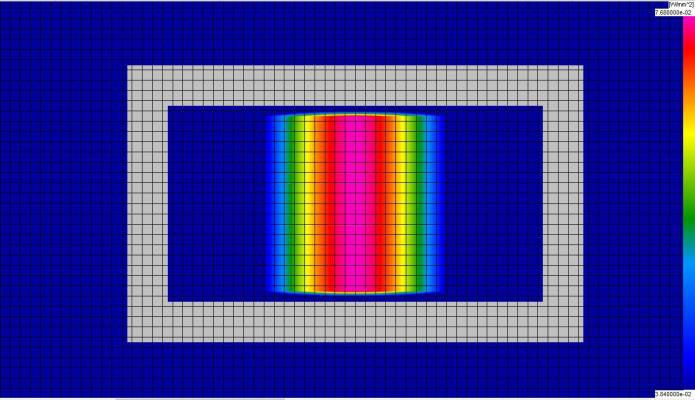
D. H. Gultekin, P. H. Siegel: Absorption of 5G Radiation in Brain Tissue as a Function of Frequency, Power and Time

sizes (As ) on the tissue surface were computed as 5932.80,                that measures the real and imaginary parts of the dielectric
1304.16 and 49.60 mm2 at 1.9, 4 and 39 GHz, respectively.                  constant over the frequency range 1-40 GHz. Other derived
The incident power density (F) on the tissue surface was                   dielectric properties for the samples are given in Table 10 of
calculated from the incident power (P) in the waveguide as                 the Appendix.
F = PR where R = 0.9(1 − Rs )/As or 137.7, 613.2 and                          For generating the microwave power used to irradiate the
16577.6 m−2 for the three waveguide sources and plastic                    samples, a variety of calibrated signal sources were employed
containers, respectively. If we exclude the plastic wall then              at the three frequencies, 1.9, 4 and 39 GHz, depending on
R = 1/A or 167.72, 952.61 and 39,123.63 m−2 using the                      the power level required. In all cases a precise synthesized
aperture areas (A) for the three waveguides. We used the 10dB              continuous wave signal was employed either directly or as
spot power density on the tissue surface including the plastic             input to a power amplifier. At 1.9 and 4 GHz an HP 8340A
walls in our calculations but the results can be scaled using              (Hewlett Packard) signal generator was coupled to an AR
the ratio of the two R values, since the measurement trend is              5SIG4 (AR World) traveling wave tube (TWT) amplifier
linear with our range of power levels.                                     (maximum output 5W). At 39 GHz, for the gel measurements,
   The ex vivo bovine brains were used per a specimen per-                 one output port of an Agilent 8722ES vector network analyzer
mit issued by the United States Department of Agriculture                  was linked to an AR 25T26G40 TWT, and for the brain sam-
(USDA) Food Safety and Inspection Service (FSIS) in com-                   ple measurements a Keysight E8257D was used along with
pliance with the Institutional Animal Care and Use Com-                    a custom solid-state Gallium Nitride (GaN) power amplifier
mittee (IACUC) and Institutional Review Board (IRB). The                   supplied by the NASA Jet Propulsion Laboratory. In order to
brain tissue is classified as specific risk material (SRM) by              produce the single pulse measurement data, the synthesizer
USDA for bovine spongiform encephalopathy (BSE) or mad                     power was manually turned on/off during the experiments in
cow disease, and was extracted from the animals less than                  conjunction with a simple timer. For modulated RF power
30 months of age in a local USDA plant, transported to the                 measurements, a separate waveform generator (HP 3312A)
lab and tested the same day at room temperature in accor-                  was applied to the synthesizer output channel to generate a
dance with the USDA, FSIS, IACUC and IRB guidelines.                       square wave input signal of the desired length and duty cycle.
We thought about performing measurements on frozen and                     In all cases, the power output at the waveguide aperture was
thawed samples, to avoid the problem of tissue spoilage when               pre-calibrated using an Agilent 8481A thermocouple power
samples were measured over long periods at room temper-                    sensor and E4419B display unit to measure the losses in all
ature. However, when we compared the measured complex                      the utilized cables, coax-to-waveguide converters, attenua-
dielectric constant of frozen-then-thawed bovine brain, with               tors, and connector adapters and wherever possible, mon-
fresh bovine brain, we saw significant deviations (likely due              itored during the actual measurements. In some cases, the
to water content) and hence were unable to utilize the frozen              power levels were too high to directly monitor the RF output
samples (see Appendix).                                                    of the amplifier, so calibrated attenuators were used to pre-
   A gel formulation (62.7% water, 36.8% Triton X-100 and                  measure power levels output from the synthesizer against
0.5% NaCl) was used to compare the radiation from a waveg-                 amplifier output levels, after the amplifier was determined to
uide to a half-wavelength dipole antenna (λ/2) at 1.9 GHz                  be in its linear range: Pout /Pin = constant.
in our previous study [47], [73]. This gel is well matched in                 An Agilent vector network analyzer and specially designed
dielectric properties (index and absorption) to the brain tissue           liquid immersion probe (Keysight 85070E) were used to
at 1.9 GHz, although it deviates as the frequency increases                record the real and imaginary dielectric constant for all
(see Fig. 11 in Appendix).                                                 the samples between 1 and 40 GHz. A fresh brain sample
   Typical radial beam power distribution plots computed                   acquired 1.5 hours before testing was measured along with
using a well vetted commercial finite difference time                      a sample that had been acquired two weeks earlier, frozen
domain (FDTD) code (Quickwave, QWED Ltd., Warsaw,                          and then thawed for 7 hours at room temperature. The gel
Poland), are shown in the brain tissue at various thermo-                  and deionized (DI) water samples were also measured, all
couple positions along the waveguide center (See Appendix,                 at 20◦ C. The dielectric constant measurements, including a
Figs. 18-20). The software incorporates measured values for                comparison of the fresh and frozen-then-thawed bovine brain
the real and imaginary parts of the refractive index within                samples, are shown in Fig. 11 of the Appendix. The measure-
the brain tissue and includes the plastic sample box. The                  ments also show the correlation between the gel dielectric
beam intensity profile in the sample varies approximately                  constant and the brain tissue and where the gel dielectric
as P(z) = P0 e−αz , where z is the distance into the sample                constant overlaps sufficiently with the brain tissue to be used
in cm, P0 is the incident power at the surface, and α is the               as a simulant for this particular parameter. The deionized (DI)
linear absorption coefficient in cm−1 . Using the procedure                water was used for calibration of the instrument. These mea-
described below, the α values were determined to be 0.46,                  surements were used to derive the values of electrical con-
0.89 and 23 cm−1 for the brain tissue and 0.81, 1.95, and                  ductivity (σ ) and linear absorption coefficient (α) that are
25.34 cm−1 for the gel at 1.9, 4 and 39 GHz respectively,                  used in the field computations described earlier, and they
using an Agilent vector network analyzer (PNA 8363B) with                  are shown in Table 10 of the Appendix at each measurement
a special fringing field coaxial probe (Keysight 85070E)                   frequency.

115596                                                                                                                                    VOLUME 8, 2020
D. H. Gultekin, P. H. Siegel: Absorption of 5G Radiation in Brain Tissue as a Function of Frequency, Power and Time

   For performing all the measurements, the individual sam-                         between the waveguide and λ/2 dipole antenna elucidates
ple containers were filled with gel or fully packed brain                           the varying impact of the RF beam distribution and/or focus
tissue, and a rack with five precisely placed thermocouples                         and will play a major role in defining standards for 5G base
spaced 5 mm apart was inserted from above, reaching down                            stations which have unprecedented beam forming, directivity,
to positions directly aligned with the waveguide central axis                       and beam steering characteristics.
and positioned as 1, 6, 11, 16 and 21 mm away from the inner                           For all the data acquired in this study the same sequence
wall of the container. An additional thermocouple was placed                        was used: 5 minutes without power to acquire a baseline,
at the center of the container and a glass thermometer was also                     RF power applied for 30 minutes, RF off for 30 minutes,
placed in the far corner of container as an absolute reference.                     and then repeated for the next power level in the sequence,
The thermocouples were all type T (Physitemp, NJ, USA)                              running from the lowest to the highest. Pulse measurements
and were either type IT-18 (0.050’’ diameter sheathed in                            were performed at the end of the full power sequence run. The
Teflon) or IT-23 (0.011’’ diameter Teflon coated and twisted).                      temperature time series were processed for drift correction
Both are designated for implantation, and they are specially                        using the baseline segment of the data by fitting a polynomial
configured for high accuracy (
D. H. Gultekin, P. H. Siegel: Absorption of 5G Radiation in Brain Tissue as a Function of Frequency, Power and Time
coefficients of temperature rise and specific absorption rate,
1T /1F and 1(SAR)/1F, can be used as a measure of RF
exposure at each frequency and power density range.
The 1T /1F can be derived experimentally as a function
of frequency, exposure times and depths in the brain tissue
after performing a series of high precision temperature vs.
depth measurements that span multiple power levels and
exposure times at each frequency. The tabulated 1T /1F and
1(SAR)/1F data can then be used to predict the temperature
rise in the brain tissue for any given frequency, incident power
density, depth and exposure time at the frequencies, and over
the power ranges, we studied. Since we find the 1T /1F
plots to be linear down to the lowest powers measurable,
we believe it is possible to extrapolate 1T /1F to power
levels below those we can sense with our thermal probes, and
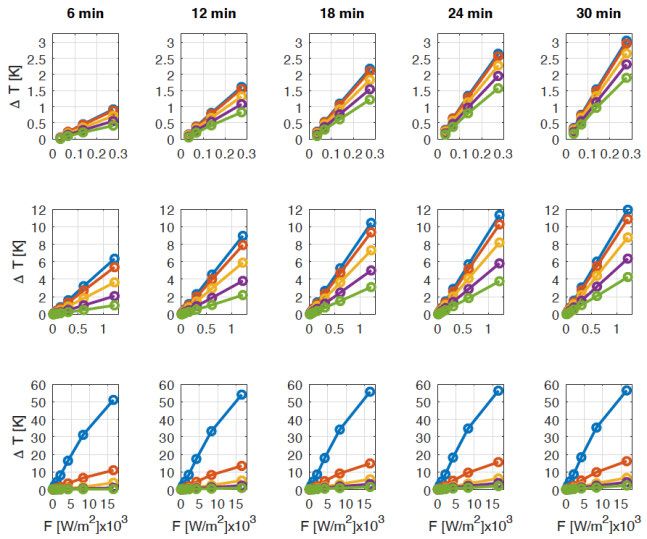
to accurately predict even smaller temperature changes in the FIGURE 3. Experimental temperature rise (1T ) vs. time (t ) and power (P)
for brain (left column) and gel (right column) at 4 GHz. The curves
brain (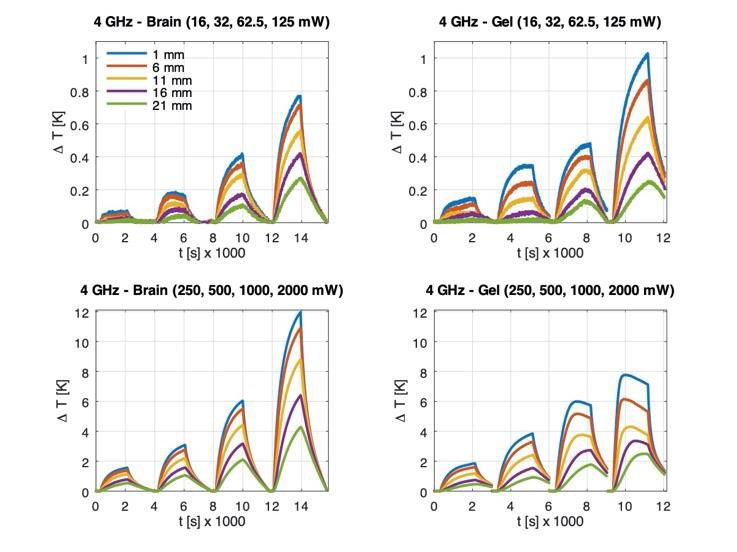
D. H. Gultekin, P. H. Siegel: Absorption of 5G Radiation in Brain Tissue as a Function of Frequency, Power and Time

FIGURE 4. Experimental temperature rise (1T ) vs. time (t ) and power (P)
for brain (left column) and gel (right column) at 39 GHz. The curves
correspond to temperature measurements at the power levels of 1, 2, 4,
8, 16, 32, 62.5, 125, 250, 500, 1000 and 2000 mW and depths of 1, 6, 11,            FIGURE 5. Experimental temperature rise (1T ) vs. incident power
16 and 21 mm, respectively.                                                         density (F ), depth (z) and exposure time (t ) for brain at 1.9, 4 and 39 GHz.
                                                                                    The circles and straight solid lines correspond to temperature
                                                                                    measurements and fitted linear functions at exposure times of 6, 12, 18,
                                                                                    24 and 30 min (columns, left to right), and incident power levels of 250 to
                                                                                    2000 mW at 1.9 GHz (top row), 16 to 2000 mW at 4 GHz (middle row) and
showing much higher thermal gradients. As with the 4 GHz                            1 to 1000 mW at 39 GHz (bottom row) and depths of 1, 6, 11, 16 and
measurements, this shows the confinement of the RF to the                           21 mm, respectively.

surface of the sample and gives a good measure of the thermal
time constant for conductive heating in both brain tissue and
gel. Note from the top left plot, that we are able to detect very
small changes in power (1 mW) and temperature (
D. H. Gultekin, P. H. Siegel: Absorption of 5G Radiation in Brain Tissue as a Function of Frequency, Power and Time

incident power levels of 62.5 mW to 2 W at 1.9 GHz (top                     TABLE 1. Experimental temperature coefficient 1T/1F [K · m2 /W] as a
                                                                            function of frequency (GHz), depth (mm) and exposure time (min) for
row), 16 mW to 2 W at 4 GHz (second row), 1 mW to 2 W at                    brain. The fitting between the temperature (T) and incident power
29 GHz (third row) and 1 mW to 2 W at 39 GHz (bottom row)                   density (F) was performed over the linear range as P < 2W (1.9 and 4GHz)
at depths of 1, 6, 11, 16 and 21 mm, respectively. The solid                and P < 0.5W (39GHz). The results show mean ± standard deviation.

straight lines are fitted functions to the experimental data for
the full range of power and exposure times at 1.9 GHz, up
to 500 mW for the 4 GHz data and up to 125 mW for the
29 and 39 GHz data.
   Fig. 5 shows that the bovine brain tissue exhibits a wide
range of linearity in the absorption of RF radiation over a
wide range of frequency, power and exposure times. The
brain tissue has a linear response up to 2 W in power and
up to 30 minutes of exposure time at 1.9 and 4 GHz and
up to 1 W at 39 GHz. In contrast, Fig. 6 shows that the
temperature and time curves roll over in the gel at the higher
powers and 5G frequencies (29 and 39 GHz) especially, at
the higher range of power and exposure times. This behavior
contrasts dramatically with the bovine brain tissue and is due
to changes in the gel properties and onset of convection as a
result of severe heating and the concentration of the RF power
in the sample (see Appendix).                                               TABLE 2. Experimental temperature coefficient 1T/1F [K · m2 /W] as a
                                                                            function of frequency (GHz), depth (mm) and exposure time (min) for gel.
   Overall, the ex vivo bovine brain tissue showed a much                   The fitting between the temperature (T) and incident power density (F)
wider linear response range than the gel, to power, fre-                    was performed over the linear range as P < 2W (1.9 GHz), P < 0.5W
                                                                            (4 GHz) and P < 0.125W (29 and 39 GHz). The results show mean ±
quency and exposure time. Over the exposure time of 30 min,                 standard deviation.
fresh brain tissue exhibited perfect linearity up to 2 W at
1.9 and 4 GHz and up to 500 mW at 39 GHz, and near
perfect linearity up to 1 W at 39 GHz. The gel showed
linearity up to 2 W at 1.9 GHz, up to 500 mW at 4 GHz
and only up to 125 mW at 29 and 39 GHz. Both brain and
gel showed nonlinear thermal behavior and deformation of
temperature profiles due to severe heating beyond their linear
limits. Fig. 6 shows that the linear limit is a function of power,
frequency and exposure time.
   Using the data from Figs. 5 and 6, we have derived a
temperature coefficient, 1T /1F (K · m2 /W), as a function
of frequency (GHz), depth (mm) and exposure time (min) in
both the bovine brain and the gel. The individual values are
given in Tables 1 and 2 showing mean ± standard deviation.
The fitting between the temperature rise and incident power
density was performed for exposure times of 6, 12, 18, 24 and
30 min and depths of 1, 6, 11, 16 and 21 mm, respectively.
The linear relationship can be extrapolated to much lower
power levels so long as the same RF coupling mechanism
predominates.
   The numbers in the cells in Tables 1 and 2 were derived at                  As expected, the magnitude of the temperature rise in the
spatial distances and exposure times where a linear relation                tissue increases with increasing frequency, incident power
between the temperature (T ) and incident power (P), or inci-               and exposure time and closely follows a thermal diffusion
dent power density (F) dominated. The linearity trend is                    model. What is less obvious, is that simply extrapolating the
the same when using T vs. P or T vs. F with a scaling                       exposure time is a much less effective method of predict-
factor R. Using the average incident power (P), and the aver-               ing the ultimate temperature rise in the tissue at the higher
age incident power density (F), the coefficient 1T /1F can be               frequencies, as can be seen from Table 1. The temperature
converted to the coefficient 1T /1P by multiplying the data                 coefficient (1T /1F) increases with exposure time almost
in Tables 1 and 2 by the scaling factor (R) of the respective               proportionally in the 4G band at 1.9 GHz, but more slowly
waveguides since F = PR and 1T /1P = R(1T /1F). The                         in the 5G bands. For example, the 1T /1F (K · m2 /W) at
temperature rise in Kelvin can also be replaced by Celsius                  1 mm depth in the brain increases about 3.2 times at 1.9 GHz,
since 1K = 1◦ C.                                                            about 1.9 times at 4 GHz and only about 1.1 times at 39 GHz

115600                                                                                                                                     VOLUME 8, 2020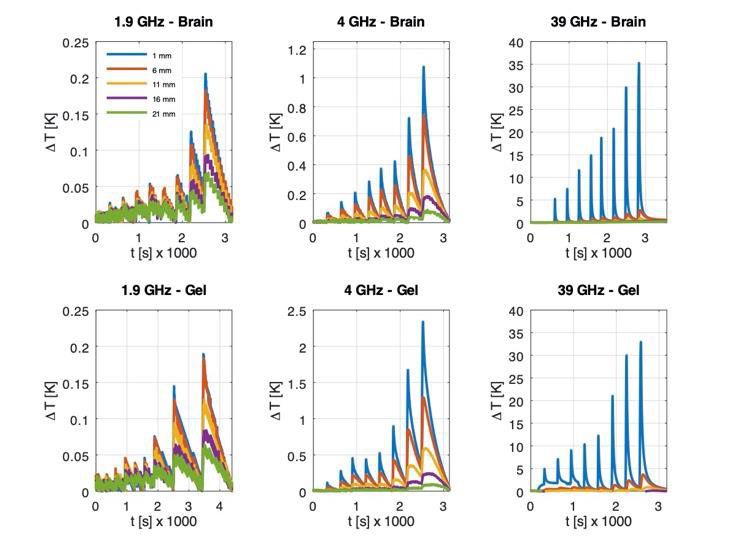
D. H. Gultekin, P. H. Siegel: Absorption of 5G Radiation in Brain Tissue as a Function of Frequency, Power and Time

                                                                                    confined to the tips of the thermocouple wires and they may
                                                                                    be considered as point SAR (pSAR) without averaging over a
                                                                                    prescribed volume. Once high resolution pSAR is measured,
                                                                                    it is easy to average over multiple thermocouple locations and
                                                                                    a desired volume.
                                                                                        It is also important to see that the beam penetration, and
                                                                                    therefore SAR, decreases with increasing depth at a fre-
                                                                                    quency as shown in Figs. 7 and 8. Since SAR is measured
                                                                                    over short times, the effects of thermal diffusion are not so
                                                                                    apparent at higher depths and frequencies in Figs. 7 and 8,
                                                                                    whereas 1T is measured over long times, and the effects of
                                                                                    thermal diffusion are apparent in Figs. 2 to 6. Deriving SAR
                                                                                    by our thermal method at lower depths is sensitive to the time
                                                                                    constant used due to the thermal diffusion.
                                                                                        Although SAR can be measured over very short times
                                                                                    at high power density, the accuracy of fitting the 1T /1t
                                                                                    decreases at lower power density and frequency. For fitting
FIGURE 7. Experimental specific absorption rate (SAR) vs. incident power            the SAR to the broad range of power density and frequency,
density (F ) and depth (z) for brain at 1.9, 4 and 39 GHz.
                                                                                    we fitted 1T vs. 1t from 10 s to 60 s with 10 s increments
                                                                                    and found the optimum fitting times (1t) of 40 s, 30 s and
                                                                                    20 s for the brain tissue at 1.9, 4 and 39 GHz, respectively.
                                                                                    Using the data in Figs. 7 and 8, we derive incident power
                                                                                    density dependent SAR coefficients, 1(SAR)/1F (m2 /kg),
                                                                                    as a function of frequency and depth for the brain and gel as
                                                                                    shown in Tables 3 and 4, respectively.

                                                                                    TABLE 3. Experimental SAR coefficient 1(SAR)/1F [m2 /kg] as a function
                                                                                    of frequency (GHz) and depth (mm) for brain. The fitting between the
                                                                                    temperature (T) and time (t) was performed over the linear range as
                                                                                    t < 40 s (1.9 GHz), t < 30 s (4 GHz) and t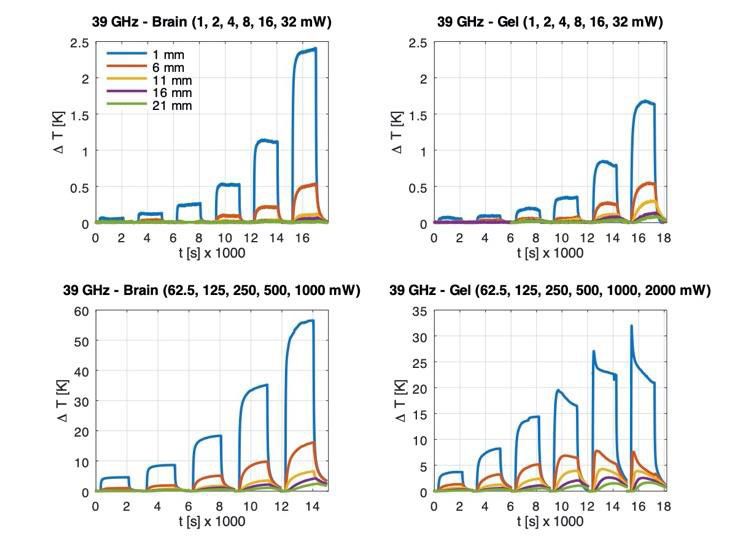
D. H. Gultekin, P. H. Siegel: Absorption of 5G Radiation in Brain Tissue as a Function of Frequency, Power and Time

carefully applied. The gel has a very narrow linear range
of absorbed power versus temperature change compared to
the brain tissue. The gel also undergoes a thermal transition
where molecular motion and convection alter the thermal
gradients and change the profile of the temperature versus
time curves at higher frequency, power and exposure times.
The use of gel over liquids is preferred to simulate lower
convection rates in actual tissues, but in fact we observed that
the gel still suffers from thermal convection under moderate
heating with the millimeter waves. Therefore, the use of gel
(or liquid) substances leads to a gross underestimation of the
thermal gradients, and yields a temperature rise that is much
smaller than that observed in the actual tissue. Differences
observed between the brain tissue and gel, especially at the                FIGURE 9. Experimental temperature rise (1T ) vs. time (t ), depth (1z)
higher power levels and higher 5G frequencies, indicate that                and pulse length (δt) for gel at 4 GHz. The top row (from left to right)
                                                                            shows pulse lengths of 1 s, 1 ms and 1 µs with a duty cycle of 50%. The
care must be taken when extrapolating tissue data from such                 bottom row (from left to right) are plots comparing different pulse
measurements in addition to any differences in dielectric                   lengths against one another to confirm that the behavior at all pulse
                                                                            lengths is consistent and linear. Line colors refer to depths of 1, 6, 11,
properties. A nonlinear relation between the temperature                    16 and 21 mm, respectively.
and power density indicates severe heating with subsequent
tissue or gel damage, and the onset of thermal convection
(gel state change).
   These linear models provide temperature coefficients that
can be used to generally determine and predict the amount of                pulse duty cycle of 50%. We performed this series of mea-
heating in the ex vivo brain or gel versus the depth, given                 surements only on the gel in order to test the theory. The
the frequency, incident power density and exposure time.                    experimental temperature rise (1T ) vs. time (t) and pulse
It is possible to use this data in the linear range specified to            length (δt) using equal duty cycle (on/off times = 1:1) and a
accurately predict the 1T and SAR at any exposure time and                  pulse power of 2 W for the gel at 4 GHz are shown in Fig. 9 for
depth at each of the recorded frequencies. Given the absence                the five different thermocouple positions within the sample.
of any observed or reported resonances in the absorption coef-              The top row (from left to right) shows the temperature rise
ficients, it is also possible to extrapolate the temperature data           versus time (up to 30 minutes) for pulse lengths of 1 s, 1 ms
to any other frequency within the 5G band allocation when                   and 1 µs at 2 W with a duty cycle of 50%, and the bottom
adjustments are made for the measured absorption coefficient                row (from left to right) plots the temperature changes from
and refractive index at frequency.                                          the various pulse widths against each other to show that the
   Since the 1 mm depth presents the worst-case exposure                    thermal effects are all responding similarly. The slope of plots
scenario and results in hot spots at the higher frequencies                 would be equal to 1 (y = x) if the results from both sets were
measured, and there is no evidence for resonances in other                  perfectly identical. The measured heating in the sample at
tissue types, these tables can be used to roughly predict the               2 W exposure over 30 minutes for the 50% duty cycle pulses
skin temperature rise given the frequency, incident power                   was equal to the heating observed at 1 W with a CW signal,
density and exposure time, once we have scaled for reflectiv-               simply confirming that the impact of the pulses is linear with
ity and absorption coefficient differences. Reported real-time              duty cycle over the periods we examined.
measurements on a monkey head [22] show that perfusion                         In a second series of pulse measurements, to visualize
contributes relatively modest changes to overall heating deep               transient effects on both bovine brain and gel, we used a
within the tissue. Direct measurements on skin to verify this               single pulse of varying duration and fixed power level (2 W at
analogy are planned for the near future.                                    1.9 and 4 GHz and 1 W at 39 GHz - since 2 W at this
   The 5G data transmission protocols will use both con-                    frequency damaged the tissue) and measured the temperature
tinuous wave (CW) and pulsed power, and these will have                     response at different depths in the samples at 1.9, 4 and
different impacts on the biological tissues. As a consequence,              39 GHz. A compilation of all the measurements is shown
we tested pulse power effects on heating in our two samples                 in Fig. 10.
at 1.9, 4 and 39 GHz. Pulsing the RF also gives us additional                  Fig. 10 shows that the brain and gel samples respond
information on the thermal constants of the brain tissue and                similarly to the pulsed power at 1.9 and 39 GHz, but there
gel and allows us to readily measure sensitivity limits for the             is a difference in temperature rise between the two samples
embedded thermocouples. We examined long pulse behavior                     at 4 GHz. This is attributed to differences in the dielectric
(1 s to 30 s single pulse), and 50% duty cycle short pulses                 absorption coefficient of the brain and gel at this frequency
(1 µs, 1 ms and 1 s) for 30 minutes duration.                               (see Appendix, Fig. 11). Note that the 39 GHz plots show the
   In the first set of pulsed experiments, we examined long                 extreme power concentration near the surface of the samples
duration exposures with varying pulse lengths and a fixed                   and the embedded thermocouples show the profiles expected

115602                                                                                                                                     VOLUME 8, 2020
D. H. Gultekin, P. H. Siegel: Absorption of 5G Radiation in Brain Tissue as a Function of Frequency, Power and Time
Given the absence of perfusion in ex vivo tissue and the
accurate values for the specific heat, density, thermal diffu-
sivity, heat transfer coefficient, and absorbed power density
at the boundary, Eq. (1) makes it possible to derive the
temporal and spatial variations of temperature in the tissue
and compare these to the measurements shown in Figs 2-4.
In our prior MRI studies, we were able to measure the thermal
diffusivity (D), thermal conductivity (κ) and specific heat (C)
of a gel [50], [51], [70].
The semi-infinite modeling solution of Eq. (1) with a
constant flux boundary condition without the perfusion and
convection terms, results in [51], [79].
"r #
z2
F0 Dt z
T (z, t) = T∞ + 2 exp − −z 1 − erf √
κ π 4Dt 2 Dt
FIGURE 10. Application of single pulses with varying lengths (1, 2, 3, 4, 5, (2)
10, 20 and 30 s) at 2 W power levels for 1.9 and 4 GHz, and 1 W power
level for 39 GHz. Brain tissue (top row) and gel (bottom row), at 1.9, 4 for one dimensional heat diffusion along the z direction and
and 39 GHz.
2 z
F0 d z
1T (z, t) = √ exp − 2 − z · erfc (3)
κ π d d
from a thermal diffusion model with a temperature rise that
tracks the changes in total incident power. where 1T (z, t) = T (z, t) − T∞ , T∞ is initial temperature,
The method employed in this study uses individual ther- F0 = P0 /A is the surface power density or flux in x-y plane
mocouples to record the temperature in the tissue at specific at z = 0, P0 is the surface power, √ A is the surface area,
predetermined depths along a single axial pathway. In our κ is the thermal conductivity, d = 2 Dt is the root mean
prior study at 1.9 GHz, we employed an MRI, which has square diffusion length, D is the thermal diffusivity, erf is the
the advantage of recording the volume temperature rise at error function and erfc is the complementary error function.
any point in the tissue. However, MRI has several disadvan- Fitting the measured√ 1T data √ numerically to Eq. (3) and
tages [47]. First, it has magnet compatibility issues that need plotting the
√ d = 2 Dt vs. t yields a straight line with a
to be resolved to accommodate the well calibrated waveguide slope of 2 D and the thermal diffusivity coefficient (D) for
injection system we used in this study. Second, the high field the substance [51]. This thermal method is highly accurate
MRI’s intense RF pulses at 400 MHz give rise to signifi- and reproducible as previously shown with a high-resolution
cant heating in addition to the incident RF power studied MRI [51].
here [75]–[77]. Third, there is a high cost to reserving the long A preliminary analysis shows that the measured data at
uninterrupted scanner time required for these lengthy exper- 4 GHz can approximately satisfy the thermal model in Eq. (3).
iments (more than 12 hours continuously per frequency and Using the experimental 1T data at 4 GHz and Eq. (3),
sample). In contrast, our embedded thermocouple technique we measured a thermal diffusivity of 1.23 · 10−7 m2 /s for the
has a temperature accuracy of better than 0.1◦ C, temporal ex vivo bovine brain tissue vs. 1.28 · 10−7 m2 /s calculated
resolution of 1 s, and a spatial resolution of 1 mm and has been from D = κ/ρC with κ = 0.51 W/m · K, ρ = 1100 kg/m3
shown to be sensitive enough to record changes in tempera- and C = 3630 J/kg · K for brain tissue in the literature.
ture due to an incident power level of 1 mW in the millimeter At 4 GHz, the beam penetration and absorption appear
wave bands (29 and 39 GHz) in a 6-minute exposure. optimized providing a constant heat flux boundary condition
The spatiotemporal variation of temperature in the tissue as shown to be consistent with the thermal model in Eq. (3).
can be approximated by the modified Pennes’ bioheat equa- The diffusivity estimates start to deviate from the expected
tion including the thermal convection terms [78]: value at 1.9 GHz due to much higher beam penetration, and
∂T Q hA at 39 GHz due to severe beam concentration and absorp-
= D∇ 2 T − wk (T − Ta )+ − (T − T∞ ) (1) tion at the surface. At our current low spatial resolution of
∂t ρC ρCV
1z = 5 mm and maximum depth of z = 21 mm, using only
where D = κ/ρC is thermal diffusivity (m2 /s), κ is thermal three spatial points away from the surface (11 to 21 mm),
conductivity (W/m · K), ρ is density (kg/m3 ), C is specific we measure a thermal diffusivity of 1.38 · 10−7 m2 /s and
heat of tissue (J/kg · K), Q = Pa /V is absorbed power density 0.81 · 10−7 m2 /s for brain tissue at 1.9 and 39 GHz, respec-
(W/m3 ), Pa is absorbed power (W), w is perfusion rate (1/s), tively. At the depth of z = 1/α, the power density drops to
k is the ratio of ρC for blood to tissue, Ta is the arterial about 1/3 of its value at z = 0. Analyzing the data from
temperature (K), T∞ is the ambient temperature (K), h is heat our previous study using an MRI and a 1.9 GHz λ/2 dipole
transfer coefficient (W/m2 · K), A is surface area (m2 ) and V antenna RF injection source [47], we measured a thermal
is volume (m3 ). diffusivity of 1.34 · 10−7 m2 /s for brain tissue which is
VOLUME 8, 2020 115603D. H. Gultekin, P. H. Siegel: Absorption of 5G Radiation in Brain Tissue as a Function of Frequency, Power and Time
close to the value obtained using the 1.9 GHz waveguide TABLE 6. ERLs for local exposures of persons in unrestricted and
restricted environments (public/occupational).
injection source in this study. However, the RF waveguide
setup at 4 GHz is sufficient to measure the thermal diffusivity
of ex vivo brain tissue fairly accurately. These results are
preliminary and we are currently working on extending these
thermal models to a broader range of frequencies using the
high-resolution MRI and three-dimensional temperature data.
Under RF exposure, the specific absorption rate, SAR =
Pa /ρV. In very short exposures and in the absence of perfu-
sion, thermal conduction and convection, SAR can be com-
puted by the thermal method as SAR = C(dT/dt) in contrast
to the field probe method, where SAR = σ |E|2 /ρ, σ is the
TABLE 7. ERLs for whole-body exposures of persons in unrestricted and
electrical conductivity of the tissue (S/m) and E is the root restricted environments (public/occupational).
mean square electric field strength of the tissue (V/m).
The recent IEEE C95.1 standard sets dosimetric reference
limits (DRL) and exposure reference levels (ERL) expressed
in terms of in-situ and external limits, and ICNIRP guidelines
use basic restrictions and reference levels [39], [40]. Both
IEEE and ICNIRP use the same safety limits and levels for
the exposure of persons in unrestricted and restricted envi-
ronments (public/occupational). The occupational limits are
5 times higher than the public limits. It is useful to look in
detail at these limits and exposure times as they relate and TABLE 8. EDs for local exposures of persons in unrestricted and
apply to the measurements presented in this paper. restricted environments (public/occupational) for 0 < t < 6 min.
The new DRLs use SAR below 6 GHz and epithelial power
density (IEEE) or absorbed power density (ICNIRP) above
6 GHz for persons in unrestricted and restricted environments
(public/occupational) as given in Table 5. The SAR is aver-
aged over 6 min for local exposure and over 30 min for whole-
body exposure. The SAR for local exposure is averaged over
10 g of tissue in a volume in the shape of a cube. The absorbed
(epithelial) power density (PD) for local exposure is averaged
over 6 min and 4 cm2 or 1 cm2 (>30 GHz) of body surface
area in the shape of a square.
The ERLs for local exposure of persons in unrestricted
and restricted environments (public/occupational) are given
TABLE 5. DRLs for exposures of persons in unrestricted and restricted
environments (public/occupational). in Table 6 for 1.9, 4 and 39 GHz, respectively. The incident
PD for local exposure is averaged over 6 min, 4 cm2 or 1 cm2
(>30 GHz) body surface area in the shape of a square.
The ERLs for whole-body exposure of persons in unre-
stricted and restricted environments (public/occupational) are
given in Table 7 for 1.9, 4 and 39 GHz, respectively. The inci-
dent PD for whole-body exposure is averaged over 30 min.
The incident energy density (ED) levels, integrated over
time interval, 0 < t < 6 min, for local exposure of
persons in unrestricted and restricted environments (public/
occupational) are given in Table 8 for 1.9, 4 and 39 GHz,
The SAR is measurable below 6 GHz by the field probe respectively.
method but not above 6 GHz due to the decreased beam The local exposure of persons in unrestricted and restricted
penetration and increased power absorption near the sur- environments (public/occupational) to pulse trains or single
face of the tissue requiring the measurement of epithelial intense pulses is given in Table 9. For intense pulses in the
(absorbed) power density. The local SAR limits for cell millimeter-wave frequency range (>30 GHz), the maximum
phones (D. H. Gultekin, P. H. Siegel: Absorption of 5G Radiation in Brain Tissue as a Function of Frequency, Power and Time
TABLE 9. EDs for local exposures of persons in unrestricted and RF sources. The power density safety limits in Table 6 for
restricted environments (public/occupational) to pulse trains. The public
limits below are multiplied by 5 for occupational limits. our waveguide sources at 1.9, 4 and 39 GHz, correspond to
incident power levels of 285, 65 and 1.7 mW for public, and
1425, 325 and 8.5 mW for occupational exposures, respec-
tively. Although the range of incident power levels used in this
study exceeds the IEEE C95.1 safety limits, this broad range
is necessary for determining the 1T /1F and 1(SAR)/1F
coefficients over a wide range of parameters. We are not
suggesting that these levels are intentionally present in either
the public or occupational exposures allowed under current
safety standard and guidelines.
As can be seen from Tables 5 to 9, current safety limits are
Using the IEEE safety limits and the experimental data fairly complicated, and depend on the frequency, exposure
in Table 1, it is possible to predict the temperature rise in type and time. The thermal method presented here is capable
the brain tissue at a given frequency, depth and exposure of measuring both temperature change (1T ) and specific
time. For example, using the ERLs (1F) of 39.23, 40 and absorption rate (SAR), and is applicable to a broad range of
28.76 W/m2 in Table 6 for local exposures of persons in frequency and exposures, above and below the 6 GHz demar-
an unrestricted environment (public), and the 1T /1F values cation zone recommended in IEEE C95.1 standard. The ther-
of 3.51, 5.18 and 3.77 × 10⁻³ K · m2 /W for 6 min exposure mal method is complicated by the combined effects of beam
at 1 mm depth from Table 1, we calculate a temperature penetration, absorption and thermal diffusion, but by careful
rise, 1T = (1T /1F)1F, of 0.14, 0.21 and 0.11◦ C in brain analysis it provides both the transient temperature history and
tissue at 1.9, 4 and 39 GHz, respectively. The temperature specific absorption rate that are necessary for assessing safety
rise for local exposures of persons in a restricted environment levels in terms of the magnitude of the temperature rise over a
(occupational) are five times higher at 0.70, 1.05 and 0.55◦ C, given exposure time. We demonstrate that the ultimate effect
respectively. can be assessed with absolute temperature rise in the tissue
Similarly, using the ERLs for local exposure of the public at prescribed incident power density, frequency and depth,
in Table 6 and 1(SAR)/1F values in Table 3, we can estimate which is a better measure of the radiation absorption effects
the SAR = (1(SAR)/1F)1F as 1.8, 3.9 and 10 W/kg in and safety in humans.
brain tissue at 1 mm depth at 1.9, 4 and 39 GHz, respectively.
As stated earlier, the tip of the fine gauge thermocouple wire V. LIMITATIONS OF THE STUDY
is confined to a very small volume in the tissue, so the SAR In this study, we use RF waveguide sources directly irradiat-
measurements here correspond to the point SAR (pSAR). ing ex vivo bovine brain inside plastic containers to quantify
The SAR values decrease with distance and more drastically the temperature rise and the specific absorption rate in the
with frequency as seen in Figs. 7 and 8, and Tables 3 and 4. brain tissue as a function of frequency, incident power density
Assuming an average surface power density in the and depth. However, this study does not take into account
x-y plane decreasing in the z direction along the thermocouple the layers of skin, fat, muscle and skull containing the brain
locations, pSAR may be spatially averaged over z = 10 mm in a realistic head model. The actual power density and the
distance or over three thermocouple locations (each 5 mm heat diffusion reaching the surface of the brain in a real head
apart) to measure the SAR averaged over 1 cm3 or 1 g will obviously not be the same as the values we show in
of tissue as per FCC guidelines. Averaging over 1 mm to this study, where our power is incident directly on the brain
11 mm depths in Table 3 and using the ERLs in Table 6, we tissue. However, the derived thermal coefficients and linear
calculate the SAR averaged over 1 g of brain tissue as 1.5, 2.5 behavior are properties of the tissue and can be used to predict
and 3.4 W/kg at 1.9, 4 and 39 GHz, respectively. temperature changes as a function of incident RF power
It should be noted that the frequency (and wavelength), density. In addition, the behavior of skin, fat, muscle and
waveguide aperture area or dipole antenna length, and aver- bone can be roughly extrapolated within the same incident
age power density are all interrelated. Increasing frequency, power regimes given a priori measurements of the dielectric
decreases the appropriate waveguide area or the resonant and thermal diffusion constants. It is also interesting to note
antenna length and increases the average incident power that the current safety limits of 28.76 and 143.8 W/m2 (public
density drastically for any prescribed power. Using 1 W of and occupational) applied to our directional RF waveguide
incident power in each of the waveguide sources at 1.9, 4 and source at 39 GHz would correspond to only 1.7 and 8.5 mW
39 GHz, results in the average incident power density of 138, incident power levels, which is an extremely limited amount
613 and 16,578 W/m2 respectively at the tissue surface, and of power availability for a broad distribution communications
raises the temperature of the bovine brain tissue at 1 mm system.
depth by 0.5, 3 and 62◦ C with only a 6 minute exposure time. The accurate measurement of SAR by thermal methods
This fact needs to be carefully considered when specifying such as ours near the surface and at low power density can
incident power requirements for low and high frequency be affected by the thermal diffusion time, and extra care must
VOLUME 8, 2020 115605D. H. Gultekin, P. H. Siegel: Absorption of 5G Radiation in Brain Tissue as a Function of Frequency, Power and Time
√
be taken. The diffusion length, d = 2 Dt, must be shorter will greatly limit the application potential for any such com-
than the depth (d < z) at which the SAR is being measured. munications system.
This requires exposure to the radiation over a fairly short time In the USA, the FCC and FDA are overseeing the imple-
for characterizing shallower depths (for example, t < 2 s mentation of millimeter wave technology in the public realm
for d < 1 mm) during the initial temperature rise and for and more studies are needed to help guide the science, tech-
fitting the 1T /1t and SAR = C(1T /1t). Although, short nology and policy. Our experimental method can provide
time exposures can easily be used for higher power densities threshold temperature and SAR values for both occupational
and at higher frequencies, the accuracy of fitting the 1T /1t and public exposures to millimeter waves with surface power
decreases at lower power density and frequency. For purposes densities from 16.5 W/m2 to 16.5 kW/m2 and exposure times
of covering the greatest power density range in our bovine from 1 second to 30 minutes.
brain tissue, we used fitting times that yielded a highly linear Finally, we use our new data and this RF method to derive
slope of 1T /1t. Using 1t of 40, 30 and 20 s for 1.9, 4 and a thermal diffusivity coefficient for the ex vivo bovine brain
39 GHz respectively, and the thermal diffusion coefficient of tissue that is consistent with our prior measurements using an
D = 1.23 · 10−7 m2 /s as measured in this study, we calculated MRI. This is the first time that the thermal diffusivity of ex
the diffusion length (d) as 4.4, 3.8 and 3.1 mm in brain vivo bovine brain tissue has been directly measured by this
tissue. This shows that SAR measurements at depths from thermal RF method [47], [50], [51], [70].
6 to 21 mm are free of thermal diffusion effects, whereas
SAR measurements at 1 mm depth are somewhat affected by APPENDIX
thermal diffusion over these fitting times. MEASURED AND DERIVED DIELECTRIC
PARAMETERS FOR SAMPLES
Since the frequency range of 5G covers a region of the electro-
VI. SUMMARY magnetic spectrum wherein the complex index of refraction
In this paper, we present for the first time, a simple, highly of water, and hence water-based tissue, varies considerably,
accurate test system for measuring the temperature rise and it is instructive to examine the impact of the tissue on the
the specific absorption rate in tissue samples and liquid or gel RF beam properties. The real part of the refractive index will
simulants as a function of frequency, RF exposure power cause significant reflection and refraction as the microwave
and time – pulsed and CW. We use this setup to make, and power impinges on the tissue, and the resulting absorption
compare, carefully calibrated measurements of bovine brain versus surface area and depth will depend strongly on the
tissue and a gel simulant, Triton X and water, at both 4G electromagnetic field distribution.
(1.9 GHz) and newly allocated 5G frequency bands (4 GHz - In order to get a direct measure of our tissue and gel
39 GHz). We show the effects of beam concentration, focus- properties across the 5G bands we employed a Keysight
ing, absorption and heat diffusion at all three frequencies and vector network analyzer (PNA E8363B) and specially sup-
delineate a linear range over which we can derive highly accu- plied liquid immersion probe (Keysight 85070E) to record
rate coefficients (1T /1F and 1(SAR)/1F) that can be used the real and imaginary parts of the dielectric constant for all
to predict the temperature rise and the specific absorption rate the samples between 0.1 and 40 GHz. Fig. 11 shows the real
at prescribed depths and exposure times within the tissue or and imaginary parts of the dielectric constant (ε0 and ε00 ) for
gel at power levels that go down to detectable limits (60◦ C
for CW, >35◦ C for 30 s pulse) in both bovine brain tis-
sue and gel. This same temperature rise can be expected
on skin (which has very similar dielectric properties) when
such large surface power densities are present in very close
proximity to the RF source or antenna, perhaps emanating
from millimeter-wave base stations, handsets, or wireless-
enabled appliances or kiosks. Although, current safety limits
of 28.76 and 143.8 W/m2 for power density in unrestricted
(public) and restricted (occupational) environments, respec-
tively should prevent such exposures, the resulting limits on
RF power generation of only 1.7 to 8.5 mW from a directional FIGURE 11. Keysight 85070E probe readings for ε0 and ε00 vs. frequency
RF source, such as our waveguide at 39 GHz, in the vicinity, from 0.1-40 GHz.
115606 VOLUME 8, 2020You can also read