Environmental and socio-economic challenges in battery supply chains: graphite and lithium - Öko-Institut eV
←
→
Page content transcription
If your browser does not render page correctly, please read the page content below
www.oeko.de

              Environmental and socio-economic
              challenges in battery supply chains:
              graphite and lithium

              Short study prepared within the framework of the BMBF         Darmstadt,
              joint project Fab4Lib - Research on measures to increase      29.07.2020
              material and process efficiency in lithium-ion battery cell
              production along the entire value chain
              (FKZ 03XP0142E)

                Authors                                                     Geschäftsstelle Freiburg
                                                                            Postfach 17 71
                                                                            79017 Freiburg
                Peter Dolega                                                Hausadresse
                Dr. Matthias Buchert                                        Merzhauser Straße 173
                Dr. Johannes Betz                                           79100 Freiburg
                                                                            Telefon +49 761 45295-0

                Oeko-Institut                                               Büro Berlin
                                                                            Schicklerstraße 5-7
                                                                            10179 Berlin
                                                                            Telefon +49 30 405085-0

                                                                            Büro Darmstadt
                                                                            Rheinstraße 95
                                                                            64295 Darmstadt
                                                                            Telefon +49 6151 8191-0

                                                                            info@oeko.de
                                                                            www.oeko.de
Fab4Lib
Table of contents
List of figures 4
List of abbreviations 5
1. Battery supply chains - towards sustainable cell manufacturing in
the EU 7
2. Graphite 7
2.1. Natural graphite 8
2.2. Synthetic graphite 11
3. Lithium 12
3.1. Brines – Lithium triangle 13
3.2. Spodumene – Lithium from Australia 14
4. The future of battery supply chains 20
5. References 20
3Fab4Lib List of figures Figure 2-1: Overview over the production process of natural graphite. 9 Figure 2-2: Overview over the production process of synthetic graphite. 11 Figure 3-1: Map of currently active lithium brines 13 Figure 3-2: Global lithium production from 2016 to 2018 by country 14 Figure 3-3: Map of Australian lithium mines 15 Figure 3-4: Location of Australian lithium mines in areas of critical habiat 18 Figure 3-5: Greenbushes and critical habitat in the surroundings 19 4
Fab4Lib

       List of abbreviations
Al               Aluminium

Co               Cobalt

CO               Carbon monoxide

CO2              Carbon dioxide

Cu               Copper

EHS              Environment, health and safety

EPI              Environmental Performance Index

EV               Electric vehicles

GHG              Greenhouse gases

GIS              Geographic Information Systems

km               Kilometre(s)

ktpa             Kilotonne(s) per year

Li               Lithium

Li2O             Lithium oxide

LTO              Li4Ti5O12, lithium titanate

Mt               Mega tonne(s)

NG               Natural graphite

NIOSH            National Institute for Occupational Safety and Health

NOx              Nitrogen oxide

PARI             Protected Areas Representativeness Index

SG               Synthetic graphite

Si               Silicon

SOx              Sulphur oxide

T                tonnes (metric)

TSF              Tailings storage facilities

                                                                         5
Fab4Lib
1. Battery supply chains - towards sustainable cell manufacturing in the EU
The European Commission set a clear goal with the Green Deal to establish a transition towards a
greener economy with the transport sector being one of the main pillars. A key ingredient are lithium-
ion batteries required for the uptake of electric vehicles. The Green Deal underlines the goals for-
mulated in the Strategic Action Plan on Batteries. Establishing a battery value chain in Europe in-
cluding cell manufacturing is a key component towards a greener economy (European Commission
2019a, 2019b).
The collaborative research project Fab4Lib funded by the Federal Ministry of Education and Re-
search, investigates innovative solutions along the value chain of lithium-ion technology and to vali-
date them in demonstrators in preparation for a cell manufacturing in Germany. Within the project
the Oeko-Institut already published a report on the development of the demand of raw materials
needed for the electric vehicle (EV) uptake (Buchert et al. 2019). In this short study Oeko-Institut will
highlight some of the environmental and socio-economic challenges of graphite and lithium in the
upstream.
A significant number of projects that aim at manufacturing Li-ion battery cells in Europe are already
scheduled with some being already in production. In 2019 a total of 16 cell manufacturing plants are
in the pipeline according to Benchmark Minerals (Benchmark Minerals 2020a). With the aim of mov-
ing towards a cleaner environment and a greener economy it is crucial to think the process across
the whole supply chain. Although the manufacturing of cells might move towards Europe a large
portion of the raw material supply still is and will take place in third countries. Oeko-Institut clearly
showed in their Fab4Lib short study that raw material volumes required for the manufacturing of
batteries for EVs will increase significantly (Buchert el al. 2019). This paper aims at giving an over-
view on two raw materials that are crucial in current generations Li-ion batteries and focusing on
sustainability aspects in the upstream supply chain, since these characteristics are increasingly in
the focus of the public. Actions for other raw materials such as conflict minerals have been already
taken. Starting in 2021 companies importing tin, tungsten, tantalum and gold (3TG) will have to en-
sure that the metals are from responsible and conflict-free suppliers. Accordingly, sustainability as-
pects in mineral supply chains are increasingly in the focus of policy makers, society and companies.
The paper will first look at graphite which is the most important anode material used in lithium-ion
batteries. The two main production methods mining of natural graphite and producing synthetic
graphite will be compared. Secondly, the paper will investigate lithium with a focus on hard rock
mining in Australia, since it became the main source of lithium in the last years.
2. Graphite
Anode materials derived from carbon and especially graphitic carbons are the state-of-the-art anode
material for lithium ion batteries, as they combine exceptional electrochemical properties (high en-
ergy density and efficiency) with a long cycle life1. Furthermore, they are relatively low-cost, espe-
cially compared to the usually used cathode material, e.g., layered transition metal oxides. Histori-
cally, there has been a development from coke-based anodes (soft carbons) in the early 1990s to
hard carbons and particularly to graphite, which went along with an increased energy content, how-
ever, also a more moderate rate capability (Dühnen et al. 2020).
1 Cycle life of an automotive battery is usually defined as amount of charge and discharge cycles until the energy content
reached 80% of the initial one.
7Fab4Lib
There are two different types of graphite, which can be distinguished by their origin. The first is
natural graphite (NG) and the second is synthetic graphite (SG), synthesized by heat treatment of
a coke-based precursor (see Figure 2-1 and Figure 2-2, respectively). Although the chemical struc-
ture is similar, they differ in electrochemical behaviour and price. Generally, NG is mainly mined in
China (over 60% in 2019), (USGS 2020) as they have a high interest on graphite for their battery
production and low environmental regulations making the processing cheaper than elsewhere
(Robinson et al. 2017). However, China’s market share decreases over time, as other countries
also ramp up their graphite production (USGS 2019, USGS 2020). One of these countries with
already the second largest graphite production is Mozambique (≈9% in 2018, USGS 2020). Its main
share of graphite results from the Balama mine, the largest natural graphite and processing plant
on the planet measured by annual flake concentration production capacity.2 These figures of global
market shares include total NG for all industry outlets. However, the share of NG anode materials
manufactured in China is even larger compared to mining of NG. (Pillot 2019) While in 2018, natural
graphite anode material price was between ≈4 and 8 $ kg-1, the price of synthetic graphite was
nearly twice as high (≈12–13 $ kg-1). The production of SG is very energy and time intensive, as
long calcination/graphitization times (up to weeks including cooling times) at temperatures
≥2500 °C are necessary (Gomez-Martin et al. 2018), however, greenhouse gases (GHG) emissions
are estimated on similar level of NG due the environmentally more critical refining and production
steps of NG (see also chapter 2.2).
Despite its higher price, the market share of SG for automotive batteries is growing over time, as
the quality fluctuates less than for NG and SGs demonstrate extremely high levels of pu-
rity (Schmuch et al. 2018). In the year 2018, SG had already a market share of ≈56% in comparison
to ≈35% for NG. (Pillot 2019) The rest consists of amorphous carbon, silicon composites or lithium
titanate (Li4Ti5O12, LTO). This will continue as long as the price for graphite is not the most important
parameter, as the prognoses for the NG price decrease is even stronger than for SG due to an
oversupply. (Dühnen et al. 2020) However, as the graphite market in general is growing fast due to
the strong drive to replace fuel-driven cars by electric vehicles and their need for large battery cells,
also the NG market is increasing further. (Dühnen et al. 2020) Naturally, graphite is also used in a
lot of other applications, especially steelmaking, refractories and brake linings, although, one usu-
ally knows it from the graphite pencil. How the current Corona crisis and the resulting economic
recession in many countries will affect the graphite market is difficult to predict. (Benchmark Miner-
als 2020b)
Although graphite as material itself is nontoxic to humans and the environment, its production or
mining and subsequent processing produces emissions, which – if not properly controlled by EHS
(environment, health and safety) measures during processing - can impact the health, and other
concerns, (USGS 2017) which will be discussed in more detail in the following chapters.
2.1. Natural graphite
After mining from the ore, the NG has to be separated from the surrounding matrix, first, by mechan-
ical separation, and second, by flotation (Figure 2-1). Important to note is that only special fractions
of NG (i.e. selected flake types without heavy metal contaminants, e.g. vanadium) can be used to
produce anode materials in required quality and at competitive costs which reduces the number of
usable deposits and available volumes, respectively. (SGL Carbon 2020) After drying and screening,
the graphite particles have to be reduced in size and then spheroidised in a “potato-shaped structure”
as required for anode materials. The reason for that lies in the orientation dependent properties of
graphite. Lithium ion intercalation - i.e. the insertion of lithium ions between the individual graphene
2 https://www.mining-technology.com/projects/balama-graphite-project/, http://www.syrahresources.com.au/overview,
both accessed on 08.06.2020
8Fab4Lib
sheets3 - only takes place at the edges or defects of a graphite flake during the charging phase of a
battery. This is not possible at right angles to the basal plane. By selective grinding, the shape of
graphite flakes is changed so that the graphite flakes obtain a round shape by rolling them in. There
are several advantages resulting from this procedure. First, this has the consequence that the sur-
faces available for intercalation with lithium ions increase. On the other hand, the achievable packing
density during anode production is improved, thus increasing the capacity of the battery. (Lämmerer
& Flachberger 2017) nevertheless, the yield of spheroidised graphite is only ≈30%, when produced
out of flake graphite, which makes spherical graphite three times more expensive. (Jara et al. 2019).
The product, known as "potato-shaped graphite", is subsequently cleaned by chemical or thermal
treatment (Lämmerer & Flachberger 2017). The full NG production process from mine to NG anode
material results usually in less than 5% overall yield (based on the content of NG in the deposit and
the following processing steps), i.e. is highly waste creating (>95%).
Taken from Schmuch et al. 2018 with permission, Copyright 2018, Springer Nature
Figure 2-1: Overview over the production process of natural graphite.
For the chemical treatment, inorganic acids like hydrofluoric, hydrochloric or sulphuric acid are used.
Hydrofluoric acid has favourable properties concerning the cleansing from silicates, while the others
are better for contamination with pyrite. This is the main route for purification in China. As alternative
or additional treatment, the graphite powder can be heated to over 3000 °C under inert atmosphere
to vaporise the contaminants. As this process is energy and cost intensive, it is mostly conducted for
special applications such as aerospace, (Lämmerer & Flachberger 2017); it could become more
important for the future due to increasing environmental requirements but is also expected to in-
crease NG costs to a similar level of SG (SGL Carbon 2020).
After chemical or thermal purification, the particles are refined, and the surface is coated with carbon
to improve electrochemical performance like e.g. the cycling stability. Thus, the graphite particles
are mixed with a carbon source like, e.g. poly(vinyl alcohol) and heated up (≈700 °C) under inert
conditions (Nozaki et al 2009). These refinement steps have hence a positive effect on charging and
discharging times as well as the capacity of the batteries (Lämmerer & Flachberger 2017).
However, mining and especially purification is connected to a series of environmental challenges.
First, when mining is conducted on the surface (open pit operation), it leads to scared landscapes
similar to other surface mining activities. Nevertheless, it is preferred by companies compared to
underground mine operations, as it is cheaper (USGS 2017).
Graphite itself is inert and does not pose a direct threat to the environment. Other minerals, however,
like the iron sulphide minerals pyrite and pyrrhotite, which are sometimes part of the graphite deposit,
can cause acid mine drainage. If they are exposed to water and air, their dissolution and resulting
decrease in pH value of the water can lead to serious consequences for the surrounding environ-
ment. (USGS 2017, Letterman et al. 1978) Additionally, to access the graphite in the mines, often a
3 Graphite consists of layers of graphene, bonded via relatively weak van der Waals bonds. Therefore, lithium can be
stored in between them.
9Fab4Lib
large amount of rock has to be removed, contributing to waste piles. Depending on the mine, these
waste piles can contain different amounts of elements, leading to problems by their own. Examples
apart from iron sulphide are uranium, nickel and mercury (USGS 2017).
Flotation as a refining method leads to tailings, which have to be disposed. Their exact composition
depends on the mine. The tailings do not only occupy a large amount of landfill but can also lead to
serious pollution. However, it is also possible to use them for other purposes like, e.g. as replacement
of sand in concrete (Kathirvel et al. 2018) if maximum levels of critical contaminants are met.
Furthermore, the mining and subsequent processing of the mined ore to extract the graphite results
in a serious amount of dust, which leads to several problems as containment of dust faces limitations
in mining and deposit processing operations. First, the health of the workers and inhabitants of the
surrounding area can suffer. According to the National Institute for Occupational Safety and Health
(NIOSH) from the U.S. Department of Health & Human Services, exposure to natural mined graphite
dust can lead to cough, dyspnoea (breathing difficulty), black sputum, decreased pulmonary function
and also lung fibrosis, similar to coal dust (CDC 2019). However, it has not yet been finally clarified
if the graphite dust itself or other components of the dust, like e.g. quartz, could be responsible for
several of the symptoms (USGS 2017). Apart from the black colouring of the surroundings, including
plants, houses and people, there is little evidence that this actually harms the flora and fauna in the
small quantities occurring. Especially, a damage on plants could not be determined yet. However,
more studies have to be made to be able to exclude any harm from graphite dust in this case (USGS
2020).
The biggest concern at this point results from the purification of graphite with inorganic acids, when
they are not sufficiently contained. All acids, which are part of the chemical purification process, can
cause environmental damages, when exposed. Especially hydrofluoric acid is extremely toxic and
dangerous. (Gomez-Martin 2018) This problem can be in part mitigated in countries with sufficient
environmental regulations. In countries like China, where the environmental regulations and the pen-
alties for not following them are comparably low, incidents of exposure of the drinking water to sew-
age from the graphite mines are reported in the media. (Washington post, 2017, https://www.wash-
ingtonpost.com/graphics/business/batteries/graphite-mining-pollution-in-china/) At least neutralisa-
tion of the acids should be conducted, which is supposed to increase due to stronger environmental
restrictions. (SGL Carbon 2020, Roskill 2019) To cope with the problems, in 2013, China has (tem-
porarily) closed mines as a reaction on negative reports and protest from the communities against
pollutions.4 However, these measures seem not to have shown a large improvement, as the media
reports appeared afterwards.
Thermal purification could be a solution, at least concerning the direct emissions to water. However,
due to the large amount of energy needed, the amount of GHG produced during this process could
be even higher, (SGL Carbon 2019) considering the highly coal-based energy mix in China. Although
their renewable energy sector is expanding quickly, over 50 new coal power plants are installed in
China per year.5 As the thermal treatment is more expensive, it is still hardly used (Lämmerer &
Flachberger 2017). Nevertheless, there are new studies developing different processes leading to
less environmental pollution, like, e.g. microwave treatment. (Chehreh Chelgani et al. 2016).
4 https://www.indmin.com/Article/3290097/Shandong-China-ordered-to-halt-flake-graphite-production.html, accessed
on 28.07.2020
5 https://www.welt.de/wirtschaft/article165201633/So-geht-Deutschland-Klima-China-auf-den-Leim.html,
https://www.novo-argumente.com/artikel/chinas_energiehunger_teil_2_kohle_bleibt_kernenergie_kommt,
https://www.industryweek.com/operations/energy-management/article/21964111/china-to-cap-coal-use-at-42-billion-
tons-by-2020, accessed on 28.07.2020
10Fab4Lib
However, even in the unlikely event that such niche technologies will be able to prevail, it will take a
long time before they will be able to develop a significant market share.
2.2. Synthetic graphite
For the production of SG, also called artificial graphite, a carbon source is needed as starting mate-
rial, usually originating from the petroleum and coal industry value streams as a sub-product used in
a wide range of industry segments, only a small share (lower single digit %) of the total global output
thereof is consumed by SG production. Examples are petroleum coke or coal tar pitch. First, the
starting materials are calcined at lower temperatures (800–1200 °C) at inert atmosphere6 to generate
soft carbon (amorphous) and which is accompanied by a weight loss (see Figure 2-2). Depending
on the starting materials and maturity of process, yield is 90% if conditions are optimized but can be
as low as 70% if not. (SGL Carbon 2019) This can be conducted in an oven powered by natural gas
or by electrical energy, depending on cost of gas vs. energy and energy mix. (Dunn et al. 2015) The
main processing steps are depicted in Figure 2-2.
Taken from Schmuch et al. 2018 with permission, Copyright 2018, Springer Nature
Figure 2-2: Overview over the production process of synthetic graphite.
After pre-treatment of the starting materials (calcination, crushing, grinding and classifying), the re-
sulting soft carbon is graphitized, again under inert atmosphere. The procedure takes three to five
days and needs temperatures up to 2500–3000 °C for the duration of the heat treatment. Reaching
these high temperatures is possible in a specialized electric oven and consumes a large amount of
electric energy. Together with the cooling times, the whole process can take up to three weeks (Dunn
et al. 2015); part of the energy can be recovered during cooling (SGL Carbon 2020). The high tem-
peratures purify the material and lead to a perfect crystalline graphite structure (Wurm et al. 2018).
After graphitization, the similar particle refining steps as for NG are necessary to gain a well perform-
ing anode active material for lithium ion batteries (conditioning, grinding, classifying and carbon coat-
ing, see chapter 2.1) (Dühnen et al. 2020).
There is some research going on to replace the carbon source from the non-renewable by-products
of the coal and crude oil industry with biomass precursors, from more applicable ones like different
kinds of wood, to more exotic ones like human hair or pollen. (Dühnen et al. 2020, Tang et al. 2016).
Another approach is the use of carbon-containing waste materials like plastic bags or wooden bam-
boo sticks (Dühnen et al. 2020). Apart from reproducibility and the large amounts of material neces-
sary to cope with the growing market for anode materials, it is difficult to actually gain a soft carbon
as precursor for a highly graphitized material. The process can be improved by adding a metallic
additive like, e.g. iron chloride to the mixture, which also reduces the necessary graphitization tem-
perature. (Dühnen et al. 2020, Gomez-Martin et al. 2018) As the additive has to be removed again
and could lead to impurities, it is so far not relevant for commercial applications as battery anode
material, to the best of our knowledge (SGL Carbon 2020). All these approaches are in early stage
of research and far away from industrial realization. Furthermore, given the very low carbon yields
inherent for such alternative precursors, (Bengtsson et al. 2018) overall energy and emission
6 Contains no oxygen, usually nitrogen or argon gas.
11Fab4Lib balance of the full process as well as costs are expected to turn out disadvantageous vs. the today’s precursors. An advantage of SG compared to NG is the independence of natural graphite resources, as raw materials are established and readily available. This could lead also to an independence from coun- tries like China, where the largest share of NG is mined. Today, China also produces the largest amount of SG (≈78% in 2018, Pillot 2019). However, given the easier scalability of the SG process, licence procedure and technical realization time is faster (1-2 years compared to 8-10 years for a new mining site). Furthermore, the independency from mine locations as in case of NG is an ad- vantage of SG production. During the two heat treatment steps, several air emissions evolve, including mostly CO2, but also NOx, SOx and CO, the amounts of which are strongly related to the carbon source of the graphite. The total amount of GHG, however, is strongly dependent on the source of electrical energy for the oven. Taking calculations of SGL Carbon, verified by Shariff et al. from Berenberg Thematics, the GHG of the mining and processing of NG lie in a similar range (4 – 14 t CO2 / t graphite). Other data actually comparing the two processes concerning their emissions could not be found. The potential of improving the environmental footprint, especially for synthetic graphite, is high if only renewable energies could be used. This is, however, mostly not the case yet. The production of SG is another example, where the environmental impact is largely connected to shift in energy production from fossil fuels to renewable energies. As an example, synthetic graphite producers located near the French Alpes are already producing SG based on electricity from surrounding hydropower plants. Direct comparability between NG and SG is limited due to different technical performance profiles though. Moreover, while NG has given product properties from a certain origin/mine, which can only be influenced to limited extent by further processing steps, SG provides high versatility for final anode material through raw material selection and possible processing variations. Compared to the mining and processing of NG, the production of SG itself is supposedly clean, however, the amount of (electrical) energy needed is larger. SG production as an industrial operation allows to apply the high EU EHS standards of chemical industry in terms of handling, hazard and emission control which on contrary, are known weaknesses of mining operations in particular in countries where most and volume-wise major NG deposits are located. However, as long as the electric energy is widely pro- duced from fossil sources, it is difficult to state that SG is generally connected to less environmental impact than NG without a detailed and specific evaluation. Fortunately, the production of renewable energy is increasing in large parts of the world, thus implying a significant reduction in emissions in the future. 3. Lithium Lithium is the key element in all Li-ion batteries, regardless of the cell chemistry. The global demand for lithium in mobility applications could rise to 240.000 t in 2030 and up to 1.1 million t in 2050 if the Paris agreement goals are to be achieved (Buchert et al. 2019). This significant increase will have to be fuelled by the additional extraction of raw materials. Lithium is extracted from two very different sources. On the one hand it is extracted from brines mainly in South America. On the other hand, hard-rock mining takes place largely in Australia. In the following brines will be discussed very briefly, followed by a more in-depth investigation of lithium mining in Australia. 12
Fab4Lib
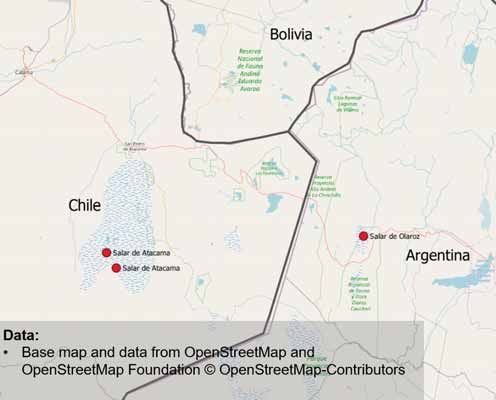
3.1. Brines – Lithium triangle
Discussions about the light metal often circulate around its extraction from brines. The commercially
most important brines are in salt flats in the lithium triangle. The lithium triangle refers to the South
American countries Chile, Argentina and Bolivia7, where currently more than two thirds of global
reserves are located (USGS 2020, Agusdinata et al. 2018). The most important brine deposits are
located in the Atacama Desert in Chile (compare Figure 3-1). Often Bolivia is represented as an
upcoming global player in the upstream sector of the lithium value chain. However, to date no large-
scale production is reported by geological surveys (USGS 2020, BGS 2020).
(OpenStreetMap 2020)
Figure 3-1: Map of currently active lithium brines
Issues resulting from the Li-extraction from salt lakes most prominently are mentioned in relation to
water scarcity. The extraction of lithium from brines uses solar energy to evaporate the lithium con-
taining brines in large ponds. The brines are pumped from underground aquifers to the surface
(Agusdinata et al. 2018). The lithium is then concentrated until it reaches a high enough concentra-
tion (e.g. 6 % lithium chloride at the Salar de Atacama) for further processing at a chemical plant
(Evans 2014). Since, the areas where this kind of process is taking place are very arid, the impact
on the hydrology can be severe. Liu & Agusdinata (2020) argue that between 2002 and 2017, the
total water storage at the Salar de Atacama in Chile declined at a rate of 1.16 mm/year. Moreover,
social conflicts have been reported as a result of water scarcity in the region (Schüler et al. 2018).
The developments regarding lithium extraction from brines are covered widely in the media. Also, a
number of studies, papers, media articles and publications covering different aspects of lithium ex-
traction from brines have been published (e.g. Liu & Agusdinata 2020). The following chapter will
focus on lithium hard rock mining which has not been covered as prominently in the public discourse.
7 Bolivia currently only holds resources.
13Fab4Lib 3.2. Spodumene – Lithium from Australia In the course of the last three years Australia became the largest global supplier of lithium. Until recently the lithium supply has been dominated by brine production due to cheaper production costs (Dessemond et al. 2019). In 2016 Chile was the top producer and enlarged its production steadily until 2018. Australia on the other hand increased its production threefold between 2016 and 2017 and again by almost 50% until 2018. Accordingly, currently (2018) almost two-thirds of the lithium supply are extracted in Australia in hard-rock mining and only approximately one-third is extracted from brines (compare Figure 3-2). Li content in metric t (data USGS 2020) Figure 3-2: Global lithium production from 2016 to 2018 by country The mineral spodumene Lithium minerals are mostly extracted from granitic pegmatites. Pegmatites are igneous rocks with a coarse grain size composed of a large variety of minerals such as e.g. granite, quartz and feldspar etc. The lithium bearing minerals contained in pegmatites are the lithium aluminium silicates spodu- mene and petalite and the potassium lithium aluminium silicate lepidolite. Pegmatits are often also containing tantalum, caesium and tin ores. Spodumene is the mineral of most commercial interest and is mainly mined in Australia. Pegmatite deposits represent ca. 26 % of all potential lithium sources worldwide (Bradely et al. 2017). Spodumene (LiAlSi2O6) has a theoretical content of 7.9 % Li2O, however usually naturally occurring grades range between 1 and 2 %. The Greenbushes mine is an exception with grades exceeding 3 % Li2O (Dessemond et al. 2019, Evans 2014). Mining and Extraction process of lithium from spodumene The mined spodumene ore is sorted, crushed, grinded, gravity separated, magnetically separated, then goes through a flotation process and is washed filtered and dried producing a spodumene con- centrate (Dessemond et al. 2019, DERA 2017). According to Dessemond et al. (2019) the lithium production process from spodumene concentrate applied at most commercial operations dates back to a patent from 1950. First the spodumene concentrate is grinded and then is heated in a furnace to at least 1000°C for half an hour. During the process α-spodumene changes to β-spodume which is soluble in acids. Afterwards the spodumene concentrate is mixed with hot sulfuric acid from which lithium sulphate solutes in water. Then sodium carbonate is added to extract contaminations of iron, 14
Fab4Lib

aluminium and manganese. Calcinated soda and calcium oxide are added and the alkaline solution
is neutralized with sulfuric acid and heated and finally lithium carbonate is precipitated by adding
sodium carbonate (DERA 2017, Dessemond et al. 2019, Evans 2014)
There are new approaches to spodumene processing beside the established acid-roast process,
where lithium hydroxide monohydrate is directly extracted from spodumene (DERA 2017). Spodu-
mene ore s processed using a pyrometallurgical and hydrometallurgical refining process to produce
the lithium hydroxide product and sodium sulfate as a by-product (Albemarle 2018). The spodumene
ore is calcined followed by a sulphate roasting process, leaching and purification. Then is crystallised
and dried to produce high purity lithium hydroxide monohydrate (Simpec 2020).

Increasing Production volumes – Overview of Australian mines
As mentioned earlier, Australia has significantly increased its production. This can be attributed to
the expansion of the largest Australian lithium mine Greenbushes, which provided ca, 30% of world
production in 2017. Moreover, other mines opened recently or are soon to be opened. Currently the
six mines Bald Hill, Greenbushes, Mount Cattlin, Mount Marion, Pilgangoora (Altura) and Pil-
gangoora (Pilbara) are operating. Another large mine Wodgina is currently under care and mainte-
nance (Hughes 2020, Champion 2019) (compare Figure 3-3). Below the most important mines are
described in short.

map based on UNEP-WCMC 2017, OpenStreetMap 2020, Hughes 2020
Figure 3-3: Map of Australian lithium mines

Greenbushes is the largest lithium producing mine located ca. 250 km south of Western Australia’s
capital Perth and named after a town nearby (Fawthorp 2020). The mine has been in operation since
1888 producing tin and tantalum (Evans 2014). In 1985 a processing plant has been established
also extracting lithium. The deposit contains approximately 1.7 Mt of lithium representing

                                                                                                     15
Fab4Lib approximately 10% of global reserves graded at 2.8 % Li2O (USGS 2020, NS Energy 2017, Fawthorp 2020). It is estimated that the mine will be in operation for another 40 years (Fawthrop 2020). The two shareholders Tianqi and Albemarle have both announced that they will also produce battery- grade lithium hydroxide in Australia. Tianqi will build its plant in Kwinana ca. 40 km south of Perth with a production capacity of 48 ktpa (Champion 2019, Tianqi 2020). Albemarle began the construc- tion of a lithium hydroxide plant in Kemerton ca. 20 km north-east of Bunbury with an initial capacity of 60 to 75 ktpa expandable up to 100 ktpa of lithium hydroxide (Albemarle 2020a, 2020b). Mount Cattlin is an open-pit lithium-tantalum mine that has been in production between 2010 and 2012 and recently reopened (Champion 2019). The ore body consists of flat lying pegmatites allow- ing mining with constant strip ratios at relatively low-cost (Galaxy Resources Limited 2020, Mining Data Online 2020a). The mine is located in the south of Western Australia and ca. 500 km south- east of Perth. The ore mined at the deposit is also spodumene with a grade of 1.08% Li2O (Champion 2019). The mine is owned by Galaxy resources who produce a 6% Li2O grade concentrate that is shipped from Esperance Port (at the southern coast of Australia, ca. 600 km south-east of Perth) to Asian customers. Ore reserves amount to ca. 8.2 Mt grading at 1.29 % Li2O. In 2019 the mine pro- duced 191.570 dry metric t of concentrate (Galaxy Resources Limited 2020). Bald Hill is an open pit mine located north of Lake Cowan and ca. 700 km east of Perth in Western Australia. Similar to Greenbushes initially tantalum has been mined at Bald Hill. In 2016 it has been announced by the owners that spodumene was also present in the deposit. In 2018 first lithium concentrate shipments have been reported (Champion 2019). Bald Hill has reported reserves of 11.3 Mt of regarding at 1 % Li2O and a production capacity of 155.000 t of spodumene concentrate per year (Alliance Mineral Assets Limited 2020). Mount Marion is located approximately 40 km south-west of Kalgoorlie and commenced production in 2016 (Champion 2019). The mine has been upgraded between 2018 and 2019 increasing the capacity of the plant (Mineral Resources 2020a). The open pit mine produces a 6% Li2O concentrate from spodumene ore. The mine life is approximately 20 years (Mining Data Online 2020b) According to Mining Technology (2020) Mt Marion is the second largest high-grade lithium deposit in the world. Pilgangoora (Pilbara) is located in the north of Western Australia ca. 150 km southeast of Port Hed- land. The mine host spodumene and lepidolite as lithium-bearing ores and also tin and tantalum bearing minerals. In 2018 the mine’s life has been estimated at 17 years (Champion 2019). The mine currently has a production capacity of 330.000 t of 6 % Li2O concentrate (Pilabara Minerals 2020). Pilgangoora (Altura) is located north of Pilangoora Pilabara and has a projected life of mine of 13 years according to Champion (2019). The open pit mine produces ca. 220.000 t of spodumene con- centrate and an expansion to 440.000 t per annum is planned (Altura 2020). Wodgina is located ca. 110 km south of Port Hedland. Same as the Greenbushes mine Wodgina was initially extracting tin and tantalum, until it has been closed in 2012. Wodgina is one of the largest tantalum deposits. Since 2017 also spodumene is mined at the deposit. It is planned to further pro- cess the ore at a chemical plant in Kemerton to produce lithium hydroxide (Champion 2019, Mineral Resources 2020b). Currently the mine has a production capacity of ca. 750.000 t of Li2O concentrate per annum (Mineral Resources 2020b). Outlook As the overview above shows, on top of Greenbushes a large variety of other Australian lithium mines started production in the past years. Moreover, the vast majority of the producers are concen- trating the ore to ca. 4-6 % Li2O which is then shipped mainly to China. Many of the mines have expansion plans scheduled even further increasing Australian production. The currently displayed 16
Fab4Lib

reserves point to secured mine life’s in the mid-term which can of course change in the course of
further exploration. The overview only included mines that are already producing or have produced
until recently, therefore they only represent the most mature and operating projects. On top of them
further exploration is ongoing and promising projects in Australia are in the pipeline (see e.g. Lithium
Australia 2020). As the example of Tianqi and Albemarle at Greenbushes shows there is a trend to
include more steps of the value chain in Australia by further processing the spodumene concentrate
to produce lithium hydroxide. Also, Mineral Resources who own the Wodgina mine are holding in-
terest via a joint venture in the Kemerton chemical plant (Mineral Resources 2020b, Champion
2019).

Environmental impacts of spodumene mining
The environmental impacts of a mine can be very manifold. A detailed analysis e.g. an environmental
impact assessment is always required on a case to case basis. This following overview aims at
summarizing some key issues of spodumene mining in Australia. The overview is not exhaustive
and represents topics that should be further studied to mitigate the impact of lithium extraction.

Tailings Storage Facilities
The processing of spodumene ore to a concentrate and the extraction of lithium from it result in wet
residues that are stored in tailings storage facilities (TSF). TSFs are large structures that contain the
wet residues and can vary in form size and height. This kind of storage can result in variety of issues
that can impact the environment.

In a worst-case scenario, a dam of a tailing’s storage facility can break releasing the contained min-
ing residues (Dolega et. al 2016). The devastating consequences have been recently widely dis-
played in the media following the dam break of an iron ore mine in Brazil in 2019 (e.g. Raman & Liu
2019).

At Wodgina seepage of tailings to the groundwater has been reported. The groundwater levels under
the tailings storage facility are increasing rapidly. The process waters stored in the pond are also of
concern since they contain elevated levels of lithium, tungsten and uranium which can have negative
impacts on area near Wodgina (DWER 2019, S&P Global 2019).

At Greenbushes each year ca. 8 Mt of processed spodumene residue will be stored in the TSFs after
the expansion. Therefore, currently another TSF is built at Greenbushes resulting in a total of four
TSFs that contain the processing residues (Talison Lithium 2018). GHD (2019) used a model as-
sessing the new TSF regarding the consequences of a dam breach for Talion Lithium. In the case
of an accident the population at risk would be between 10 and 100 persons. The assessment of
severity of damages concludes that infrastructure costs, business costs, health and societal impacts
and environmental impacts are affected to a major degree. This overview is not intended to imply
that the TSF is at a risk of failure. It does however show the severity of a failure and underlines the
necessity to regularly check and monitor the structures.

All of the mines presented before producing spodumene concentrates are using at least one TSF.

Biodiversity
The location of mine sites is connected to significant impacts on biodiversity. Mine located in desert
areas with particularly low biodiversity have a low probability of greatly impacting flora and fauna.
Operations on the other hand that are located in densely vegetated tropical forests will potentially
affect it to a much larger degree.

Brauneder et al. (2018) compiled a Geographic Information Systems (GIS) dataset representing ar-
eas of high biodiversity. The “Global Critical Habitat Screening Layer” represents a global screening

                                                                                                      17
Fab4Lib layer of Critical Habitat, based on global spatial datasets covering information on biodiversity fea- tures. The authors define critical habitat as areas with high biodiversity value covering e.g. areas with significant importance for critically endangered species or endemic species, habitats supporting globally significant migratory species, areas representing threatened and unique ecosystems, areas associated with key evolutionary processes, nationally and or internationally recognized high biodi- versity areas etc. (Brauneder et al. 2018, UNEP-WCMC 2017). This information has been combined with the mines’ locations to see whether they are located in sensitive areas in terms of biodiversity. This analysis is a very high-level investigation that cannot replace on-site assessment to confirm the existence of critical habitat. However, it is suitable to give an indicative picture describing the likelihood of an impact. The area of the mines has been buffered to 10 km from the centre point of the mine, covering pretty much all mine infrastructure and the pits. The GIS analysis shows that all Australian lithium mines except for Greenbushes and Mount Cattlin are located outside of critical habitat (compare Figure 3-4). Australia’s rather strict regulations re- garding environmental protection are reflected in the analysis, given the fact that most mines are located outside of critical habitat. The Yale Center for Environmental Law & Policy publishes the Environmental Performance Index (EPI) annually which “provides a data-driven summary of the state of sustainability” on a country to country basis. Australia ranks on place thirteen among the 180 countries analysed representing an overall score of 74.9 of 100 (Wendling et al. 2020). The analysis consists of 32 performance indicators and 11 issue categories. Among others biodiversity is ana- lysed. One of the indicators is the Protected Areas Representativeness Index (PARI) that measures how well protected areas (on land) represent a countries ecological diversity. Australia only scores 40.4 out of 100 on the indicator. This indicates a lack of protected areas (EPI 2020). map based on UNEP-WCMC 2017, OpenStreetMap 2020, Hughes 2020 Figure 3-4: Location of Australian lithium mines in areas of critical habiat Particularly Greenbushes which is by far the largest operation is located in critical habitat. If the situation is analysed further in more detail it becomes clear, that the classification is also related to 18
Fab4Lib

the applied buffer zone. Selecting a rather large buffer zone of 10 km leads to the borders of the
polygon to intersect areas of critical habitat. Also, a smaller area east of the mine is included. The
pit itself is not located in critical habitat (compare Figure 3-5). Nonetheless mining activity can have
an impact on the surroundings such as noise pollution, mining infrastructure etc. Again, this only
gives a very rough estimate to the situation and cannot replace detailed assessments on the ground.
Moreover, it has to be pointed out, that the mine has been in operation since 1888, therefore in all
likelihood no assessment regarding biodiversity issues has been conducted when the mine was
opened (which should not be a justification for not looking into biodiversity related issues today!).

map based on UNEP-WCMC 2017, OpenStreetMap 2020, Hughes 2020
Figure 3-5: Greenbushes and critical habitat in the surroundings
Revegetation
It should be noted that historic mining also significantly disturbed the areas since the mine has
opened in 1888. The Environmental Protection Authority points out that a comparison of aerial pho-
tos from the 1970s and 2019 shows that a lot of areas of historical disturbance have been revege-
tated (EPA WA 2019).

Social impact
Social impacts of mining are a widely studied field. However, in Australia problems relating to nega-
tive social impacts are somewhat different than in other countries. There are very high work safety
standards and salaries in the sector are above average. Issues such as child labour or artisanal and
small-scale mining are not taking place.

There are reports of issues related to mining on Aboriginal sites (see e.g. Albeck-Ripka 2020). On
the other hand, the mining industry is one of the most important employers for aboriginal people.
E.g. Pilabara Minerals Limited, the owner of Pilangoora (described above) offer preferential employ-
ment and procurement for Indigenous workforce and businesses (NAIF 2018).

Another important aspect that poses a social impact on Australian miners is the fly-in fly-out concept,
where people working in remote areas are not permanently staying at the place of work. Often mines
in Australia are located in desert areas without big cities nearby and workers fly in for longer periods
of time being absent from their families. This situation can lead to psychological effects on worker’s

                                                                                                     19
Fab4Lib mental health and their families. Issues e.g. such as substance abuse can occur (e.g. Langdon et al. 2016). This short overview only gives a very rough summary of the main social issues related to lithium mining in Australia. However, this paper focuses on the environmental aspects of lithium and in- cluded this short overview to paint a more complete picture of the situation. 4. The future of battery supply chains Battery and EV manufactures are scrutinized by the public even more than other industries. The sector fuels the shift towards a greener mobility and therefore needs to achieve this with minimal adverse effects on the environment. Attaining a clean mobility at the cost of causing avoidable envi- ronmental impacts is at least very questionable. Therefore, the current discussions circulating around supply chain transparency will continue to be more important. Downstream actors need to be aware of issues in the upstream. This paper pointed out some of the issues related to lithium mining and the production of graphite. The impacts of production of battery raw materials need to be studied further in order take the right decisions when trying to mitigate environmental and socioeconomic impacts. A large number of companies, enterprises and initiatives have committed to responsible sourcing of minerals. As cell manufacturing is very likely to become more important in Europe, it will be key to face issues along the whole battery supply chain. 5. References Agusdinata, D.B., Liu, W., Eakin, H. and H. Romero (2018): Socio-environmental impacts of lithium mineral extraction: towards a research agenda. In: Environmental Research Letters, Volume 13, Number 12. URL: https://doi.org/10.1088/1748-9326/aae9b1 (retrieved 02.03.2020). Albeck-Ripka, L. (2020): Mining Firm Plans to Destroy Indigenous Australian Sites, Despite Outcry. The New York Times. URL: https://www.nytimes.com/2020/06/11/world/australia/indigenous-caves- BHP-mining.html (retrieved 15.07.2020). Albemarle (2018): Albemarle and Western Australia. URL: https://www.albemarle.com/stor- age/wysiwyg/alb_kemerton_literature_051618_a4_fnl.pdf (retrieved 27.07.2020). Albemarle (2020a): Kemerton Project – 2020 Annual Compliance Assessment Report. URL: https://www.albemarle.com/storage/wysiwyg/2020_annual_compliance_assessment_report.pdf (re- trieved 13.07.2020). Albemarle (2020b): Kemerton, Western Australia. URL: https://www.albemarle.com/businesses/lith- ium/locations/western-australia/kemerton-western-australia (retrieved 13.07.2020) Allah D. Jara; Amha Betemariam; Girma Woldetinsae; Jung Yong Kim (2019): Purification, applica- tion and current market trend of natural graphite: A review. In: International Journal of Mining Science and Technology 29, S. 671–689 Alliance Mineral Assets Limited (2020): Bald Hill Mine. URL: http://www.allianceminer- als.com.au/projects/ (retrieved 18.07.2020). Altura (2020): Altura Lithium. URL: https://alturamining.com/pilgangoora-lithium/ (retrieved 19.07.2020). 20
Fab4Lib

Australian Government – Office of the Chief Economist (2019): Resources and Energy Quarterly
December 2019. URL: https://publications.industry.gov.au/publications/resourcesandenergyquar-
terlydecember2019/documents/Resources-and-Energy-Quarterly-December-2019.pdf        (retrieved
02.03.2020).

Benchmark Minerals (2020a): The rise of the lithium ion battery megafactories and the raw material
impact. Presented at Li4UK: Mapping the UK’s future circular economy for lithium-ion batteries on
12 March 2020.
Benchmark Minerals (2020b): Graphite Special Report. April 2020.

Bengtsson et al. (2018): Bengtsson, A.; Bengtsson, J.; Olsson, C.; Sedin, M.; Jedvert, K.; Theliander,
H.; Sjöholm, E. (2018): Improved yield of carbon fibres from cellulose and kraft lignin. In:
Holzforschung 72 (12), S. 1007–1016. DOI: 10.1515/hf-2018-0028.

BGS [British Geological Survey] (2020): World Mineral Statistics 2014 – 2018. URL:
https://www.bgs.ac.uk/mineralsuk/statistics/worldArchive.html (retrieved 02.07.2020)
Bradley, D.C., L.L. Stillings, B.W. Jaskula, L.A. Munk, A.D. McCauley (2017): Lithium - Chapter K of
Critical Mineral Resources of the United States—Economic and Environmental Geology and Pro-
spects for Future Supply. Edited by: K. J. Schulz, J. H. DeYoung, Jr., Robert R. Seal II, and D.C.
Bradley. URL: https://doi.org/10.3133/pp1802K

Brauneder, K.M., Montes, C., Blyth, S., Bennun, L., Butchart, S.H.M., HoffmannM, et al.(2018) Glob-
alscreening for Critical Habitat in the terrestrial realm. PLoSONE 13(3): e0193102.,
https://doi.org/10.1371/journal.pone.0193102

Buchert, M., Dolega, P., Degreif, S. (2019): Gigafactories für Lithium-Ionen-Zellen –Rohstoffbedarfe
für die globale Elektromobilität bis 2050. URL: https://www.oeko.de/fileadmin/oekodoc/Fab4Lib-
Rohstoffe-Elektromobilitaet.pdf

Buchert, M., Dolega, P., Degreif, S. (2020): igafactories für Lithium-Ionen-Zellen – Rohstoffbedarfe
für die globale Elektromobilität bis 2050. Kurzstudie erstellt im Rahmen des BMBF-Verbundprojektes
Fab4Lib -Erforschung von Maßnahmen zur Steigerung der Material- und Prozesseffizienz in der
Lithium-Ionen-Batteriezellproduktion       über    die     gesamte     Wertschöpfungskette.     URL:
https://www.oeko.de/fileadmin/oekodoc/Fab4Lib-Rohstoffe-Elektromobilitaet.pdf              (retrieved
15.07.2020)
CDC - Centers for Disease Control and Prevention (2019): Graphite (natural). URL:
https://www.cdc.gov/niosh/npg/npgd0306.html

Champion, D. (2019): Australian Resource Reviews – Lithium 2018. Geoscience Australia. URL:
https://d28rz98at9flks.cloudfront.net/126759/ARR_Lithium_2018.pdf (Retrieved 07.07.2020)
Chehreh Chelgani, S., et al. "A review of graphite beneficiation techniques." Mineral Processing and
Extractive Metallurgy Review 37.1 (2016): 58-68

DERA Deutsche Rohstoffagentur (2017): DERA Rohstoffinformationen 33 – Rohstoffrisikobewer-
tung Lithium: URL: https://www.deutsche-rohstoffagentur.de/DERA/DE/Downloads/Studie_lith-
ium_2017.pdf?__blob=publicationFile&v=3 (Retrieved 02.03.2020).

Dessemond, C., F. Lajoie-Leroux, G. Soucy, N. Laroche, J.F. Magnan (2019): Spodumene: The
Lithium Market, Resources and Processes. In: Minerals 2019, 9, 334; doi:10.3390/min9060334.

                                                                                                   21
Fab4Lib Dolega, P., Degreif, S., Buchert, M., Schüler, D. (2016): Outlining Environmental Challenges in the Non-Fuel Mining Sector. STRADE Policy Brief. URL: https://www.stradeproject.eu/filead- min/user_upload/pdf/PolicyBrief_04-2016_Sep2016_FINAL.pdf (19.07.2020). Dühnen, S., Betz, J., Kolek, M., Schmuch, R., Winter, M., & Placke, T. (2020). Toward Green Battery Cells: Perspective on Materials and Technologies. Small Methods, 2000039 Dunn, Jennifer B., et al. Material and energy flows in the production of cathode and anode materials for lithium ion batteries. No. ANL/ESD-14/10 Rev. Argonne National Lab.(ANL), Argonne, IL (United States), 2015. DWER - Department of Water and Environmental Regulation (2019): Works Approval Number W6132/2018/1. Amendment Notce 4. URL: https://www.der.wa.gov.au/images/documents/our- work/licences-and-works-approvals/Amendment_notices/W6132-2018-1a4.pdf (retrieved 19.07.2020). Environmental Protection Authority Australia (2019): Report and recommendations of the Environ- mental Protection Authority. Greenbushes Lithium Mine Expansion. URL: http://www.epa.wa.gov.au/sites/default/files/EPA_Report/EPA%20Report%20-%20Green- bushes%20Lithium%20Mine%20Expansion.pdf (Retrieved 02.03.2020) EPA WA Environmental Protection Authority Western Australia (2019): Report and recommenda- tions of the Environmental Protection Authority. Greenbushes Lithium Mine Expansion. URL: http://www.epa.wa.gov.au/sites/default/files/EPA_Report/EPA%20Report%20-%20Green- bushes%20Lithium%20Mine%20Expansion.pdf (Retrieved 02.03.2020) EPI – Environmental Performance Index (2020): Australia. URL: https://epi.yale.edu/epi-re- sults/2020/country/aus (retrieved 15.07.2020). European Commission (2019a): The European Green Deal. COM(2019) 640 final. URL: https://eur- lex.europa.eu/resource.html?uri=cellar:b828d165-1c22-11ea-8c1f- 01aa75ed71a1.0002.02/DOC_1&format=PDF (retrieved 15.07.2020) European Commission (2019b): Report from The Commission To The European Parliament, The Council, The European Economic And Social Committee, The Committee Of The Regions And The European Investment Bank on the Implementation of the Strategic Action Plan on Batteries: Building a Strategic Battery Value Chain in Europe. COM (2019) 176 final. URL: https://ec.europa.eu/com- mission/sites/beta-political/files/report-building-strategic-battery-value-chain-april2019_en.pdf (re- trieved 15.07.2020) Evans, K. (2014): Lithium. In: Critical Metals Handbook, edited by Gus Gunn, American Geophysical Union, 2014. ProQuest Ebook Central, http://ebookcentral.proquest.com/lib/senc/detail.action?do- cID=1594545. Fawthrop, A. (2020): Profiling the Greenbushes lithium mine in Western Australia. NS Energy. URL: https://www.nsenergybusiness.com/features/greenbushes-lithium-mine-australia/ (retrieved 08.07.2020). Galaxy Resources Limited (2020): Mt Cattlin. URL: https://gxy.com/mt-cattlin/ GHD (2019): Appendix F– Tailings Storage Facility 4 – Detailed Design Report (GHD 2019). URL: https://www.der.wa.gov.au/images/documents/our-work/licences-and-works- 22
Fab4Lib

approvals/Applications/application_form/W6283/W6283-2019-1-%20TSF%20Design%20Re-
port%201.pdf (retrieved 19.07.2020).
Gomez-Martin, Aurora; Martinez-Fernandez, Julian; Ruttert, Mirco; Heckmann, Andreas; Martin,
Winter; Placke, Tobias; Ramirez-Rico, Joaquin (2018): Iron-Catalyzed Graphitic Carbon Materials
from Biomass Resources as Anodes for Lithium-Ion Batteries. In: ChemSusChem 11, S. 2776–
2787.)
Hughes, A. (2020) Australian Operating Mines Map 2019. Geoscience Australia, Canberra.
http://pid.geoscience.gov.au/dataset/ga/133033
Kathirvel, P., Kwon, S. J., Lee, H. S., Karthick, S., & Saraswathy, V. (2018). Graphite Ore Tailings
as Partial Replacement of Sand in Concrete. ACI Materials Journal, 115(3), 481-492

Lämmerer, W. and Flachberger, H. (2017): Wissenswertes Zur Charakterisierung und Aufbereitung
von Rohgraphiten. In: BHM (2017) Vol. 162 (8): 336–344. DOI 10.1007/s00501-017-0651-2

Langdon, R. R., Biggs, H. C.; Rowland, B. (2016). Australian fly-in, fly-out operations: Impacts on
communities, safety, workers and their families". Work. 55 (2): 413–427. doi:10.3233/WOR-162412.
Letterman, Raymond D.; Mitsch, William J. (1978): Impact of mine drainage on a mountain stream
in Pennsylvania. In: Environmental Pollution (1970) 17 (1), S. 53–73, https://www.sciencedi-
rect.com/science/article/pii/0013932778900551?via%3Dihub, zuletzt geprüft am 22.05.2020.)

Lithium Australia (2020): Summary of projects and alliances. URL: https://lithium-au.com/projects-
and-alliances/ (retrieved 19.07.2020).

Liu, W. and D.B. Agusdinata (2020): Interdependencies of lithium mining and communities sustain-
ability in Salar de Atacama, Chile. In: Journal of Cleaner Production, Volume 260.
https://doi.org/10.1016/j.jclepro.2020.120838

Mineral Resources (2020a): Mt Marion Lithium. URL: https://www.mineralresources.com.au/our-
business/commodities/lithium/mt-marion-lithium/ (retrieved 13.07.2020)

Mineral Resources (2020b): Wodgina Lithium. URL: https://www.mineralresources.com.au/our-busi-
ness/commodities/lithium/wodgina-lithium-project-upgrade/ (retrieved 13.07.2020)

Mining Data Online (2020a): Mt Cattlin Mine. URL: https://miningdataonline.com/property/4504/Mt-
Cattlin-Mine.aspx (retrieved 18.07.2020).

Mining Data Online (2020b): Mt Marion Mine. URL https://miningdataonline.com/property/3359/Mt-
Marion-Mine.aspx (retrieved 18.07.2020).

Mining Technology (2020): Mount Marion Lithium Project. URL: https://www.mining-technol-
ogy.com/projects/mount-marion-lithium-project/ (retrieved 18.07.2020).

NAIF - Northern Australian Infrastructure Facility (2018): Pilbara Minerals Limited - Upgrade Pippin-
garra Road, a 70km public road to access the Pilgangoora lithium-tantalum mine (Investment Deci-
sion August 2018). URL: https://naif.gov.au/case-studies/pilbara-minerals-investment-decision/ (re-
trieved 15.07.2020).
Nozaki, Hidehiko, et al. "Carbon-coated graphite for anode of lithium ion rechargeable batteries:
carbon coating conditions and precursors." Journal of Power Sources 194.1 (2009): 486-493

                                                                                                  23
You can also read