Seismicity of the Klerksdorp Goldfields and the Resulting Seismic Hazard - Springer
←
→
Page content transcription
If your browser does not render page correctly, please read the page content below
Chapter 2
Seismicity of the Klerksdorp Goldfields
and the Resulting Seismic Hazard

Mining in this district started as early as 1886. Deep-level mining to 1500 m
commenced in 1937/38. With increasing mining depths came the associated seis-
micity. The association of these seismic events with damage and injuries was such
that, in 1969, it was decided to establish a permanent seismic network. This net-
work was funded by all four mines operational at that time, in collaboration with the
Chamber of Mines of South Africa. By 1982, it was established that all large
magnitude seismic events in this region were related to geological features. Several
hazardous faults and dykes were identified that were the source of seismic events.
This resulted in the application of several changes in mining sequences and support
patterns around those features. In addition, protective actions for excavations
crossing geological discontinuities were implemented.
    The Klerksdorp Goldfield lies on the north-western rim of the Witwatersrand
basin (Fig. 2.1), about 160 km southwest of Johannesburg. The gold mines sur-
round the towns of Klerksdorp, Stilfontein, and Orkney. The area, part of the
so-called African Peneplane is about 1200–1500 m above sea level. The terrain is
flat but has some hills (koppies) up to about 100 m high. The climate is typical for
the Highveld. The summers are warm and sunny with about 600 mm of rainfall.
The winters are sunny, dry, but cold with temperatures oscillating between −5° at
night and up to +25 °C during the day. There are two rivers in the area, the Vaal
River and the Schoonspruit.
    Several conglomerate bands have been mined in the area. Starting with the
oldest, there is the Dominion Reefs occurring in the strata underlying the Hospital
Hill Series, then the Government Reef Series, the Commonage Reef (cover portion
of the Main-Bird Series), the Vaal Reefs in the upper part of the Main-Bird Series,
the Gold Estates Reefs of the Kimberley Series, the Ventersdorp Contact Reef
(VCR) on top of the Elsburg Stage, and the Black Reef Series of the Transvaal
System (Antrobus et al. 1986). Witwatersrand means “Ridge of White Waters”.
This is the name of the hills located north of Johannesburg. These hills form a
watershed as the rivers of the southern slopes flow to the Atlantic Ocean, while the
waters of those of the northern slopes end up in the Indian Ocean. The
© Springer International Publishing AG 2018                                       19
S.N. Glazer, Mine Seismology: Seismic Warning Concept,
https://doi.org/10.1007/978-3-319-62353-5_2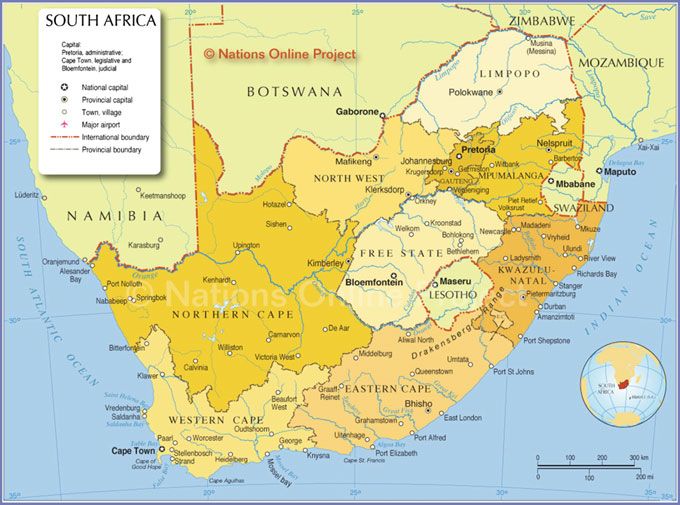
20                            2 Seismicity of the Klerksdorp Goldfields and the Resulting …

Fig. 2.1 Localization of Klerksdorp

Witwatersrand basin is situated on the Highveld 1370–1829 m above sea level,
some 550 km from the coast between longitudes 26° 30′ and 29° 15′E and latitudes
26° 00′ and 28° 15′S. The Witwatersrand basin is elongated in shape. It is about
150 km along a SE–NW direction and about 300 km along the NE–SW line. The
centre of the Witwatersrand system is punctured by a structure known as the
Vredefort Dome. Most of the conglomerates containing minable gold occur in the
Upper Witwatersrand beds and most of the gold producing mines are situated along
its outcrop close to towns such as Carletonville, Randfontein, Johannesburg,
Springs, Heidelberg, Virginia, Welkom, and Klerksdorp. The first discoveries of
gold were made on the Central Rand (Randfontein–Springs area). At present, this is
the most populated and industrialised part of South Africa with Johannesburg
located in its centre. The Witwatersrand System is closely related to the underlying
Dominion Reef System and the overlying Ventersdorp System. Those three systems
are often referred to as the Witwatersrand Triad. Below the, Triad are the granites,
gneisses and schists of the Swaziland System. Those formations are of the early
Precambrian age. Extensive major faulting has taken place along the strike of the
beds, tangential to the basin. These faults occur for a large part in the beds of the
Lower Witwatersrand, but in places they also affect the beds of the Upper
Witwatersrand. These faults are the Rietfontein Fault (Central Rand), Witpoortjie
and Roodepoort Faults (West Rand), Buffelsdoorn and Kromdraai Faults
(Klerksdorp Goldfield), and De Bron Fault in the Orange Free State. Other major
2 Seismicity of the Klerksdorp Goldfields and the Resulting …                         21

faults as the Sugarbush (East Rand) or the Bank Faults are transverse faults, ori-
entated radially with respect to the Witwatersrand basin. These major faults are
post-Ventersdorp and pre-Transvaal in age. Furthermore, the gold bearing reefs
have been displaced by numerous relatively minor strike and transverse faults. The
throw along any given fault plane may vary, which gives rise to a wedge of faulted
ground along one side, of which the displacement can increase from zero to about
100 m. Many of the faults that cut the ore-bodies are occupied by dykes. Their age
varies from Ventersdorp to Karoo and earlier (Whiteside et al. 1976). The
Witwatersrand basin contains nine different goldfields. These are:
–   Evander Goldfield
–   South Rand Goldfield
–   East Rand and Heidelberg Goldfield
–   Central Rand Goldfield
–   West Rand Goldfield
–   West Wits Line
–   Vredefort Goldfield
–   Klerksdorp Goldfield
–   Orange Free State Goldfield

2.1    History of Gold Mining in the Klerksdorp Area

The position of the sub-outcrop of the Vaal Reef has been determined by drillings,
and the reef has been found to underlie an area of about 260 km2 on the northern
bank of the Vaal River. The Vaal Reef has also been intersected within a large area
on the south side of the Vaal River, and the reef is mined in this sector of the field as
well. Along the western margin of the Klerksdorp field, the truncation of the Vaal
Reef has been affected either by the Buffelsdoorn Fault or by the unconformity
associated with the Gold Estates Reef. Along the northern and eastern margin, the
Vaal Reef sub-outcrops against lava or dolomite. Dykes and sills of various ages are
common in the Klerksdorp goldmines. The oldest are related to faults, with varying
amounts of throw, whereas the younger ones are not related to faulting. There are
several intrusions that are pre-Upper Ventersdorp, several that are pre-Transvaal
and several that are post-Transvaal.
    It is not known exactly when the first Voortrekkers arrived in the Klerksdorp
area, but in about 1837/1838 there were already twelve settlers on the west bank of
the Schoonspruit (Bruns 1977). Klerksdorp derives its name from the first magis-
trate Jacob de Clerq. The year 1865 saw the first trading business to be opened—
The Taylor and Leask General Dealers. After the discovery of diamonds in the
Kimberley area, the volume of trade increased. The first inn “Hail Smilin Morn”
became popular with those travelling to and from the diamond area. In 1886, when
gold was discovered on the Witwatersrand, Klerksdorp became a popular stop-over
point between Kimberly and the Witwatersrand. The fortunes won on the Reef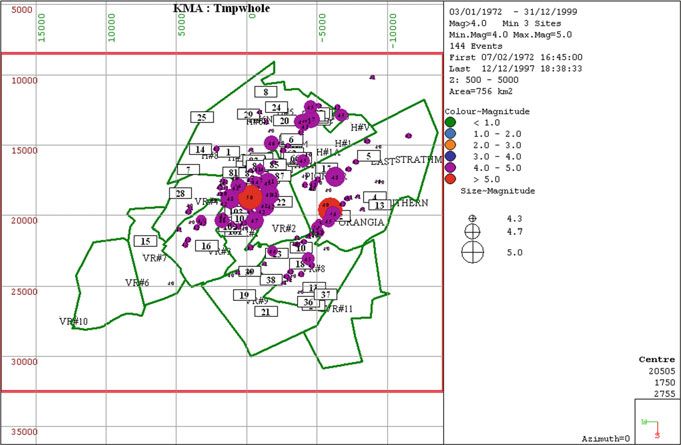
22                          2 Seismicity of the Klerksdorp Goldfields and the Resulting …

encouraged local prospecting in the Klerksdorp area. The first recorded successful
prospecting was done by Apie Roos, a grandson of one of the first Voortrekker
settlers. In the Pretoria archives, there is a letter dated 23rd August 1886 from Mr.
Roos addressed to the President of the Zuid-Afrikaansche Republiek, Mr. Kruger.
In this letter, he states that he had discovered a gold-bearing conglomerate, a sample
of which was assayed at 27 penny weights per ton (42 g per ton?). As it stands
today, the exact spot of this first discovery is unknown. According to official
records, the starting date of the Klerksdorp Goldfields is 11th July 1887, when the
farm Rietkuil was proclaimed. In a very short time, hundreds of fortune seekers
with small blocks of claims started the formation of companies and syndicates.
Mines were opened up, flourished for a while, then closed down again only to be
re-opened by another company under a new and better sounding name. The
Klerksdorp village got its first permanent brick buildings, houses, shops, hotels,
churches, stores and offices. At one stage, it had no less than 68 licensed bars, liquor
stores and wholesale liquor shops. One can imagine that these must have been the
scene of many drunken parties and fights (Brown 1983).
    On the Black Reef Series ridge, known as the Bosrand and running northwards
from Orkney between Klerksdorp and Stilfontein, more than 20 mines operated at
various times. The most important were Machavie, Eastleigh, Ariston, and Orkney.
Colourful company names, such as Comstock, Banket Sheba, Nancy Lee, Royal
Windsor, Shamrock, Ada May, Rose Beryl, and Beatrice were created to attract
money from unsuspecting overseas investors. A few companies lasted longer than
others, but only a few of these mushroom firms survived for more than a few years.
Yet despite the fact that most of the individual mines were small, a stock exchange,
rivalling that of Johannesburg was opened in 1888. It was then closed about a year
later. Still, it saw some brisk business and it is recorded that, during one particular
day, the transactions amounted to £10,000. After its short life, the exchange site
became the centre of the town’s amusement and for 40 years was used for dances.
Although the village of Klerksdorp was surrounded by mining activity during this
period, it must be remembered that, for the most part, those were individual efforts
on a very small scale. The shafts were all inclined, the headgears were of small
wooden construction, and the crushing was done by three- or five-stamp batteries.
The geological information was very scanty and the metallurgical processes had
very poor recovery rates. On top of this, capital was always a major problem.
Despite those difficulties, gold production continued to increase. The real boom
lasted from 1894 to the outbreak of the Anglo-Boer War. In 1895, a peak output of
over 70,000 ounces (1984 kg) was reached. This record production was reached
again only 40 years later. From 1900 to 1902, all production came to a standstill.
Many of the headgears were broken down and then used as firewood by British or
Boer forces, who alternately occupied Klerksdorp on numerous occasions. After the
signing of the peace treaty, the local mining industry made a slow recovery. By
1911, gold production had reached 30,000 ounces (850 kg) a year. This figure was
maintained until 1915, when the effects of the First World War were felt. The
almost complete cessation of mining activities during the First World War was a
very serious blow to the local industry. It then recovered from this recession only in
2.1 History of Gold Mining in the Klerksdorp Area                                  23

1934. During this period, the Afrikander mine was often the only producer in the
entire district. In 1933, Dr. Louis T. Nel of the Geological Survey of South Africa
began his investigations in the Klerksdorp area. He published his finding in 1935, in
which he presented the first proper map of the Klerksdorp–Ventersdorp area (Nell
1935). As a result of this new information, interest in the area was rekindled, and
the large mining houses took a strong interest in the area. Anglo Transvaal opened
the New Klerksdorp Gold Estates; New Union took over New Mines and the old
Klerksdorp Proprietary mine; and New Machavie was then reopened jointly by
Anglo-French and Barbrosco. The Afrikander and Dominium Reef were restarted
by Bewick and Moering. Several smaller mines were opened up as one-man shows.
The biggest commitment came from Anglo American. As a result of South Africa
going off the gold standard in 1933, the Anglo American Corporation realised the
importance of extending their gold-mining operations. As a result, all possible
further areas for prospecting were investigated. After extensive searching, boreholes
intersected payable values in the Ventersdorp Contract and Elsbury Reefs. This led
to the first large mine, Western Reefs, which came into production in 1941.
Disregarding the small workings, there were at that time only seven mines in the
district, but such was the magnitude of their operations that the old production
record of 70,000 ounces a year was soon surpassed. Initially, this was due to the
high output from Machavie, but later Dominion Reefs and Western Reef played an
increasing role. It seemed as if, at last, the area’s promise was to be realised when,
in 1939, the Second World War broke out. Although this was not to be as crippling
as the First World War, it still caused a severe setback due to the curtailment of
prospecting operations and an increase in the working cost. New Machavie closed
down in 1944. During the closing stages of the war, drillings in the Orange Free
State, south of Klerksdorp, revealed highly payable values of gold, and the attention
of the financiers moved south. Still, Anglo-Transvaal invested in the Klerksdorp
area by having New Klerksdorp Gold Estates take over the struggling New Mines.
Anglo American continued their exploration of the area east of Western Reefs. At
the same time, a company named New Pioneer began drilling on the farm
Stilfontein and, in 1948, hit the jackpot. Klerksdorp’s new era had begun. Three
mines were opened: Stilfontein, Hartebeestfontein, and Buffelsfontein as a joint
operation between Anglo-Transvaal and New Pioneer. Anglo American
Corporation also opened a new mine Vaal Reefs east of Western Reefs. Jointly with
Anglo-Transvaal, Zandpan Gold Mining Company was formed and Scott’s
Company established a mine called Ellaton. Barbrosco and Dominion Reefs had
been forced to close down due to lack of pay ability and rising costs (Guest 1938,
1987).
   Because of the encouraging borehole results from the Vaal Reefs horizon being
drilled to the east of Western Reefs, the Vaal Reefs Exploration and Mining
Company acquired nearly 7000 claims. The transfer of property took place in
January 1946. During the following years, several shafts were sunk, such as
No. 3 Shaft between 1949 and 1951, No. 4 Shaft between 1960 and 1961, and
No. 2 Shaft in 1959. In August 1966, Vaal Reefs announced that it had plans to
explore the Vaal Reefs horizon in the area south of the Vaal River. This new area
24                          2 Seismicity of the Klerksdorp Goldfields and the Resulting …

Table 2.1 1996 production     Mine                Gold      Tons               Grade
figures                                            (kg)      milled  1000      g/t
                              Vaal Reefs          67,326    13,393              8.55
                              Hartebeestfontein   10,543     1500               7.03
                              Buffelsfontein       7600      1000              13.00

was to be worked as an extension to the mine’s existing lease area and was to be
known as Vaal Reefs South. The Vaal Reefs complex was formed on 20 September
1971, with the merger of three mines: Western Reefs, Vaal Reefs, and Vaal Reefs
South. Up to 1998, Vaal Reefs Exploration and Mining Company operated several
shafts at different stages of their productive lives, from very mature, with very
limited time left, to those that were still in the early production stage or only at the
sinking stage. Apart from Vaal Reefs Exploration and Mining Company, the
Klerksdorp Goldfield during 1997 had two more operational mines,
Hartebeestfontein and Buffelsfontein. The Stilfontein Gold Mine closed down its
operations in 1992. The 1996 gold-production figures are presented in Table 2.1.

2.2    Seismicity of South Africa

Southern Africa is regarded as one of the most stable regions of the Earth as far as
seismic activity is concerned. This region shows typical inter-plate seismicity with
only a sporadic occurrence of natural earthquakes. Due to the relatively short
documented history, little is known of the seismic history of the region. The
Earthquake Catalogue of the Geological Survey of South Africa lists seismic events
based on observations of its South African Seismograph Station Network since
1971. This catalogue shows that two types of seismic events occur: natural earth-
quakes and mine tremors that are associated with local mining activity. Southern
Africa is located in the interior of the large African Plate. The borders of this plate
in the south are the mid-Atlantic and mid-Indian Ocean ridges. The line of shallow
seismic foci along these borders is continuous and well-defined. The continent itself
is not affected by the distant tremors of this belt. The East African Rift System,
another clear line of seismicity, has not been unequivocally shown to extend into
Southern Africa, although the relatively higher seismicity of Mozambique,
Zimbabwe, and northern Botswana can perhaps be considered as due to a southern
extension of the Rift System.
    The seismicity of the interior of the African Plate, especially in its southern
portion, is, by world standards, very moderate and of a shallow character. In the rest
of Southern Africa, two areas have been affected by large earthquakes. One is the
southern Orange Free State, affected in 1912 by a shock of maximum intensity IX
on the Rossi-Forel scale, and the other the Ceres-Tulbagh region of the Cape
Province, where an earthquake of magnitude 6.3 on the Richter scale occurred in
1969. Occasional bursts of seismic activity have occurred at numerous other places
2.2 Seismicity of South Africa 25
in South Africa. As the catalogue indicates, the occurrence of earthquake swarms is
not infrequent. This is the case for the series of tremors at Sutherland in 1952 and
on the Cape-Lesotho border in 1953. The eastern coast of Southern Africa has been
affected by tremors with epicentres in the Mozambique Channel (Fernandez and
Guzman 1979a). In view of this pattern of seismicity it is difficult to correlate
earthquake foci with geological features. Earthquakes have occurred on the ancient
cratons, as well as in the mobile belts. The Cape Fold Mountains and the adjacent
Karoo basin are equally subject to sporadic activity. Even tectonic features sus-
pected on geological grounds to be active, such as the Doringberg Lineament, do
not appear, in the long term, to be correlated with more tremors than are other
features. The historical record of seismicity in Southern Africa is not only restricted
in time, but is also affected by the uneven distribution of human population. As
more instrumental records are obtained, the human factor will be eliminated, and
the genuine areas of seismic activity will be revealed. According to Fernandez and
Guzman (1979b), the number of natural earthquakes in Africa from the beginning
of the 20th century to the end of 1970 is as follows (Table 2.2).
In the catalogue of natural earthquakes of Southern Africa, which starts from
1620 and ends in 1970 (Fernandez and Guzman 1979a), there are listed only three
events that are located close to Klerksdorp (±80 km); see Table 2.3. The tectonic
events and the mine-induced tremors form two different sets of data and for this
reason should be studied independently (Shapira et al. 1989).
Before 1908, only a couple of tremors per year were known to occur in the
vicinity of Johannesburg mines (Gane 1939). In 1911, a Wiechert seismograph was
installed, which recorded nearly 15,000 events from 1911 to 1937. The first sig-
nificant study of mine-related tremors in South Africa started in 1939, when a
surface array of mechanical recorders was installed. Those studies, despite their
limitations, clearly showed the direct relationship between the face advance and
seismicity (Gane et al. 1946). According to Finsen (1950), for the time period
1938–1949, over 29,000 mine tremors were recorded. The first underground
Table 2.2 Number of Decade No of earthquakes
earthquakes in South Africa
(1900–1970) 1900–1910 34
1910–1920 59
1920–1930 47
1930–1040 32
1940–1950 22
1950–1960 53
1960–1970 52
Table 2.3 Earthquakes close Date Richter magnitude
to Klerksdorp
1935/09/11 Between 3.0 and 4.0
1952/06/29 M = 3.2
1970/08/30 M = 3.726 2 Seismicity of the Klerksdorp Goldfields and the Resulting … seismic system was installed in the late 1950s at ERPM (East Rand Propriety Mines) by Cook (1962). Using this system, he was able to show that most of the recorded events occurred in front of and close to the stope face. He was also able to classify the events roughly by size, and, based on this, he concluded that only the largest of events resulted in rock-burst damage. Joughin (1966) installed a nine-seismometer network at Harmony mine, Free State Gold Fields, from which he was able to show that not only were the seismic events located in the reef plane and in the hanging wall, but that some events were located along the dykes. He also observed that a small portion of the events occurred a couple of hundred of metres above the reef in a sill. The importance of these first seismic observations was that they not only confirmed the close relationship between the mining and the seismic activity, but that the local geology played a major role in controlling the distribution of the events. They also indicated that mine seismology, even used with limited knowledge, has a potential to provide management the likely location where an event would occur and the likelihood of rock-burst damage. The most important seismological development during 1970–1980 was the establishment of the Klerksdorp Regional Seismic Network in 1971 and its gradual upgrading, which started the widespread use of mine-wide networks for manage- ment information purposes. Studies using this network (van der Heever 1982) were directed at the relationships between the extensively faulted geology and the seis- micity. Those developments established the potential for using seismic information for rock-burst control management. 2.3 The Klerksdorp Regional Seismic Network Rock bursts and rock falls have posed a serious problem in gold mines of the Witwatersrand practically since the beginning of the industry. Data on their inci- dence reveal that these events are the single most important cause of accidents and fatalities in gold mines. They also result in loss of production and of revenue. It is not surprising that these events have already, for many years, been, and continue to be, of great concern to the gold-mining industry. Evidence of this is the fact that government committees were appointed in 1908, 1915, 1924, and 1964 to report on earth tremors and rock bursts. Despite the considered advice of those committees and continued efforts by the gold-mining industry, the problem of rock bursts and rock falls remained as serious as ever, mainly as a result of the increasing extent and depths of mining. In the decade since 1964, there has been a growth in the science and practice of rock mechanics. However, by 1977, it was realised that most of the information that had been accumulated is dispersed throughout a great number of scientific and technical publications and in the proceedings of many conferences, and some of the important practical issues concerning implementation have not been published or implemented in industry. For this reason, it was necessary to bring together the scientific, technical, and managerial knowledge regarding these problems. This has been done by the High-Level Committee on Rockbursts and
2.3 The Klerksdorp Regional Seismic Network                                     27

Rockfalls, which was formed on the recommendation of the Research Advisory
Committee of the Chamber of Mines of South Africa. This committee comprised
the Research Advisory Committee, the Technical Advisory Committee, the
Association of Mine Managers, and representatives of the rock mechanics engi-
neers. This committee (COMRO 1977) published “An Industry Guide to the
Amelioration of the Hazards of Rockburst and Rockfalls”. In this guide, it was
concluded, as far as seismic monitoring is concerned, that the use of seismic net-
works should result in:
– location of seismic sources
– indication of trends in ground behaviour
– planning and control of mining operations—providing the mechanics of rock
  bursts will become understood
– indicating areas that might be more active due to geological features or inherent
  stress
All those objects are valid today.
   The Klerksdorp Regional Seismic Network was established in 1971 as a result of
the abnormally high seismic activity observed during years 1960–1970. Some of
those events resulted in rock bursts that caused several deaths and damage to
underground excavations. Some damage to surface structures was also observed.
The main objective of this network was to obtain some understanding of hazards
associated with seismicity in the Klerksdorp area in order to introduce preventive
measures. This network was a joint venture of the Chamber of Mines and the four
mines of the Klerksdorp Goldfield: Vaal Reefs, Hartebeestfontein, Buffelsfontein,
and Stilfontein. At the beginning (1971/1972), the network consisted of only five
geophone stations. In 1973, the network was expanded to eight stations. During
1976/1977, another eight geophone stations were added. In 1982, the network
consisted of 24 stations, and in 1988 it had already reached 29 stations, of which
eight were surface ones and the rest was located at depths up to 2700 m. The
distribution of those stations among the mines was as follows:
Vaal Reefs          13 stations
Hartebeestfontein   8 stations
Buffelsfontein      6 stations
Stilfontein         2 stations
Figure 2.2 illustrates the network configuration as it was in July 1988. In order to
verify the location accuracy and measure the seismic wave velocity, five calibration
blasts were made before 1982 in various areas within the Klerksdorp Goldfield (van
der Heever 1982). The result was that the network could reliably locate sources of
seismic events with an accuracy corresponding to about 0.8% of the seismic path
lengths, providing corrections were made for waves travelling through the
Ventersdorp lava and Transvaal dolomite. Those corrections were then calculated
and applied to surface stations. As far as velocities are concerned, the following
values were established (Table 2.4).
28                               2 Seismicity of the Klerksdorp Goldfields and the Resulting …

            Underground station                                STILFONTAIN
            Surface station

          Scale 1:125000

                                         HARTEBEESTFONTEIN

                                                                BUFFELSFONTEIN

                             VAAL REEFS

Fig. 2.2 Klerksdorp Regional Seismic Network, 1988

Table 2.4 Seismic wave            Rock type                  Vp (m/s)      Vs (m/s)
velocities for Klerksdorp area
                                  Witwatersrand quartzite    5675          3575
                                  Ventersdorp lava           6360          4150
                                  Transvaal dolomite         6260          Not determined

    The technical description of the network, as it was at the beginning of the 1980s,
is given by Scheepers (1982) and van der Heever (1982). From that time, the
network went through several upgrades and modifications. All the monitoring
stations by this time were equipped with 14 Hz geophones which were installed as
triaxial units in brass boats. In the case of underground stations, the geophone probe
was installed in a 5-m-long hole drilled into the hanging wall. The analogue signal
from the geophone was passed through amplifying and modulating circuits on the
site, then through telephone cables along crosscuts, haulages, and up the shaft to a
transmitter located at the top of the headgear. This analogue signal was transmitted
continually by VHF radio to the seismic office that at that time was located at
Margaret Shaft in the Stilfontein Gold Mine. The surface sites located at remote
locations were powered by solar panels. At the central processing office, the signals
from 29 stations were collected, demodulated, filtered, and then held in the pro-
cessors memory buffers. All channels were then simultaneously monitored by a
trigger circuit. The trigger was activated by simultaneous changes in at least five
geophones. When a trigger impulse was given, a four-second history of each
2.3 The Klerksdorp Regional Seismic Network 29
channel was written into memory. The location of the event was then calculated
from the first arrival times, which were read manually channel by channel. The
event magnitude was then calculated on a duration scale, which was calibrated
against magnitudes as reported by the Geological Survey, Department of Mineral
and Energy Affairs, RSA (Webber 1988). The Klerksdorp Regional Seismic
Network duration magnitude, MKRSN itself, is given by the following relation:
MKRSN ¼ 1:45 log D þ 0:12
where D event duration in seconds.
It was common practice at that time to correct magnitudes of those events that
were also recorded by the South African Geological Survey Network to values as
reported by them in their monthly Seismological Bulletins. The source parameters
of the events recorded by the Klerksdorp Regional Seismic Network were then
estimated as follows:
The approximate seismic moment was calculated using the formula (Hanks and
Kanamori 1979):
log M ¼ 1:5 MKRSN þ 9:1½Nm
The approximate seismic energy was calculated using the formula (Gutenberg an
Richter 1956):
log E ¼ 1:5 MKRSN 1:2½MJ
2.4 Severity of the Klerksdorp Goldfields Seismic Hazard
It is difficult to find information about mine-induced events for the time before
1971. However, some information could be found in local newspapers. The
Western Transvaal Record (23/02/68), for example, reported that mine fatalities
were once again put under the spotlight, when it was revealed that, during 1967, no
less than 101 workers were killed in the six gold mines operating at that time in the
region. Of this number, 60% of the fatalities were caused by falls of ground. This
type of news about mine-related fatalities dominated the local news media
throughout 1968. In July 1968 the fatality figure stood at 60 workers killed for the
year. As the South African Seismograph Station Network started to operate only in
1971, the recorded number of events for the Klerksdorp Gold Mines during 1971
and 1972 can be an indication of the seismic hazard experienced in this area before
1970. For 1971, this network recorded 23 events of local magnitude above 3.0 and,
for 1972, 19 events of such magnitude. The biggest rock-burst-related accidents
were also reported by the local press. What follows are two such reports relating to
rock-burst related accidents, one at Vaal Reefs and the other at Buffelsfontein. Vaal
Reefs experienced some troubled times (Western Transvaal Record 07/03/74),30 2 Seismicity of the Klerksdorp Goldfields and the Resulting …
when a rock burst trapped some 18 miners underground, of which only nine sur-
vived. In spite of every effort made by rescue teams from the mine, as well as
surrounding mines, the remaining workers could not be reached in time. In March,
the mine announced that the rescue operations were to be abandoned and the area
sealed off. Eight bodies were to be entombed for ever. On Wednesday, April 26,
1978 at 11:00, Buffelsfontein mine experienced one of its worst rock bursts in
history, which registered 4.6 on the Richter scale (Western Transvaal Record
28/04/1978). It was to be one of the strangest incidents in mining accidents that ever
happened in the Klerksdorp Goldfields. An earlier tremor in the day caused some
extensive damage to a stope on the 27th level of the Southern Shaft of the mine. No
injuries or loss of life were reported during this tremor. Some mine officials pro-
ceeded underground to investigate the damage that occurred in this 27-level stope.
As if fate had summoned them underground, another more severe rock burst
occurred soon after these officials reached the damage area, and five men were
killed. Rescue operations were immediately instituted, and the papers even pub-
lished extra pages in the Friday edition of the Klerksdorp Record in order to report
on the accident at the mine. What makes this accident that more important to the
mining industry is the fact that the damage to the haulage where the men were killed
could not to be opened in the weeks to come and it was truly a sad day in the history
of Buffelsfontein GM as yet more people were to be entombed in a mine.
One of the largest events in the history of the Klerksdorp Goldfields took place on
7 April 1977 at Vaal Reefs. This tremor was recorded by 40 seismological stations
around the world, and the US Geological Survey assigned a body-wave magnitude
(mb) of 5.5 to it (Fernandez and van der Heever 1984). The local Richter magnitude
was determined by the South African Geological Survey to be 5.2. The main tremor
was followed by an aftershock swarm. (Fernandez and Labuschagne 1979). All
access tunnels close to the focal region were rendered inaccessible, while scattered
falls occurred over an area of approximately 7.0 km2. The main shock also resulted
in appreciable damage to structures in the surrounding towns of Klerksdorp, Orkney,
and Stilfontein. The majority of rock bursts in this area are associated with move-
ment on major geological discontinuities. This type of mine-induced seismicity for
this region was recognized before 1981 and is described by several authors, for
example, van der Heever (1982), and Gay et al. (1984). A second event of similar
size took place about 26 years later. A seismic event with a local magnitude of
ML = 5.3 occurred at 12:15 on 9 March 2005 at DRDGOLD’s NorthWest
Operations in the Klerksdorp district. The event and aftershocks shook the nearby
town of Stilfontein, causing serious damage to several buildings and causing minor
injuries to 58 people. At the mine, two mineworkers lost their lives, 20 mineworkers
were injured at various locations in the No. 5 Shaft underground workings, 40
mineworkers were trapped in the stope for about 8 h, and 3200 mineworkers were
evacuated under difficult circumstances. The third such large event took place on 05
August 2014 and was of local magnitude ML = 5.5. The earthquake was felt in
South Africa as far as away as Cape Town. It was also felt in Maputo, Mozambique,
and in Botswana (Midzi et al. 2015). Surface damage was reported in Orkney where
500 houses were destroyed. Many people were injured, and one person was reported2.4 Severity of the Klerksdorp Goldfields Seismic Hazard 31
to have died as a result of a wall collapsing on him. Mining Company AngloGold
Ashanti reported that 17 employees at two mines in the Orkney region sustained
minor injures. The events on 9 March 2005 raised some wider questions. Are the
technologies available to manage seismicity adequate in the current situation of
remnant mining, deeper mines, and mining within large mined-out areas? Are cur-
rent approaches to planning, design, monitoring, and management appropriate and
adequate? Does mining, past and present, trigger or induce large seismic events and
will it continue to do so in the future? Can the impact of seismicity on mining towns
and communities be limited, and, if so, how? (Durrhein et al. 2006). The investi-
gation after this event resulted in classifying this event and similar-in-type events as
triggered by mining operations. Still, it remains surprising that for many mining
specialists this event was such an unexpected occurrence. According to an assess-
ment of seismic hazard in the Klerksdorp area (Gibowicz and Kijko 1994), the
maximum expected event magnitude is well above ML = 5.0 with a recurrence time
of more than 20 years. This information is public knowledge as it was published and
should be something that one would expect mining experts to know. In my Ph.D.
thesis (Glazer 1998), I have written that seismicity of magnitude sizes from 3.5 and
up is triggered not by present mining operations but by the entirety of mining that
took place in the area from the start of mining operations. An example of such an
event was one recorded on 10 February 1997. This was an event of magnitude 4.3
(see Sects. 3.3.1 and 4.11). Table 2.5 lists the number of events recorded by the
Klerksdorp Regional Seismic Network from January 1972 to September 1990.
Note the increase in the network’s sensitivity in 1977, when it started to record
events of MKSRN below 1.0. The next increase in the number of recorded events of
MKSRN below 1.0 was in 1989. These are the events recorded by the Chamber of
Mines micro-network at No. 5 Shaft, Vaal Reefs. The number of recorded events of
this size dropped again in 1990 due to the upgrading of the network which took
over six months.
The original purpose of the network was twofold:
1. Rapid and accurate event locations for prompt rescue and opening-up operations
2. Identification of seismically hazardous geological structures.
The aim was also twofold: to improve safety and productivity of the mines. With
time, the purposes of the seismic networks became more and more complex and
included the following:
1. Identification of seismically hazardous mining situations in highly faulted
ground.
2. Establishment of criteria likely to result in seismically hazardous situations.
3. Investigation of rock-burst damage and its relationship to focal mechanism of
the event that caused it.
Application of seismic research that was based on seismicity recorded by the
KMMA Regional Seismic Network into rock engineering and mining during
the time period from 1970 up to 1990 are described in great detail by Glazer32 2 Seismicity of the Klerksdorp Goldfields and the Resulting …
Table 2.5 Number of events recorded by the Klerksdorp Regional Seismic Network
Year Below 1.0 1.0–1.9 2.0–2.9 3.0–3.9 Above 4.0 Total
1972 0 37 185 21 2 245
1973 0 86 96 22 2 202
1974 0 151 88 21 2 262
1975 0 47 36 16 1 100
1976 2 32 59 18 3 114
1977 163 231 114 21 4 515
1978 237 587 305 79 2 1210
1979 182 425 235 49 4 895
1980 111 275 202 42 4 634
1981 101 324 172 32 1 630
1982 190 380 157 34 5 766
1983 386 594 172 50 15 1217
1984 397 370 158 50 9 984
1985 156 433 161 37 5 792
1986 159 418 215 28 2 822
1987 394 264 176 32 2 868
1988 324 421 258 39 4 1046
1989 1087 947 351 57 2 2444
1990 193 1066 432 87 2 1780
Total 4082 7070 3572 735 71 15,530
(1998, 2016). These applications are still practical and applicable to mining in areas
that experience induced seismicity.
A statistical assessment of seismic hazard in the Klerksdorp area is given in
Gibowicz and Kijko (1994). This is an example of the application of a technique
used in the case of an incomplete and uncertain catalogue of seismic events (Kijko
and Sellevoll 1989, 1992) for data recorded by a mine seismic network. This
method is a maximum-likelihood method for estimating hazard parameters, such as
maximum regional magnitude Mmax, seismic activity rate k, and the b parameter of
the Gutenberg-Richter relation. The catalogue of seismic events that was used at
that time for the calculations was prepared at the end of 1991 and included events as
recorded by the Klerksdorp Regional Seismic Network from 1 January 1972 to 31
December 1991. Due to the known history of seismic monitoring in the area, this
catalogue was divided into three parts. The first part covers the time period from 1
January 1972 to 31 December 1984; the second part is for the period 1 January
1985 to 31 December 1990; and the third part is for the period 1 September 1990 to
31 December 1991. This catalogue was divided into three parts because of the
monitoring facilities existing at that time. In the beginning, the network had only a
few stations in operation. A larger number of stations were in operation only from
the beginning of 1985 (±20 stations). In September 1990, the upgrade from ana-
logue to digital was fully implemented. The drop in the number of recorded events
at the beginning of 1990 was due to switching between the systems. After this drop,2.4 Severity of the Klerksdorp Goldfields Seismic Hazard 33
Table 2.6 Threshold magnitudes and standard deviation values
Catalogue part Mmin Standard deviation
Part one 3.0 0.3
Part two 2.7 0.2
Part three 2.5 0.1
there is a clearly visible steady increase in the number of recorded events right to
the end of 1991. For the above reason, the following criteria were introduced
(Table 2.6).
In total, this catalogue included 1559 events, which were split equally between
the three parts (514, 522 and 523 events). As all the events before 1990 were, as a
matter of routine, converted to values as given by the Geological Survey Bulletins,
only those recorded after September 1990 had to be recalculated. It was assumed
that the maximum, observed local magnitude was equal to 5.0. With the above
assumptions, the following values were calculated:
b ¼ 2:90 0:07
k ¼ 692:8 35:1 per year: ðfor Mmin ¼ 2:0Þ
Mmax ¼ 5:19 0:15
From the mean return graph, the following could be concluded (Table 2.7).
It is interesting to note that the largest seismic events in the Klerksdorp Goldfield
took place on 7 April 1977 (event size 5.2) and then, after nearly 25 years, on 9
March 2005 (event size of 5.3). The extent of the hazard resulting from seismic
events is illustrated by Table 2.8, which shows the number of potentially damaging
events in the Klerksdorp area from 1989 to end of 1996, together with the number
of fatalities due to seismic events, for the same period.
Table 2.7 Magnitudes and their mean return time for Klerksdorp Gold Fields
Magnitude Mean return time
Above 5.0 22.5 years
Above 4.0 6 months
Above 3.0 10 days
Table 2.8 Klerksdorp Goldfields, seismic event statistics for 1989–1996
Magnitude 1989 1990 1991 1992 1993 1994 1995 1996
Above 4.0 2 2 3 0 5 1 2 1
3.0–4.0 57 87 121 118 102 84 70 69
2.0–3.0 351 432 814 793 625 641 554 443
Fatalities due to 6 28 11 12 18 10 5 16
seismic events34 2 Seismicity of the Klerksdorp Goldfields and the Resulting …
Table 2.9 Lost time injuries due to seismic events at Vaal Reefs
Year 1989 1990 1991 1992 1993 1994 1995 1996
Lost time injuries 66 61 121 41 60 106 32 85
Rands (milions)
50
45
40
35
30
25
20
15
10
5
0
1992 1993 1994
Fig. 2.3 Total cost of lost production for Vaal Reefs
It is easy to count the number of lost lives but a bit more difficult to establish the
lost time due to injuries. Table 2.9 shows the lost-time injuries for Vaal Reefs for
the time period 1989 to the end of 1996.
It is extremely difficult to establish the total cost of lost production due to seismic
events. Figure 2.3 gives a very rough estimate of such costs. This estimate takes
into account only the lost production costs including stoping and development costs
due to seismic related damage. It doesn’t take into account the costs of lost
equipment or the cost of reopening operations.
Figure 2.4 illustrates the yearly seismic energy release rates from 1972 up to
1990, based on data recorded by the KMMA Regional Seismic Network recorded
from 1972 through 1990. The average yearly seismic energy for this time period is
2.68E + 11 J. In comparison, the total seismic energy released at Palabora Mining
Company for the time period 2001–2013 was 3.38E + 08 J. The 13-year seismic
energy release at Palabora is nearly 800 times less from the annual seismic release
at Klerksdorp (Glazer 2016). In other words, one year of Klerksdorp seismic-energy
release is equal to an underground explosion of 500 kt of TNT, while the Palabora
13-year seismic-energy release is equal to an underground explosion of 20 kt of
TNT. The atom bomb that destroyed Hiroshima was equal to explosion of 20 kt of
TNT. In reality the amounts of the total energy released are much higher because
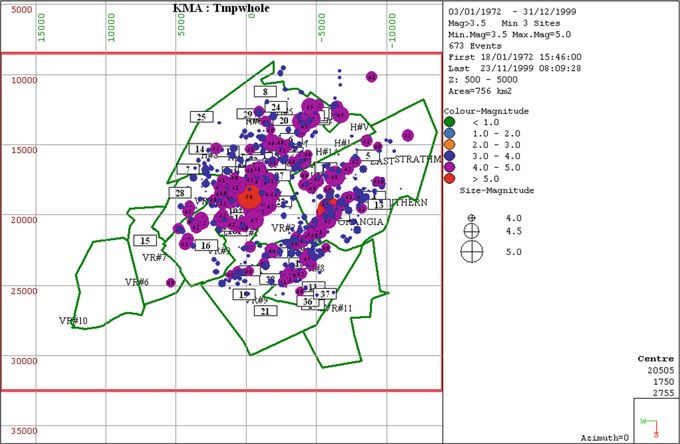
the seismic efficiency is only 0.5%. Figure 2.5 illustrates the locations of seismicity
magnitude 3.5 and above, from the beginning of 1971 until the end of 1999 in the
Klerksdorp area. During this time period, there were 673 such events, so there were
3 such events per month on average.2.4 Severity of the Klerksdorp Goldfields Seismic Hazard 35
Energy [J]
Yearly seismic energy release rates [J]
1.00E+12
9.00E+11
8.00E+11
7.00E+11
6.00E+11
5.00E+11
4.00E+11
3.00E+11
2.00E+11
1.00E+11
0.00E+00
1972 1974 1976 1978 1980 1982 1984 1986 1988 1990
Fig. 2.4 Yearly seismic energy release rates
Fig. 2.5 Seismicity of magnitude 3.5 and above
Figure 2.6 illustrates the locations of seismicity magnitude 4.0 and above from
the beginning of 1971 until end of 1999 in the Klerksdorp area. During this time
period, there were 144 such events, so there were 0.7 such events per month (or two
such events every quarter) on average. Total energy released by seismic event
magnitude 4.0 is close to 3.6E + 13 J which is an equivalent of an underground
explosion of 100 kt of TNT (five times the Hiroshima atom bomb).36 2 Seismicity of the Klerksdorp Goldfields and the Resulting …
Fig. 2.6 Seismicity of magnitude 3.5 and above
During 1992, I used the seismicity recorded between June 1991 and June 1992
to estimate the probability of an accident due to seismicity. For this estimate, I used
the 24-h number distribution of the underground working force. I was amazed to
find out that, during the day shift, there were more than 24,000 people working
underground. According to information from the internet, during 2011, the total
population of Phalaborwa was 13,108. Figure 2.7 illustrates the 24-h distribution of
people working underground at Vaal Reef during 1992. These numbers include
Number of people underground (per hour)
25000
20000
15000
10000
5000
0
1 2 3 4 5 6 7 8 9 10 11 12 13 14 15 16 17 18 19 20 21 22 23
Fig. 2.7 Number of underground workers per hour at Vaal Reefs2.4 Severity of the Klerksdorp Goldfields Seismic Hazard 37
Seismic events per hour
250
200
150
100
50
0
1 2 3 4 5 6 7 8 9 10 11 12 13 14 15 16 17 18 19 20 21 22 23 24
Fig. 2.8 24-h distribution of seismicity
data from No. 1 Shaft, No. 2 Shaft, No. 3 Shaft, No. 4 Shaft, No. 5 Shaft, No. 8
Shaft, and No. 9 Shaft. For the calculation, I used the 24-h distribution of seismicity
and the 24-h distribution of released seismic energy.
Figure 2.8 illustrates the distribution of seismicity per hour and is based on a
13-month period (from 1 June 1991 to 30 June 1992) in which 2237 events of
moment magnitude above 1.0 were recorded. The peak in the number of seismic
events starts at 14:00 and ends at about 18:00 and is directly correlated with the
blasting time. This is also the time when the minimum number of workers was
underground. Figure 2.9 illustrates the seismic energy releases per hour. For
comparison, the distribution of the number of events is also shown by this figure.
The most interesting and important conclusion gathered from Fig. 2.9 is that the
peak values for those two distributions do not coincide with each other. While the
peak number of events per hour is connected directly with the blasting time, the
peak amount of energy released per hour comes seven hours later (between 22:00
and 23:00). There are in fact three distinguishable peaks in the energy distribution.
The first one that coincides with the peak of the number of events per hour, between
15:00–16:00, the second one between 20:00 and 21:00, which is twice as big as the
first one; and the third main one between 22:00 and 23:00, which is 5.5 times as
large as the first one.
From Fig. 2.9, it is evident that blasting on its own triggers many events, but
most of them are relatively small ones; their number is high, but associated with
relatively low amounts of released energy. It seems that there is an “ageing” period
of about seven hours after which the high-energy release events do occur. This peak
in released energy occurs when about 4500 workers on the night shift were
underground.
Figure 2.10 illustrates how, during the day, the probability of a seismic-related
accident changes. This probability was calculated as a function of the number of38 2 Seismicity of the Klerksdorp Goldfields and the Resulting …
Energy J Energy released per hour [J] Seismic events per hour No of events
3.50E+11 250
3.00E+11
200
2.50E+11
150
2.00E+11
1.50E+11
100
1.00E+11
50
5.00E+10
0.00E+00 0
Fig. 2.9 24 h distribution of seismic energy and number of events
Probability of a seismic related accident per hour
0.35
Fatal accident during 1991
0.3
0.25
0.2
0.15
0.1
0.05
0
1 2 3 4 5 6 7 8 9 10 11 12 13 14 15 16 17 18 19 20 21 22 23 24
Fig. 2.10 Probabilities of seismic related accident
people per hour working underground, the number of seismic events, and the
amounts of released seismic energy per hour. There are five distinct peaks:
First one between 9:00 and 10:00
Second one between 12:00 and 13:00
Third one between 15:00 and 16:00
Fourth one between 20:00 and 21:00
Fifth one between 22:00 and 23:00
Of these five probability peaks, the lowest one is the one between 12:00 and 13:00.
The next one in size is the one between 09:00 and 10:00; then there is the one2.4 Severity of the Klerksdorp Goldfields Seismic Hazard 39
Table 2.10 Probability Peak Hour Probability value
peaks values
1 Between 9:00 and 10:00 0.09
2 Between 12:00 and 13:00 0.07
3 Between 15:00 and 16:00 0.10
4 Between 20:00 and 21:00 0.14
5 Between 22:00 and 23:00 0.32
between 15:00 and 16:00; then the one between 20:00 and 21:00. The biggest one is
between 22:00 and 23:00. Table 2.10 lists the probability values of these peaks.
The first peak is associated mainly with the high number of people working
underground. The second peak is connected with the increase in the degree of
seismicity, as well as with a high number of people still underground. The third
peak is related to the increase in the number of events due to blasting. The last two
peaks are related to the increase in the amounts of released seismic energy.
Figure 2.10 also indicate the hours of the seismic-related fatalities during the first
six months of 1991. These fatal accidents concentrate only in two short periods of
the day, i.e., between 09:00 and 12:00 and then between 21:00 and 23:00. It is clear
that the first concentration of fatalities is connected with the highest number of
people for the day working underground, while the second is directly connected to
the amount of released energy.
This analysis by its nature deals with a very delicate matter related to under-
ground safety, but the danger of a seismic-related accident is a reality. Due to the
nature of the input data based on facts, the results are more than just a pure
mathematical exercise. From the presented analysis, it appears that the most dan-
gerous hours are during the night shift between 20:00 and 23:00. In these three
hours, there are a relatively high number of people in the underground working
faces (4500), and, unfortunately, those are also the hours when the events associ-
ated with high-energy release take place. It must be clear that the probability of a
seismic-related accident never drops to zero during the 24-h time period; it only
varies from hour to hour. This means that an accident might happen at any one of
these hours and that there are some hours in which its probability is higher than at
others.
2.5 Upgrade of the Klerksdorp Regional Seismic Network
The network in the Klerksdorp area that was started in 1971 was established in
order to understand hazards associated with seismicity in order to introduce some
preventive measures. By early 1980, it was known that all large-magnitude events
in this area were related to geological features. Several hazardous faults and dykes
were identified that were associated with large seismic events. This resulted in the
application of several support patterns and changes in mining sequences around
those faults. Additionally, some protective actions for service excavations passing40 2 Seismicity of the Klerksdorp Goldfields and the Resulting … through those features were taken. A comprehensive summary of the strategies for combating rock-burst hazard based on seismic information gathered in the Klerksdorp area is given, e.g., by Gay et al. (1984) and O’Ferrall (1986). Seismic information was also used for planning and mining-shaft pillars, e.g., Emmenis and O’Ferrall (1971) or van der Heever and O’Connor (1994). The system was capable of informing management where the event had taken place within a matter of minutes. This information was vital in the case of a large event and was used to start the rescue action, almost immediately in the area of concern. The number of recorded events increased in years due to the increase of the number of stations and varied from forty to over a hundred per month. By 1989, it was accepted that the Klerksdorp Regional Seismic Network suffered the basic limitations of analogue transmission. All attempts to calibrate the system had been unsuccessful. However, studies of first motions recorded after big events resulted in reliable fault-plane solutions. This gave information about the focal mechanisms of those events as documented by van der Heever (1982) and Rorke and Roering (1984). By the beginning of 1990, significant progress had been made, not only in the development of hardware for seismic networks but also in extracting source parameters from recorded seismograms. But the most important progress was made in the use of seismic-source parameters for the evaluation of underground hazard. The accumulated experience from several mine networks (Lawrence 1984; Brink and Mountford 1984; Waldeck 1990; Mendecki et al.’s 1990; Flannigan and Hewlett 1988; van der Heever 1989; Patric and Kelly 1989; COMRO 1988a; Hewlett and Flannigan 1989; Brink 1990) made it clear that the time of analogue technology in this application was over. Mine requirements from a seismic network have also progressed from passive to more active methods of assessing the underground hazard associated with seis- micity. Mine management needs included: 1. Identification of seismically hazardous structures for strategic planning, sequencing, and adequate support implementation 2. Recognition of seismically hazardous areas for implementation of adequate strategies to combat risk 3. Assessment of seismic source parameters for planning guidelines, e.g., for sit- uating pillars along an active fault or for support design 4. 24-h management information service, for rescue and opening-up operations 5. Database that can be used for planning purposes. For such a data base to be of use for rock engineering purposes, it must contain not only accurate information in regard to locations of big events, but also to all small events (down to magnitude 0.5) that was the requirement at the time, as far as sensitivity of a regional network is concerned. It must also contain as accurate as possible source parameters of those events, calculated from good quality seismograms. The above requirements could not be fulfilled any more by an analogue seismic system. The Klerksdorp Regional Seismic network had to be upgraded to a digital system. In April 1989, the Klerksdorp Mine Managers Association (KMMA) gave
2.5 Upgrade of the Klerksdorp Regional Seismic Network 41
its approval to implement the necessary upgrading. At that time, it was also agreed
to reallocate the network itself, from its present remote location at Stilfontein GM to
a more central site at Vaal Reefs. The new location of the Klerksdorp Regional
Seismic Network was chosen for two reasons. First for technical reasons, if the
network was to expand, its number of stations had to increase. A centrally located
site is best suited for radio communication purposes. The second reason, which
from today’s perspective is much more important, because recent advances in
communication systems have made the first reason redundant, was to situate the
network’s central site as close as possible to the Rock Mechanics Department. The
new site was located close to No. 1 Shaft, Vaal Reefs, in the same building as the
main office of the Vaal Reefs Rock Engineering. By end of 1988 and the beginning
of 1989, there were three regional mine seismic systems in operation; the DIGINET
(later known as the Integrated Seismic System—ISS) in the Free State Goldfield,
the “GENTEL” (Genmin Triaxial Event Locator) developed for Genmin Gold
Mines; and the PSS (Portable Seismic System) developed by Chamber of Mines
Research Organisation (COMRO). One of the three systems had to be chosen for
the upgrade of the Klerksdorp Regional Seismic Network. The “GENTEL” system
was eliminated because at that time it worked only as a single, stand-alone system,
and it would be quite complicated from a technical point of view to network such
single units into a regional system. It would require a significant amount of
development and testing, and it would take at least two years to achieve some
results. This left the remaining two systems, the PSS and ISS. The PSS system had
all the basic limitations of analogue transmission, while the ISS system offered
digital transmission and distributed intelligence. Digitization of the seismic data at
the site of the transducer, plus the ability to accommodate the wide dynamic range
(above 120 dB), could not be accomplished with high precision by any analogue
transmission system. At that time, the ISS system also had another advantage over
the PSS system, that is, its very advanced software and the hardware components
were of an “off- the-shelf” type. The significance of PC architecture as the basis for
seismic systems was postulated by Green (1990). There were two more important
factors that helped to turn the decision in favour of the ISS system. The first one
was that it was already in operation at Anglo American Corporation mines in the
Orange Free State and secondly that Vaal Reefs had available a mainframe com-
puter that could be used to run the network. In this way, the Anglo American
Corporation (AAC) started a process of standardization of their seismic networks,
in regards to hardware and software.
In April 1989, the Klerksdorp Mine Managers Association gave its approval to
go ahead with upgrading the Klerksdorp Regional Seismic Network with the ISS
system. This approval was connected with making the capital available, which was
to be divided between all mines. The management of this project is described by
van Wyk and Coggan (1990).
As the existing network configuration was good, the existing sites were used in
the upgrade in order to minimize the costs. The newly upgraded system first started
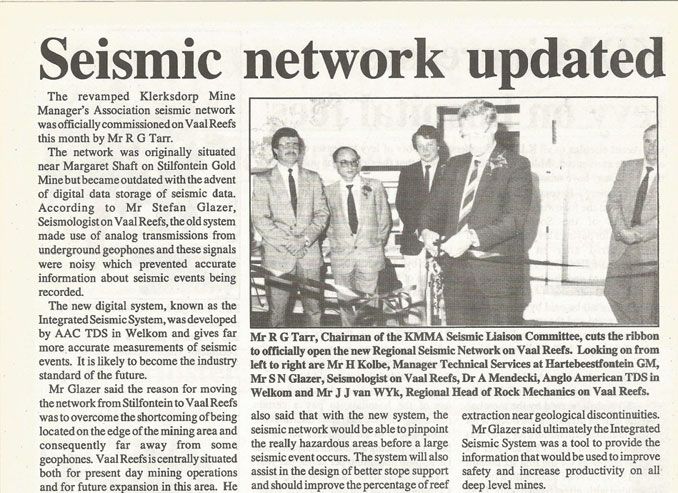
to collect seismograms in May 1990, and the official opening took place on 3
September 1990. Figure 2.11 presents an article from the Vaal Reefs DivisionalYou can also read