JBC Papers in Press. Published on April 1, 2019 as Manuscript RA119.007885 The latest version is at ...
←
→
Page content transcription
If your browser does not render page correctly, please read the page content below
JBC Papers in Press. Published on April 1, 2019 as Manuscript RA119.007885
          The latest version is at http://www.jbc.org/cgi/doi/10.1074/jbc.RA119.007885

   Multi-omics analysis unravels a segregated metabolic flux network that tunes co-
          utilization of sugar and aromatic carbons in Pseudomonas putida
  Matthew A. Kukurugya‡,1, Caroll M. Mendonca ‡,1, Mina Solhtalab‡, Rebecca A. Wilkes‡, Theodore W.
                                 Thannhauser§, and Ludmilla Aristilde‡,2
  From the ‡Department of Biological and Environmental Engineering, College of Agriculture and Life
   Sciences, Cornell University, Ithaca, NY 14853, USA. §United States Department of Agriculture—
                        Agricultural Research Service, Ithaca, NY 14853, USA.
                                              1
                                               Co-first authors
   2
   To whom correspondence should be addressed: 214 Riley-Robb Hall, Cornell University, Ithaca, NY
              14850; Tel. (607) 255-6845; Fax. (607) 255-4449; ludmilla@cornell.edu

               Running title: Segregated metabolism for mixed-substrate usage in P. putida

       Keywords: Pseudomonas, bacterial metabolism, metabolomics, proteomics, glucose, benzoate,
                mixed-carbon metabolism, metabolic flux, metabolic regulation, fluxomics

_____________________________________________________________________________________
Abstract                                                parameters for quantitative flux analysis,
Pseudomonas species thrive in different nutritional     demonstrating that the metabolic segregation of
environments and can catabolize divergent carbon        the substrate carbons optimally sustained
substrates. These capabilities have important           biosynthetic flux demands and redox balance.
implications for the role of these species in natural   Changes in protein abundance partially predicted
and engineered carbon processing. However, the          the metabolic flux changes in cells grown on the
metabolic phenotypes enabling Pseudomonas to            glucose:benzoate mixture versus on glucose alone.
utilize mixed substrates remain poorly                  Notably, flux magnitude and directionality were
understood. Here, we employed a multi-omics             also maintained by metabolite levels and
approach involving stable isotope tracers,              regulation of phosphorylation of key metabolic
metabolomics, fluxomics, and proteomics in              enzymes. These findings provide new insights into
Pseudomonas putida KT2440 to investigate the            the metabolic architecture that affords
constitutive metabolic network that achieves co-        adaptability of P. putida to divergent carbon
utilization of glucose and benzoate, respectively a     substrates and highlight regulatory points at
monomer of carbohydrate polymers and a                  different metabolic nodes that may underlie the
derivative of lignin monomers. Despite near-equal       high nutritional flexibility of Pseudomonas species.
consumption of both substrates, metabolite              _________________________________________
isotopologues revealed non-uniform assimilation
throughout the metabolic network. Gluconeogenic         A network of metabolic pathways is involved in
                                                        processing carbon substrates to obtain cellular
flux of benzoate-derived carbons from the
                                                        energy and carbon skeletons towards biomass
tricarboxylic acid cycle did not reach the upper
                                                        biosynthesis       and      product     generation.
Embden–Meyerhof–Parnas pathway nor the                  Understanding this cellular physiology for mixed-
pentose-phosphate pathway. These latter two             substrate utilization in Pseudomonas species,
pathways were populated exclusively by glucose-         including Pseudomonas Putida, is of particular
derived carbons through a cyclic connection with        interest (1–6). Strains of P. putida are able to
the Entner–Doudoroff pathway. We integrated the         catabolize breakdown products of lignocellulose
13                                                      (1, 6, 7), which serves as carbon sources in the soil
  C-metabolomics data with physiological

                                                                                                           1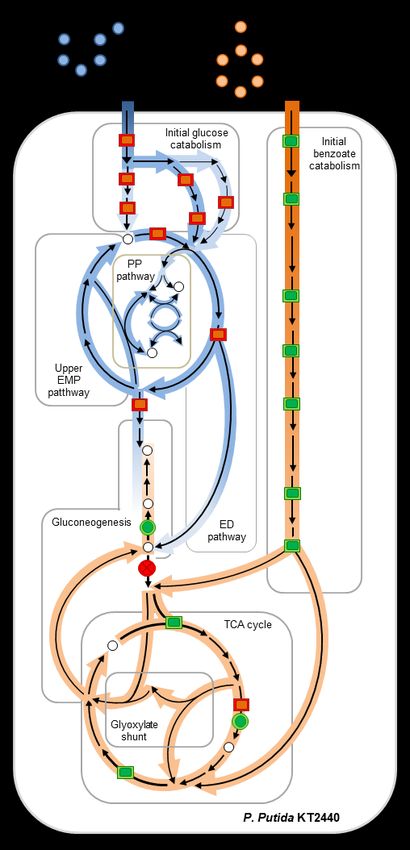
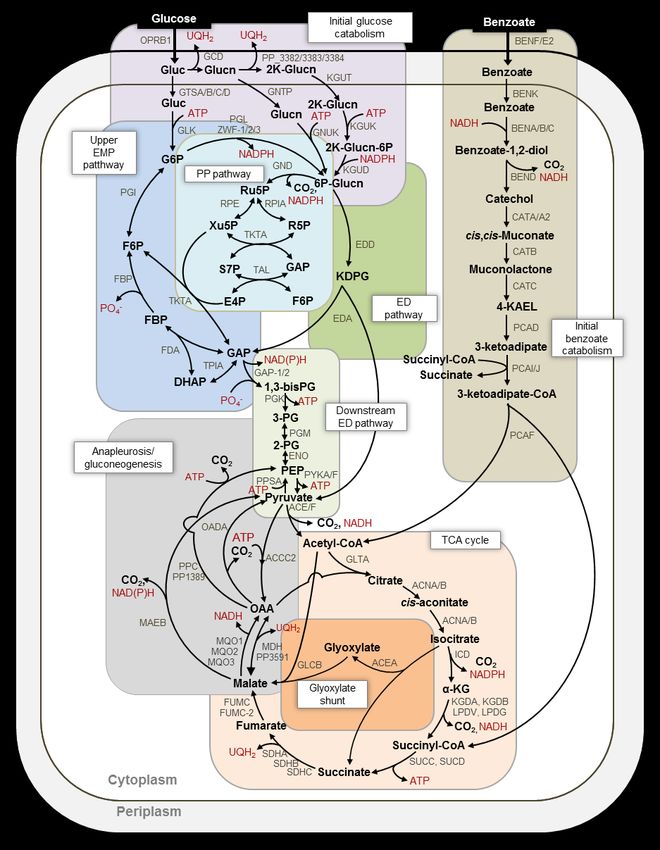
matrix and represents an important feedstock in          tricarboxylic acid (TCA) cycle (Fig. 1). To route
engineered bioconversion to valuable products.           glucose-derived carbons towards the ED and PP
Furthermore, P. putida strains can catabolize oil        pathways, glucose catabolism is initiated either by
contaminants such as benzene and toluene (2, 8–          direct glucose phosphorylation to glucose-6-
10), and other industrial aromatic contaminants          phosphate (G6P) or by glucose oxidation to
(11, 12). Thus, the cellular network of P. putida can    gluconate (Glucn) and 2-keto-gluconate (2K-Glucn)
accommodate the metabolism of different                  in     the      periplasm     before     subsequent
substrate types. The metabolic pathways in P.            phosphorylation to 6-phosphogluconate (6P-
putida have been extensively studied for growth          Glucn)      (13–17)     (Fig.    1).    Comparative
on single organic substrates (7, 13–17) including        transcriptional analysis of P. putida KT2440 grown
two highly relevant substrates, glucose and              on benzoate alone versus glucose alone showed no
benzoate. Glucose is a monomer of various                change in the transcript levels of all the proteins
carbohydrate polymers; benzoate is an aromatic           involved in initial glucose catabolism (13).
derivative of lignin, plant secretions, and              However, compared to growth of P. putida
petroleum and agricultural contaminants.                 KT2440(pWW0) on glucose alone, toluene addition
Concurrent usage of these two divergent                  led to downregulation of genes encoding glucose
substrates has been reported in several P. putida        transporters (18). Moreover, the activity of G6P
strains [mt-2 (13), KT2440 (7, 18), and P8 (19)]         dehydrogenase (G6PDH) was reported to be
based on extracellular substrate depletion. Little is    decreased during consumption of an aromatic
known, however, about the underlying                     substrate (naphthalene or benzyl alcohol), relative
intracellular metabolism and flux regulation for the     to glucose alone (7, 21, 22). The consequence of
co-processing of these substrates.                       this decrease in either protein activity or
     Non-diauxic biomass growth was observed             associated genes in initial glucose catabolism on
for putida strains grown on different mixtures of        the simultaneous catabolism of glucose and an
glucose      with      an     aromatic      substrate:   aromatic substrate has not been investigated.
glucose:toluene         mixture      with       strain         In P. putida, benzoate is catabolized through
KT2440(pWW0) (18); glucose:benzoate mixture              the β-ketoadipate or ortho-cleavage (ortho)
with strain KT2440-JD1 (20) and strain KT2440 (13).      pathway to yield acetyl coenzyme A (acetyl-CoA)
In accordance with this lack of diauxie,                 and succinate or through the meta-cleavage
simultaneous consumption of glucose and an               pathway to yield acetyl-CoA and pyruvate (7, 21,
aromatic substrate was reported in P. putida P8          22)—the plasmidless strain KT2440 investigated
(19), P. putida KT2440-JD1 (20), P. putida KT2440        here only possesses the ortho pathway (Fig. 1). The
(13), and P. putida mt-2 (17). Furthermore, similar      metabolite products from initial benzoate
biomass growth rates were determined for P.              catabolism are subjected to further metabolism in
putida KT2440 (pWW0) fed on glucose alone,               the TCA cycle, including the glyoxylate shunt (Fig.
toluene alone, or a mixture of glucose and toluene       1). The glyoxylate shunt bypasses the two
(2.3 to 1 ratio) (18). These previous findings are in    decarboxylation reactions, downstream of
line with the proposal that P. putida cells assimilate   isocitrate     dehydrogenase (ICD) and α-
carbons from both carbohydrate and aromatic              ketoglutarate dehydrogenase (KGD), in the
substrates in a manner that optimizes biomass            canonical TCA cycle (Fig. 1). Prior investigations of
growth (18). The cellular physiology, however, that      the metabolism of benzoate alone (13, 16) or the
channels these carbons through the different             co-metabolism of glucose and succinate (a
metabolic pathways remains to be fully elucidated.       downstream catabolite of benzoate catabolism)
     The four principal pathways that channel            (23) in P. putida KT2440 have provided clues on the
carbons towards biosynthetic building blocks in P.       consequence of benzoate or succinate on flux
putida are the Entner-Doudoroff (ED) pathway, the        through the TCA cycle.
pentose-phosphate (PP) pathway, the upper                      The glyoxylate shunt, which was found to be
Embden-Meyerof-Parnas (EMP) pathway, and the             inactive in P. putida KT2440 grown on glucose

                                                                                                            2
alone (1, 9, 17), was active during growth on rate by cells growing on glucose alone was 48.5 ±
benzoate alone (9, 14). The activation of the 13.8 mmol C gCDW-1 h-1 (or 8.09 ± 2.3 mmol
glyoxylate shunt in P. putida (13, 16, 24) was glucose gCDW-1 h-1); a similar value was reported
shown to be inversely correlated with the activity in a previous study on glucose-grown P. putida (14)
of or flux through ICD, which catalyzes the (Fig. 2a; Supplementary Appendix A). During
decarboxylation of isocitrate to α-KG in the TCA growth on the glucose:benzoate mixture, we
cycle (Fig. 1). Quantitative flux analysis further obtained carbon-equivalent consumption rates of
determined a minimal flux from α-KG to succinate 19.8 ± 4.4 mmol C gCDW-1 h-1 for glucose and 27.2
in P. putida grown on benzoate alone (16) or on a ± 8.1 mmol C gCDW-1 h-1 for benzoate (or 3.3 ± 0.2
glucose:succinate mixture (23), implying a mmol glucose gCDW-1 h-1 and 4.5 ± 1.4 mmol
decrease in the activity of both KGD and succinyl benzoate gCDW-1 h-1) (Fig. 2a; Supplementary
Co-A synthase (SUC). Feedback inhibition of ICD by Appendix A). Thus, the total carbon consumption
succinyl-CoA, glyoxylate, and oxaloacetate (OAA) rate from the glucose:benzoate mixture, 47.0 ±
was also reported in P. putida (24). How these 11.2 mmol C gCDW-1 h-1, was similar to the carbon-
reprogrammed metabolic nodes in the TCA cycle equivalent consumption rate of glucose alone
influence the co-utilization of glucose and (48.5 ± 13.8 mmol C gCDW-1 h-1) (Fig. 2a). Previous
benzoate remains to be investigated. studies (13, 22) have reported a preference for
Here we employ a multi-omics approach benzoate over glucose in P. putida but, at the same
involving metabolomics, fluxomics, and carbon concentration in the glucose:benzoate
proteomics to address the aforementioned mixture, we found no difference between the
knowledge gaps regarding the operation of the consumption rates of the two substrates (unpaired
metabolic network for the co-processing of t-test, p=0.23). Interestingly, we obtained a 37%
glucose and benzoate in P. putida KT2440. Using increase in the growth rate of cells fed on the
high-resolution liquid chromatography-mass mixture (0.93 ± 0.10 h-1) versus on glucose alone
spectrometry (LC-MS), we performed stable (0.68 ± 0.09 h-1) (unpaired t-test, p=0.03) (Fig. 2b;
isotope-assisted metabolomics experiments to Supplementary Appendix A). These data
track the assimilation of the substrate carbons collectively implied that the intracellular
within the cellular metabolome. The processing of both substrate carbons in the P.
metabolomics data were integrated with genome- putida KT2440 cells achieved optimal biomass
scale stoichiometry to quantitate fluxes growth.
throughout the metabolic network. Quantitative The carbon supply required from the different
MS-based proteomics analyses were conducted to relevant metabolic pathways to support biomass
profile both protein abundances and protein growth would depend on the biomass component
phosphorylation. We interpret our data to (Fig. 2c). Based the genome-scale stoichiometric
determine relationships between enzyme-level composition of the P. putida cell (25) and our
metabolic controls and metabolic flux predictions measured growth phenotype, we estimated the
in the metabolic network. following carbon effluxes to support biosynthetic
demands in cells grown, respectively, on glucose
Results alone versus on the glucose:benzoate mixture:
2.77±0.19 mmol C gCDW-1 h-1 and 3.76±0.21 mmol
Growth phenotypes and biosynthetic
C gCDW-1 h-1 for cell membrane biosynthesis; 5.50
requirements imply optimal mixed-carbon usage
±0.46 mmol C gCDW-1 h-1 and 7.51 ±0.51 mmol C
Growth experiments were conducted with the P. gCDW-1 h-1 for nucleic acid biosynthesis; and 16.59
putida KT2440 cells grown on a 1:1 ±1.45 mmol C gCDW-1 h-1 and 22.68 ±1.61 mmol C
glucose:benzoate mixture at a total of 100 mM gCDW-1 h-1 for protein biosynthesis (Fig. 2c). For
carbon; glucose-only growth was also performed cell membrane, the majority of carbon efflux was
at the same total carbon-equivalent concentration derived from the PP pathway (about 35%) and the
for comparative analysis. Glucose consumption remaining came from the TCA cycle (28%), upper
3EMP (20%), and downstream of the ED pathway dissolved bicarbonate species (Fig. 2d). Both IMP
(18%) (Fig. 2c) For nucleic acids, the majority of and UMP were predominately partially labeled in
carbon efflux was also derived from the PP the glucose:benzoate growth condition, thus
pathway (about 48%) and the remaining came indicating incorporation of carbons from both
from the TCA cycle (38%) and downstream of the glucose and benzoate in their biosynthesis (Fig.
ED pathway (14%) (Fig. 2c) For proteins, the 2d).
majority of carbon efflux was derived primarily Biosynthesis of the cell membrane precursors
from downstream of the ED pathway (54%) and UDP-glucose and glycerol-3P also makes use of
the remaining came from the TCA cycle (36%) and metabolites from three different pathways: UDP-
the PP pathway (about 10%) (Fig. 2c) Therefore, glucose is synthesized by combining the pyrimidine
the highest biosynthetic carbon demand was from UMP with G6P (an upper-EMP pathway
downstream of the ED pathway and TCA cycle to metabolite); glycerol-3P is synthesized by reducing
make proteins followed by the carbon demand dihydroxy-acetone-phosphate (DHAP) (a
from the PP pathway to make nucleic acids (Fig 2c). metabolite downstream of ED pathway) (Fig. 2d).
In sum, to support biosynthetic requirements for During growth on the mixture, glycerol-3P was
the observed biomass growth, the equimolar made exclusively either from the labeled glucose
carbon-equivalent supply of glucose and benzoate (about 25%) or from the non-labeled benzoate
had to be channeled effectively to different (about 75%) whereas the carbon skeleton of UDP-
metabolic pathways. glucose contained carbons derived from both
substrates (Fig. 2d).
Biosynthetic demands are met by non-uniform
The amino acid labeling patterns in cells
metabolic investment of the substrate carbons
grown on the glucose:benzoate mixture depended
We monitored the incorporation of [U-13C6]- on the source of the metabolite precursors (Fig.
glucose alone or with unlabeled benzoate into 2d). For serine (derived from 3-PG downstream of
representative metabolite precursors to the the ED pathway), a large portion (69%) was made
different biomass components: inosine exclusively from glucose-derived 13C-labeled
monophosphate (IMP) and uridine carbons and the remainder from nonlabeled
monophosphate (UMP) for nucleic acid benzoate carbons (Fig 2d). A previous study (18) of
precursors; uridine diphosphate glucose (UDP- P. putida KT2440 (pWW0) fed on nonlabeled
glucose) and glycerol-3-phosphate (glycerol-3P) toluene and 13C-labeled glucose also reported
for cell membrane precursors, and a series of toluene-derived nonlabeled carbons in serine.
amino acids for protein precursors (Fig. 2d). We Derived from two moles of pyruvate further
confirmed that isotopic enrichment had reached downstream of the ED pathway, valine was about
pseudo steady-state by examining intracellular 30% 13C-labeled and about 60% partially labeled,
metabolite labeling at two different times during indicating the incorporation of both substrates
the exponential growth phase (Supplementary into the majority of the valine pool (Fig. 2d). For
Appendix B). the aromatic amino acids tryptophan and
Ribonucleotide precursors combine phenylalanine, which are derived from
metabolite intermediates from three metabolic metabolites of the PP and downstream ED
pathways. The purine IMP is synthesized from the pathways, a high fraction (80 to 90%) of partial 13C
combination of ribose-5-phosphate (R5P) (a PP labeling indicated that the contribution of both
pathway metabolite) with glycine [an amino acid substrates (Fig. 2d). However, the two amino acids
derived from the 3-phospho-glycerate (3-PG) derived from the TCA cycle (aspartate and
downstream of the ED pathway], tetrahydrofolate- glutamate) were 50-75% nonlabeled, reflecting
linked one-carbon units and dissolved bicarbonate that the TCA cycle was primarily populated by
species. The biosynthesis of the pyrimidine UMP benzoate-derived carbons (Fig. 2d). Taken
combines R5P with aspartate (an amino acid collectively, the 13C-labeling patterns of the
derived from the TCA cycle metabolite OAA) and biosynthetic precursors revealed that the
4substrate carbons from the mixture were not grown P. putida KT2440 (14, 15, 27), P. protegens
distributed uniformly towards the biosynthetic Pf-5 (28), and P. aeruginosa PAO1 (27) (Fig. 3a, 3b).
pathways. Through the non-oxidative PP pathway, F6P
and GAP combined through a series of ketolase
Quantitative tracing of the metabolic network
and aldolase reactions to generate up to 60%
reveals segregated routing of the substrate 13
quadruply C-labeled xylulose-5-phosphate
carbons through central carbon metabolism
(Xu5P) and R5P; the oxidative PP pathway
To elucidate the specific metabolic routing of the generated up to 33% doubly 13C-labeled PP
substrate carbons, we performed additional long- metabolites (Fig. 3d). Thus, there was
term isotopic enrichment with [1,5,6-13C3]-glucose approximately a two-to-one involvement of the
alone or with unlabeled benzoate (Fig. 3). For both non-oxidative route relative to the oxidative route
growth conditions, we obtained similar labeling of the PP pathway (Fig. 3d). A similar finding was
patterns for the metabolites in initial glucose reported by a previous analysis (15) of glucose-
catabolism, the upper EMP pathway, and the PP grown P. putida. The labeling of sedoheptulose-7-
pathway (Fig. 3). In accordance with the phosphate (S7P), primarily quadruply 13C-labeled
periplasmic oxidation of [1,5,6-13C3]-glucose, Glucn (about 50%) and sextuply 13C-labeled S7P (about
was nearly completely triply 13C-labeled (Fig. 3a, 25%), corroborated carbon flux primarily through
Fig. 3b). The phosphorylated metabolites in initial the non-oxidative PP pathway for both growth
glucose catabolism, G6P and 6P-Glucn, were also conditions.
primarily triply 13C-labeled, respectively 53-71% For the downstream metabolic pathways (i.e.
and 84-88% (Fig. 3a, Fig. 3b). downstream ED pathway and the TCA cycle), there
Quadruply 13C-labeled fractions (12-36%) of were different labeling patterns in the absence
G6P and 6P-Glucn were due to carbon cycling from versus the presence of benzoate (Fig. 3a, Fig. 3b,
the ED pathway to the upper EMP pathway (Fig. Fig. 3c). In addition to singly 13C-labeled pyruvate
3b). Through the ED pathway, triply 13C-labeled 6P- from the ED pathway, doubly 13C-labeled pyruvate
Glucn generated singly 13C-labeled pyruvate (up to (up to 33%) was due to carbon flux through
13
50%) and doubly C-labeled (>90%) metabolites (3-PG and PEP) downstream of doubly
glyceraldehyde-3-phosphate (GAP) and DHAP (an 13
C-labeled GAP, and nonlabeled pyruvate (about
isomer of GAP) (Fig. 3a, Fig. 3b). Through backward 50%) indicated the incorporation of benzoate-
flux, doubly 13C-labeled GAP and DHAP combined derived carbons (Fig. 3a, Fig. 3b). During growth on
to produce over 85% quadruply 13C-labeled the glucose:benzoate mixture, gluconeogenic flux
fructose-1,6-bisphosphate (FBP) (Fig. 3a, Fig. 3b). of benzoate-derived carbons led to an appearance
The dephosphorylation of FBP led to up to 65% of nonlabeled fraction in 3-PG and PEP (38-56%),
quadruply 13C-labeled fructose-6-phosate (F6P) from (Fig. 3c). In agreement with the canonical
and the isomerization of G6P to F6P generated routing of carbons towards and through the TCA
triply 13C-labeled F6P (up to 25%) (Fig. 3a, Fig. 3b). cycle in the glucose-grown cells, the metabolites in
Due to the lack of 6-phosphofructokinase in P. the TCA cycle were primarily singly, doubly, and
putida to convert F6P to FBP (26), there was no triply 13C-labeled (Fig. 3a, Fig. 3c). However, in cells
triply 13C-labeled FBP as would be expected from grown on the glucose:benzoate mixture, the influx
the phosphorylation of triply 13C-labeled F6P to of nonlabeled benzoate-derived carbons via the
FBP (Fig. 3a, Fig. 3b). Thus, for both growth ortho pathway led to enrichment in nonlabeled
conditions, the 13C mapping thus showed that fractions (71-93%) in the TCA-cycle metabolites
glucose-derived carbons were catabolized through (Fig.1, Fig 3a, Fig. 3c). The similarity between the
a cyclic flux connection from the ED pathway labeling pattern of citrate and the labeling pattern
towards the upper EMP pathway and the non- of OAA (deduced from aspartate labeling) further
oxidative PP pathway (Fig. 3a, 3b). This cyclic indicated that the acetyl moiety in acetyl-CoA was
connection was also shown previously for glucose- primarily nonlabeled from benzoate catabolism
(Fig. 1, Fig. 3b).
5In sum, the carbon mapping demonstrated 10 quantified proteins involved in initial glucose
that the metabolism of glucose and benzoate was catabolism were decreased (-20% to -60%) and the
segregated into different pathways in the 2K-GLucn level was depleted (by 300-fold) during
metabolic network. Notably, the upper EMP growth on the glucose:benzoate mixture (Fig. 5b,
pathway, the ED pathway, and the PP pathway Fig. 5c). Relative to glucose-grown cells, significant
were populated exclusively by glucose-derived increase both in the backward fluxes through the
carbons (Fig. 3a, Fig. 3b). Benzoate-derived upper EMP pathway (up to 80%) and the fluxes in
carbons primarily populated the TCA cycle and the PP pathway (nearly up to 3-fold) did not match
directly upstream of the TCA cycle (Fig. 3a, Fig. 3c). the relatively minor changes (within ±16%) in the
associated protein levels in the cells grown on the
Multi-omics analysis highlights regulation of
mixture (Fig. 4a, Fig. 4b, Fig. 5b). In addition to the
metabolic fluxes by metabolite levels and post-
aforementioned cyclic connection between the ED
translational modifications
pathway and upper EMP pathway, decreased
We profiled changes in metabolic fluxes in abundance (by over 30%) of GAP dehydrogenase
conjunction with changes in both protein levels may have contributed to the retention of glucose-
and metabolite pools in cells grown on the derived carbons in these pathways to feed carbon
glucose:benzoate mixture versus those grown on fluxes therein during growth on the
glucose alone. Where appropriate, we also glucose:benzoate mixture (Fig. 4a, Fig. 4b, Fig. 5b).
examined relative extent of protein ED pathway and gluconeogenic flux. In the
phosphorylation, which serves as a switch on-off glucose-grown cells, 89% of the glucose uptake
mechanism to control protein activity (Fig. 4 and was channeled through the ED pathway to sustain
Fig. 5; Supplementary Appendices D and E). In the biosynthetic fluxes in downstream pathways (Fig.
presence of benzoate, we obtained only a 4% 4a). However, despite a near 2-fold decrease in the
increase in the global regulator CRC (18, 29), which ED pathway flux and a 10- to 20-fold decrease in
is known to repress carbohydrate uptake and the flux from 3-PG to pyruvate in cells grown on
catabolism (Supplementary Appendix F). However, the glucose:benzoate mixture, the biosynthetic
out of the total 83 profiled proteins in the central flux demands (from 3-PG, PEP, and pyruvate) were
carbon metabolism, the abundances of 15 were still satisfied due to gluconeogenic flux of
increased (by up to 200%) and 25 were decreased benzoate-derived carbons upstream of the TCA
(by up to -60%) in the presence of benzoate; the cycle (Fig. 4a, 4b). This flux directionality in the
remaining protein levels were either unchanged or presence of benzoate could not be deduced from
not quantifiable (Fig. 5b). Correlation matrices of the protein abundances of the corresponding
flux changes versus protein abundance changes reactions, which remained unchanged or reduced
illustrated that changes in protein levels were not by up to 20% (Fig. 5a; Fig. 5b). However, the
always predictive of changes in metabolic fluxes observed decrease (by 36%) in a tyrosine
between the two growth conditions (Fig. 5a, phosphorylation of PEP synthase (PPSA), which
Appendix E). would turn on the activation of PPSA, would thus
Initial glucose catabolism, upper EMP facilitate backward flux from pyruvate to PEP (Fig.
pathway, and pentose-phosphate pathway. In 5b). Moreover, the measured increase (by 25%) in
both growth conditions, periplasmic oxidation of a serine phosphorylation of acetyl-CoA
glucose to Glucn represented over 80% of the carboxylase (ACEF), which would repress the
glucose uptake flux; the direct uptake of glucose to activation of ACEF, would impair flux from
G6P represented a small flux (less than 15%) (Fig. pyruvate to acetyl-CoA (Fig. 5b). We obtained a 10-
4a, Fig. 4b). A 13-fold increase in the S7P pool was fold accumulation in pyruvate pool whereas there
consistent with a 2-fold increase in the flux from were up to 63% reduction in the PEP pool and a 3-
PP metabolites to produce S7P during growth on fold decrease in the 3-PG pool (Fig. 5c), illustrating
the glucose:benzoate mixture (Fig. 5c). Compared both the decrease in ACEF activity and that flux
to growth on glucose alone, the levels of 9 of the directionality was in the direction that favored
6metabolic flow from high concentration to low and the co-regulation of glyoxylate shunt and ICD
concentration of metabolites. activity (19, 24, 33), we obtained both decreased
TCA cycle. Growth on the glucose:benzoate flux from isocitrate to α-KG (-54%) and decreased
mixture resulted in a near 3-fold increase in the abundance in one of the ICD-associated proteins
protein levels in the benzoate catabolic ortho (PP_4011, -33.1%) (Fig 4a, Fig. 4b, Fig. 5b).
pathway to generate acetyl-CoA and succinate Interestingly, we also obtained a decrease (by over
(Fig. 5b). In accordance with this benzoate-derived 50%) in the serine phosphorylation of PP_4011,
carbon influx towards the TCA cycle, we obtained which would promote ICD activity, and thus would
a 14-fold increase in the acetyl-CoA pool, a 2-fold counteract to some extent the decreased flux due
increase in the succinate pool, and a 2- to 5-fold to decreased protein abundance in the presence of
accumulation in the pools of the other TCA cycle benzoate (Fig. 5b).
metabolites (citrate, α-KG, fumarate, malate, In sum, metabolic flux changes in cells grown
aspartate) (Fig. 5c). The 2-fold increase in the flux on the glucose:benzoate mixture versus those
from succinate to OAA in the presence of benzoate grown on only glucose were partially in agreement
was accompanied by an increase (albeit to a lesser with the corresponding changes in protein
extent) in the abundance of most of the associated abundances (Fig. 5a). However, changes in
proteins: subunits of succinate dehydrogenase metabolite levels and protein phosphorylation
(SDH) (SDHA, +50%; SDHB, +73%; SDHC, +158%), could explain flux magnitude and directionality,
one subunit of malate:quinone oxidoreductase which were not predictable from the changes in
(MQO) (MQO1, +55%), and fumarate hydratase protein levels (Fig. 4, Fig. 5).
(FUMC,+1.8%) (Fig. 4a, Fig. 4b, Fig. 5b); the levels
The segregated metabolic network maintains
of the other subunits of MQO were decreased
redox balance
(MQO2,-11.9%; MQO3, -13%) (Fig. 5b). Along with
the high accumulation of acetyl-CoA in cells grown Relative to the metabolic fluxes for the
on the glucose:benzoate mixture, there was an glucose:benzoate mixture, the flux analysis
increased abundance (by nearly 15%) of citrate determined that the metabolism of glucose alone
synthase (GLTA2), which combines acetyl-CoA with led to an 11% increase in the yield of UQH2 and a
OAA to form citrate (Fig. 5b, Fig. 5c). Due to the 37% increase in the yield of NAD(P)H (Fig. 4c). For
activation of the glyoxylate shunt, which has been UQH2, the higher contribution (by 61%) from the
known to be induced by an elevated acetyl-CoA periplasmic oxidation reactions in the glucose-
(30), the flux from citrate to α-KG in the TCA cycle grown cells was compensated by the higher
was decreased by up to 60% during growth on the contribution (by 63%) from the increased TCA cycle
glucose:benzoate mixture and the abundances of flux in the presence of benzoate (Fig. 4c). For
the corresponding proteins were also decreased NAD(P)H, there was a lower contribution from the
(by up to 36%) (Fig. 4a, Fig. 4b, Fig. 5b). malic enzyme (by 35%), the TCA cycle (by 18%),
Both the active glyoxylate shunt and higher and downstream of the ED pathway (by 71%)
fluxes from succinate to OAA during growth on the during growth on the mixture compared to growth
glucose:benzoate mixture observed here were on only glucose (Fig. 4c). In sum, the total yield of
reported by a previous flux analysis (13) of P. reducing equivalents was decreased by 12.0 ± 3.4
putida KT2440 grown on benzoate alone meq gCDW-1h-1 in the presence of benzoate (Fig. 4d).
compared to growth on fructose but no change Accounting for the carbon oxidation states (-2 per
was observed in the levels of both gene expression mole of benzoate versus 0 per mole of glucose)
and transcripts of the involved proteins in the and the measured carbon consumption rates, we
previous study. Here, we further observed that the calculated a theoretical surplus of 9.2 ± 0.2 meq
active glyoxylate shunt was not consistent with gCDW-1h-1 from the influx of electrons from
decreased abundances of isocitrate lyase (ACEA, - benzoate (Fig. 4d). This theoretical difference was
44% %) (Fig.4b, Fig. 5b). However, consistent with remarkably consistent with the flux-determined
reported feedback inhibition of ICD (24, 31, 32) surplus of reducing equivalents by glucose
7metabolism (Fig. 4d). Therefore, the segregated obtained a decrease in both protein abundances
metabolic flux network in P. putida KT2440 cells and metabolic fluxes in initial glucose catabolism in
grown on the glucose:benzoate mixture cells grown on the glucose:benzoate mixture
maintained approximately the same redox balance compared to those grown on only glucose (Fig. 4a,
as the cells grown on only glucose. Fig. 4b, Fig. 5a, Fig. 5b). However, biosynthetic flux
demands in the upper EMP and PP pathways were
Discussion
still satisfied, which we attributed to the exclusive
Here, using P. putida as a prototypical species of retention of glucose-derived carbons in these
the Pseudomonas genus, we analyzed the pathways (Fig. 4b, Fig. 6). Remarkably, there were
metabolome and proteome to unravel the minimal changes in the levels of metabolites in the
mechanisms by which the unique metabolic upper EMP and PP pathways, with the exception of
attributes of Pseudomonas species channel one metabolite (S7P) in the PP pathway and one
simultaneously sugar and aromatic carbons. Our metabolite (2KGlucn) in the periplasm (Fig. 5c).
13
C-metabolomics mapping demonstrated the In the TCA cycle, discrepancies between
compartmentalization of each substrate into two changes in protein levels and changes in metabolic
cyclic pathway networks in P. putida KT2440. fluxes stressed the importance of metabolite-level
Glucose-derived carbons were compartmentalized regulation (19, 24, 31–33, 38) (Fig. 4a, Fig. 4b, Fig.
within the cyclic connection of the ED pathway to 5a, Fig. 5b). Flux analysis in a previous study (13) of
the upper EMP pathway and the non-oxidative PP P. putida KT2440 grown on benzoate alone
pathway (14, 15); benzoate-derived carbons were determined an active glyoxylate shunt, despite a
compartmentalized within the TCA cycle and the lack of change in both gene expression and
glyoxylate shunt (Fig. 6). This metabolic transcripts of proteins in the glyoxylate shunt
segregation evidently represented an efficient when compared to cells grown on a hexose sugar.
strategy to meet biosynthetic flux demands both in Here, consistent with the well-known induced
terms of redox balance and carbon skeletons (Fig. activation of the glyoxylate shunt by elevated
4). acetyl-CoA levels (30), our profiling of metabolite
A recent report (34) of metabolite profiling of levels in cells grown on the glucose:benzoate
different organisms demonstrated that over two mixture captured a greater than 10-fold increase in
thirds of intracellular metabolite concentrations acetyl-CoA (Fig. 4b, Fig. 5c). We also recorded a
were above enzyme binding affinity, which thus decrease in the phosphorylation of an ICD-
maintained favorable reaction thermodynamics. In associated protein (PP_4011), which may serve to
the absence of absolute metabolite quantitation, counter the expected overwhelming metabolite-
we were not able to conduct a similar evaluation in level inhibition of ICD activity from metabolites of
our study. However, our profiling of relative the glyoxylate shunt and pyruvate accumulation
metabolite levels in P. putida KT2440 across the (30) (Fig. 4b, Fig. 5b, Fig. 5c).
two growth conditions implied fluctuations in The gluconeogenic flux of benzoate-derived
reaction quotients to meet energetically favorable carbons immediately upstream of the TCA cycle
metabolic fluxes (Fig. 5c). Notably, compared to P. was in the direction of favorable cascade of
putida KT2440 feeding on glucose alone, the metabolic flow, from high concentrations to low
fluxomics of the metabolic network during feeding concentrations of metabolites (Fig. 6). Additional
on the glucose:benzoate mixture was not fully regulation in support of this flux directionality was
predictable by relative protein abundances (Fig. 4, provided by the phosphorylation levels of PPSA
Fig. 5); a similar finding was reported by a previous and ACEF (Fig. 6). In sum, our results highlighted
study of P. aeruginosa grown on single substrates that both metabolite levels and post-translational
(35). switch of protein activity via phosphorylation
Consistent with reported downregulation of modifications could be implicated in establishing
genes in glucose catabolism in P. putida strains thermodynamic favorability (39, 40) of flux
grown on aromatic substrates (18, 36, 37), we magnitude and directionality in the metabolic
8network (Fig. 6). Further investigation is needed to fresh growth medium before conducting the
gain more insights on the manifestation of these experiments to ensure that cells were conditioned
regulatory controls under different nutrient in their respective growth medium. Cell growth
conditions or in engineered strains. (three biological replicates) was monitored by
Due to its diverse metabolic capabilities, P. measuring the optical density at 600 nm (OD600)
putida has been of particular interest as an using an Agilent Cary UV-visible
attractive bacterial cell factory for various spectrophotometer (Santa Clara, California). The
functionalities in industrial applications (41, 42). initial OD600 of the cells at each transfer was
Subsequent research with mutant or engineered between 0.05 and 0.07. Cells were transferred
strains is needed to explore whether leveraging in during mid-exponential phase, between OD600 0.5
part or in whole the segregated metabolism and 1.0. An OD600 measurement was obtained
detailed here may enhance mixed-substrate every 60 min until stationary phase; we performed
processing in biotechnological applications of dilutions of cell suspensions to get accurate
Pseudomonas species. Towards informing these readings at OD600 above 0.5. Cell dry weight in
potential engineering efforts, our multi-omics grams (gCDW) was also determined following drying
investigation provides new insights into the of 1-mL aliquots of cell suspensions using a
constitutive tuning of the metabolic architecture Labconco freeze-dryer (Kansas City, MO, USA).
that achieves efficient co-utilization of
Intracellular metabolite labeling and substrate
carbohydrate and aromatic substrates in P. putida
consumption
KT2440. This metabolic architecture may be
instrumental in conferring the nutritional flexibility For long-term intracellular labeling, culturing
of Pseudomonas species and the ubiquitous conditions were as described with two transfers of
survival of these bacterial species in different cultures (three biological replicates) in fresh
environmental niches. growth medium with labeled substrates purchased
from Cambridge Isotopes (Tewskbury, MA, USA) or
Experimental procedures
Omicron Biochemicals (South Bend, IN, USA). The
Culturing conditions labeled substrates were the following: [U-13C6]-
glucose alone, [U-13C6]-glucose with unlabeled
Pseudomonas putida KT2440 was obtained from
glucose, [1,5,6-13C3]-glucose alone, or [1,5,6-13C3]-
ATCC (American Type Culture Collection,
glucose with unlabeled benzoate. At two
Manassas, VA) as freeze-dried cultures. Cells were
timepoints during mid-exponential phase (OD600 of
re-suspended and grown in nutrient-rich liquid
0.5 and 1.0), cell suspensions (3 mL) were collected
Luria-Bertani (LB) medium. For carbon source-
and filtered following immediate quenching of the
specific growth, liquid cultures of P. putida KT2440
cell-containing filters in a cold (4°C) 2-mL solution
were grown in 250-mL baffled flasks (cell
of methanol:acetonitrile:water (40:40:20)
suspension did not exceed one-tenth of the total
solution. Solutions with the lysed cells were
flask volume) shaken vigorously at 220 rpm at 30°C
subsequently filter-centrifuged (Sigma Aldrich
in a G24 environmental incubator shaker (New
Spin-X, 0.22 μm filters). Aliquots of the
Brunswick Scientific, Edison, NJ). The pH-adjusted
supernatants were dried under nitrogen gas and
(pH 7.0) and filter-sterilized (0.22-μm nylon;
re-suspended in ultrapure LC-MS water (Fisher
Waters Corporation, Massachusetts) growth
Scientific, Pittsburgh, Pennsylvania) before
medium contained major and minor salts as
analysis via LC-MS. Metabolite levels were
previously reported (43). The total carbon-
normalized to biomass quantity at the time of
equivalent substrate concentration of 100 mM C
sampling.
was added as glucose alone (equivalent to 16.7
To quantify depletion of extracellular glucose
mM or 3 g L-1 glucose) or as a 1:1 glucose:benzoate
and benzoate from the medium, samples (three
mixture (equivalent to 1.5 g L-1 glucose and 2.0 g L-
1 biological replicates) were harvested throughout
benzoate). The cells were transferred twice into
the growth of the cells and stored at 4 °C until
9analysis time. The samples were analyzed by 1H citrate, α-KG, succinate, fumarate, malate,
nuclear magnetic resonance (NMR) using a Varian aspartate. All metabolite identification and
Unity INOVA 600-MHz NMR spectrometer at 25°C isotopic enrichment were determined using the
(relaxation delay of 5 s, recording of 16 scans per Metabolomics Analysis and Visualization Engine
sample, receiver gain of 32 dB) (44). The (MAVEN) software package (45)). The 13C-labeled
extracellular samples were prepared for NMR fractions were corrected for natural 13C
analysis by mixing 250 μL of filtered sample (0.22 abundance.
μm pore size nylon filters; Fisher Scientific,
Metabolic flux quantitation
Pittsburgh, Pennsylvania) with 60 μL of 100% D2O,
50 μL 2,2-dimethyl-2-silapentane-5-sulfonate Using the software 13CFLUX2 (46), a metabolic
(DSS) as a chemical shift reference compound, and flux analysis of the central carbon metabolism was
50 μL sodium-azide (NaN3) as an antimicrobial performed using experimental data (average ±
agent. The 13C-tracer experiments confirmed that standard deviation) as constraints. The labeling
extracellular depletion of the substrates correlated patterns of the intracellular metabolites following
with substrate consumption. Substrate growth on [1,5,6-13C3]-glucose alone or with
consumption rates (in mmol gCDW-1 h-1) during unlabeled benzoate were integrated with the
exponential growth were then determined by growth phenotype data, measured metabolite
regression analysis. excretions, and genome-scale determination of
biosynthetic flux demands to quantitate explicitly
Sampling of extracellular metabolite levels
the fluxes through 38 reactions in the metabolic
To monitor metabolite excretion rates, network—and 57 reactions collectively by
metabolites in the extracellular medium were considering that a flux remains unchanged in the
quantified during exponential phase. Aliquots (250 absence of carbon loss from one metabolic
μL) of the cell suspensions were collected for each reaction to the next. Using the biomass growth
of the three biological replicates followed by rates determined experimentally and published
centrifugation (21,130 g for 5 min) and filtration biomass composition of P. putida KT2440 (25),
(0.22 μm pore size nylon filters) to remove cell conversion rates were calculated for metabolite
particulates. Samples were diluted (by 1:100 or precursors to the biosynthesis of proteins, nucleic
1:1000) before LC-MS analysis as described below. acids, and cell membrane. The 13C-labeling data
Metabolite excretion rates (μmol gCDW-1 h-1) were used in the metabolic flux analysis were for the
determined by regression analysis. following metabolites: gluconate, G6P, F6P, R5P,
Xu5P, S7P FBP, DHAP, 3-PG, PEP, pyruvate, citrate,
Metabolomics analysis via LC-MS
α-KG, succinate, fumarate, and aspartate for OAA.
Metabolite extracts were analyzed by reversed- Initial flux values were set based on published
phase ion-pairing LC-MS using ultra-high values (14, 15) and subsequently optimized based
performance liquid chromatography (UHPLC; on the aforementioned experimentally-obtained
Thermo Scientific DionexUltiMate 3000) coupled data. Optimization of the metabolic flux analysis
with high-resolution/accurate-mass mass was achieved by satisfying carbon balance and
spectrometer (Thermo Scientific Q Exactive evaluated agreement between experimentally-
quadrupole-Orbitrap hybrid MS) with electrospray determined and model-estimated labeling
ionization (ESI) operated in negative mode. Details patterns (Supplementary Appendix G). The quality
on solvent composition and gradient for the LC of the fit to experimental data was measured by
protocol through a Waters Acquity UPLC BEH C18 calculating sum of squared residuals based on
column (1.7μm with column size 2.1 x 100mm) comparisons of model-estimated metabolite
(Waters Corporation, Massachusetts, USA) were labeling patterns to the measured values (15, 47).
reported previously (43). The following
Protein extraction method
metabolites were monitored: G6P, Glucn, F6P,
R5P, Xu5P, S7P, FBP, DHAP, 3-PG, PEP, pyruvate,
10All steps for cell harvest and protein extraction µL of 100 mM TEAB. Each sample was digested
were conducted at 4 oC. At mid-exponential phase with 18 μg trypsin for 18 h at 35 °C and an
(OD600 = 0.5-0.7), 25-mL culture aliquots were additional 2 μg trypsin was added and incubated
harvested from biological replicates (n = 3). Each for 4 h. The TMT 10-plex labels were reconstituted
sample was centrifuged (at 4 °C) and the with 45 µL of anhydrous ACN prior to labeling and
supernatant was carefully removed before washing added with 1:2 ratio to each of the tryptic digest
the cell pellet twice with high-purity deionized samples. The samples were incubated for 1 h at
(Milli-Q grade) water. Pellets were then stored at - room temperature in order to TMT label. The
20 °C until further use. For extraction, the thawed peptides from 10 samples were mixed with each
pellet was resuspended in 4-mL of 2.5 mM tag of TMT10plex separately. After checking the
phosphate buffer (pH 7) and then homogenized by label incorporation using Orbitrap Fusion (Thermo-
vortexing. The cells were lysed in a French Pressure Fisher Scientific, San Jose, CA) by mixing 1-µL
cell press (Thermo Spectronics, Wlatham MA) with aliquots from each sample and desalting with SCX
two 3-min cycles at 900 psi. The lysates were ziptip (Millipore, Billerica, MA), equal amounts of
centrifuged (at 16000 g, 10 min, 4oC) and an aliquot peptide from the 10 digested samples were pooled
of the supernatant (2 mL) was concentrated to 200 together. The pooled peptides were evaporated to
μL using a Spin-X® UF 500 Concentrator (Corning, 200 µL and subsequently purified by solid-phase
Tewksbury, MA). Proteins were precipitated extraction (SPE) on Sep-Pak Cartridges (Waters,
overnight at -20 °C in 9 volumes of cold 10% Milford, MA), according to the manufacturer
trichloroacetic acid in acetone. The solution was recommendations and dried at reduced pressure
centrifuged at 16000 g (4 °C) for 15 mins to form a in a Speed-Vac concentrator (Savant).
protein pellet; the supernatant was discarded. The
Proteomics analysis using nano-scale reverse
pellet was washed two times in cold acetone. Urea
phase LC and tandem MS
(7 M) was used to initiate protein dissolution. Each
dissolved pellet was then diluted in 50 mM The tryptic peptides prepared as described above
triethylammonium bicarbonate (TEAB) buffer (pH were subjected to a first dimensional fractionation
8). The final sample had less than 1 M urea via high-pH reverse phase (hpRP) chromatography,
contamination. The protein concentration for each carried out using a Dionex UltiMate 3000 HPLC
sample was determined by Bradford assay, and system (Thermo Scientific, Sunnyvale, CA) as
further quantified by running on a precast NOVEX reported previously (48, 49). Specifically, the TMT
12% Tris/Glycine mini-gel (Invitrogen, Carlsbad, 10-plex tagged tryptic peptides were reconstituted
CA) along with a series of amounts of E. coli lysates in 20 mM ammonium formate at pH 9.5 (eluent A)
(2, 5, 10, 20 µg/lane). The SDS gel was visualized and loaded onto an XTerra MS C18 column (3.5 µm,
with colloidal Coomassie blue stain (Invitrogen), 2.1x 150 mm) from Waters, (Milford, MA)
imaged by Typhoon 9400 scanner followed by equilibrated with eluant A. 80% ACN/20% 20 mM
ImageQuant TL 8.1 (GE Healthcare). Further ammonium formate (pH 9.5). The chromatography
processing of the proteins was then performed was carried out using a gradient from 10-45%
according to Thermo Scientific’s TMT Mass Tagging eluent B over 30 min at a flow rate 200 µL/min.
Kits and Reagents protocol Forty-eight fractions were collected at 1-min
(http://www.piercenet.com/instructions/2162073 intervals and pooled into a total of 10 fractions
.pdf ) with a slight modification(48, 49). based on the absorbance at 214 nm and with
A total of 200 µg protein of each sample in 70 multiple fraction concatenation strategy (48). Ten
µL of 7 M urea and 50 mM TEAB was reduced with percent of each fraction was pooled, dried and
11 mM tris (2-carboxyethyl)phosphine for 1 h at reconstituted in 120 µL of 2% ACN/0.5% FA for low
room temperature, alkylated with 37 mM pH nanoLC-MS/MS analysis. The remaining 90% of
iodoacetamide for 1 h in the dark and then each sample was pooled into 5 fractions, dried and
quenched by addition of 40 mM dithiothreitol subjected to titanium dioxide (TiO2) enrichment.
(DTT). The alkylated proteins were diluted with 240
11TiO2 enrichment was conducted using a TiO2 the range of m/z 400-1600 using the settings AGC
Mag Sepharose kit (from GE Healthcare). The TMT = 3e5 and Max IT = 50 ms. The MS/MS scans were
6-plex tagged tryptic peptides were reconstituted conducted using higher-energy collision
in 400 µL of binding buffer (1 M glycolic acid in 80% dissociation (HCD) at 60,000 FWHM resolution for
acetonitrile, 5% TFA). The TiO2 slurry (75 µL) was the mass range m/z 105-2000. The AGC setting,
used and incubated with the sample for 30 min at Max IT, and Q isolation window were set to 1e5,
1,800 rpm vortex. After washing the beads with 120 ms and ±1.6 Da, respectively. The dynamic
washing buffer (80% acetonitrile, 1%TFA), the exclusion parameters were set at 1 with a 45
phosphopeptides were eluted with 100 µL of second exclusion duration with a ±10 ppm
elution buffer (5% ammonium hydroxide) twice. exclusion mass width. All data were acquired using
The eluted fraction was dried and reconstituted in the Xcalibur 3.0 operation software and Orbitrap
25 µL of 0.5% formic acid (FA) for subsequent nano Fusion Tune 2.0 (Thermo-Fisher Scientific).
scale LC-MS/MS analysis.
Proteomics data processing and protein
The LC-MS/MS analysis was carried out using
identification
an Orbitrap Fusion (Thermo-Fisher Scientific, San
Jose, CA) mass spectrometer equipped with a All MS and MS/MS raw spectra were processed and
nanospray Flex Ion Source similar to previous searched using Proteome Discoverer 2.2 (Thermo)
reports (50, 51). The mass spectrometer was with Sequest HT. The
coupled to an UltiMate3000 RSLCnano HPLC Pseudomonas_putidaKT2440.fasta database
(Thermo Scientific, Sunnyvale, CA). A portion of containing 5528 entries (downloaded June 12,
each reconstituted fraction (2-3 µL for global 2017) was used to query the MS data. The default
proteomics fractions and 5-8 µL for enriched search settings used for 10-plex TMT quantitative
phosphor-fractions) was injected onto a PepMap processing and protein identification were as
C-18 RP nano-trap column (100 µm x 20 mm follows: tryptic proteolysis, allowing two missed
dimensions), 3-µm particle size, Dionex) at 20 cleavages, with fixed carbamidomethyl
µL/min flow rate for concentration and on-line modification of cysteine, fixed 10-plex TMT
desalting. The bound peptides were then modifications of lysine and N-terminal amines and
separated on a PepMap C-18 RP column (75 µm x variable modifications of methionine oxidation and
25 cm, 3.5 µm particle size) by elution at a flow rate deamidation of asparagine/glutamine residues.
of 300 nL/min. using a gradient of 5% to 35% The peptide and fragment mass tolerance values
acetonitrile (ACN) in 0.1% formic acid. The column were 10 ppm and 50 mDa, respectively. Identified
was re-equilibrated with 5% ACN-0.1% FA for 25 peptides were filtered for a maximum 1% False
min prior to the next run. Discovery Rate using the Benjamini Hochberg
The Orbitrap Fusion was operated in positive procedure (52) incorporated in the Percolator
ion mode with the nano spray voltage set at 1.6 kV algorithm in PD 2.2 and the peptide confidence
and the source temperature at 275 °C. The Fourier was set to high. The TMT10-plex quantification
transform (FT), ion-trap (IT), and quadrupole mass method within the PD 2.2 software was used to
analyzers were externally calibrated. The mass calculate the reporter ratios with mass tolerance
spectrometer was operated in the data-dependent ±10 ppm without applying the isotopic correction
acquisition (DDA) mode. The FT mass analyzer was factors. Only peptide spectra containing all
used for survey scans to select precursor ions. reporter ions were designated as quantifiable and
These were followed by 3 second top speed data- used for peptide/protein quantitation. Summed
dependent HCD-MS/MS scans using a normalized intensity normalization was used to estimate
collision energy of 37.5% for all precursor ions with expression ratios. To minimize the ratio distortion
at least 2 but no more than 7 charges per ion. The expected due to the co-isolation of near isobaric
threshold ion count was > 10,000. MS survey scans precursor ions, a co-isolation filter of 50% was
were conducted at a resolving power of 120,000 applied.
FWHM (measured at m/z 200) for all the masses in
12Statistical analysis Darling and Chi Squared tests (53–55). In each case
the best fit was determined to be to the four-
For comparisons of data from growth and
parameter Dagum distribution (56). The 95%
metabolomics experiments at the two growth
confidence intervals were estimated by generating
conditions (glucose:benzoate mixture versus
distributions randomly using the exact parameters
glucose alone), statistical analysis was done using
of the experimentally derived distributions. A two
unpaired two-tailed t-test. Statistically-significant
tailed heteroscedastic t-test was conducted to
difference was determined at p ≤0.05.
evaluate the difference between the means of the
To estimate the thresholds of significant
samples being compared. An expression ratio is
change from the proteomics data, the expression
considered to have changed significantly if the
ratios from each of the data sets were log2
magnitude of the change is greater than what
transformed and fit to 60 different statistical
would be expected to be observed by chance with
distributions using the program EasyFit
a probability of 0.05 and if its associated p-value
(MathWave Technologies). Goodness of fit was
was < 0.01.
determined by the Kalmogrov/Smirnov, Anderson
13Acknowledgements. Graduate support for M.A.K was provided by an Integrative graduate Education and
Research Traineeship (IGERT) fellowship from the National Science Foundation. Graduate support for both
M.S. and R.A.W was provided by graduate fellowships from Cornell University. Research funding was
provided in part by a start-up package from Cornell University. We thank Sheng Zhang of the Cornell
Proteomics facility for preliminary curation of the proteomics data. We thank James Shapleigh and Tara
Fish for helpful discussions in the preparation of the protein extractions and in the consideration of redox
balance in carbon metabolism, respectively.
The authors declare no conflicts of interest with the contents of this article.
14References
1. Bugg, T. D., Ahmad, M., Hardiman, E. M., and Singh, R. (2011) The emerging role for bacteria in lignin
degradation and bio-product formation. Curr. Opin. Biotechnol. 22, 394–400
2. Poblete-Castro, I., Becker, J., Dohnt, K., dos Santos, V. M., and Wittmann, C. (2012) Industrial
biotechnology of Pseudomonas putida and related species. Appl. Microbiol. Biotechnol. 93, 2279–2290
3. Vardon, D. R., Franden, M. A., Johnson, C. W., Karp, E. M., Guarnieri, M. T., Linger, J. G., Salm, M. J.,
Strathmann, T. J., and Beckham, G. T. Adipic acid production from lignin. 10.1039/c4ee03230f
4. Belda, E., van Heck, R. G. A., José Lopez-Sanchez, M., Cruveiller, S., Barbe, V., Fraser, C., Klenk, H.-P.,
Petersen, J., Morgat, A., Nikel, P. I., Vallenet, D., Rouy, Z., Sekowska, A., Martins dos Santos, V. A. P., de
Lorenzo, V., Danchin, A., and Médigue, C. (2016) The revisited genome of Pseudomonas putida KT2440
enlightens its value as a robust metabolic chassis. Environ. Microbiol. 18, 3403–3424
5. Johnson, C. W., Salvachúa, D., Khanna, P., Smith, H., Peterson, D. J., and Beckham, G. T. (2016) Enhancing
muconic acid production from glucose and lignin-derived aromatic compounds via increased
protocatechuate decarboxylase activity. Metab. Eng. Commun. 3, 111–119
6. Palazzolo, M. A., and Kurina-Sanz, M. (2016) Microbial utilization of lignin: available biotechnologies for
its degradation and valorization. World J. Microbiol. Biotechnol. 32, 173
7. Fang, W., Fang, Z., Zhou, P., Chang, F., Hong, Y., Zhang, X., Peng, H., and Xiao, Y. (2012) Evidence for
Lignin Oxidation by the Giant Panda Fecal Microbiome. PLoS One. 7, e50312
8. Rojo, F., Pieper, D. H., Engesser, K. H., Knackmuss, H. J., and Timmis, K. N. (1987) Assemblage of ortho
cleavage route for simultaneous degradation of chloro- and methylaromatics. Science. 238, 1395–8
9. Schmid, A., Dordick, J. S., Hauer, B., Kiener, A., Wubbolts, M., and Witholt, B. (2001) Industrial biocatalysis
today and tomorrow. Nature. 409, 258–268
10. George, K. W., and Hay, A. (2012) Less is more: reduced catechol production permits Pseudomonas
putida F1 to grow on styrene. Microbiology. 158, 2781–2788
11. Johnson, G. R., and Spain, J. C. (2003) Evolution of catabolic pathways for synthetic compounds: bacterial
pathways for degradation of 2,4-dinitrotoluene and nitrobenzene. Appl. Microbiol. Biotechnol. 62, 110–
123
12. Akkaya, Ö., Pérez-Pantoja, D. R., Calles, B., Nikel, P. I., and Lorenzo, V. de (2018) The Metabolic Redox
Regime of Pseudomonas putida Tunes Its Evolvability toward Novel Xenobiotic Substrates. MBio. 9,
e01512-18
13. Sudarsan, S., Dethlefsen, S., Blank, L. M., Siemann-Herzberg, M., and Schmid, A. (2014) The Functional
Structure of Central Carbon Metabolism in Pseudomonas putida KT2440. Appl. Environ. Microbiol. 80,
5292–5303
14. Nikel, P. I., Chavarría, M., Fuhrer, T., Sauer, U., and De Lorenzo, V. (2015) Pseudomonas putida KT2440
strain metabolizes glucose through a cycle formed by enzymes of the Entner-Doudoroff, embden-
meyerhof-parnas, and pentose phosphate pathways. J. Biol. Chem. 290, 25920–25932
15. Sasnow, S. S., Wei, H., and Aristilde, L. (2016) Bypasses in intracellular glucose metabolism in iron-limited
Pseudomonas putida. Microbiologyopen. 5, 3–20
16. Sudarsan, S., Blank, L. M., Dietrich, A., Vielhauer, O., Takors, R., Schmid, A., and Reuss, M. (2016)
Dynamics of benzoate metabolism in Pseudomonas putida KT2440. Metab. Eng. Commun. 3, 97–110
1517. Kim, J., Pérez-Pantoja, D., Silva-Rocha, R., Oliveros, J. C., and de Lorenzo, V. (2016) High-resolution
analysis of the m -xylene/toluene biodegradation subtranscriptome of P seudomonas putida mt-2.
Environ. Microbiol. 18, 3327–3341
18. Del Castillo, T., and Ramos, J. L. (2007) Simultaneous catabolite repression between glucose and toluene
metabolism in Pseudomonas putida is channeled through different signaling pathways. J. Bacteriol. 189,
6602–6610
19. Cao, B., and Loh, K.-C. (2008) Catabolic pathways and cellular responses of Pseudomonas putida P8
during growth on benzoate with a proteomics approach. Biotechnol. Bioeng. 101, 1297–1312
20. van Duuren, J. B. J. H., Wijte, D., Karge, B., Martins dos Santos, V. A. P., Yang, Y., Mars, A. E., and Eggink,
G. (2012) pH-stat fed-batch process to enhance the production of cis, cis-muconate from benzoate by
Pseudomonas putida KT2440-JD1. Biotechnol. Prog. 28, 85–92
21. Del Castillo, T., Ramos, J. L., Rodríguez-Herva, J. J., Fuhrer, T., Sauer, U., and Duque, E. (2007) Convergent
peripheral pathways catalyze initial glucose catabolism in Pseudomonas putida: Genomic and flux
analysis. J. Bacteriol. 189, 5142–5152
22. Basu, A., Apte, S. K., and Phale, P. S. (2006) Preferential Utilization of Aromatic Compounds over Glucose
by Pseudomonas putida CSV86. Appl. Environ. Microbiol. 72, 2226–2230
23. La Rosa, R., Nogales, J., and Rojo, F. (2015) The Crc/CrcZ-CrcY global regulatory system helps the
integration of gluconeogenic and glycolytic metabolism in P seudomonas putida. Environ. Microbiol. 17,
3362–3378
24. Nikel, P. I., Kim, J., and de Lorenzo, V. (2014) Metabolic and regulatory rearrangements underlying
glycerol metabolism in Pseudomonas putida KT2440. Environ. Microbiol. 16, 239–254
25. van Duuren, J. B. J. H., Puchałka, J., Mars, A. E., Bücker, R., Eggink, G., Wittmann, C., and Dos Santos, V. A.
P. M. (2013) Reconciling in vivo and in silico key biological parameters of Pseudomonas putida KT2440
during growth on glucose under carbon-limited condition. BMC Biotechnol. 13, 93
26. Nelson, K. E., Weinel, C., Paulsen, I. T., Dodson, R. J., Hilbert, H., Martins dos Santos, V. A. P., Fouts, D. E.,
Gill, S. R., Pop, M., Holmes, M., Brinkac, L., Beanan, M., DeBoy, R. T., Daugherty, S., Kolonay, J., Madupu,
R., Nelson, W., White, O., Peterson, J., Khouri, H., Hance, I., Chris Lee, P., Holtzapple, E., Scanlan, D., Tran,
K., Moazzez, A., Utterback, T., Rizzo, M., Lee, K., Kosack, D., Moestl, D., Wedler, H., Lauber, J., Stjepandic,
D., Hoheisel, J., Straetz, M., Heim, S., Kiewitz, C., Eisen, J., Timmis, K. N., Düsterhöft, A., Tümmler, B., and
Fraser, C. M. (2002) Complete genome sequence and comparative analysis of the metabolically versatile
Pseudomonas putida KT2440. Environ. Microbiol. 4, 799–808
27. Kohlstedt, M., and Wittmann, C. (2019) GC-MS-based 13C metabolic flux analysis resolves the parallel
and cyclic glucose metabolism of Pseudomonas putida KT2440 and Pseudomonas aeruginosa PAO1.
Metab. Eng. 54, 35–53
28. Wilkes, R. A., Mendonca, C. M., and Aristilde, L. (2018) A Cyclic Metabolic Network in Pseudomonas
protegens Pf-5 Prioritizes the Entner-Doudoroff Pathway and Exhibits Substrate Hierarchy during
Carbohydrate Co-Utilization. Appl. Environ. Microbiol. 10.1128/AEM.02084-18
29. Ruiz-Manzano, A., Yuste, L., and Rojo, F. (2005) Levels and Activity of the Pseudomonas putida Global
Regulatory Protein Crc Vary According to Growth Conditions. J. Bacteriol. 187, 3678–3686
30. Laporte, D. C. (1993) The isocitrate dehydrogenase phosphorylation cycle: Regulation and enzymology. J.
Cell. Biochem. 51, 14–18
16You can also read