U.K. House Prices and the Regional Housing Markets Outlook After Brexit Test
←
→
Page content transcription
If your browser does not render page correctly, please read the page content below
ANALYSIS                            U.K. House Prices and the Regional Housing
                                    Markets Outlook After Brexit Test
Prepared by
                                    Introduction
Andres Carbacho-Burgos
Andres.Carbacho-Burgos@moodys.com   Britain’s decision to leave the European Union in the June 23 referendum came as a surprise
Director
                                    to most observers who had expected a majority to vote to remain in the EU. Brexit will have a
                                    number of negative effects on the U.K. economy. The severity of these effects will depend greatly
Contact Us
                                    on the reactions of other EU countries and on whether Scottish voters decide that they should
Email                               separate from the U.K. in order to stay in the EU. Brexit adds to downside risks for the national
help@economy.com
                                    housing market, but such risks were already present before the British public voted to leave
U.S./Canada                         the EU. In this article, Moody’s Analytics applies its forecast model for U.K. house prices to the
+1.866.275.3266
                                    specifics of Brexit, in particular to disentangling the house price effects of Brexit from previously
EMEA                                existing imbalances in the U.K. housing market.
+44.20.7772.5454 (London)
+420.224.222.929 (Prague)

Asia/Pacific
+852.3551.3077

All Others
+1.610.235.5299

Web
www.economy.com
www.moodysanalytics.com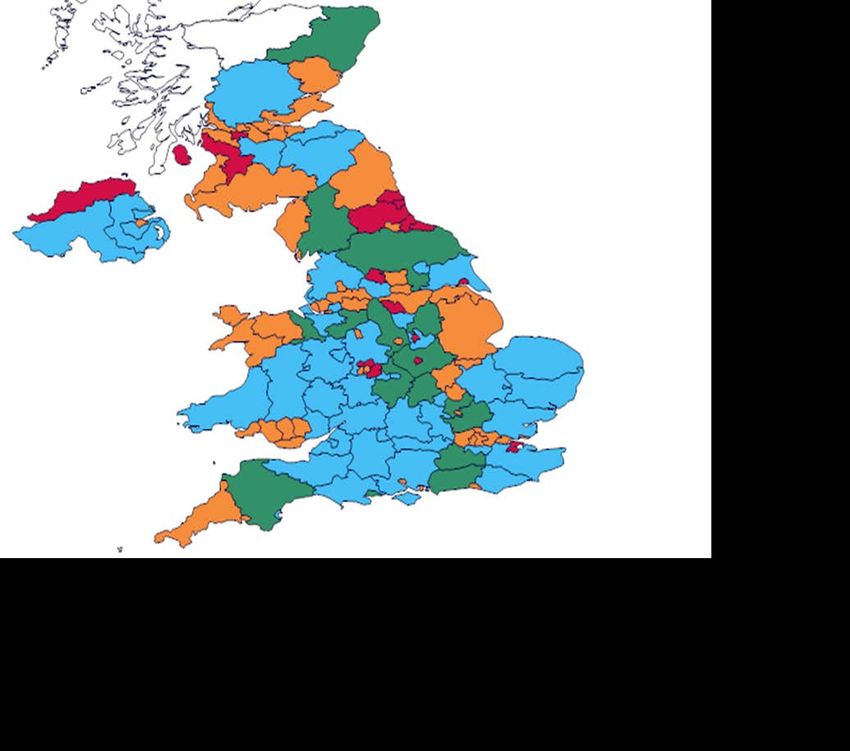
MOODY’S ANALYTICS

U.K. House Prices and the Regional Housing
Markets Outlook After Brexit
BY ANDRES CARBACHO-BURGOS

B
        ritain’s decision to leave the European Union in the June 23 referendum came as a surprise to most
        observers who had expected a majority to vote to remain in the EU. Brexit will have a number of negative
        effects on the U.K. economy. The severity of these effects will depend greatly on the reactions of other EU
countries and on whether Scottish voters decide that they should separate from the U.K. in order to stay in the
EU.1 Brexit adds to downside risks for the national housing market, but such risks were already present before the
British public voted to leave the EU. In this article, Moody’s Analytics applies its forecast model for U.K. house
prices to the specifics of Brexit, in particular to disentangling the house price effects of Brexit from previously
existing imbalances in the U.K. housing market.2

    This article has two objectives. First, we                        50 of the Lisbon Treaty, political sentiment in   PLC average asking price is the timeliest and
look at the historical data for the U.K. hous-                        Scotland, and the general level of confidence     has the highest frequency, being a weekly
ing market to establish trends and imbal-                             in the economic policies within the EU. At        index, but it is limited by the length of the
ances that were already in place before the                           worst, the negotiations, political sentiment      available time series, which only go back to
June 23 vote; both implications and limita-                           and economic confidence could break down          2010. Up to now, Moody’s Analytics has pro-
tions of the data will be discussed. We then                          simultaneously. A combined fall in trade,         jected the Halifax House Price Index as its
apply the U.K. house price forecast model                             incomes and confidence could thus lead to a       main national measure of house prices and
to the Moody’s Analytics Brexit scenarios to                          serious, if temporary, generalized house price    projects the ONS and Land Registry prices
obtain new house price forecasts for each                             decline. Even if the baseline assumptions         for the subnational regions.3
alternative scenario.                                                 hold in coming years, there will still be sig-        The Halifax House Price Index uses its
    The main conclusion is that under base-                           nificant regional variation in medium-term        own database of house purchase transac-
line assumptions for Brexit, the process will                         house price trends.                               tions to construct the national Halifax House
lead to slower house price growth in most                                                                               Price Index. The index starts in January
U.K. regions, not to any generalized market                           U.K. house prices: A primer                       1983 and is calculated based on a hedonic
correction. However, the Brexit process is                                There is a variety of data sources to         approach to represent the price of a typi-
subject to a number of downside risks due to                          choose from when measuring house valua-           cally transacted house of constant quality
several factors such as trade and immigra-                            tion. Publicly available house price data are     by controlling for various characteristics of
tion negotiations with the EU under Article                           available from the U.K. Office for National       a house such as area, location and age in a
                                                                      Statistics and from Land Registry. In ad-         regression. The data used are for approved
                                                                      dition, private house price measures are          mortgage transactions before closing, and so
1    There is also the possibility that Northern Irish voters might
     decide to leave the U.K. if open borders with Ireland cannot     obtainable from Halifax Bank of Scotland,         tend to lead the public price indexes, which
     be maintained. However, the main assumptions of the vari-
     ous Brexit scenarios envisioned by Moody’s Analytics focus
                                                                      Nationwide Building Society, and Rightmove        are based on data from closed sales.
     only on Scotland as the main separatist risk to the U.K. See     PLC. Of the private-label house price mea-
     Ruth Stroppiana, Petr Zemcik, and Barbara Teixeira-Araujo,
     “U.K. Exit from the EU: Potential Outcomes”, Moody’s Ana-
                                                                      sures, the Halifax and Nationwide hedonic         3   After July 2016, Moody’s Analytics will no longer forecast
     lytics, July 2016.                                               price indexes use the most detailed data              the Halifax House Price Index, due to the purchase of the
2    See the previous article, “U.K. House Prices: The Moody’s                                                              index by Markit Ltd. and more stringent restrictions on
     Analytics Forecast Model,” by Jing Zhang. Regional Finan-
                                                                      and are timelier, but are also more limited in        forecasting and redistribution as a result. Moody’s Analytics
     cial Review, July 2016.                                          their subnational coverage. The Rightmove             will now forecast the ONS national price level instead.

1      August 2016
MOODY’S ANALYTICS
The ONS provides house prices for the gin in January 1995.5 Chart 1: Moderate Recent House Price Growth
U.K. and for its constituent NUTS 1 (No- The Land Registry Inflation-adjusted house prices, % change yr ago
menclature of Units for Territorial Statistics) house price indexes 40
Former owner-occupiers First-time
areas. The house prices are calculated using are calculated using
30 homebuyers
mortgage-financed transactions that are a repeat-sales re-
collected from the Regulated Mortgage gression model that 20
Survey by the Council of Mortgage Lenders. matches sale pairs
10
As with Halifax, the mortgage-based data for each house that
used by ONS fall short of 100% coverage of has not had signifi- 0
the housing markets. Missing observations cant improvements, -10
include cash transactions, which often occur keeping housing
in the upper tier of the housing market and quality constant for -20
88 90 92 94 96 98 00 02 04 06 08 10 12 14 16
with foreclosures, plus mortgages that fail each property and
Sources: ONS, Moody’s Analytics
to meet regulatory restrictions such as con- preventing changes in
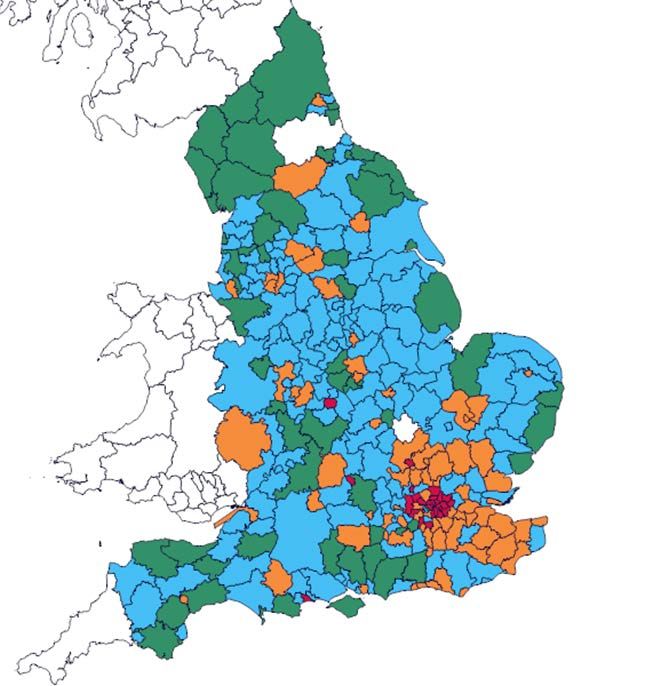
forming loan limits that prevent mortgages the home sales mix 1
from being bought by major financial insti- from affecting the house price measure. Cal- follow a perceptible north-south division
tutions and being recorded by the Council of nea Analytics Limited produces the statisti- (see Charts 2 and 3). In Chart 2, we compare
Mortgage Lenders. The current ONS survey cal model used for constructing the monthly cumulative one-year and five-year growth
covers the majority of mortgage lenders in frequency database. rates for average Land Registry prices for
the U.K.4 However, prior to 2005, survey Last, Moody’s Analytics converts these the 111 NUTS 3 areas within England and
participants submitted only a 5% represen- house prices from monthly to quarterly Wales.6 House price growth for NUTS 3
tative sample of their mortgages. frequency in order to fit its forecast model areas in Wales and the northern regions
The ONS creates an average house price and also converts the district- and county- (North West, North East, and Yorkshire-
for each geography using a mix-adjusted level Land Registry prices to fit the NUTS Humber; all designated with yellow mark-
model to allow for differences in the houses 3 definitions. ers in the chart) has been slow at best and
sold each period. Dwellings are grouped negative at worst. The Midland and Eastern,
based on age, location, and type of dwelling. Recent house price trends South West, and South East regions (blue
The resulting series are combined into an Much of the housing market information and orange markers) have seen more sus-
index that is weighted based on the number for the U.K. focuses on the London metro tained house price growth on average. The
of transactions in each group. In January of area and gives the erroneous impression five NUTS 3 areas in the London region
each year, the index weights are updated that the British housing market is overheat- (green markers) have seen the strongest
based on the relative numbers of transac- ing and the housing stock is overvalued. house price growth over five years, although
tions during the previous three years, which But national data give a different overall in 2014 they started to slow significantly.
are benchmarked to total transactions ob- picture (see Chart 1). House price growth for East Inner London leads the nation with
tained from the Land Registry. Applying new the U.K. as of 2016 is healthy but relatively over 66% cumulative growth over five years.
weights ensures that the index keeps up-to- moderate, and indeed is not as strong as West Inner London, which includes the City
date with changes in the types of properties the 1998-2005 boom in house prices prior of London, also has strong five-year growth
that are being purchased, and therefore to the financial crisis. Though prices for but has slowed to 3.4% year-over-year
reflects the price of the average property. first-time homebuyers tend to be slightly growth as of the first quarter of 2016, an
Land Registry publishes an index for the more volatile than prices for former owner- indication that demand is slowing as poten-
aggregate of England and Wales, for the occupiers, their growth rates tend to match, tial purchasers perceive the local market to
English and Welsh NUTS 1, NUTS 2 and indicating that the gap between the two be overvalued, and possibly that the fund
NUTS 3 regions, and for metro areas in Eng- average price levels tends to stay constant inflows to drive demand diminished due to
land and Wales, using public sales data col- in real terms. Currently, former owner- anxiety over the coming EU referendum.
lected on all residential housing transactions occupiers pay about £100,000 more for a The ONS data for the larger NUTS 1 re-
registered with Land Registry, whether for home purchase on average than do first- gions (shown in Chart 3) provide a similar
cash or with a mortgage. The data series be- time homebuyers. regional pattern with London and the South
However, regional asymmetries are as
4 During 2011, the dataset covered 65% to 70% of all 6 Moody’s Analytics converts the district-based Land Reg-
mortgages originated in the U.K. More recently, ONS has
pronounced as in U.S. housing markets, and istry data to fit the 2010 NUTS 3 definitions, resulting
announced that it will publish a single set of house price in prices and indexes for 111 county-sized areas. Due to
indexes in combination with Land Registry. Moody’s Ana- boundary problems, Moody’s Analytics has not yet up-
lytics will re-estimate its U.K. house price model when the 5 Land Registry also publishes house price index data for dated this conversion to fit the more granular 2013 NUTS
new data become public. NUTS 1 areas, but only in England and Wales. 3 boundaries.
2 August 2016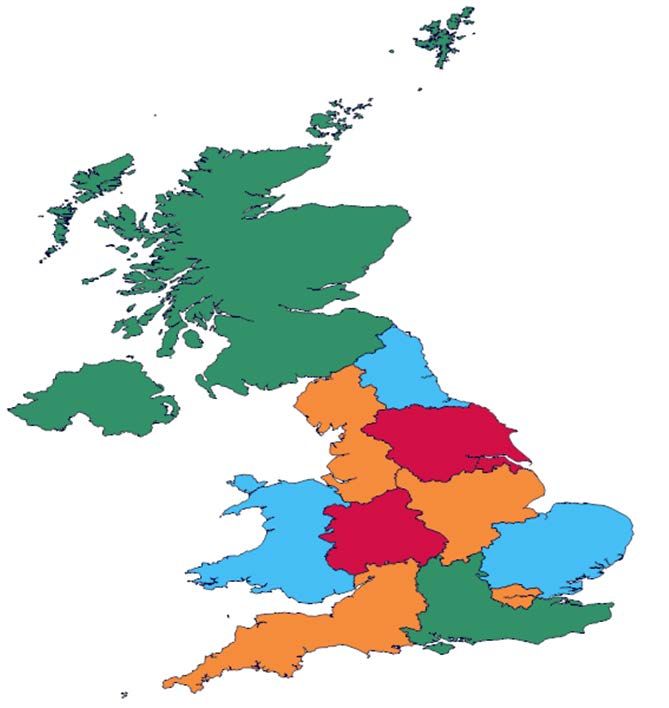
MOODY’S ANALYTICS
Chart 2: London Has Led, but Is Slowing Down Chart 3: London Housing Boom Before Brexit
Land Registry avg house price, cumulative % change, 2016Q1 ONS avg house price, % change yr ago
30 20
London area 18
25 Eastern, South East London
16
20 South West, East and West Midlands
14
Wales, northern regions South East
12
1 yr
15
10
10
8
5 6
0 4
Each point is one NUTS 3 area.
-5 2
Rest of U.K.
-20 -10 0 10 20 30 40 50 60 70 0
5 yr 10 11 12 13 14 15 16
Sources: Land Registry, Moody’s Analytics Sources: ONS, Moody’s Analytics
2 3
East dominating house price appreciation come and increased demand for higher-end main determinant of long-term price trends.
compared with the rest of the U.K. Greater housing. While there is no clear correlation Moody’s Analytics uses a forecast for real
London recorded disproportionate house over an extended period, the surge in capital median or real per capita income as the main
price growth through 2014. Growth slowed inflows from 2012-2015 correlates well with long-term driver of regional house price ap-
down drastically in late 2014 and early 2015 faster house price growth in those years preciation in all of its house price models. In
but has since started to pick up again. Al- (see Chart 4). The peaking of capital inflows particular, the ratio of house price to income
most as importantly, the South East region also coincides with the slowdown in London is a key shorthand metric for gauging the
bordering London has consistently led the house price growth. current state of local housing markets. How-
rest of the U.K. area (the U.K. excluding Lon- London is not the only U.K. region that ever, both subnational and high-frequency
don and the South East), whose house price has benefited from capital inflows. In North- income data are difficult to come by, so the
growth has averaged a steady and unspec- ern Ireland, for example, capital inflows com- granularity and timeliness of affordability
tacular 4% over the past five years. bined with poor quality mortgage lending to data are not as much as would be desired.
create a house price bubble comparable to The Nationwide Building Society com-
Wealth and affordability that of the U.S., with house prices rising to piles two national measures of housing af-
There are several factors driving the more than 90% above trend value by 2007 fordability (see Chart 5). While mortgage
imbalance of house price patterns. First, before bursting. Still, London and the adja- debt service as a percent of income is close
London is more of an international housing cent regions have access to the lion’s share to its historical average, the ratio of the
market than a national one; a significant of capital inflows thanks to the financial mean house price to earnings is back close
proportion of housing demand comes from industry, and such inflows will continue to to its all-time peak in 2007. Clearly, the
wealthy non-U.K. citizens, while capital support house prices in coming years. implication is that home purchases remain
inflows into the City of London’s financial While wealth inflows have regionally con- affordable relative to income mainly because
institutions lead to increased industry in- centrated effects, it is real income that is the mortgage lending rates are still near record
Chart 4: Inflows Since 2012 Affect London Chart 5: Only Low Rates Save Affordability
Nationwide affordability indexes for first-time homebuyers
7 250 5.5 60
Avg house price, House price-to-
6 Sum of capital and London metro area, 5.0 earnings ratio (L) 55
220
financial account 1987£ ths (R) 50
5 4.5
balances, % of 45
4 GDP, 4-qtr MA (L) 190
4.0 40
3 160 3.5 35
Mortgage 30
2 3.0 service, % of
130 income (R) 25
1 2.5 20
0 100 2.0 15
00 02 04 06 08 10 12 14 16 83 85 87 89 91 93 95 97 99 01 03 05 07 09 11 13 15
Sources: Land Registry, ONS, Moody’s Analytics Sources: Nationwide Building Society, Moody’s Analytics
4 5
3 August 2016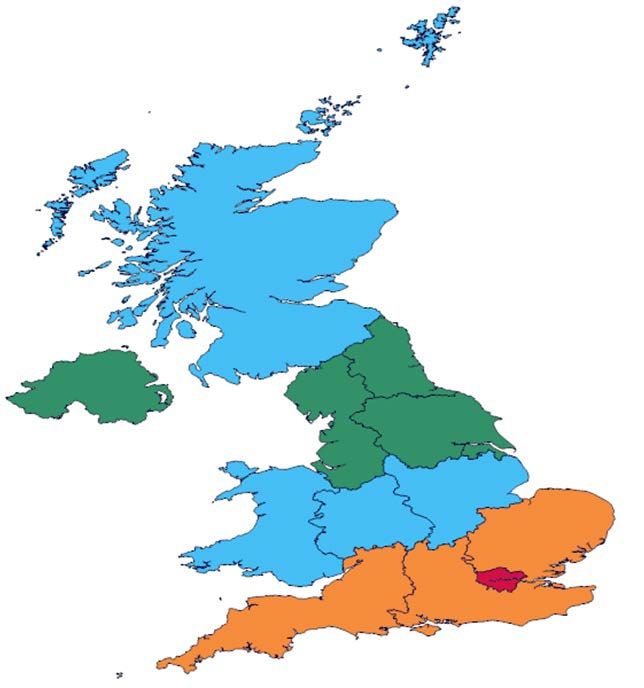
MOODY’S ANALYTICS

Chart 6: Affordability Divides North vs. South                                                         Chart 7: Rent Growth Starts to Favor Purchases
Ratio, avg dwelling price to mean taxpayer income, 2014
                                                                                                       5.2                                                                                     27

                                                                                                       5.0                                       Ratio, house price
                                                                                                                                                 to annual rent (R)                            26
                                                                                                       4.8

                                                                                                       4.6                                                                                     25

                                                                                                       4.4                                                                                     24
                                                                              U.K.=8.5

                                                                                5.5 to 6.5             4.2
                                                                                                                                                                                               23
                                                                                6.6 to 8.3             4.0                           Deflated annual rent,
                                                                                8.4 to 9.4                                           1987£ ths (L)
                                                                                                       3.8                                                                                     22
                                                                                9.5 to 10.2                  08     09        10       11       12        13        14        15        16
Sources: ONS (NUTS 1 regions), HMRC, Moody’s Analytics                                                 Sources: ONS, HomeLet Rental Index, Moody’s Analytics

                                                                                                 6                                                                                                      7

lows. The Bank of England thus must keep                            house price correction is around the corner,                      becoming overvalued relative to rents; to the
in mind that any significant interest rate                          provided that continued capital inflows sustain                   contrary, rising rent values have pushed the
tightening may have abnormally strong ef-                           steady house price growth. London has for a                       rent versus buy calculation down closer to its
fects on the housing market, both in terms                          long time been assured of such inflows. But                       historical average (see Chart 7).9 Starting in
of reduced home purchases and increased                             Brexit now adds some downside risk to this                        2014, a combination of increased rental de-
mortgage debt delinquency.                                          picture, given that a significant share of the                    mand and restricted supply started to sharp-
    Income data for U.K. subnational regions                        U.K. financial services industry could relocate                   ly drive up the real value of rents; the fall in
have long lag times, so it is hard to compile                       to the Continent if the U.K. is unable to negoti-                 global energy prices, which reduced headline
comprehensive regional house price-to-                              ate a favorable trade agreement with the EU.8                     consumer price inflation, gave the real value
income ratios. One approximation is the                                                                                               of rents another push. So in aggregate terms
ratio of the average ONS house price to                             Price-rent imbalances                                             a comparison of rents and purchase prices
mean taxpayer income for the NUTS 1 region                              Housing values are also regulated by their                    would indicate that the purchase market is
in 2014, the last year for which taxpayer in-                       sustainability relative to rents. House prices                    not tight.
come data is available from HM Revenue and                          that are too high relative to local rents will                        There is also a stark geographical pattern
Customs (see Chart 6).7 These data clearly                          need to be sustained by larger incomes and                        when comparing the price-rent ratios for
depict the division of U.K. housing markets                         wealth reserves or potential buyers will in-                      NUTS 1 regions, using the ONS house prices
into the south versus everyone else: Price-to-                      stead continue to rent, driving down prices.                      and the HomeLet rental values (see Chart 8).10
income ratios are low for the northern Eng-                         Conversely, prices that are low relative to                       Price-rent ratios fall as distance from London
lish regions and Northern Ireland, marginally                       local rents will trigger a movement from                          increases; prices in Scotland, Northern Ireland,
higher for Scotland, Wales and the Midlands,                        rentals to purchases, though only if potential                    Wales and northern England are an order of
and much higher for the southern regions,                           buyers have sufficient income and accumu-                         magnitude lower relative to rents than central
with average London house prices being over                         lated wealth for the down payment, not to                         and southern England. The one exception is
10 times higher than mean taxpayer income,                          mention a good credit record.                                     London itself, where rent growth outpaced
a strong indication that house prices in Lon-                           Available regional data for U.K. rents are                    house price growth in 2015, pushing the
don are overvalued.                                                 restricted to the NUTS 1 regions. We have                         price-rent ratio below that of the neighbor-
    These measures of housing affordability                         chosen the HomeLet Rental Index, which is                         ing regions. As with price-income ratios, the
also help to deduce the patterns of regional                        available at the NUTS 1 level. And unlike rent                    larger price versus rent imbalance for southern
wealth or wealth inflows available for use in                       indexes such as an ONS Experimental Index,                        England is likely sustained by wealth and capi-
home purchases. Overvalued house prices                             the HomeLet data are timely and are mea-
in London do not automatically imply that a                         sured in pound values rather than just as an
                                                                                                                                      9  As of October 2015, HomeLet has stopped publishing a
                                                                    index, making it easier to compare to house                          national index; for subsequent months, the national series
                                                                                                                                         is grown out using a population-weighted average of the
7    As an income measure, mean taxpayer income is open
                                                                    prices and incomes.                                                  NUTS 1 rent indexes.
     to the objection that it includes income used for tax pay-         The combined ONS price and HomeLet                            10 HomeLet’s geographical definitions for the Eastern and
     ments, and also excludes foreign residents who do not pay                                                                           South East regions are different than Eurostat’s, with the
     taxes either because they earn income abroad or are too
                                                                    rent data indicate that house prices are not                         result that there is no HomeLet index for the Eurostat-
     poor to file a tax return. Unfortunately, as of this writing                                                                        defined Eastern region. A weighted average of the South
     ONS data on gross disposable household income for 2014,        8   See Barbara Teixeira-Araujo, “U.K. Exit: Tough Times Ahead       East and East Anglia rent indexes suggests, though, that the
     a more applicable income category, has not been made               With No Obvious Upside,” Regional Financial Review, June         price-rent ratio for the Eastern region is in the same range
     available to Moody’s Analytics.                                    2016.                                                            as the South East.

4      August 2016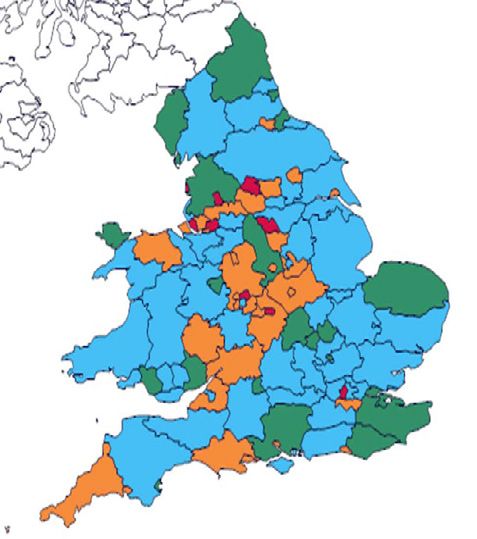
MOODY’S ANALYTICS

Chart 8: House Price vs. Rent—Another Divide                                              Chart 9: Recent Construction Lags Households
Ratio, avg dwelling price to annual rent, 2016Q1                                          Dwelling completions and household formations, ths
                                                                                          300
                                                                                                                                                    Household
                                            * NUTS 1 region rent index not                275
                                                                                                     Completions                Household           formations
                                            available; ratio ≈ 31.5 if using avg
                                                                                          250                                   formations          (annual
                                            of South East (NUTS 1) and
                                                                                                                                (census)            projections)
                                            East Anglia (NUTS 2) rent
                                            indexes                                       225

                                                                                          200
                                                                    U.K.=27.1
                                                                                          175
                                                                      21.9 to 24.4
                                   *                                  24.5 to 27.2        150
                                                                      27.3 to 30.0        125
                                                                      30.1 to 32.8              78      82     86      90      94      98      02      06      10      14
Sources: ONS (NUTS 1 regions), HomeLet, Moody’s Analytics                                 Sources: DCLG, Moody’s Analytics

                                                                                     8                                                                                          9

tal inflows, which may be adversely affected                subnational geogra-                   Chart 10: Market Tightens as Construction Lags
by any change to London’s status as a global                phies other than the                  Vacant housing stock, % of total
financial center due to Brexit.                             English districts. Thus               7
                                                            one must be careful                             Scotland
                                                                                                  6
                                                                                                                                                                     Wales
The supply question                                         in comparing data
                                                                                                  5
    A lack of new construction in recent                    from these different                         U.K.
years is the one major factor pushing the                   sources, but they can                 4

U.K. housing market toward overheating, al-                 be useful to create                   3
                                                                                                                                                              England
though again, the situation varies by region.               some back-of-the-                     2
                                                                                                                            Northern Ireland*
From a high of nearly 220,000 dwelling com-                 envelope calculations
                                                                                                  1
pletions before the financial crisis, residential           to compare supply                                                                                      *Estimated
construction fell to 140,000 units over the                 and demand.                           0
                                                                                                     00 01 02 03 04 05 06 07 08 09 10 11 12 13 14 15
next three years and has yet to fully recover.                   Aggregate com-
                                                                                                  Sources: ONS, DCLG, NINIS, Welsh Assembly, Moody’s Analytics
This decline is somewhat unbalanced region-                 pletions for the most
ally. The construction industry in Northern                 part did keep pace                                                                                                  10

Ireland recovered the least, where dwelling                 with inferred household formation from the                      cline in the implied vacancy rate ranges from
completions fell by more than 60% from the                  1980s through 2007, just before the financial almost imperceptible in Scotland, where
2007 peak after the bursting of the house                   crisis. After 2007 though, residential con-                     household formation is weak relative to con-
price bubble and have not even started to                   struction fell steeply and has not kept pace                    struction, to potentially serious in England
recover. Scotland and Wales had shallower                   either with inferred household formation                        itself where the share of the housing stock
declines, but also little by way of recovery;               through 2011 or with estimated household                        that is vacant has fallen from more than 4%
only England has had anything resembling a                  formations from 2012 to 2015 (see Chart 9).                     in 2009 to little more than 2% in 2015.
construction recovery.                                           Similarly, a comparison of local dwelling                      A full discussion of the reasons for insuf-
    How far is residential construction fall-               stock data for England, Northern Ireland,                       ficient construction is beyond the scope of this
ing short of demand? Finding an answer to                   Scotland and Wales with the corresponding                       article, but these reasons include low develop-
this question is complicated by a shortage of               DCLG household data shows a consistent                          er confidence given the macroeconomic effects
data on households and the dwelling stock at                trend (see Chart 10). The implied vacancy                       of fiscal contraction over the last five years,
the subnational levels. Aside from England,                 rate of the housing stock has been falling                      low actual as opposed to potential demand in
where the Department for Communities and                    since 2010 for the U.K. as a whole. The de-      11
                                                                                                                            major urban areas outside of London, and the
Local Government (DCLG) collects house-                                                                                     restrictive role of land zoning laws such as re-
hold totals at the district level, there are only           11 The vacancy rate is implied because it is not directly       quired green belt zones in or near many major
                                                                measured but is instead calculated by comparing the local
national-level decennial census data as well                    dwelling stock to household estimates. The risks involved
                                                                                                                            urban areas, and possible shortages of skilled
as recent annual estimates for the rest of the                  in comparing local housing stock data to DCLG household     construction workers. Brexit will now add to
                                                                estimates are illustrated by Northern Ireland, where the
U.K. The DCLG collects data on residential                      raw numbers yielded negative vacant dwelling shares for
                                                                                                                            developer confidence problems in the short
construction and the stock of dwellings, but                    several years after 2000. As a result, the Northern Ireland term at least, if not to land supply constraints.
                                                                share was calibrated so that it conformed more closely to
in separate surveys with differing method-                      the U.K. average. Even so, the Northern Ireland numbers
                                                                                                                                 A more granular breakdown of the
ologies, and the data also end at 2011 for                      should be taken with a strong dose of skepticism.           supply-demand balance for housing is pos-

5     August 2016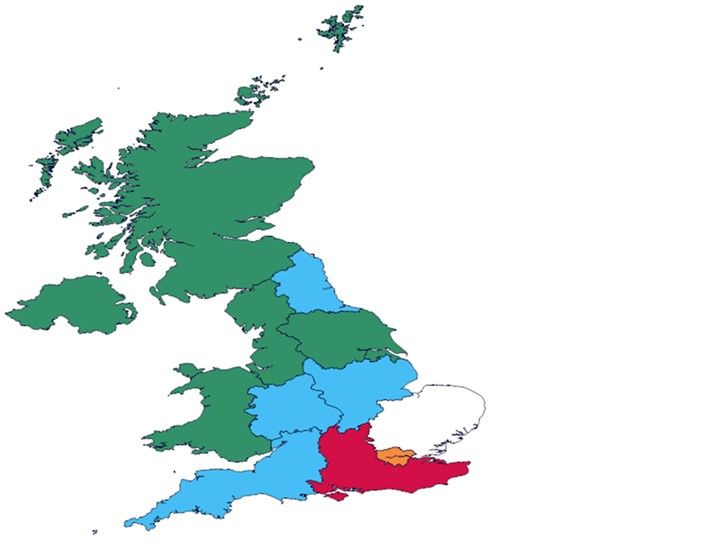
MOODY’S ANALYTICS

Chart 11: Construction Lags in London                                                                 Chart 12: High Unemployment Pockets Persist
 Dwelling completions net of household formations, % of households                                    Unemployment rate estimate, %, by NUTS 3 region, 2015Q4
                                                     By district, 2011-2015 avg

                                                                      England=-0.44                                                                                   U.K.=5.1
                                                                          0 to 0.57                                                                                     1.4 to 3.1
                                                                          -0.44 to -0.01                                                                                3.2 to 4.9
                                                                          -1.00 to -0.45                                                                                5.0 to 7.7
                                                                          -2.30 to -1.01                                                                                7.8 to 11.8
Sources: ONS, DCLG, Moody’s Analytics                                                                 Sources: ONS, Moody’s Analytics

                                                                                             11                                                                                       12

sible only for England, which has annual                         northeastern, and southwestern portions                           populated NUTS 3 area that has a seriously
construction totals and household estimates                      of England, where population growth and                           high unemployment rate (see Chart 12). The
available for all but four area districts.12 A                   household formations are relatively subdued.                      unemployment rates used are for the fourth
comparison of these two data series shows,                       The DCLG data thus indicate that insufficient                     quarter of 2015, the last quarter for which
unsurprisingly, that the shortage of construc-                   dwelling construction is a problem limited                        there is standardized unemployment rate
tion is regionally concentrated (see Chart 11).                  mainly to London and to the downtown dis-                         data at the NUTS 3 level.
A common shorthand measure of the sup-                           tricts of a few other major urban areas.                              It should also be kept in mind that the
ply-demand balance is used: annual dwelling                                                                                        unemployment rate by itself is not the best
completions net of household formations, as                      Conclusions: The U.K. before Brexit                               indicator of future house price movements.
a percentage of the previous year’s house-                           Several points can summarize the state of                     Indeed, the U.K. HPI forecast model uses the
holds total.13 To account for the possibility                    the U.K. housing market prior to Brexit. First,                   change in the unemployment rate rather
that 2015 (the latest available year) was                        a lack of demand or low confidence in the                         than its level in order to model short-term
an outlier for any particular district, a five-                  housing market was not a serious problem                          shocks. A rising unemployment rate has an
year average for 2011-2015 is used instead.                      before Brexit, at least if measured by sales                      effect on house prices similar to an indica-
Residential construction is running short                        totals. According to HM Revenue and Cus-                          tor of falling consumer confidence in the
of household formations most seriously in                        toms transactions data, current sales in the                      short-term, but the long-term driver of
Greater London, where a majority of districts                    U.K. are running at approximately 1.2 million                     house prices is a mean or median measure of
report household formation exceeding con-                        units annualized. This is well short of the                       disposable income.
struction by 1% or more of total households                      precrisis peak of more than 1.8 million, but                          Overall, a look at the historical data in-
every year. Coventry, Luton and Oxford are                       approximately the same as the estimated                           dicates that before the June 23 referendum,
three other urban districts where residential                    1997-2005 average before the U.K. mortgage                        the U.K. housing market was not likely to tip
construction has fallen critically short; the                    lending bubble pushed up sales volume.14                          over into a house price correction. In the first
downtown districts of Birmingham, Liverpool                          Second, despite prolonged austerity poli-                     place, only London and the South East were
and Manchester have also fallen short of                         cies by the government that have slowed                           overvalued in price versus income terms.
construction, though not as severely.                            growth since 2011, the U.K. seems to be                           High wealth and capital inflows into Lon-
    By way of contrast, the green districts,                     close to potential full employment. The                           don’s global financial center seem to readily
where construction has exceeded household                        unemployment rate is close to its prereces-                       explain this imbalance. Second, HomeLet
formations, are all in relatively rural dis-                     sion low and the ratio of employment to                           data indicate that far from squeezing out
tricts concentrated mostly in the northern,                      the 15 to 64 age cohort population was                            purchase demand, rising rents in London
                                                                 above its precrisis peak at the end of last                       and the South East are tipping the rent ver-
12 The four missing districts are Bedford, Durham, North         year. While unemployment rates in Greater                         sus buy calculation in favor of purchasing
   Cornwall, and Isles of Scilly.
13 This measure should be used with caution as it involves
                                                                 London are slightly higher than the U.K. av-                      a home, though household balance sheet
   an incomplete estimate of housing demand. In addition         erage, Birmingham is the only other densely                       considerations may play a role in dampening
   to household formations, the demand for new homes also
   includes changes in the stock of homes held for vacation or
                                                                                                                                   potential demand. Third, there is no indica-
   other part-time uses, as well as the share of the dwelling    14 We estimate transactions totals from before 2005 by com-       tion that the fall in the vacant share of the
   stock that becomes obsolete or otherwise unfit for habita-       paring HM Revenue and Customs data for the U.K. with
   tion each year. Regional U.K. data for these totals are not      Land Registry sales totals for England and Wales; the latter
                                                                                                                                   U.K. housing stock is reversing itself, which
   available to Moody’s Analytics.                                  series goes back to 1995.                                      points to incipient price pressures, especially

6     August 2016
MOODY’S ANALYTICS
in London but also to a lesser extent in the slow down if there is fear that the EU might Exit From the EU: Potential Outcomes”.16 A
large northwestern districts of Birmingham, lay down barriers to the purchase of London very brief description suffices. In the Brexit
Coventry, Liverpool and Manchester. Overall, financial services by EU residents, leading baseline scenario (55% probability), which
there is some indication that the housing to a possible fall in the value of the pound will also underlie future baseline forecasts
market is overheating, but this seems to be and inflation pressure, to which the Bank of unless conditions change substantially, the
entirely for reasons of insufficient supply England might react with monetary tighten- U.K. is able to secure a flexible trade agree-
rather than of demand being pushed beyond ing, with adverse effects on mortgage lend- ment involving continued membership in
reasonable bounds, unless one counts wealth ing. Even without higher mortgage rates, a the European Economic Area, making its
inflows into London. downward trend in the value of the pound relationship to the EU similar to that of
The regional housing market imbalances might well induce U.K. residents to put off Norway, and this close access to the EU also
discussed so far are all accounted for in the house purchase plans given the decline in satisfies Scotland sufficiently to prevent
U.K. house price forecast model, either di- their purchasing power for imported goods Scottish independence.
rectly in the case of incomes and unemploy- and services. In the U.K. splintering scenario (30%
ment rates or indirectly through proxies such Third, the Brexit process may have finan- probability), trade negotiations with the EU
as population density and green belt restric- cial effects that operate independently of become more protracted and the U.K. is only
tions, in the case of price-rent and supply- macroeconomic considerations. Anticipa- able to secure a bilateral free-trade agree-
demand considerations. We now turn to the tion of reduced income flows and of higher ment with the EU that stops short of full
U.K. after June 23, 2016. costs due to the need to create EU branches EEA membership. Faced with the prospect of
or subsidiaries may cause U.K. banks to more restricted access to EU markets, Scot-
After Brexit tighten lending conditions, including lower- land votes for independence.
Under normal or non-interesting circum- ing average loan-to-value ratios and raising In the partial EU fracture scenario (8%
stances, we would now present the baseline rates for higher LTV loans. Lower LTV ratios probability), the U.K. is unable to obtain a
house price forecast model results, which would hurt potential first-time homebuyers trade agreement with the EU and reverts to
would be moderate at worst or optimistic in particular. WTO trade rules. In addition to the other
at best, depending on the U.K. region under Last, there are downside risks from con- assumptions of the U.K. splintering scenario,
discussion. The June 23 referendum results fidence contagion if the Brexit process is a general fall in confidence in EU institu-
have upset this normal procedure and re- followed by a high probability of Scottish in- tions is added, so that Denmark and Sweden
quire a detour to discuss the mostly indirect dependence or by reduced continental con- have their own referendums and vote to
effects of the exit from the EU on Britain’s fidence in EU institutions. In such cases, the leave the EU by invoking Article 50 of the
housing market. possibility of increased services trade barriers Lisbon treaty.
and simultaneous flight from the pound and In the more remote euro zone crackup
Actual transmission mechanisms euro towards the dollar and other currencies scenario (2% probability), in addition to
There are few if any direct effects of Brex- might cause U.K. banks to tighten lending in the assumptions of the partial EU fracture
it on the U.K. housing market: buyers and general, leading not just to reduced hous- scenario, there is also a general loss of con-
sellers will not decide to change house price ing purchase demand but to the possibility fidence in the euro’s viability and Greece
bids, let alone to sell or purchase a house, of very low inflation or outright deflation, is forced to leave the euro zone after there
just by looking at the June 24 headlines. which would make a U.K. housing downturn is insufficient support for another Greek
But a quick summary of the indirect effects part of a general European-wide downturn.15 debt bailout.
are in order. First, there would be political Last, the upside Brexit rejection sce-
uncertainty related to U.K. party leadership Rolling the dice nario (5% probability) assumes that as the
and a possible general election or Scottish In response to the results of the June 23 economic costs of invoking Article 50 start
independence referendum in the short term referendum, Moody’s Analytics has gener- to mount, a general election in Britain or
and trade/immigration negotiations with the ated five new macroeconomic scenarios a new referendum reverses the decision
EU in the long term. While such uncertainty involving the Brexit process. A discussion of to leave the EU by early 2017, helping to
might affect consumer sentiment enough all of the assumptions underlying these sce- restore confidence.
to slow down purchase demand, there is the narios is beyond the scope of this article and All of these scenarios work through a
longer-term possibility that it might also fur- is covered in detail in the June article “U.K. combination of economic shocks, but it is
ther pull down the impetus for land develop- worth keeping in mind that the effects of the
ment and residential construction. 15 For a good discussion of how these possibilities are feeding
referendum in terms of a shock to confidence
Second, economic circumstances sur- back on immediate demand, as well as a sample of realtor
confidence in the U.K., see “Post-referendum uncertainty
rounding Brexit may definitely slow down hits sentiment,” Royal Institution of Chartered Surveyors, 16 Ruth Stroppiana, Petr Zemcik, Barbara Teixeira Araujo. Re-
demand. Capital inflows into the U.K. might June 2016 U.K. Residential Market Survey. gional Financial Review, Moody’s Analytics, June 2016
7 August 2016MOODY’S ANALYTICS
Table 1: U.K. Macroeconomic Forecasts for the Brexit Scenarios
2015 2016E 2017F 2018F 2019F 2020F 2021F
Real per capita disposable income, % change
Pre-Brexit baseline 2.9 2.8 0.8 0.9 1.2 1.4 1.5
Brexit baseline 2.9 2.3 0.2 0.8 0.7 0.9 1.2
Reject Brexit 2.9 2.4 0.5 1.2 1.2 1.1 1.2
Brexit: U.K. splintering 2.9 2.3 -0.9 -0.1 0.6 1.1 1.2
Brexit: Partial EU fracture 2.9 2.3 -1.1 -0.9 0.1 0.9 1.1
Brexit: Euro zone crackup 2.9 2.3 -1.3 -1.4 -0.5 0.5 0.8
Personal consumption deflator, % change
Pre-Brexit baseline 0.2 1.2 2.0 2.0 1.8 1.8 1.7
Brexit baseline 0.2 1.0 1.1 1.2 1.7 1.9 1.9
Reject Brexit 0.2 1.0 1.5 2.0 2.1 2.0 2.0
Brexit: U.K. splintering 0.2 1.0 0.6 0.6 1.3 1.8 1.9
Brexit: Partial EU fracture 0.2 1.0 0.4 0.1 0.3 1.1 1.7
Brexit: Euro zone crackup 0.2 1.0 0.3 -0.2 -0.3 0.8 1.7
Variable mortgage rate, %
Pre-Brexit baseline 4.51 4.45 4.14 4.00 4.02 4.19 4.42
Brexit baseline 4.51 4.63 4.59 4.60 4.72 4.77 4.84
Reject Brexit 4.51 4.63 4.63 4.85 5.28 5.57 5.77
Brexit: U.K. splintering 4.51 4.62 4.51 4.49 4.61 4.61 4.62
Brexit: Partial EU fracture 4.51 4.62 4.54 4.53 4.63 4.64 4.57
Brexit: Euro zone crackup 4.51 4.62 4.55 4.55 4.66 4.66 4.60
Unemployment rate, %
Pre-Brexit baseline 5.4 5.1 5.5 5.9 6.1 6.1 6.1
Brexit baseline 5.4 5.1 5.3 5.5 5.6 5.6 5.7
Reject Brexit 5.4 5.1 5.1 5.0 5.0 5.0 5.1
Brexit: U.K. splintering 5.4 5.1 5.4 5.9 6.2 6.2 6.2
Brexit: Partial EU fracture 5.4 5.1 5.4 6.1 6.7 6.7 6.5
Brexit: Euro zone crackup 5.4 5.1 5.5 6.2 7.1 7.3 7.1
Capital inflows, % of GDP *
Pre-Brexit baseline 5.2 6.2 5.9 5.5 5.0 4.5 4.1
Brexit baseline 5.2 3.7 3.2 3.0 2.6 2.2 1.9
Reject Brexit 5.2 3.7 3.0 2.7 2.2 1.8 1.5
Brexit: U.K. splintering 5.2 3.7 3.3 3.3 2.9 2.5 2.2
Brexit: Partial EU fracture 5.2 3.7 3.3 3.4 3.0 2.7 2.4
Brexit: Euro zone crackup 5.2 3.7 3.4 3.5 3.3 2.9 2.5
* For simplicity, capital inflows are assumed to be the inverse of the U.K. current account balance, ignoring central bank and other official settlement transactions.
Sources: ONS, Bank of England, Moodys’ Analytics
and expectations are already working them- tering scenario makes only a minor dent per capita income, house price growth will
selves out, so economic outcomes through in income. be equal to growth of the U.K. personal con-
early 2017 are likely to be similar for all Second, all five Brexit scenarios involve sumption expenditure deflator.
five scenarios. lower consumer price inflation than the pre- Third, the variable mortgage rate is the
There are four important effects of the Brexit baseline, though only the most severe most important driver of house prices out-
Brexit scenarios on the macroeconomic scenario—the euro zone crackup— involves side of error correction dynamics. However,
outcomes that drive the U.K. housing a brief period of deflation. As shown in the through 2020 there is little difference in
market (see Table 1). First, per capita dis- Moody’s Analytics U.K. house price forecast the mortgage rate for the Brexit baseline
posable income only slows, but does not model, consumer price inflation is the “neu- or any of the downside scenarios; only the
decline, in the baseline and upside Brexit tral” driver of house price growth: If all other Brexit reject scenario has a pronounced
rejection scenarios. Even the U.K. splin- drivers remain unchanged, especially real rise in mortgage rates, the result of tighter
8 August 2016MOODY’S ANALYTICS
Table 2: House Price Dynamics, by NUTS1 Region, Brexit Baseline Forecast
House price growth, Deviation from Trend house price House price growth
% q/q, 2016Q1 trend price, %, 2016Q1 growth, % y/y, 2017Q1 forecast, % y/y, 2017Q1
United Kingdom 2.6 NA * NA* 1.2
East Midlands 1.9 14.5 1.0 -1.3
Eastern 3.2 16.3 2.1 0.3
London 3.6 20.9 3.5 -0.4
North East 0.6 -1.5 0.7 0.4
Northern Ireland 2.0 -12.6 1.6 2.5
North West 0.8 7.2 1.2 -1.3
Scotland 0.3 -5.7 2.3 1.3
South East 2.9 10.3 2.3 2.7
South West 2.6 8.7 1.7 -0.0
Wales 1.6 5.8 1.6 0.0
West Midlands 1.2 15.6 0.5 -2.7
Yorkshire and The Humber 1.0 11.9 0.9 -2.7
* No U.K. deviation, as national ONS house price equation does not include a trend price.
Sources: ONS, Moody’s Analytics
monetary policy in order to stave off a house are significant periods of overvaluation in the in Table 2—indicates house price overvalu-
price bubble. The pre-Brexit baseline had as- early 1990s and in 2003-2008, the national ation and resulting downward drag in coming
sumed that continued weakness in the euro ONS price index is now nearly in balance quarters; conversely, a high negative devia-
zone would force the Bank of England to relative to the long-term trend implied by tion such as for Northern Ireland indicates
keep short-term rates low and thus allowed economic and demographic fundamentals. undervaluation and upward price push in
for mortgage rates to stay low. On average for most U.K. regions, near-term the short term due to a larger quantity of
Fourth, the three downside scenarios changes to house prices will thus come from opportunistic purchases.
incorporate the structural break in the na- external shocks rather than from internal The third column in each table shows
tional aggregates due to the assumption house price dynamics. the year-over-year growth rate of the trend
of a 2019 Scottish departure from the U.K. Keeping in mind that national house house price forecast; that is, the house price
This is evident, for example, in the forecast prices are currently correctly valued on av- corresponding to correctly valued housing
for capital inflows as a % of GDP, which falls erage, we can now turn to the short-term given the income, inflation and population
significantly in 2019 for the three downside subnational forecast for the NUTS 1, NUTS 2 growth fundamentals for each subnational
scenarios as Scotland pulls in its own foreign and NUTS 3 regions (see Tables 2, 3, and 4). geography. This is the main internal forecast
capital. A structural break can also be seen in The first column in each table presents the driver, in addition to external economic
the unemployment rate. quarterly house price gain in the first quarter shocks as proxied by changes in the variable
of 2016, which will affect the short-term mortgage rate, the local unemployment rate,
Brexit baseline outcomes house price forecast
In examining the Brexit baseline forecast through persistence Chart 13: House Prices Are Close to Balanced
for the U.K. macroeconomy, we first look or inertia effects as U.K. house price dynamics through 2016Q1
at the current national house price trend to defined in the U.K. 300 40
House price, %
see how it will affect house price outcomes house price forecast 250 above trend (R) 30
in each scenario. For reference purposes, we model. Similarly, the 20
apply the same error correction model that is second column in 200 Trend house 10
used for the Halifax House Price Index in the each table shows the price, £ ths (L)
150 0
U.K. house price forecast model to the ONS percentage deviation
-10
house price index, with approximately the from trend for each 100
-20
same results (see Chart 13).17 Though there region in the first
50
quarter of 2016. A Actual house price, £ ths (L) -30
17 We include Chart 13 to illustrate the point that the U.K. high positive devia- 0 -40
house price forecast at national or subnational levels will 81 84 87 90 93 96 99 02 05 08 11 14
not change due to the impending transition from using the
tion—for example,
Sources: ONS, Moody’s Analytics
Halifax to the ONS national house price time series. see Greater London
13
9 August 2016MOODY’S ANALYTICS
Table 3: House Price Dynamics, by NUTS2 Region, Brexit Baseline Forecast
House price Deviation from Trend house price House price
growth, % q/q, trend price, %, growth, % y/y, growth forecast,
2016Q1 2016Q1 2017Q1 % y/y, 2017Q1
England and Wales 2.3 NA * NA* 2.9
East Anglia 2.4 -0.0 2.5 6.2
Bedfordshire, Hertfordshire 4.2 25.2 1.0 5.2
Berkshire, Bucks and Oxfordshire 3.7 17.9 1.6 6.2
Cheshire 1.0 -6.8 1.5 2.9
Cumbria 1.8 -19.2 3.3 7.3
Cornwall and Isles of Scilly 0.3 -8.6 2.4 1.9
Dorset and Somerset 0.7 -0.8 1.8 2.5
Derbyshire and Nottinghamshire 1.5 -0.4 1.0 4.2
Devon 2.1 -4.3 2.4 4.7
East Wales 0.2 -7.7 1.6 5.2
Essex 3.0 17.9 1.1 4.3
Greater Manchester 1.8 8.8 0.2 2.4
Gloucestershire, Wiltshire and Bristol/Bath area
2.3 16.4 0.9 3.9
(formerly Gloucestershire, Wiltshire and North Somerset)
Hampshire and Isle of Wight 2.4 0.9 2.1 6.7
Inner London 3.0 11.0 5.4 2.2
Kent 3.5 6.3 2.0 7.4
Lancashire 1.9 -15.1 1.8 5.8
Lincolnshire 1.5 -4.3 2.1 5.2
Leicestershire, Rutland and Northants 1.8 10.5 0.7 4.0
Merseyside -0.6 -11.8 1.3 1.7
North Yorkshire 0.9 -2.4 2.5 2.5
Northumberland, Tyne and Wear -0.5 -15.1 0.9 5.7
Outer London 4.8 28.1 1.4 4.9
East Yorkshire and Northern Lincolnshire 2.4 -4.9 1.4 4.1
Shropshire and Staffordshire 1.3 -4.4 1.6 3.0
Surrey, East and West Sussex 3.0 15.4 1.8 5.4
South Yorkshire 0.4 1.1 0.5 1.2
Tees Valley and Durham -1.8 -22.5 0.6 4.9
West Midlands 1.1 13.8 -0.5 1.4
West Yorkshire 0.2 1.7 0.4 1.8
West Wales and The Valleys 0.3 -9.9 1.5 5.9
Herefordshire, Worcestershire and Warks 0.6 -0.7 1.6 3.1
* No U.K. deviation, as England/Wales Land Registry house price model does not include a trend price determined by
fundamentals.
Sources: Land Registry, Moody’s Analytics
and capital inflows to the southern regions. London NUTS 1 region, which should be of Leeds. Similarly, the slight decline in the
The fourth column in each table shows year- no surprise given the current overvaluation broad London NUTS 1 region corresponds to
over-year house price growth in the first of the area’s house prices. In addition, the falling prices in the more granular West In-
quarter of 2017, by which time the U.K. will West Midlands and Yorkshire/Humber NUTS ner London NUTS 3 area. However, it must
have invoked Article 50 in the Brexit time- 1 regions do poorly as well, not just because be kept in mind that different price indexes
line, but the effects of Brexit itself will only they start out overvalued but also because are used for the two geographic levels, so
have started to play out. they do not benefit from the capital flows there is no strict requirement for consistency
Several trends can be identified from that add upward pressure to London and the between Charts 14 and 15, given the differ-
maps showing the 2016Q1 to 2017Q1 fore- surrounding areas. ent methodologies of the ONS and Land
cast of house prices for the NUTS 1 and Most of the downward push in the West Registry indexes.
NUTS 3 regions (see Charts 14 and 15). Midlands and Yorkshire/Humber come from To summarize, there will be weak to
There is a minor house price correction in the falling prices in Coventry, Bradford and moderate house price declines in London
10 August 2016MOODY’S ANALYTICS
Table 4: House Price Dynamics, by NUTS3 Region, Brexit Baseline Forecast
House price Deviation from Trend house House price
growth, % q/q, trend price, %, price growth, growth forecast,
2016Q1 2016Q1 % y/y, 2017Q1 % y/y, 2017Q1
England and Wales 2.3 NA * NA * 2.9
Buckinghamshire CC 2.6 17.8 1.5 6.0
Blackburn with Darwen -4.7 -13.7 0.9 -2.1
Barnsley, Doncaster and Rotherham 1.9 -10.6 1.2 3.8
Bedford 3.9 10.4 1.5 7.6
Brighton and Hove 2.3 37.0 0.6 0.9
Birmingham 2.0 9.5 -0.4 2.1
Blackpool -7.1 -16.7 0.1 -4.2
Bridgend and Neath Port Talbot 4.3 5.3 0.4 10.2
Bournemouth and Poole 3.4 12.9 0.4 1.5
Bradford -1.0 1.8 -0.3 -0.6
City of Bristol 4.6 29.5 0.8 5.9
Berkshire 3.3 25.4 1.0 6.3
Central Bedfordshire 4.0 22.2 0.6 6.2
Conwy and Denbighshire -1.4 -9.1 1.4 0.7
Cheshire East Unitary Authority 1.8 -4.8 1.3 2.9
Cornwall and Isles of Scilly 0.3 -10.8 2.5 1.9
Calderdale and Kirklees -0.2 -2.3 0.7 1.4
Cambridgeshire CC 2.6 12.7 2.0 4.7
Coventry 2.0 22.2 -1.5 -1.4
Central Valleys 1.3 -12.1 1.2 5.7
Cardiff and Vale of Glamorgan 1.5 -1.8 1.4 4.6
Cheshire West and Chester (Unitary Authority) 2.1 -8.4 1.8 5.1
Darlington -3.4 -13.0 -0.8 0.8
Derby 3.1 17.8 -0.7 2.5
Durham CC -3.1 -23.3 0.2 3.6
Dorset CC 0.3 -9.9 2.8 1.8
Dudley 0.6 -3.8 1.3 1.8
Devon CC 1.9 -4.1 2.5 4.6
East Cumbria 1.8 -16.1 3.1 6.7
East Derbyshire 1.1 1.5 0.3 2.7
East Merseyside -1.8 -22.0 2.0 1.5
East Riding of Yorkshire 0.9 -7.2 2.5 6.5
East Sussex CC 2.3 -5.2 3.3 7.4
Essex CC 2.5 20.5 0.8 3.2
Flintshire and Wrexham -0.3 -4.5 0.8 3.2
Gloucestershire -0.5 -5.3 2.3 2.8
Greater Manchester North 0.7 -0.7 0.1 0.7
Greater Manchester South 2.9 10.0 0.5 3.7
Gwynedd 3.1 -7.3 2.2 5.5
Gwent Valleys 4.4 1.5 0.1 5.1
Herefordshire -3.3 -22.0 3.5 1.5
Hertfordshire 3.4 30.6 0.6 4.0
Hampshire CC 3.0 0.9 2.3 8.1
Hartlepool and Stockton 0.2 -22.5 1.6 9.8
Isle of Anglesey 0.3 -14.4 4.0 10.8
Inner London - East 5.5 14.5 5.2 3.5
Inner London - West 0.4 15.5 5.3 -0.6
Isle of Wight 0.8 -24.0 4.6 6.6
Kent CC 3.3 7.0 1.9 7.2
City of Kingston upon Hull -1.3 -4.8 0.1 1.9
Lancashire CC 2.4 -16.3 2.1 7.9
Leeds 0.9 1.6 0.5 2.3
Leicester City 4.4 37.0 -2.2 2.0
11 August 2016MOODY’S ANALYTICS
Table 4: House Price Dynamics, by NUTS3 Region, Brexit Baseline Forecast (Cont.)
House price Deviation from Trend house House price
growth, % q/q, trend price, %, price growth, growth forecast,
2016Q1 2016Q1 % y/y, 2017Q1 % y/y, 2017Q1
Lincolnshire 1.5 -5.2 2.1 5.2
Liverpool -0.8 -10.5 0.9 -0.7
Leicester CC and Rutland 0.5 7.6 0.7 2.3
Luton 7.1 41.4 -1.5 8.7
Medway Towns 4.5 17.8 1.1 9.0
Milton Keynes 3.0 5.8 2.1 7.7
Monmouthshire and Newport 3.4 -9.1 1.5 8.6
North and North East Lincolnshire 0.3 -4.2 1.1 3.3
Bath and North East Somerset, North Somerset and South Gloucestershire
1.3 15.0 1.2 2.6
(formerly North and North East Somerset, South Gloucestershire)
Northumberland 1.2 -25.0 2.5 7.9
North Nottinghamshire 0.6 -4.2 1.1 2.9
North Northamptonshire 2.9 8.2 1.4 6.1
Norfolk 2.9 -5.5 2.8 8.4
Nottingham 4.1 16.7 -1.5 5.6
North Yorkshire CC 0.2 -14.1 3.5 3.2
Outer London - East and North East 5.6 36.2 0.4 5.0
Outer London - South 3.2 26.3 1.7 2.5
Outer London - West and North West 5.8 27.4 1.5 6.4
Oxfordshire 3.6 21.0 1.3 5.6
Peterborough 2.8 10.6 -0.2 4.3
Plymouth -0.6 -10.1 2.3 0.9
Portsmouth 1.9 16.1 -0.4 3.6
Powys -3.4 -30.3 4.3 6.1
Sandwell 1.8 8.1 -0.3 3.4
Sefton 1.1 -9.8 2.0 5.3
Suffolk 0.6 -4.6 2.8 5.5
Sheffield -1.0 16.3 -0.4 -2.5
Somerset 2.3 -11.0 2.6 3.6
South Nottinghamshire 0.6 -3.0 1.3 2.8
Solihull 3.2 13.1 -0.3 1.5
Southend-on-Sea 5.9 27.3 -0.4 6.3
Southampton -0.2 6.2 0.7 1.9
Shropshire CC 1.5 -19.8 3.7 6.0
Surrey 4.4 18.4 1.7 6.1
South Teeside -0.4 -19.8 0.7 3.9
Staffordshire CC -0.9 -2.7 1.0 1.2
Stoke-on-Trent -3.4 -12.4 1.5 1.7
Sunderland 2.2 -23.7 1.0 9.5
Swansea 3.2 3.7 -0.3 5.5
South and West Derbyshire 1.1 -20.0 3.7 7.1
Swindon 5.9 26.6 -1.3 7.4
South West Wales -1.0 -27.7 4.3 5.9
Thurrock 6.3 13.2 1.8 11.2
Torbay 5.1 -14.4 3.5 12.5
Tyneside -1.8 -8.6 0.2 3.6
Wakefield 2.0 -6.1 1.1 5.3
Walsall 1.1 8.6 -0.7 -0.4
West Cumbria 1.8 -22.0 3.8 8.0
Wirral -1.6 -3.5 0.7 2.8
Wiltshire CC 1.1 2.5 1.1 3.5
West Northamptonshire 2.9 3.0 1.8 7.1
Wolverhampton 0.8 7.0 -0.5 1.1
Worcestershire 2.7 0.8 1.4 4.3
12 August 2016MOODY’S ANALYTICS
Table 4: House Price Dynamics, by NUTS3 Region, Brexit Baseline Forecast (Cont.)
House price Deviation from Trend house House price
growth, % q/q, trend price, %, price growth, growth forecast,
2016Q1 2016Q1 % y/y, 2017Q1 % y/y, 2017Q1
The Wrekin 5.0 -6.5 2.1 8.8
Warrington Unitary Authority -2.8 -11.7 1.6 -0.9
West Sussex 3.1 17.6 1.2 4.8
Warwickshire 0.3 -0.9 1.6 2.3
York 2.5 22.0 0.1 0.6
* No U.K. deviation, as England/Wales Land Registry house price model does not include a trend price determined by fundamentals.
Sources: Land Registry, Moody’s Analytics
Chart 14: Correction for Yorkshire, West Midlands Chart 15: Correction Also for Northeast Cities
Avg house price, % change yr ago, 2017Q1, Brexit baseline Avg house price, % change yr ago, 2017Q1, Brexit baseline
England and
Wales=2.9
U.K.=1.2
1.4 to 2.7 7 to 12
0 to 1.3 3 to 6.9
-1.3 to -0.1 0 to 2.9
-2.7 to -1.4 -4.2 to -0.1
Sources: ONS (NUTS 1 regions), Moody’s Analytics Sources: Land Registry (NUTS 3 regions), Moody’s Analytics
14 15
and in the broad center and southwest of with the last three alternatives involving well as Scotland, Wales and Northern Ireland
the U.K. By contrast, Scotland, Northern additional downward pressure from falling (see Chart 17).19
Ireland, Wales, and the two southeastern income and rising unemployment due to In the milder U.K. splintering scenario
regions will record weak to moderate price trade restrictions, monetary tightening, a there is a substantial amount of regional
growth, making average U.K. house price general loss of confidence in political insti- variation, with the northern parts of the
growth weakly positive, though substantial- tutions, and a resulting decline in spending. U.K. still having positive house price
ly slower than in the previous year.18 Also, The U.K. splintering scenario involves a growth. These better outcomes are due to
most of the downward shocks to house shallow house price trough with recovery a combination of (a) strong starting un-
prices in the baseline scenario occur during starting in mid-2018 (see Chart 16). The dervaluation in Northern Ireland, Scotland
the year immediately following the June 23 two EU crisis scenarios involve deeper and Liverpool, which gives their prices an
referendum, after which U.K. house prices troughs in which recovery would not start upward push that offsets macroeconomic
in most regions start to rise and converge to before 2020. By contrast, a rejection of shocks (b) green belt zoning restrictions in
trend beyond 2017. Brexit in a subsequent referendum or gen- the Leeds and Liverpool metro areas, which
eral election would lead to slightly faster keep supply short and act to reduce the
Downside risks house price growth than the Brexit baseline, fall in house prices as economic shocks hit
The scenario alternatives to the Brexit though still slower than that predicted be- the region. Finally, regional asymmetries
baseline add additional longer-term shocks, fore June 23. remain pronounced in the forecast as in the
To avoid a protracted discussion of each historical data.
18 Also, the lag effect of ONS and Land Registry prices relative
to Halifax house prices is modeled in the national forecast
scenario’s results, we summarize the results
as weakly positive y/y house price growth for the ONS of two of the downside scenarios—U.K. splin- 19 Scenario forecast series for the U.K. and all of the NUTS 1,
and Land Registry indexes in 2017Q1, whereas house price NUTS 2, and NUTS 3 areas shown in Tables 2-4 are avail-
growth for the Halifax national index is slightly negative in
tering and partial EU fracture—focusing on able from Moody’s Analytics through its DataBuffet online
2017Q1. the five largest metro areas of England, as interface.
13 August 2016MOODY’S ANALYTICS
Chart 16: Possibilities Range From Mild to Awful Chart 17: Less Downside Risk for Scotland
Cumulative % change in house price levels Cumulative % change in house price levels
United Kingdom Wales
Pre-Brexit baseline, 2017Q1
(ONS) Birmingham
Reject Brexit, 2017Q1 England and United Kingdom
Wales (Land London
Baseline, 2017Q1 Registry)
Manchester
U.K. splintering, 2018Q1 trough Scotland
Leeds
Partial EU fracture, 2019Q3 trough
Liverpool
U.K. splintering, 2016Q1-2018Q1
Euro zone crackup, 2020Q1 trough Northern Ireland EU fracture, 2016Q1-2019Q3
-20 -16 -12 -8 -4 0 4 8 -15 -12 -9 -6 -3 0 3
Sources: Land Registry (metro areas), ONS(U.K., NUTS 1 regions), Moody’s Analytics Sources: Land Registry (metro areas), ONS(U.K., NUTS 1 regions), Moody’s Analytics
16 17
Chart 18: London Still Comes Out Ahead… Chart 19: …And the City Hardly Breaks a Sweat…
Land Registry: Greater London avg house price, £ ths Land Registry: West Inner London avg house price, GBP mil
950 1.7
Pre-Brexit Baseline Pre-Brexit Baseline
850 Brexit: Baseline 1.5 Reject Brexit
Reject Brexit Brexit: Baseline
750 Brexit: U.K. splintering 1.3 Brexit: U.K. splintering
Brexit: Partial EU fracture Brexit: Partial EU fracture
650 Brexit: Euro zone crackup 1.1 Brexit: Euro zone crackup
History History
550 0.9
450 0.7
350 0.5
250 0.3
07 09 11 13 15 17F 19F 21F 23F 25F 08 10 12 14 16E 18F 20F 22F 24F
Sources: ONS, Moody’s Analytics Sources: Land Registry, Moody’s Analytics
18 19
In the partial EU fracture scenario, the not eliminate all of the house price gains undervalued relative to their long-term
Birmingham, London and Manchester metro from 2009 to 2016, and only in the worst trend, which will give some upward push to
areas have current-to-trough house price downside scenario do house prices fail to the country over the coming years. In addi-
declines much deeper than the England and regain the 2016 peak by 2025.20 West Inner tion there is the possibility that there will
Wales average; this is accompanied by house London, which includes the City of London, be less of a loss to incomes in the downside
price declines in other subnational regions is more resilient and goes through only a scenarios in which Scotland separates from
that are significantly shallower than the Eng- 15% house price decline in the worst-case the U.K. and obtains a better EU trade ar-
land/Wales average. scenario (see Chart 19). Subsequently, the rangement. As a result, Scotland has only an
A glimpse at the full range of possibilities resumption of capital inflows and the end 11% current-to-trough decline even in the
in the scenarios and their long-term effects of uncertainty over EU negotiations will euro zone crackup scenario, and in the U.K.
can be seen in the scenario results for the give West Inner London a fairly strong rate splintering scenario, its house prices do not
Greater London metropolitan area, the West of house price growth, if not as fast as the decline (see Chart 20). However, Scotland
Inner London NUTS 3 area, and Scotland. 2012-2014 rate of growth. does have slower income and demographic
The Greater London metro area has vary- Scotland presents an interesting con- dynamics than the U.K. average, so its recov-
ing ranges of overvaluation and will have trast. Current house prices in Scotland are ery in any downside scenario will probably be
deeper current-trough declines than the U.K. slower and the long-term range of outcomes
20 Note that the Greater London metro area has different
average for the downside scenarios, with the boundaries than the London NUTS 1 region, so both the
more dispersed.
worst scenario (euro zone crackup) having historical price series data and forecasts are different for
a peak-to-trough decline of more than 20% these two geographies. Also, the methodological differ- Conclusion
ences between the ONS and Land Registry indexes are
(see Chart 18). However, London’s economic captured quantitatively in the forecast model and result in In general, the levels of confidence
the Land Registry London metro area house price forecast
dynamism and positive demographics mean being slightly different than the ONS NUTS 1 London
among consumers and mortgage lenders
that even the worst downside scenario does house price forecast. drive the pace of housing market, as de-
14 August 2016You can also read