Mail.ru Group - Quarterly presentation (Q1 2020)
←
→
Page content transcription
If your browser does not render page correctly, please read the page content below

Mail.ru Group

Quarterly presentation (Q1 2020)
COVID-19 impacts across revenue lines in Q1
Adverse impact started in mid-March, with more pronounced negative effect so far in 2Q
Impacts vary significantly by sector. Some of the worst hit verticals include: apparel/fashion, auto, luxury goods, travel,
tourism, restaurants, entertainment. Other verticals have been relatively resilient or growing, including health and medicine,
telco, dating, media services, eCommerce, Games, FMCG
SMEs are generally most impacted, but we have relatively low exposure, at below 25% of advertising revenue
Online Advertising
Performance is holding up better than branded ads, with the vast majority of our ad revenues coming from performance
(42% of 2019 revenues)
formats
We do not have significant advertising revenue concentration. Our largest verticals are FMCG and eCommerce, which
have been relatively resilient. All other verticals account for less than 10% of total ad revenues each
Although rising engagement leads to temporary adverse impact on CPMs and ad efficiency, we continue enhancing our
advertising technologies to be able to continue to grow ad market share in a normalized macro environment
Being a purely online business, gaming has been among relative beneficiaries from COVID-19, with Gaming the largest
entertainment segment globally
Since the back end of March we started to see positive impact from stay-at-home behavior on DAU and CCU,
MMO Games especially in traditional home platforms like PC and Console. Trends have carried so far into 2Q
(32% of 2019 revenues) Discretionary nature of gaming could adversely impact but we are focused on F2P and mobile, which makes us relatively
well-positioned
Our global diversification (69% of revenue in Q1 was international) helps diversify macro risks and allows to benefit from
FX weakness
Segment is more resilient than advertising, with stay-at-home behavior resulting in higher online engagement, including
Community IVAS
around exchange of stickers, gifts and social games
(19% of 2019 revenues)
Music subscription services continue to see solid growth in subscriber numbers (including trials)
Edtech: as a business with marginal offline component and given the stay-at-home mode for students and teachers,
platforms have seen an increase in traffic. EdTech is now the largest revenue contributor within New Initiatives
Other B2B Cloud: enhanced digitalization of industries and move to remote work should result in higher demand
(7% of 2019 revenues) Classifieds: Business has been diversifying from advertising revenues towards listing and subscription revenue streams
across several verticals. General classifieds is the largest vertical and it tends to be more resilient in a weak macro
environment 2
Source: Internal data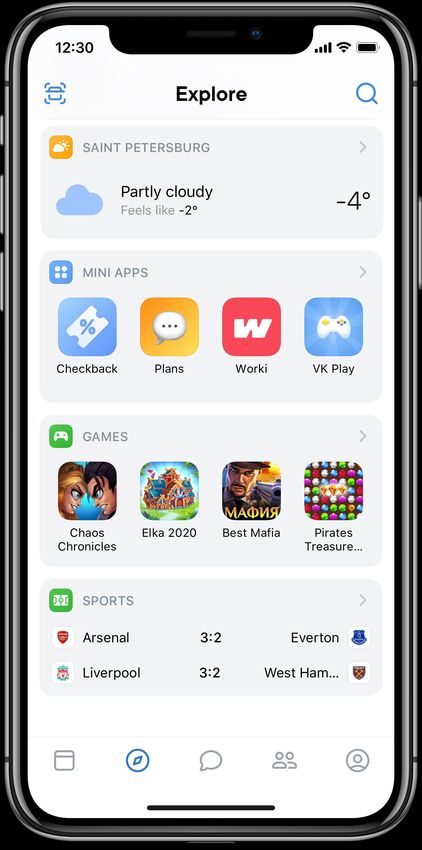
Challenging global advertising backdrop into Q2
• Advertising, including digital, is a function of GDP growth, with COVID-19 developments suggesting that 2020
  might be a reseccionary year globally
• JPM expects global Internet ad spend to decline 6% in 2020 but increase by 15% in 2021 given the anticipated
  growth recovery as lockdowns end. MS thinks that US ad market will decline by 8% in 2020, with online ads
  declining by 2% (as much as -20%+ YoY in 2Q), followed by +10% growth in 2021
• Market and company commentary from China suggests that while ads could see 10-25% YoY impact in 1Q, the ad
  market has likely bottomed in early Feb, when lockdown ended, and there are positive signs on the demand side in
  the past weeks. Hence, while 2Q could be challenging for global ad markets (ex-China), there could be at least
  partial normalization in 2H
                             Global digital advertising revenue                                                              US ad market expectations for 2020
                                                                                                         5%           2%                 3%
                              projections into 2Q (ex-China)                                             0%
                                                                                                         -5%   -2%            -1%                                                                           -1%
                                                                                                                                                                                                 -5%                                 -4%
                                                                                                        -10%     -7%            -6%                     -8%     -9%                                                           -8%
                                                                                                                                                                                                   -10%
                                                                                                        -15%                                       -12%    -13%                                                                 -13%
                                                                                                                                                                                             -14%
                                                                                                        -20%                                         -17%    -18% -18%
                                                                                                        -25%                                                        -23%                                                    -25%
                                                                                                        -30%
                                                                                                                                                                                                                 -29%
                                                                                                        -35%                 Base case                         Bear case              Bull case
                                                                                                                                                                                                                   -34%
                                                                                                        -40%

                                                                                                                                                     Outdoor

                                                                                                                                                                                                                    Print
                                                                                                                                                                                  Terrestrial Radio

                                                                                                                                                                                                                                   Total
                                                                                                                  Internet

                                                                                                                                                                    National TV
                                                                                                                                 Streaming audio

                                                                                                                                                                                                      Local TV
Source: Internal data. Barclays Research, PwC/IAB (Barclays notes that thse categories have not been broken out since 2016, but are likely similar), JP Morgan: estimates are based on a                                                   3
2.4% global GDP decline in 2020, with growth of 5% in 2021, Citibank, Jefferies, IMF, WTO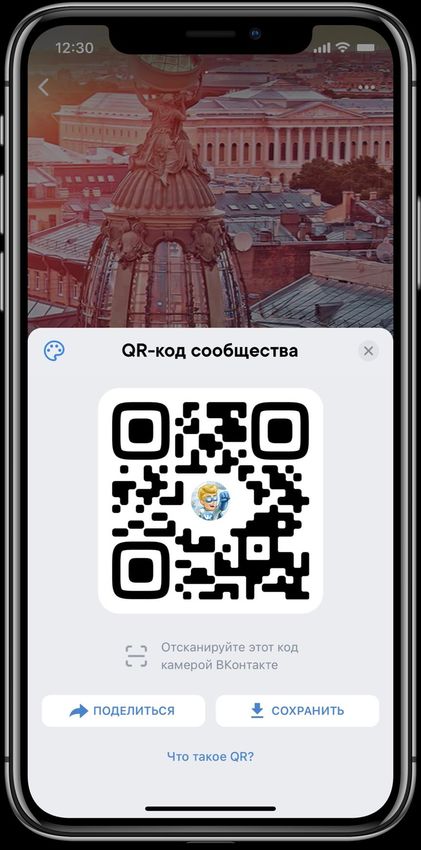
Russia is not an exception, but we are well-diversified
• Analysts estimate that each week of lockdown decreases Russian 2020 GDP growth by ~0.5%. In the past 10 years,
  Russian digital ad market has shown 0.85 correlation with GDP growth
• Digital has been the main advertising channel in Russia since 2018, accounting for >49% of ad wallet in 2019. At
  the time of 2008-09 and 2014-15 shocks digital accounted for 6-9% and 25-32% of ad market respectively. Arguably, this
  should mean even higher correlation between digital advertising and GDP growth
• Businesses saw clear headwinds during previous recessions, but the effect was over the course of many months vs.
  COVID-19 forcing an immediate widespread business shut down. However, in many cases budgets are being deferred
  rather than cancelled, and hence stabilization in COVID-19/oil leaves room for utilization of these budgets in 2H
• In the short-run, business diversification into more defensive revenue streams helps, with MMO Games, perceived as a
  net beneficiary from COVID-19 and related stay-at-home-behaviour, being our second largest revenue stream with a
  32% revenue share in 2019 vs 42% for online advertising
 Russian advertising market split, 2019 (RUBbn)                     Share of advertising revenues, 2019 (% of total)
                                                                          Tencent          18%

                                 175                                 Mail.ru Group                 42%

                244                                                       Yandex                               69%

                                                                            Baidu                               73%

                                                                         Alphabet                                     83%

                                                                        Facebook                                             99%
    TV     Radio    Press     Out of home      Internet
                                                                                     0%   20%    40%     60%    80%         100%
Source: Internal data. IAB Russia, AKAR, VTB Capital, Citibank                                                                     4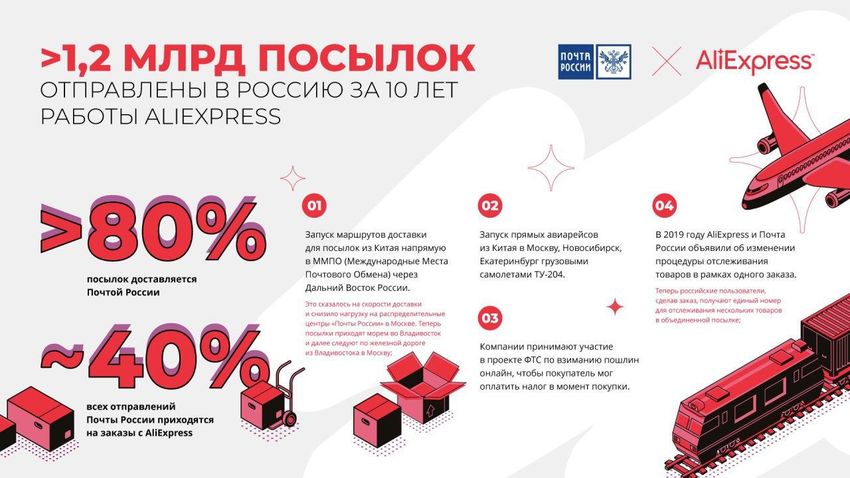
Q2 Outlook
• While the unprecedented current situation means that 2020 has started with some significant challenges, we
feel relatively well-positioned given our profitability, FCF generation capacity and well-diversified
revenue streams
Online advertising performance is expected to be weaker in Q2 vs Q1, with negative growth in our
current base case
IVAS is expected to continue to hold up better than advertising, supported by high engagement across
social games, ongoing music subscription growth as well as need for people to share emotions and
support each other through gifts and stickers while maintaining physical distance. We expects IVAS to
remain in positive territory in Q2
MMO Games are seeing support from engagement and our pipeline is on track, including planned
launch of console version of Warface in Q2. We expect an acceleration in Games revenues in Q2 vs
13.4% YoY growth in Q1, with growth of above 20% YoY seen in March
Other revenues should continue to demonstrate solid double digit growth, with EdTech being the key
area of strength (grew at triple digit rate in Q1), while this is the largest component of New Initiatives
• Although we are not yet in position to provide explicit updated guidance for the Group given lack of visibility
around the ultimate duration of lockdowns, oil/RUB trajectory, magnitude of state support, in our current
stress-test scenario, where we see return to growth in digital advertising only in 2021, we still expect 2020 to
be a solid growth year for the Group, albeit at the expense of lower profitability given the temporary shift
in revenue mix towards structurally lower-margin Games segment(1).
5
Source: Internal data 1) EBITDA margin of S&C segment was 54.1% in 2019 vs 15.7% for Games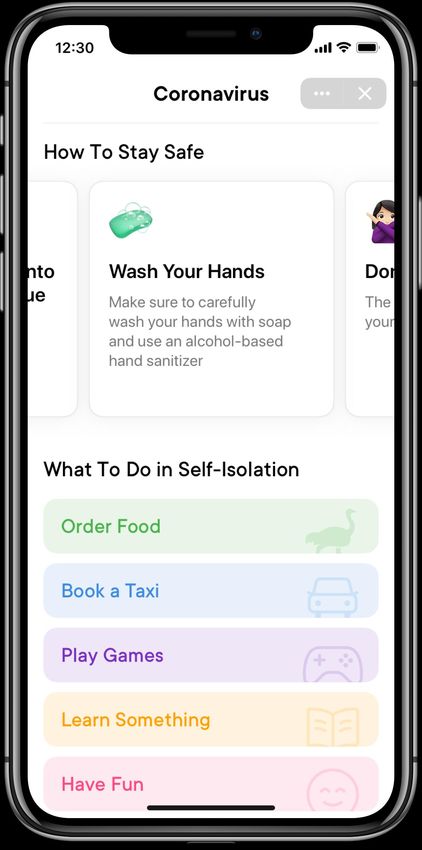
Ongoing engagement strength – basis for future revenue growth
• In the meantime, ongoing lockdowns result in more engagement across all our key platforms:
PC, being the traditional home platform for online games, is seeing the strongest positive impact on engagement so far, with
Warface growing CCU by 33% and DAU by 23% MoM on April 15. Skyforge was +55%/+49%, Conqueror’s Blade +76%/+29%
and Lost Ark +26%/+25% respectively. Mobile games are also seeing a boost, with Hustle Castle, our top-3 title, reaching a
new daily revenue record of RUB128mn on April 15
Gaming DAU on VK was +15% WoW, with OK’s mobile games audience growing 27% YoY during the first lockdown week
Our local #PlayAtHomeStandUnited Games campaign streams received 2.3mn views within three weeks, while MY.GAMES
Store saw traffic jump 25% at the end of March
During the first 9 days of April, VK saw daily calls rise by 35% vs mid-Feb, with 20% growth in messages sent, 33% rise in
video views, 48% increase in watched streams and 17% for Stories
VK Mini Apps DAU was +260% MoM during the last week of March, with a 120% increase in the number of those looking
through Mini Apps catalogue. MAU has further grown from 27.6mn in March to 28.4mn so far in April
Number of group calls on OK grew by 70% during the second half of March, with a 4x increase for calls with five+
participants. The number of sent messages increased during the first week of April by 37% YoY, with the number of confirmed
friend requests up 39.6% and video views up 28%
Geekbrains saw a 120% jump in new users, 648% spike in portal registrations and 89% growth in new paid students MoM
during the first two weeks of lockdown
Skillbox saw a 33% increase in WAU on April 12, with the share of active users rising to 21% from 17.6% and weekly
homework submissions rising by 40% MoM
DC saw a 60% spike in downloads, 33% rise in DAU and 22% increase in restaurant orders during the same period. Share
of orders from first-time users rose from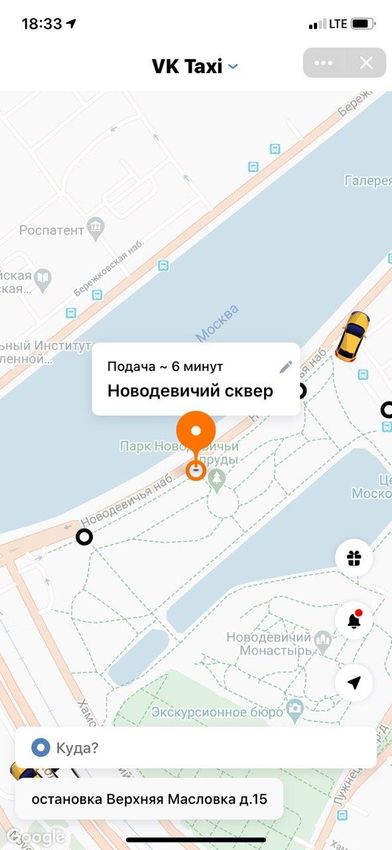
AdTech – latest results across key focus areas (1/2)
Focus area                          Recent developments                                               Key results
 SMB clients                         • New product to promote business pages in VK with easy          • The new promotion product already takes
 Goal: Growth in overall               launch from mobile                                               ~15% of budgets spent on VK’s mobile ad
 SMB presence and their              • Tools for campaign efficiency tracking:                          platform
 conversion to paying                  − Tracker of messages coming from ads to VK business           • # of SMBs paying for ads in VK increased by
 customers                               pages                                                          21% YoY in March

 Performance                         • Strategies for ad optimization:                                • >50% of advertisers interested in expanding
                                       − New goal in oCPM model – subscription to VK business           their subscriber base have switched to the new
 products                                                                                               oCPM model. Since the launch, average cost
                                         pages. The model optimizes ad impressions in such a
 Goal: improve efficiency                                                                               of a new subscriber has been reduced by
                                         way as to maximize acquisition of new subscribers while
 and increase usage of                                                                                  58%
                                         keeping the cost of subscriber within the set target
 higher value-added
                                     • Improvements in targeting algorithms & solutions:              • Overall contribution of the models with
 products
                                       − Even more sophisticated ML-based algorithm behind the          embedded optimization features continued to
                                         VK target audience suggestor interface. The algorithm          grow in Q1. Their share in ad budgets
                                         identifies similar communities and analyses their patterns     increased by 80% YoY(1)
                                         and content in order to suggest the most relevant            • Improved algorithms in VK target audience
                                         audience                                                       suggestor brought 2x increase in CTR
                                       − Contextual targeting in myTarget got additional high-        • 2.1x YoY in contextual targeting revenue vs
                                         quality sources and simplified selection of contextual         Q1 2019(1). The product is being developed on
                                         phrases                                                        the basis of search queries on MRG platforms,
                                     • New platform for in-app ads verification:                        growing with social commerce and classifieds
                                       − Third parties analytics on ad viewability metrics in MRG       evolution
                                         and within the partner networks’ mobile apps
                                                                                                                                                         7
Source: 1) myTarget and VK statistics on cash spending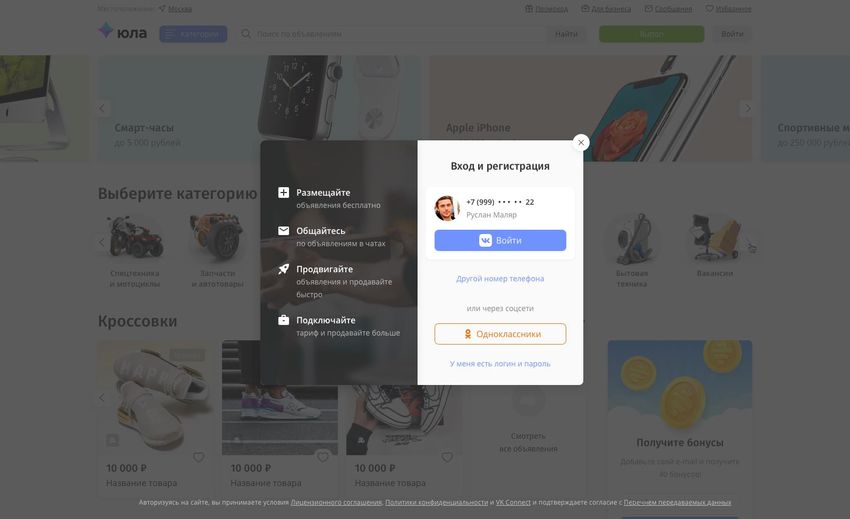
AdTech – latest results across key focus areas (2/2)
 Focus area                      Recent developments                                           Key results
  Ad network                     On the basis of myTarget platform and brand:                  •   1.3x YoY in the ad network revenue in
  Goal: Monetise ad              • Integration with one of the top-3 largest mediation             Q1’20. Its share in the total ads revenue
  inventory beyond Group’s          platforms, which allows, among other things, to display        was ~9%(1)
  assets                            myTarget ads on my.com games inventory                     •   # of partners providing ad inventory grew
                                 • Additions of several largest publishers                         1.2x YoY in March
                                 • Improvement of site quality rating system, which is
                                    used for discounting CPM rates and rebalancing traffic
                                 • SDK now supports Playable ads in rewarded video
                                    format

  OMNI-channel &                 •   Partnership with Magnit, the 2nd largest domestic         •   Results to be evaluated later as
                                     retailer, for development of marketing technologies and       partnership matures
  New products                       O2O analytics:
  Goal: Strengthen already
                                     − Deeper targeting and O2O attribution of digital ad
  leading position in brand
                                        campaigns for advertisers
  advertising by offering
                                     − Narrower customer segmentation for the retailer
  new products with cross-
  frequency reach and                − Employing the marketplace of external audience
  enter adjacent markets                segments in myTarget
  with new solutions
                                 •   Start of selling ad inventory across Delivery Club
                                     resources with O2O ad formats, including in-app
                                     advertising, and in-depth offline targeting.

Source: 1) Management accounts
                                                                                                                                               8
VK – the leading communication and entertainment
  platform in Russia and the CIS
   • VK remains a strong leader among communication platforms in Russia, with 73.4m MAU (+4% YoY),
     including 67m on mobile (+9% YoY) as of March
   • VK is focused on continuously developing new features to grow its user base,
     support engagement and increase time spent on its platform

    2006                2007            2008              2009                    2010-11              2012-13           2014-15
    VK Launch           Audio & Video   Apps Platform,    Ads Platform,           Blogging Platform,   Ad Exchange,      Stickers,
                        Platforms       Gifts             Games Platform,         News Feed,           Communities       Marketplace
                                                          International Version   Mobile App           Platform          in Communities

    2016                         2017                    2018                      2019                      YTD
    Smart Feed with Ads,         VK Music,               Voice & Video Calls,      QR Code Platform,         New Explore Section,
    Stories, VK Live,            Discover                VK Pay, VK Mini Apps      Mobile App Redesign,      New Ecommerce
    Money Transfers              Section,                Platform                  AliExpress Integration,   Platform,
                                 Ads Network                                       Advertising Account       Interactive Stickers in
                                                                                   Redesign                  Stories

Source: Internal data                                                                                                                     9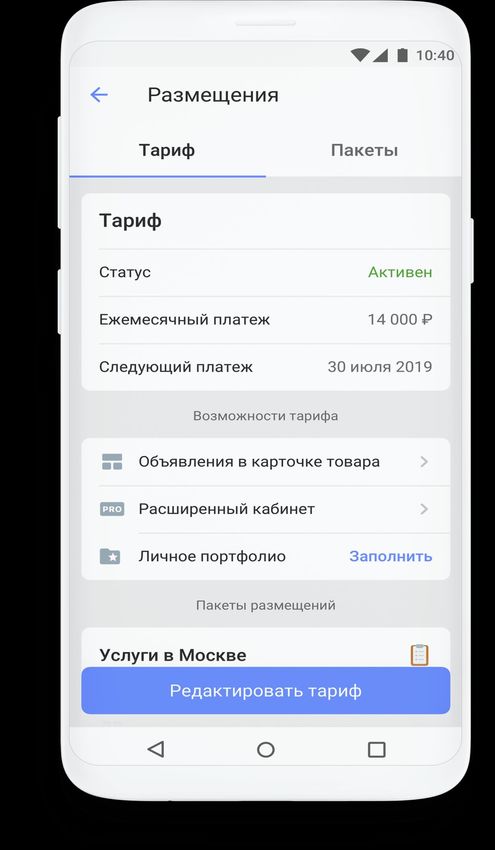
VK – user engagement and time spent growth continues

• User engagement growth continues
  to boost total time spent, +5.5% YoY
  in Q1 to 38 minutes per day,
  including 11% growth on mobile
                                                         +16%                           +24%
                                                         Stories published monthly      Video / audio calls made monthly

                                               Q1, YoY
• VK's most active user category
  remains the 12–24 year-olds, who
  spent on average 62 minutes per
  day on the social network in
  February                                               +44%                            +40%
                                                         Live streams posted daily       Messages delivered daily

COVID-19 influence on user behavior:
• Since Russia started to move into stay-at-home regime in light of COVID-19, VK started to experience an
  engagement boost (data for the first 9 days of April vs mid-February):
      • +35% in daily calls
      • +20% in messages sent
      • +33% in video views
      • +48% in live stream views
      • +17% in Story views
      • +15% in Gaming DAU                                               These behavior patterns have carried so far into Q2

 Source: Internal data                                                                                                         10
VK remains competitive in key content
consumption formats
• We are actively investing in our Stories and Video products, among others, in 2020 in order to
continue to grow engagement even after lockdown is lifted in Russia
Story Views (bn) Video Views (bn)
~4x >2x
8 23.8
10.5
2.1
Sep-17 Dec-17 Mar-18 Jun-18 Sep-18 Dec-18 Mar-19 Jun-19 Sep-19 Dec-19 Mar-20 Sep-17 Dec-17 Mar-18 Jun-18 Sep-18 Dec-18 Mar-19 Jun-19 Sep-19 Dec-19 Mar-20
Source: Internal data 11Multiple COVID-19 and other initiatives
Our goal is to support users and businesses in the
current difficult environment with a safe way to
communicate, learn, entertain and do business, while
enjoying near-term engagement and audience growth
and providing room for additional future monetization on
the back of multiple ongoing product initiatives
Outside multiple product updates, VK launched over 50 initiatives supporting
users and businesses in light of ongoing COVID-19 influences in Russia:
• Integration tools for schools, universities and businesses to be able to carry
online education and communication
• Temporary doubling of advertising budgets on SMEs’ mobile accounts on
VK and OK (until June 30)
• Limited-time special music subscription trial offer for just RUB1 (finished);
• COVID-19 information center and newsfeed, which not only offers related
newsflow, but also various discounts for online services as well as ideas about
how to productively spend quarantine, with >20mn WAU in these services
• WHO launched an official group in VK and together we issued an article about
COVID-19
• Videos of theatrical performances to celebrate the day of theatre in Russia
despite the lockdown as well as daily live concerts and reading club meetings.
A new “Watch at Home” collection was added to the Videos section
• Various flash mobs to entertain and distract users from ongoing crisis
Source: Internal data OK social network held multiple additional initiatives as well 12New version of the VK mobile app went live • New version of VK mobile app was rolled out in Q1, with changed navigation and design. Recommendations and newsfeed are now placed in first tab, followed by Mini Apps, VK Pay, Communities and streaming services, which is a reflection of focus of VK and basis for its ecosystem development in the coming years • Goal is for services to become increasingly integrated, native and personalized while covering an increasingly broad set of users’ online and offline needs with continued deep focus on communication and content • In February, the first 100,000 users were invited to rate the new version of the app after several months of using it. 71% of those who voted said they liked the new version more than the previous one Source: Internal data 13
New Explore Section – shaping up the VK Super App

                                 • VK consolidated the Super App’s key services into a new
                                   section, Explore, situated in the second tab of the app
                                 • The Explore section became the center of the
                                   extensive VK ecosystem. It helps users take care of a
                                   wide range of tasks while adapting to their interests and
                                   needs
                                 • Mini Apps take up the main part of the second tab.
                                   They allow users to do almost anything, such as buy
                                   products, order food and services, check the weather and
                                   sports match results, make salon appointments, book a
                                   table at restaurants and even play games
                                 • Some services are displayed as interactive widgets,
                                   providing useful features and the most up-to-date
                                   information. For example, there are widgets that show
                                   users their local weather or exchange rates

Source: Internal data                                                                          14
VK Mini Apps – active growth continues
The VK Mini Apps platform continues to grow: Active Mini Apps
• The number of active mini apps increased to > 15,000 in Q1, >15K
with a further increase to 16,000 in April 13.3K
• MAU rose 4x YoY to a new record of 27mn in March, with a
further increase to 31m in April
• Average DAU rose 6x YoY to 2.3mn in Q1, including 4.2K
+260% MoM growth in March, with a 120% increase in the 0.1K
number of those looking through Mini Apps catalogue
Jan-2019 Jun-2019 Dec-2019 Mar-2020
In light of COVID-19 most popular categories have
changed from “Entertainment” as top ranked, followed VK Mini Apps – MAU dynamics
by “Shopping” and then “Lifestyle” in the past to
“Lifestyle” in the lead as it includes a COVID-19 30
27M
focused Mini App visited by 1mn people daily, among
25 23M
others. Second most popular category is now
“Business”, followed by “Entertainment” 20
17M
MRG services including AliExpress, Citymobil, 15
Delivery Club, Worki are all available as mini apps, 10M
10
with further integrations to come 7M
• Platform will be scaled beyond VK this year 5
1M
0
Jan-2019 Mar-2019 Jun-2019 Sept-2019 Dec-2019 Mar-2020
Source: Internal data 15New Ecommerce Platform
• In 2019, VK ranked first in Russia in terms of B2C and C2C transactions and first among social
platforms in the percentage of purchase-making users. But we do not want to stop there
VK introduced a new ecommerce platform – “Store
2.0”
All the tools needed to start selling goods are now in
one place. To set up a store in a community, users
no longer have to enable various functions
individually
New features were introduced, such as descriptions
of product characteristics, convenient order status
tracking and quick access to Support
All settings are available in one window: from
setting up the product display and managing the
product description to selecting the currency and
shipping zones
• This is just the first step in a major update to the Store section.
In 2020, VK will create the best conditions for ecommerce on its
platform
Source: Internal data, Data Insight 16Enhancing VK’s payment offering
Payments
• VK has unified its payment solutions, with the user not
having to choose between payment methods, including
VK Pay – VK offers the most convenient and cheapest
transfer option depending on various parameters,
including the sum, card’s payment system, VK Pay
accessibility and wallet balance
• Functionality has expanded as well: transfers can be
done by just a click of a button while chatting in the
messenger inside VK or on user’s home page
• Payment history is visible within “Payment transfers”
QR Codes
• QR code usage continues to increase. In Q1, users
shared QR codes on the VK App over 113mn times, 2x
more QoQ
• Users can scan QR codes to launch mini apps, join
communities, add friends, get cashback, etc
Source: Internal data 17Music – ongoing growth in subscribers
• Our goal is to be the leader of the local music
market in terms of subscribers, with ongoing
investments into music recommendations
and other tools for listening to music
Our music offering on VK, OK and Boom has >3.5mn in
active paid and trial subscriptions, albeit with a rise
in the share of trials on the back of VK’s limited-time
special music subscription trial offer for just RUB1 in
light of COVID-19 (finished)
VK is supporting musicians by offering them a platform
on which they could start holding online concerts during
the coronavirus
OK had a limited-time special music subscription trial
offer for 3 months with a 100% cashback in the form of
“oks”, virtual currency that can be used for purchases
within OK
Music was added to our Combo loyalty program in
December, with student tariff also available
Source: Internal data 18OK — unique social
and entertainment platform Mobile DAU, Russia
• OK is one of the largest domestic social networks, with 43mn
MAU in Q1. DAU grew by 2.8% YoY, including +11% on mobile
• OK continues to differentiate itself as a communication services 2020
platform for sharing true emotions with friends and family 2019
through virtual gifts, friendship-related services, likes, calls,
stickers, postcards etc
• 41% of Russian women (32mn) received virtual gifts through OK
January February March
during Women’s Day, where 1bn gifts were exchanged over a 3-
day period. OK also registered a record of those sending stickers
during the Women’s Day holidays – 11mn people
Presents sent on OK
• Lockdown regime in Russia resulted in further engagement boost,
with OK recording a 70% increase in group voice calls over the
last two weeks of March, with a 4x increase in the number of
calls by groups of 5+
2020
2019
16 bn 460 mn 59 mn
virtual gifts stickers sent postcards
sent in Q1 in Q1 sent in Q1
January February March
Source: Internal data 19OK – focus on further engagement growth
• OK improved algorithms in recommended videos. This led to 3x
QoQ increase in total viewing duration and +80% in the number
of views of recommended videos
• OK’s video platform now also features online virtual tours to
Russia’s top museums, broadcasts of theater shows as well as
online music concerts and esports tournaments like OK Challenge.
Total daily video views reached a new record of 1 billion
• OK users have been consuming significantly more content: the
number of viewed newsfeed items has risen by 14%, number of
unique users of the Recommendation newsfeed grew by 22%,
video views increased by 28%
• OK launched several innovative services in 1Q20 to improve user
experience. OK became the first social network to integrate with
Russia’s public services portal Gosuslugi
• OK also launched new and enhanced verification tools, which
include the ability to recover user profiles using an AI-based facial
recognition technology
20
Source: Internal dataOK Games – new platform drivers
• OK is actively developing game monetization adding
in-game advertising model along with in-game
purchases. Payments to developers for in-game ads
in their games in 2019 were +3x YoY Payouts to mobile game developers
• Games became one of the services seeing higher
demand in light of COVID-19, with OK’s mobile
games audience growing 27% YoY in the first week
2x
of April
• To support players for their efforts in social distancing,
OK together with VK and MY.GAMES launched the
#PlayAtHome campaign with 200 iPhones in giveaway
prizes and other bonuses. OK also announced third YoY growth in payouts to
tournament for mobile HTML5 game developers – mobile game developers in
Games Cup 2020 together with VK and Moi Mir 2019
• Number of mobile games grew 25% YoY
2018 2019 2022E
21
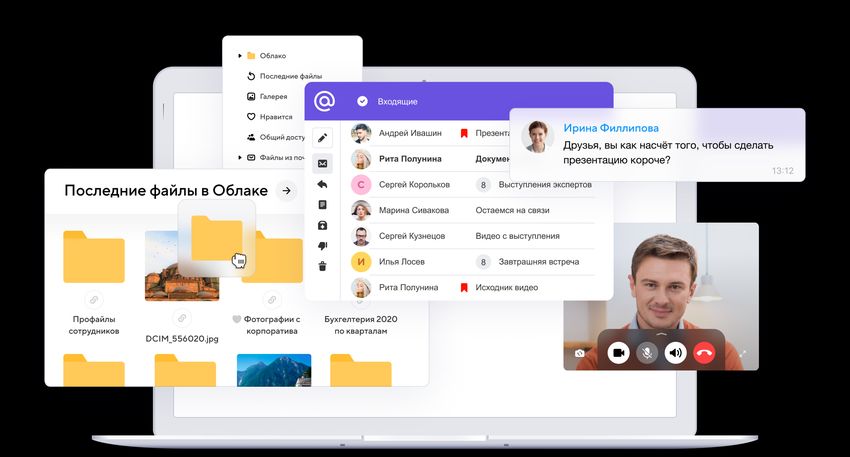
Source: Internal dataMore than just email – in the center of users’ daily life
Our e-mail service remains the largest in Russia/CIS, with e-mail usage recently stimulated by
COVID-19, with people working, studying and communicating remotely
Three major strategic focus areas remain unchanged:
• Smart
Subscription management
mn mn
Email sorting & categorization
Smart reply
• Useful
46 MAU*
29
Mobile MAU*
Payment center
Money transfers
Order tracking %
• Secure
One time code & QR logon
49
Total monthly
+8 %
Mobile MAU,
Smart antyphishing
coverage* YoY**
Active sessions & actions list
Source: *Mediascope, Web Index, Russia 0+, 12+, February 2020, **Mediascope, Web Index, Russia 100+, 12-64, February 2020 22MY.GAMES – driver of international revenues for MRG
• MRG was ranked among the top-3 European mobile app publishers in terms of revenues in 2019, being
the only Co headquartered in Russia among the top-10. This progress was driven largely by the games
segment, +26% in 2019
• Q1 growth of Games segment was 13.4% YoY (RUB 7.9bn), ahead of expected single digit growth, mainly
given FX, with engagement uptick seen in late March and revenue growth accelerating to above 20% in
March
• International gaming revenue share stood at 69%, with 66% of Q1 Games revenues coming from mobile
MRG gaming revenue, USDmn
140
120
100 43
39 32 32 33
80 32
38 37 32 31
60 30
41 33
40 38 74 80 83 74
68 66
31 53 54 57
32 27 25 25 25 51
20 30
34
45
23 27
6 6 10 12 11 13 13
0
2015 2015 2015 2015 2016 2016 2016 2016 2017 2017 2017 2017 2018 2018 2018 2018 2019 2019 2019 2019 2020
Q1 Q2 Q3 Q4 Q1 Q2 Q3 Q4 Q1 Q2 Q3 Q4 Q1 Q2 Q3 Q4 Q1 Q2 Q3 Q4 Q1
Source: Internal data 23MY.GAMES – rising engagement in light of COVID-19
• Since self-isolation gained traction globally, MY.GAMES started to see a positive impact on engagement in
terms of DAU and CCU, especially on traditional home platforms: PC and consoles
• We saw activity picking up in Russia during the fourth week of March. In Europe, this growth began one-two
weeks earlier, depending on the country
WARFACE CONQUEROR’S BLADE
Warface franchise continues to expand across platforms Title continues to show strong potential for growth
MOBILE PC
• Warface: Global Operations (PvP shooter) — developed • During the last week of March DAU was +75%
by in-house studio Whalekit (Left to Survive) was • New registrations in March spiked by 267%,
launched on Jan 14, with >5.5mn installs and 3.2mn reaching 2.6m
MAU, chosen as game of the month in the AppStore
PC
• Warface is seeing a jump in daily audience numbers in Europe,
with DAU +45% WoW during the last week of March
CONSOLE
• Nintendo Switch version was launched in Feb, reaching 1m in
installs 1.5 months since launch. The game’s DAU was +16%
on the PlayStation 4 and 13% on Xbox One during the last
week of March compared to February
Source: Internal data 24MY.GAMES – additional portfolio highlights
• As of Q1, 66% of Games revenues came from mobile
LEFT TO SURVIVE TACTICOOL LOVE SICK AMERICAN DAD! LOST ARK WAR ROBOTS HUSTLE CASTLE
Top-5 revenue Developed by Developed by SWAG Developed in Developed by At >150mn At 58mn downloads
generating title, recently acquired MASHA, has shown partnership with Korean Smilegate installs, title is in as of March, HC
with >22mn Panzerdog, with a three-times growth FOX Next. RPG. in RU/CIS a mature phase of continues to be a
installs vs 19.4mn >11mn installs. since the end of Launched on Oct market. Has its lifecycle and strong margin
installs at the end Was chosen as one 2019, hitting 12mn 27, with >4.5mn 1.8mn registered hence is showing generator. Product
of 2019 year the Best downloads since its installs. Had a big users post launch EBITDA reached a daily
Competitive Games launch in February update “Crusade in on Oct 27 improvement, revenue record of
in 2019 in Google 2019. March” which is expected RUB128mn on April
Play Store to continue 15 and has a full
throughout the pipeline of updates in
year 2020
Mobile Mobile Mobile Mobile PC Mobile Mobile
Source: Internal data 25MY.GAMES – publishing pipeline progress
• We operate a diversified portfolio of >100 games
• There are >15 in the development pipeline, with a packed pipeline for 2020
• To get to our set financial targets, MY.GAMES aims to launch 1-2 PC/Console titles per year and four mobile
titles
Q1 Releases:
• In Q1 we acquired control in the BeIngame Studio –
developer of the mobile title Zero City with >9mn installs,
experiment in a very trending post-apocalyptic zombie
setting with 9.4mn installs
WORLD ABOVE DINO SQUAD • We will continue expanding Warface footprint, including
REMASTERED through the new console product within the franchise
Developed by Developed by designed for PS4 and Xbox One. Launch of the new game
IT Territory. Pixonic studio. focusing on European and US is scheduled for Q2
Was released Was released
on March 16 on April 20
Mobile Mobile
Source: Internal data 26MY.GAMES – COVID-19 Activities
In March 2020 MY.GAMES launched collaboration
with VK and OK, supporting people during self-
isolation by offering bonuses and gifts in its
games across multiple platforms worth Coronavirus and social distancing forced the
~RUB200m. MY.GAMES launched the increase of interest in streaming. The number of
#PlayAtHomeStandUnited campaign with new streamers using DonationAlerts was
>150,000 voiced their support one week post- +32% in March vs January 2020
launch
MY.GAMES joined the Play Apart Together
international campaign to fight the spread of
COVID-19, joining the ranks of Activision
Blizzard, Microsoft and Sega. Companies taking
part in the campaign provide in-game bonuses
Difficult times of economical instability pushed
and incentives to players, hold extra activities
people to search for new earning tools and
and use their online platforms to inform the
opportunities. As a result, membership platform
community on methods of curbing the spread of
Boosty.to saw 95% growth in new registrations
coronavirus
and 56% in active creators in March versus
MY.GAMES Store launched a new messenger, multi- January 2020. Total revenue of Boosty.to increased
profile accounts. At the end of March there was a 25% 133% during the same period
jump in traffic on the MY.GAMES Store. Over 615,000
unique users have used the messenger since its launch
on March 24, opening it 3.2m times. More than a third
of users tried the multi-profile function
Source: Internal data 27Youla – one of the world’s largest mobile-first
classifieds platforms
The world’s largest mobile-first platforms
Millions of daily active users
• Launched in Q4 2015, Youla is already one of the
1,5 on Android platform(1) world’s largest mobile-first platforms(1)
• Monthly audience stands at 26m users(2) (MAU)
1,0
• Youla’s strategy is focused on offering a product-driven
approach with unique and first-to-market features.
Service has been the pioneer in launch of location-
0,5
based search, escrow payments, gamification, C2C
discounts, in-app P2P and video calls, and several
other features
- • Youla is focused on safety & social features, which
serve a core for user retention & engagement
Launched Q4’15 2011 2013 2015 2012
• Integration into the broader MRG ecosystem serves as
a competitive advantage
Source: (1) AIM Group Marketplaces Report, May’19. SimilarWeb was provided as the original source for daily active users on
Android platform in this report. The report does not contain any data on IOS platform. Letgo data is for US market only
(2) Internal statistics on MAU at all platforms, Mar’20 28Youla – anti-crisis actions and relative positioning
Actions in Generals and Services verticals Internal strengths
• Increase in the # of listings allowed for publication • Diversification of revenue across several verticals
within free-of-charge limits • Large exposure to Generals vertical (the largest by
• Free promotions of listings in exchange for bonuses revenue), which has historically outperformed other
• Promotion of remote services in Youla’s main feed and segments during crisis environment. People tend to
through push notifications switch to second-hand and C2C goods, given pressure
• Contactless delivery in Moscow and Moscow region, on disposable incomes
which is free for sellers • Solutions for remote interactions between users:
In-app video calls for remote demonstration of
Actions in Jobs vertical (Worki)
goods
• Bonus cash to the most impacted business accounts Delivery with escrow transactions
• Extending the duration on pre-paid services with the
Interactive virtual 3D home tours
possibility of using them at a later date
• Access to internal sources of traffic within MRG,
• Launch of “Remote work” job category
which can replace external channels
Actions by 33 Slona – Digital real estate agency
• Temporarily waiving commissions in favor of realtors and
agencies
• Launch of interactive virtual 3D home tours
Source: Internal data
29Youla – New C2C and B2B features
Youla continues to enhance its B2B platform via: Wallet for legal entities
• Аdditional ways to pay for Youla’s services
• Automations of workflow and reduction of costs
for customers’ sales departments:
Automated billing
Auto verification of legal entity’s
identification details
Download a list of transactions
Youla continues to improve user
experience on C2C side:
• Users have natural need to discuss
the price – up to 30% of all
contacts are related to bargaining
• Thus, Youla enabled the platform
with proper mechanics simplifying
the bargaining process
Source: Internal data
30Youla – simplifying user journey through MRG
ecosystem
• As part of our strategic ecosystem development process and cross-selling across the group, we rolled out
authorization in Youla using VK Connect, which allows to onboard new users in just one click
• Following the launch of new
authorization method,
conversion to authorization
exceeded 90%
• Since launch, 20% of new
authorizations used VK
Connect and we expect
further growth
Source: Internal data
31Worki – example of execution in verticals &
cross-selling with the Group
VK & Mail ID authorization
Mandatory registration inside VK
In 1Q Worki added multiple new features for recruiters:
• Generator of customized feeds:
Vacancies of clients, who need larger application pull,
are posted on other job aggregators
Faster closure of rare or mass hiring vacancies
Adds 20-40 applications per client daily
• Recruiters’ branded pages on web platform
• New monetization product – access to CV database
The number of paying clients in Worki has grown 1.8x YoY
in March
• 30% of authorizations use social networks IDs
• Simple mandatory registration by using VK profile data
(6x growth in conversion to registration in VK mini-app) 32
Source: Internal dataRussian education landscape
• Russian education is a RUB 1.8tn market with significant potential for new technology adoption and
market disruption. Largest segments are K12 (RUB 600bn) and Pre-K (RUB500bn)
• Estimated online education market size today is RUB 50bn or 2.8% of total education market and
hence our active involvement in its future digitalization, which should be further accelerated by ongoing
COVID-19 lockdowns, with education moving fully online temporarily
• Private players are dominant in tutoring and vocational/language for adults verticals, with 95% and 85%
respective shares
~6% private
segment
K12
(public schools) ~8%
~10% RUB 600 bn Higher
education
RUB 500 bn
Pre-K
Vocational
RUB 500 bn
Tutoring and and
additional language for
classes adults
RUB 101 bn RUB 160 bn
~95% ~85%
33
Sources: HolonIQ, INTERFAX, HSE, Netology, SkyEngPresent in segments, accounting for ~90% of online market
• Following consolidation of Skillbox in Q4, our online education products generated a combined RUB 720mn
in revenues in Q1, growing at triple digit rate YoY despite the ongoing COVID-19 related initiatives, which
assume provision of temporary free access to some of their services
• Our platforms are seen as capturing >40% market share within digital professions online segment
Other
School learning
6
K-12
Corporate
learning 17
7
R 50 bn market
size in 2019,
growth over 50%
in 2020
Digital 5
professions
(dominated by
Mail.ru) 15
Language
learning
34
Sources: company data, SkyEng market research, Netology market research, Interfax data for 2019Driving digital transformation – our instruments
• We focus on latest technologies, applicable to a broad pool of industries, with the use of open source, complex
approach and ability to accommodate at any scale
• COVID-19 has been supporting IaaS spending. We saw a 10% demand increase for Mail.ru Cloud Solutions in March
• Our clients include: Aeroflot, Alfabank, Nokia, Rosatom, VEB RF, Rosseti, Burger-King
Areas of transformation Technologies
People and their
communication
Intranet, e-mail, messenger Knowledge & Competences
Consulting services of
Infrastructure Cloud, PaaS
Mail.ru Group and its
partners
Data processing Tarantool, IoT, data dashboards
Рекомендательные
системы
Big Технологии
Data and AI Predict, corporate AI
обработки данных
35
Source: internal dataMCS initiatives to support society in
global COVID-19 fight
• In light of COVID-19, Mail.ru Cloud Solutions launched a support
program for SMEs that provide socially useful free products / services
• As part of the distance learning support program in Russia Mail.ru
Cloud Solutions provided cloud infrastructure for free to the Higher
School of Economics and other Russian universities
• Mail.ru Cloud Solutions together with the HacktheCrisisRussia community
supports an online hackathon to develop solutions to minimize the
effects of the pandemic
• Mail.ru Cloud Solutions provided infrastructure for the all-Russian scaling
of Botkin.ai (the СOVID-19 AI diagnostic platform)
36
Source: internal dataMail.ru for business – platform solution
• Mail.ru for Business platform unites a number of SaaS
solutions:
• Unified communications for employees:
• Corporate Email Service
• Myteam, instant messaging
• Teambox, cloud storage and
collaboration
• Services for business development:
• Marketing automation platform: email,
SMS, Viber
• Online survey software: research,
testing and web-site forms
• All solutions are suitable for SMEs • We can also offer secure on-premises
and able to fully cover their installation of our unified
communication and business communication solution, often required
development needs by large corporates
37
Source: internal dataDC is the food delivery market leader in terms of users…
3.5
Monthly active users, mn
3.0
2.5
2.0
1.5
1.0
0.5
0.0
2018 2018 2018 2018 2018 2018 2018 2018 2018 2018 2018 2018 2019 2019 2019 2019 2019 2019 2019 2019 2019 2019 2019 2019 2020 2020
-01 -02 -03 -04 -05 -06 -07 -08 -09 -10 -11 -12 -01 -02 -03 -04 -05 -06 -07 -08 -09 -10 -11 -12 -01 -02
Delivery-club Yandex.Eda
Source: Mediascope, Russia, desktop and mobile, cities 100k+, age 12-64. 38…and downloads
Downloads, iOS and Android combined, thousand
800
700
600
500
400
300
200
100
0
2018 2018 2018 2018 2018 2018 2018 2018 2018 2018 2018 2018 2019 2019 2019 2019 2019 2019 2019 2019 2019 2019 2019 2019 2020 2020 2020
-01 -02 -03 -04 -05 -06 -07 -08 -09 -10 -11 -12 -01 -02 -03 -04 -05 -06 -07 -08 -09 -10 -11 -12 -01 -02 -03
Delivery club Яндекс Еда
Source: AppAnnie 39COVID-19 measures and ongoing diversification
• O2O JVs foodtech vertical has taken multiple measures around supporting restaurant partners,
couriers and customers in light of ongoing pandemic while further diversifying its business offer:
1. DC has temporarily waved commissions charged to some of its smaller marketplace partners and provided
a temporary 20% discount for their orders to help accelerate ramp-up;
2. Commission for 1P sign-ups was temporarily set to 25% (both in effect between March 15 and June 30);
3. DC launched a hotline for restaurants and created a courier reserve in order to meet potentially higher demand
while restaurants are closed for walk-ins as well as further automatized restaurant onboarding system with
onboarding period shortened to 1 day;
4. DC made contactless and cashless delivery as default options, with tipping of couriers done through VK
Pay;
5. DC launched take-away, which will be scaled during post quarantine period in order to support restaurants and
reduce their costs;
6. DC is looking to launch deliveries of OTC pharmaceuticals in partnerships with Mail.ru Group’s “Vse Apteki”
platform, which is connected to 46% of the local pharma market;
7. All services have been providing their courier staff with masks, antiseptics and other protective tools, while office
staff has been working remotely;
8. Delivery club launched mobile testing units to check couriers for COVID-19;
9. O2O JV signed a binding agreement to acquire control (75.6%) in Samokat, largest express e-grocery player in
Russia, with 140 dark stores in Moscow and St Petersburg and >30,000 in daily orders in March, up >30% since
January
Source: Internal data
40New benchmark of 3.78mn orders achieved in March,
with a balance between 3P and 1P
• Weekly delivery record of 1mn restaurant orders was reached in April
1P orders 1P/3P orders split
1.8x
3P
1P
Q1 2018
Q4 2018
Q1 2017
Q2 2017
Q3 2017
Q4 2017
Q2 2018
Q3 2018
Q1 2019
Q2 2019
Q3 2019
Q4 2019
Q1 2020
Q1 2017
Q2 2017
Q3 2017
Q4 2017
Q1 2018
Q2 2018
Q3 2018
Q4 2018
Q1 2019
Q2 2019
Q3 2019
Q4 2019
Q1 2020
Source: Internal data
41In 2020 DC has significantly accelerated its growth
Geographic expansion Active users
Cities of operation, 1P1 Cities of operation, 3P DC active users3, mln
YoY
Q1 2019 13 120+ Q1 2019 1.7
1.9x
Q1 2020 70 150+ Q1 2020 3.3
Restaurants Revenue (RUBmn)
Number of restaurants2 1,816
1,472
1,244
Q1 2019 9,400 881 865
646
424 433 427
Q1 2020 16,300
Q2 2019
Q3 2019
Q4 2019
Q1 2018
Q2 2018
Q3 2018
Q4 2018
Q1 2019
Q1 2020
1 – Moscow Region is counted as one city
2 – Restaurants capable of taking orders during the last month of reporting period 42
3 – Users with at least 1 order during the periodRide-hailing market remains attractive
• Despite ongoing challenges, ride-hailing market of Russia is expected to expand
further in the coming years through organic growth and in-market consolidation
CM is already strongly
Russian taxi market size and share of aggregators, 2019-2030, RUBbn1 positioned on the local
ride-hailing market
LONG-TERM > 2 700
Integrated urban mobility systems
Self-driving technologies
MID-TERM
Multimodal products
TOP-2
Market consolidation & profitability across 17/22 cities of operation &
SHORT-TERM TOP-3 in all cities of operation
Growing penetration of aggregators,
especially in regions 1 432
>30% 2
1
952 109 In majority of regional 1M+ cities
777
Taxi
market >550K
Share of rides in peak days
aggregators
‘19 ‘20 ‘21 ‘22 ‘23 ‘25 ‘30
Source: 1 – Consensus is based on analysis of UBS, Goldman Sachs, VTB Capital, Otkritie, RU Government analytics, CM Management; 2 – percentages are based on internal estimates of Gross 43
Bookings by CM team using available information as of Apr 10, 2020CM continued expansion and improved unit economics in Q1
despite COVID-19 challenges
• In Q1 CM has strengthened its status of a federal player having rolled out
to 3 new 1M+ cities and a number of smaller ones
Growth came amid positive
unit economics in Moscow
Rides and cities of operation1 by quarters, 2019-2020 22 and substantial uplift
across the entire platform
3.7x
30%
Improvement in unit economics in Q1
2020 vs Q4 2019
Positive unit economics
Cumulative For 4 consecutive months in Moscow
cities of
operation and Moscow Region
Rides
3 Approaching positive
Unit economics in a few other markets
Q1 19 Q2 19 Q3 19 Q4 19 Q1 20
Source: Internal data, 1 – Based on CM internal definition of city, which includes metropolitan areas that include several cities
44Impact of COVID-19 is visible, but provides a field for new
business opportunities
COVID-19 impacts business … and provides a field for … and social responsibility
activities in the short-term … business opportunities …
Hourly views, workday peaks
• Operating delivery Providing free rides to doctors and
tariff across all blood donors
geographies
• Delivery
integrations with Managing a support fund for drivers
Weekday diagnosed with COVID-19
before
partners across
COVID-19 and outside of
O2O-ecosystem in
Installing plastic dividing fences in
order to keep vehicles, operating sanitation stations
Weekday utilization of drivers and providing sanitizers and masks
after
COVID-19
at high levels
0 6 12 16 20 24
Morning peak Evening peak Giving out 30% discounts on rides to/
from home
Source: Internal data
45VK Taxi strengthens its position of a growth driver for rides
• VK Taxi mini app reached 1mn taxi ride bookings milestone in early April
VK Taxi weekly rides, 2020
6.5x
VK Taxi icon in the Better and faster UI February March April
explore screen of VK app
46
Source: Internal dataCM in 2020 – growth, efficiency & O2O JV synergies
Business Path to Synergies in
Scale
priorities profitability the ecosystem
Key goals for • Expanding market share • Increasingly focusing on • New marketing & product
2020 in existing cities and improvements in unit synergies with both
launching of select new economics across all ecosystems
geographies markets • Leveraging R&D
• Targeting solid #2 • Targeting positive unit capabilities of both
position in Russia economics ecosystems (e.g. AI,
• Growing adjacent areas computer vision)
of business (e.g. • Rolling out a new fleet
delivery, B2B) product in collaboration
with SberLeasing
Source: Internal data
47AER JV – ongoing cross-border and local business
enhancements
• Enhancement of cross-border AliExpress platform and scaling the domestic marketplace are among the key
strategic priorities for AER JV, along with development of Social commerce, primarily via the social networks of
Mail.ru Group. COVID-19 has not derailed and rather accelerated some of the internal initiatives
• Logistics in China have now fully normalized, with AliExpress having
serviced >11mn packages in March
• In order to support local businesses during COVID-19, AliExpress Russia has
eliminated commissions for new local sellers, in effect for 6 months or for
initial 100 orders since March 31. Commissions for other local sellers remain
within an attractive 5-8% range. There are already >1.5mn SKUs (+38x YoY)
from >10,000 local sellers (>100x YoY) on the platform with >RUB500mn in
daily local GMV during March sales campaign, which is expected to scale
significantly vs its 15% total GMV share in 2019
• Expansion of the network of pick-up points continues, at 12,000 in March,
with availability across 3,500 cities. Logistics are done through Cainiao as
well as local players, including Russian Post, 5Post, DPD, PickPoint and
others. The growing number of pick-up points resulted in nearly halving of the
cross-border delivery period to up to 20 days and 10 days across cities with
population of 1mn+. Goal is to reduce delivery time to major Russian
cities to 7-10 days
Source: Internal data
48MRG and AER aim to create a new shopping
experience for local social networking users
Social commerce strategy:
• Educate Russians about how to be able to sell through AER JV, including through its access to MRG social
networks
• Integrate shopping experience into the social context by involving users into engaging mechanics.
AliExpress and VK are working on a launch of a referral program with VK users
• Promote social shopping as a lifestyle-enhancing experience
• Make influencers and communities our partners and give them tools to engage users in shopping by
content creation. Bloggers and other opinion leaders could be on-boarded for the referral platform
• Establish entry points 2-3 clicks from anywhere inside the social networks
• Make user journey as native as possible and minimize friction in the shopping process = make shopping as
simple and convenient as possible
• Use social data, content interaction data, user social graph and ad reaction data to enrich user profile
• Provide integrations for merchants and cover all businesses on the social platforms with easy-to-use tools
to increase their sales
Source: Internal data
49Q1 2020 operating segments performance
• In Q1 S&C segment grew by 8.8% to RUB12.5bn, accounting for 56% of Group’s total. Growth has slowed
QoQ vs >14% Q4, mainly due to the slowdown in online advertising, which expanded by 9.3% vs 10.6% growth in
IVAS. EBITDA came at RUB6.7bn, with a 53.4% EBITDA margin
• Games segment expanded by 13.4% (to RUB7.9bn, 35% of Group’s total) despite the base effect and relatively
light launch pipeline for the quarter. EBITDA margin was 6.6%, with Q1 being a typical seasonal profitability
bottom for our Games business – EBITDA margin for Games stood at -3% during Q1 2019
• New Initiatives continues its rapid expansion with revenue growth of 80%, driven by classifieds and online
education, which are its largest components. Segment remains in investment phase, with an EBITDA loss of
RUB1.5bn for the quarter, which means -74.5% margin, slightly below -65% margin in Q1 2019
Q1 2020 operating segments performance
Communications
RUB MM Games New initiatives Eliminations Group
and Social
Total segment revenue 12,523 7,896 1,987 (75) 22,332
Y-o-Y growth 8.8% 13.4% 80.3% 246.3% 14.3%
Total operating expenses* 5,833 7,376 3,468 (75) 16,603
Segment EBITDA 6,690 520 (1,481) (0) 5,729
EBITDA margin 53.4% 6.6% -74.5% 25.7%
Net profit 2,203
Net profitability 9.9%
Note 1: Group aggregate segment financial information for the three months ended March 31, 2019 has been retrospectively adjusted to account for
pro-forma inclusion of BeIngame studio and pro-forma exclusion of Delivery Club and ESforce. 50Q1 revenue and profitability update
• Revenue growth stood at 14.3% YoY in Q1 to RUB22.3bn
• Online advertising started to see pressure in March, which lead to growth slowing to 9.3% YoY, while MMO Games
performed above set target, with growth of 11.5% growth on the back of RUB weakness as well an uptick in engagement
seen towards the end of March. These trends have carried into Q2 for both, ads and games. Community IVAS remains
resilient, with 10.6% growth YoY in Q1
• EBITDA margin stood at 25.7% in Q1 vs 28.2% a year ago, given ongoing investments, including around multiple
COVID-19 initiatives
• Capex stood at 9.4% of revenues, in line with historical average despite the majority of capex being denominated in FX
Q1 revenue and profitability review
RUB MN
Q1 2019 Q1 2020 Y-o-Y, %
Revenue 19,544 22,332 14.3%
Online advertising 7,827 8,553 9.3%
MMO games 6,431 7,173 11.5%
Community IVAS 4,202 4,646 10.6%
Other revenue* 1,084 1,960 80.8%
EBITDA 5,503 5,729 4.1%
EBITDA margin, % 28.2% 25.7% -2.5%
Net profit 2,833 2,203 -22.2%
Net profit margin, % 14.5% 9.9% -4.6%
Capex -1,493 -2,099 40.6%
% of revenue -7.6% -9.4% -1.8%
Note: Pandao, Delivery Club & ESforce are excluded from all numbers on a pro-forma basis 51Headcount evolution
• Following recent COVID-19 and oil shocks, we have not changed our approach to hiring across
core units
• Group’s headcount reached ~6.8k as of Q1 2020 given organic expansion of the Group as well
as recent M&A, mainly consolidation of Skillbox, completed in Q4 2019
• Headcount was reduced by 564 as of June 2019 due to reclassification of DC and ESForce as
assets held for sale, with subsequent full deconsolidation of DC since and ESFroce remaining as
asset held for sale Total headcount, eop
564
548
116
6 762
5 551 5 420 5 533 5 879 6 278
4 419
3 463
Dec-16 Dec-17 Dec-18 Mar-19 Jun-19 Sep-19 Dec-19 Mar-20
Mail.ru Group DC, ESforce
Source: Internal data
52
Note: Group’s total is shown ex Pandao, Delivery Club, Esforce and SkillboxMRG is backed by leading global internet
companies
27.6%
• ~50% of Mail.ru GDRs are listed
on LSE
• Blue-chip shareholder base
includes Prosus (since 2006,
48.6%
initially through Naspers), Tencent
(since 2010) and most recently
Alibaba (since 3Q19)
7.4%
10.0%
5.2%
Naspers Tencent Alibaba MF Technologies Free float (LSE)
53
Source: Public data. Free-float number includes 1.2% held by Mail.ru Employee Benefit Trustees LimitedMRG shareholder structure details
MFT Freefloat
Economic 27.6% 10.0% 7.4% 5.2% 49.8%
Voting 12.3% 4.4% 3.3% 58.3%* 21.7%
Source: Public data as of March 31, 2020, calculated on fully diluted basis, accounting for DRs sitting in employee benefit trust (non-voting)
Naspers holding is done through Prosus since 3Q19
* USM/MegaFon votes (~54%) within MFT have been delegated to the CEO of Mail.ru Group (Russia) – Boris Dobrodeev since October 2018
MFT shareholder structure: MegaFon (45%), Sberbank (36%), Rostec (10%), USM (9%)
54For further information please contact: Tatiana Volochkovich Mail.ru Group, Director of Investor Relations Office: +7-495-7250-6357 x 3434 Mobile: +7 905 594 6604 E-mail: ir@corp.mail.ru / t.volochkovich@corp.mail.ru
Disclaimer
This presentation has been prepared by Mail.ru Group Limited (the “Company”) and comprises the written materials for a presentation to syndicate research analysts or certain institutional investors.
Matters discussed in this presentation may constitute forward-looking statements. Forward-looking statements include statements concerning plans, objectives, goals, strategies, future events or performance, and underlying assumptions and other
statements, which are other than statements of historical facts. The words “believe”, “expect”, “anticipate”, “intend”, “estimate”, “forecast”, “project”, “will”, “may”, “should” and similar expressions identify forward-looking statements but are not the
exclusive means of identifying such statements. Forward-looking statements appear in a number of places in this presentation and may include statements regarding: strategies, outlook and growth prospects; future plans, expectations, projections
and potential for future growth; plans or intentions relating to acquisitions; future revenues and performance; liquidity, capital resources and capital expenditures; economic outlook and industry trends; the impact of regulatory initiatives; competitive
strengths and weaknesses; and the strengths of competitors. The forward-looking statements in this presentation are based upon various assumptions, many of which are based, in turn, upon further assumptions, including, without limitation,
management’s examination of historical operating trends, data contained in Company records and other data available from third parties. Although the Company believes that these assumptions were reasonable when made, these assumptions
are inherently subject to significant known and unknown risks, uncertainties, contingencies and other important factors which are difficult or impossible to predict and are beyond its control. Such risks, uncertainties, contingencies and other
important factors could cause the actual results of the Company or the industry to differ materially from those results expressed or implied in this presentation by such forward-looking statements. No representation is made that any of these
forward-looking statements or forecasts will come to pass or that any forecast result will be achieved and you are cautioned not to place any undue influence on any forward-looking statement. No one undertakes to publicly update or revise any
such forward-looking statement.
Investment in the GDRs may involve substantial risk. References to future returns are not promises or even estimates of actual returns an investor may achieve. The forecasts contained herein are for illustrative purposes only and are not to be
relied upon as advice or interpreted as a recommendation. The information herein reflects the Company’s judgement of the prevailing conditions as of this date, all of which are subject to change. Past performance or experience does not
necessarily give a guide for the future. Neither the delivery of this presentation nor any further discussions with any recipient shall, under any circumstances, create any implication that there has been no change in the affairs of the Company since
such date.
This presentation does not constitute or form a part of, and should not be construed as, an offer or invitation to subscribe for or purchase any securities of the Company and neither this presentation nor anything contained herein shall form the
basis of, or be relied on in connection with, any offer or commitment whatsoever.
The Company's shares and GDRs have not been and will not be registered under the U.S. Securities Act of 1933, as amended. Securities may not be offered or sold in the United States absent registration under that Act or an available exemption
from it, and the Company does not intend to make a public offer of any securities in the United States
Within the member states of the European Economic Area (the “EEA”) this presentation is only addressed to and directed at persons who are “qualified investors” (“Qualified Investors”) within the meaning of Article 2(1)(e) of the Prospectus
Directive (Directive 2003/71/EC) (including any relevant implementing measure in each relevant member state of the EEA). In addition, in the United Kingdom, this presentation is being distributed only to, and is directed only at (i) Qualified
Investors who have professional experience in matters relating to investments falling within Article 19(5) of the Financial Services and Markets Act 2000 (Financial Promotion) Order 2005, as amended (the “Order”) or high net worth entities falling
within Article 49(2)(a) to (d) of the Order, or (ii) persons to whom it may otherwise lawfully be communicated (all such persons in this paragraph collectively being referred to as “Relevant Persons”). This presentation must not be acted on or relied
on (i) in the United Kingdom, by persons who are not Relevant Persons, and (ii) in any member state of the European Economic Area other than the United Kingdom, by persons who are not Qualified Investors. Any investment or investment
activity to which this presentation relates is available only to Relevant Persons or will be engaged in only with Relevant Persons.
The information and opinions contained in this presentation are for background purposes only and do not purport to be full or complete. No reliance may be placed for any purpose on the information or opinions contained in this presentation or
their accuracy or completeness. No representation, warranty or undertaking, express or implied, is given as to the accuracy or completeness of the information or opinions contained in this presentation by the Company and no liability is accepted
by us for the accuracy or completeness of any such information or opinions.
The information in this presentation is being circulated on a confidential basis, and is neither to be disclosed to any other person, nor copied or reproduced, in any form, in whole or in part without the Company’s prior consent.
By accepting delivery of this presentation you agree to be bound by the foregoing terms and acknowledge that you will be solely responsible for your own assessment of the market, the market position of the Company and the GDRs and that you
will conduct your own analysis and be solely responsible for forming your own view of the potential future performance of the Company’s business
.
You can also read