Board of Advisors Meeting Feb 19th, 2021 - Stern IAG
←
→
Page content transcription
If your browser does not render page correctly, please read the page content below

Board of Advisors Meeting
Feb 19th, 2021
Table of Contents

I. Letter                       2

II. Performance Analysis       3

III. Key Holdings Update       7

IV.Update Notes                14

V. New Position Proposal       18

                           1
Letter from Portfolio Managers
Dear Board of Advisors,
        First and foremost, we would first like to congratulate the five new portfolio team members:
Alexander Isaac, Alice Yu, Amy Chen, Niranjan Narasimhan and Rahul Parikh! They are the first cohort to
go through the new internship structure and we are pleased with the results thus far. We look forward to
seeing their contributions to the club going forward.
         We are happy to report that IAG outperformed the S&P 500 by 19%, resulting in an AUM of ~$60K.
Looking back at the historical reports, we believe this is a record in terms of both returns and AUM. That
said, it would be ill-served not to recognize the highly positive environment in which we are currently
operating in. To use fishing as an analogy, we are using the same fishing pole and bait to catch fish that are
substantially larger than usual, which puts us on higher alert than usual. Nonetheless, we are cautiously
optimistic about the remainder of the academic year.
        Moving on to recent developments in the markets, we had mixed feelings watching the gamification
of markets these last few months. It served as a reminder for how low the entry barriers are to public equity
investing, as well as how market pricing is influenced not only by the perception of intrinsic value.
However, as GME, the posterchild for market gamification, fell from ~$480 to ~$50, our conviction in our
process was quickly strengthened. Also, while some aspects such as the retail investor participation is
novel, short and gamma squeezes are not (i.e., VW briefly being the most valuable company in the world in
2008). History does not repeat itself, but it often rhymes.
        Another topic that has been on our minds is when and where consumer spending will bounce back
as the economy opens back up. One area where we have a particular interest is leisure travel. The picture
below was taken at Cancun airport a few days ago and clearly suggests that consumers are itching to
escape their homes. TSA checkpoint data is still drastically lagging prior years, but we are confident that
we can benefit from this potential leisure travel boom indirectly through current positions such as TDG but
also more directly through potential new positions next meeting.

       Today, we are pleased to share the following proposals:
          1. At Home Group (NYSE: HOME) – a home décor retailer on the cusp of completing a
              successful turnaround with promising growth prospects
            2. Diamond Hill Investments Group (NASDAQ: DHIL) – an undervalued investment
               advisor that manages mutual funds and separately managed accounts
       We are happy to continue being a source of information to the Board and encourage you all to reach
out with feedback or clarifications.
                                                                                                          Best,
                                                                               Chen Zhou & Jaro van Diepen
                                                                                           Portfolio Managers
                                                 Feb 19, 2021                                            2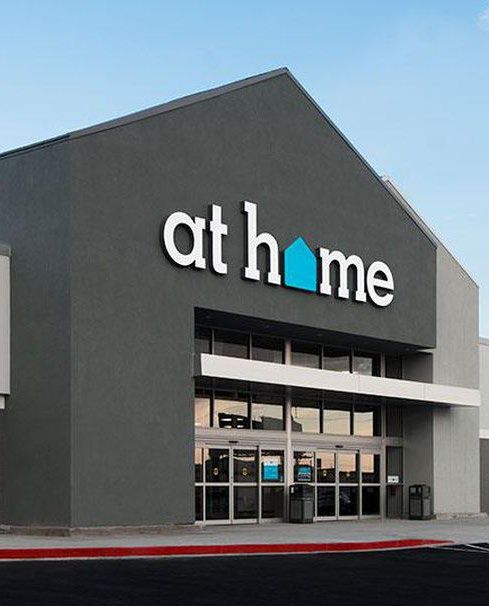
II. Performance Analysis

                           3
Holdings Summary (as of Feb 17th, 2020)
                                                             Holdings Summary
                                                         Date of     % of       Share    Price At                 Current     Morningstar      Holding
     Company Name           Ticker          Coverage    Purchase   Portfolio    Count    Purchase   Share Price   Return       Industry         Type
Allison Transmissions       ALSN         Cody Fang      12/3/19     3.4%         50      $47.42       $41.65      (12.2%)      Industrials      Core
APi Group                     APG       Srikar Alluri   9/24/20     4.9%         160     $14.23       $19.10       34.2%       Industrials      Core
Berry Global                 BERY        Sophie Pan     12/3/20     4.7%          50     $54.60       $58.02        6.3%    Consumer Staples    Core
BorgWarner                   BWA        Larry Wang      3/14/19     4.0%          55     $38.34       $44.57       16.2%       Industrials      Core
CVS Health Corp               CVS      Michael Giese    12/6/16     2.4%          20     $77.28       $72.71       (5.9%)      Healthcare       Core
First Energy                   FE       Liam Coohill    10/29/19    2.6%          50     $47.30       $31.95      (32.5%)        Utilities      Core
Grocery Outlet                GO        Larry Wang       5/14/20    3.4%          50     $36.45       $42.17       15.7%    Consumer Staples    Core
HCA                          HCA        Srikar Alluri    9/26/19    5.4%          19     $119.20      $176.44      48.0%       Healthcare       Core
Identiv                      INVE       Tony Wang        9/24/20    7.9%         400      $6.26        $12.15      94.1%          TMT           Oppt.
Office Properties Income      OPI        Cody Fang      10/29/20    5.3%         130      $17.73       $24.98      40.9%       Real Estate      Oppt.
Palo Alto Networks          PANW        David Zhou       9/24/20    6.4%          10     $244.75      $395.42      61.6%          TMT           Core
Points International        PCOM        Tony Wang       10/29/20    5.8%         240       $9.95       $14.87      49.4%          TMT           Oppt.
Recro Pharma                REPH        Srikar Alluri   10/29/19    1.1%         160      $13.20        $4.42     (48.3%)      Healthcare       Oppt.
TransDigm Group               TDG     Jaro van Diepen     4/9/20    2.8%           3     $360.46      $570.37      58.2%       Industrials      Core
United Rentals                URI       Caleb Nuttle     3/14/19    6.3%          14     $118.07      $277.81     135.3%       Industrials      Core
XPO Logistics                 XPO        Chen Zhou      10/20/19    8.7%          45      $74.41      $119.00      59.9%       Industrials      Core
ZTO Express                   ZTO       David Zhou       3/14/19    6.0%         100      $19.28       $36.91      91.4%       Industrials      Core
SPDR S&P 500                  SPY                                   5.1%           8                  $392.39                                   Core
Total Equity Holdings                                              85.9%                            $53,126.58
Cash                                                               14.1%                             $8,703.33
Total Portfolio Holdings                                           100.0%                           $61,829.91
                                                                                                                                               35.20%
                                                   IAG vs. S&P 500 LTM Return
  140%

  120%

  100%                                                                                                                                             16.42%

   80%

   60%

                                                              IAG              S&P 500

                           Portfolio KPIs                            On a last twelve-month basis, IAG’s portfolio has
                                                                     returned 35.2% while the S&P 500 returned 16.4%. This
             Indicator                         Number                outperformance is partially due to the portfolio being
                                                                     positively skewed to an economic re-opening due to
       Daily Sharpe Ratio                        0.06                heavy industrial weighting. Since the last oversight
                                                                     meeting, the spread between IAG’s portfolio and the
    Annualized Sharpe Ratio                      1.00                S&P 500 contracted from 0.1% (11/30/2020) to 18.8%
                                                                     (2/17/21).
          Portfolio Beta                         1.08
                                                                     Our opportunistic positions now represent ~20% of our
         Daily Volatility                       1.52%                portfolio which is in line with our expectations.

                                                        III. Performance Analysis                                                              4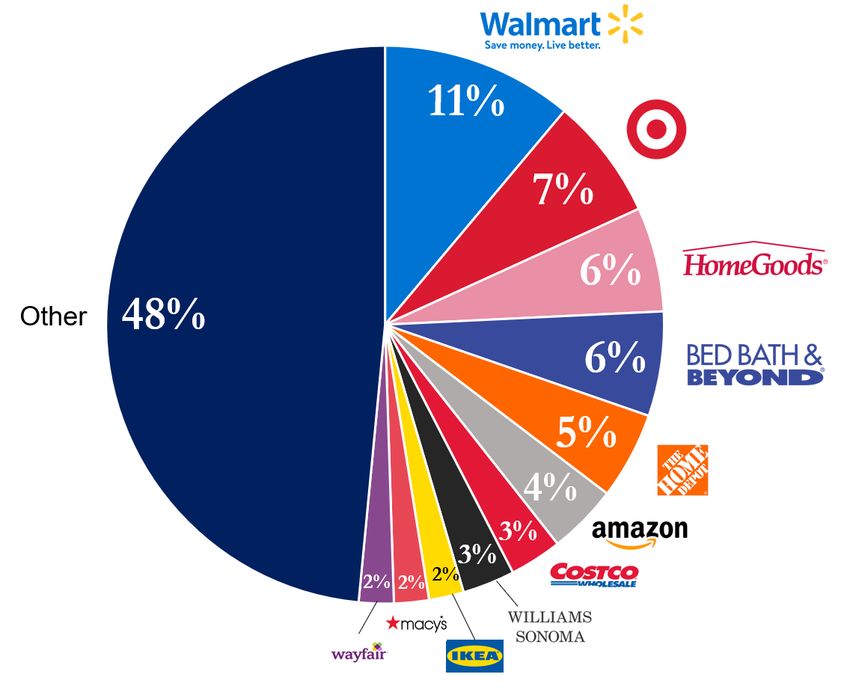
Portfolio Exposure vs. Benchmark
                                 Sector Exposure: IAG vs. S&P 500 (%)
 60
                                                                              47.8
 45

 30
                                                                                     24.6 23.3

                12.6    13.2                                                                                 13.9
 15                                                10.7                                                9.4
                                                                            8.5                  6.7                10.4
                                           6.1
      2.24                           2.5                       2.4                                                         2.8 3.0
  0

                                                          S&P 500     IAG

             IAG vs. S&P 500 Exposure by Market Cap                                     IAG continues to use the S&P 500
                                                                                        as the core benchmark as
60%
                                                                                        specified in the fund mandate.
                                                       54%                              While our industrial exposure is
                                                                     50%                still substantially overweight, the
50%                                                                                     two proposed positions today
                                                                                        will help improve the
                                                                                        composition.
40%
                                                                                        IAG continues to be
                                                 34%                                    underexposed to mega-cap
                                                                                        positions, yet drastically
30%                                                                                     overexposed to small-cap
              23%                                                                       companies. We will continue to
                                                                                        look at the mega cap space for
                               20%
20%                                                                                     potential opportunities but do
                        16%                                                             not think that the underexposure
                                                                                        poses a major issue.

10%
                                                                            3%

0%
       Small (2B>)     Mid (2-10B)         Large (10-200B)          Mega (200B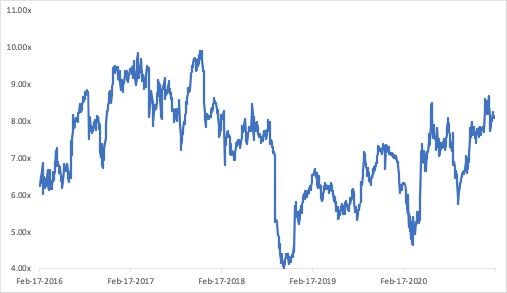
Pitch Log Since Dec 2020 Meeting
                                  Internal Pitches Since Dec 2020 Meeting
                        Company                 Stage                  Date       Analysts
1 At Home Group                             Quick Screen              2/2/21    Caleb Nuttle
2 Alico Inc                                 Quick Screen              2/2/21     Cody Fang
3 Daily Journal Corp                        Quick Screen              2/2/21     Tony Wang
4 Vapotherm                                 Quick Screen              2/2/21    Srikar Alluri
5 MasterCraft                               Quick Screen              2/2/21     Sophie Pan
6 At Home Group                              First Update             2/9/21    Caleb Nuttle
7 BJ’s Wholesale                            Quick Screen              2/9/21      Vinny Ye
8 Match Group                                First Update             2/9/21    Simran Korpal
9 Diamond Hill                              Quick Screen              2/9/21     Tony Wang
10 MasterCraft                               First Update             2/9/21     Sophie Pan
11 Daily Journal Corp                        First Update             2/9/21     Tony Wang
12 Diamond Hill                              First Update             2/16/21    Tony Wang
13 At Home Group                            Second Update             2/16/21   Caleb Nuttle
14 SiteOne Landscape                        Quick Screen              2/16/21    Achyut Seth
15 BJ’s Wholesale                            First Update             2/16/21     Vinny Ye
16 Match Group                              Second Update             2/16/21   Simran Korpal

                                              Active Pipeline
                        Company                 Stage                  Date       Analysts
1 Match Group                               Second Update             2/16/21   Simran Korpal
2 Daily Journal Corp                         First Update             2/9/21     Tony Wang
3 MasterCraft                                First Update             2/9/21     Sophie Pan
4 SiteOne Landscape                         Quick Screen              2/16/21    Achyut Seth

                                            Oversight Meeting
                        Company                 Stage                  Date       Analysts
1 At Home Group                             Second Update             2/16/21   Caleb Nuttle
2 Diamond Hill                               First Update             2/16/21    Tony Wang

                                       III. Performance Analysis                                6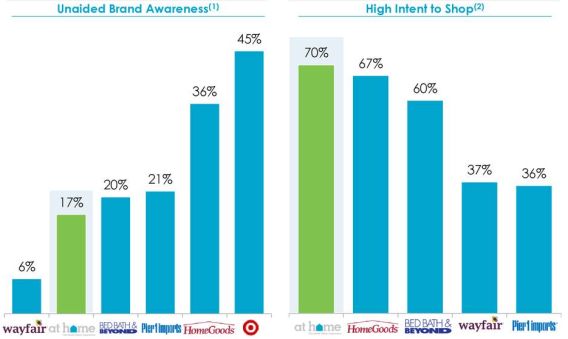
III. Key Holdings Update

                           7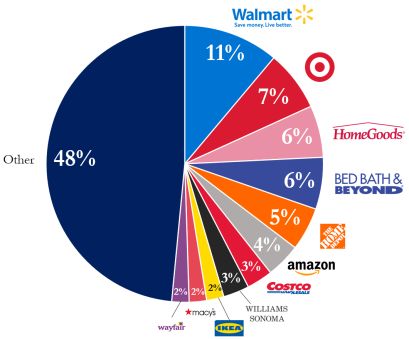
Portfolio Updates Since Dec 2020 Meeting
  Company         Ticker                                             Update

                           We propose to hold our stake in Allison Transmissions (ALSN), currently down 10.2% from
                           our cost basis of $47.42. The company has been significantly impacted by the pandemic with
                           Q3 NA on Highway volumes down 24% and a 9% decrease in the replacement parts and
                           retransmissions business. Monthly US class 6-7 on-highway volumes were trending upwards
                           towards the latter half of 2020 with 7.5% retail sales growth in October (month over month) vs
                           4.8% in August and 4.6% in September. Additionally, the company has continued to develop
Allison                    its next generation e-axle technology although management believes that the adoption of EV’s
                  ALSN
Transmissions              in NA on highway should occur in 2024 or 2027 along with the next wave of emissions
                           standards. In regards to municipal spending, the company highlighted comments from Blue
                           bird stating that 25% of US school buses are >15 years old – the legal maximum age for school
                           buses in many US municipalities. Overall, while the company has been materially affected by
                           the pandemic, the stock holds strong reflecting increased Class 8 metro and Class 4-5
                           penetration (7% and 16% respectively) and strong international expansion opportunities. With
                           ~20% of revenues tied to municipal spending, the thesis still holds in a post-COVID world.

                           Not much has materially changed since opening the position four months ago. The company
                           announced a series of small acquisitions in the late fall of last year totaling about $300M. As
                           we look forward, the company hints at larger acquisitions and we are waiting to see the
APi Group          APG     progress of that. Greater focus on the European market is interesting as the company claims
                           the European market is even more fragmented than the United States. The company has a
                           large amount of cash on the balance sheet with $750M as some of the warrants from the SPAC
                           transaction have been cashed in.

BorgWarner        BWA                                         Sell note in the packet.

                           We propose holding our stake in CVS Health Corp (CVS), which is currently down 9% from
                           our cost basis of $77.3. Not much has changed since the last update in December. In regard to
                           the Amazon effect, it was recently announced that Haven Healthcare, a joint venture between
                           JP Morgan, Berkshire Hathaway, and Amazon focused on lowering costs for U.S employees, is
                           shutting down at the end of February, which could be most likely attributed to leadership
                           issues and different goals. Although Amazon will continue to pose a threat, this supports how
                           CVS is still able to maintain a defensive business model in a highly competitive and regulated
                           industry. Moreover, the fundamentals of the business have not changed and valuation is
CVS Health Corp    CVS
                           attractive at current discounted multiples. Management aims to delever until it can reduce
                           debt to about 3x, so EPS growth should improve in 2022 when it can reinitiate its share
                           repurchase program. While Aetna continues to contribute to top-line growth and CVS expects
                           to deliver on its $900 million run-rate synergy target by the end of 2021, management also
                           expects to open 1,500 HealthHub health clinics by end of 2021, which could bolster foot traffic
                           at retail stores. Although margin pressure is likely to continue in the near future, we are
                           confident that CVS will be able to maintain its dominant position in the industry and expand
                           market share.

                                          III. Key Holdings Update                                                 8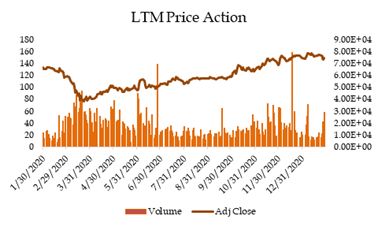
Portfolio Updates Since Dec 2020 Meeting
   Company       Ticker                                              Update

                          We propose holding First Energy at $31.9. Since July 17th, 2020, First Energy has been under
                          investigation on potential corruption and racketeering charges tied to House Bill No.6 which
                          provided subsidies to Energy Harbor (Nuclear Power Plant for First Energy). The company is
                          investigated for funneling 61 million dollars through a non-profit to House Speaker of Ohio.
                          The non-profit has recently taken a plea guilty to federal racketing and this could have
                          implications on First Energy. While the direct impact to the company may be small given only
                          20% of their operations are in Ohio and most of their contracts are fixed till 2024, the indirect
First Energy       FE
                          impacts are much more uncertain and difficult to calculate. However, the market is pricing in
                          far too great of a drop due to the uncertainty and looking at historical precedent we believe the
                          company can recover. Additionally, the company has continued to shift from their
                          unregulated business to move towards the regulated utilities side which has provided
                          additional stability in earnings. Management has also stated that they plan to continue their
                          dividend plan as is with a payout at roughly 59%. Looking at the core business, it is
                          functioning well and growth for the next few years is expected to be 6-8% growth.

                          GO now expects 34 store openings vs our current estimate of 28, highlighting the strength of
                          the business development team that manages through the time of pandemic. Hire of new EVP
                          of East Region to accelerate development of east coast infrastructure. Management further sees
                          opportunities to continue expansion in the southern California region and in East coast
                          Pennsylvania / New Jersey, where there are strong real estate pipelines.

                          New development of store level inventory APIs to localize inventory management, allowing
                          store managers to adjust their inventory level according to the buying pattern of local
Grocery Outlet    GO      customers and dynamically features deals or strategies that reduce over stocking and
                          stock‐outs. This is especially important for discount retailers that are selling goods with close
                          expiration dates, potentially delivering a positive impact on its GO’s margins in the long run.

                          There have been concerns about GO’s slower recent comps vs. conventional retailers, partly
                          attributed to an acceleration in e-commerce. However, we continue to hold our view that GO
                          is 100% e-commerce proof due to its discount pricings and location in lower-tier cities. There
                          has been modest de-leveraging from 2.8x to 1.9x net debt / EBITDA. Our updated price target
                          is $57.40 (~40% upside)

                          Recently, the company has been handling the second wave of Covid-19, but this time, the
                          business has better adjusted to it and been able to do more complex medical procedures. The
                          company has been able to decrease the leverage ratio and is looking to expand by spending
                          $3bn on potential acquisitions as well as new construction in hospitals, surgery centers, and
                          rehab facilities. At current valuation levels, it does appear a little higher than the historical
HCA               HCA     average, but it is fine as the company has a long runway to growth. Continued pain by smaller
                          hospital operators may create attractive consolidation prospects in some markets. Looking
                          forward, we do hope for a return to normal at the end of the year, and a full return of surgical
                          procedures. With regards to the initial thesis on the political pressure, we see most of the
                          potential for short-term large reform as muted, but we are monitoring the continued push by
                          CMS for pricing transparency. We propose a hold on this position as our thesis remains intact.

                                         III. Key Holdings Update                                                   9
Portfolio Updates Since Dec 2020 Meeting
Company Ticker Update
Since our last meeting, INVE has appreciated substantially and we are currently sitting 60%
above our cost basis. While I haven’t pinpointed the reason for last week’s rally, it does seem
that RFID growth is finally getting priced in. Identiv took out a term loan and two promissory
notes over the past 12 months to fund its RFID expansion. The business has prematurely
retired the term loan and one promissory note (total principal paydown of $5.7mm); the
announcement on December 30 sent shares up ~6%. This early deleveraging indicates the
strength of RFID sales over the period, as well as confidence that future growth can be funded
by CFFO. I’ve reached out to a fund that is also long to see if they had uncovered anything I
Identiv INVE missed. I will update if they reply.
Quick recap of the thesis: Identiv was a small-cap, money-losing business operating at ~50%
capacity. However, underlying NFC adoption trends and supply-side advantages could
clearly push this business to scale. Sell-side frankly didn’t really understand the scope of this
opportunity, especially given the fact that a major competitor (Smartrac) had recently left the
space. We are betting that the business will expand EBIT margins to 15-25% from the RFID
sales ramp. Identiv also presents itself as an attractive acquisition target. Neither of these
points have been fully substantiated but we seem to be well on our way.
We propose to hold out stake in Office Properties Income Trust (OPI), currently up 41.5% from
our cost basis of $17.73. The stock has reacted positively to vaccine news, reflecting the
market’s anticipation of and end to work from home in the near future. Pursuant to that belief,
rent collections have remained strong with OPI collecting 99% of contractual rent. Going
forward the expectation is a 25% decrease in AFFO pushing the payout ratio from ~50% to
~80% with the company seeking a 75% payout ratio. Management has also hinted that
Office Properties
OPI occupancy should be meaningfully lower in 2021 with two large move outs (20 Mass Ave in
Income Trust
DC and IRS in Fresno). The company is expecting 7% of its ABR to be vacated in 2021 and the
story is now the company’s ability to release its assets. Additionally, the company’s capital
recycling plan also looks to resume with OPI selling off a $130 million property in Richmond,
VA in January after acquiring a $15.3 million property in Georgia in Q3. Despite ongoing
headwinds, the ~12% dividend yield looks to continue to remain intact and despite a short-
term pop, the company remains attractive from a dividend perspective.
III. Key Holdings Update 10Portfolio Updates Since Dec 2020 Meeting
Company Ticker Update
Several months ago, we added PANW into our portfolio as a strong incumbent in Network
Security (with 7w+ installed customers, still adding approx. 3000 per quarter) expanding into
the next generation of cybersecurity products, specifically cloud/hybrid, endpoint, and
analytics, through a delicate and well-executed M&A strategy. We believed that this active
expansion plan allows PANW to enter the larger TAM and faster-growing security markets,
leveraging the synergies that exist between its product portfolio. The stock closed at $379.8 as of
last Friday, yielding a 55% gain since our entry. From a 6-month price movement perspective,
PANW has outperformed its incumbent peers, Fortinet and Check Point, but underperformed
the new security peers. Nevertheless, this is clear evidence that investors are starting to
appreciate the expansion strategy that PANW is implementing. The past two strong quarters
Palo Alto with consistent strong growth in Next Gen. products (25% of total billings, 53% growth, whole
PANW
Networks ARR guidance=$1.15B as of Q1FY21) has boosted investors’ confidence in those new offerings
and proved PANW’s ability to executed its M&A strategy. A re-valuation process is underway.
Moving forward, we believe PANW remains a safe and profitable investment in the medium-
to-long term. Fragmented as it is, cybersecurity is a large market with growing importance
within a digital and inter-connected world. Growth in key industry segments will drive value
accretion to players with strong positions in those verticals. ZS, CRWD, VMW, MSFT, PANW
are all potential beneficiaries, but PANW’s dominance in Network Security and the breadth of
its product portfolio is especially unique. We reiterate the story as presented in the original
pitch: 1) Powerful and strengthening position in legacy market with large installed base; 2)
Transition to next gen. security through cross/up-selling kindles new era of growth; 3) Margin
expansion by selling higher-margin offerings and through M&A synergies.
Since our last meeting, Points has reported preliminary Q4 and full year results. Gross profit is
expected to fall in the $34.8-35.2mm range (down 46% YoY). The business is ~adjusted EBITDA
positive~. More importantly, total funds available (cash/equivalents and funds payable) is
$79mm, up from the 68mm in Q3. The business has amended covenants to guide on minimum
adj. EBITDA and liquidity through Q2 FY21. Points had previously drawn $40mm from its
credit facility and has since paid down $25mm ($15mm of which was in Q4, a promising trend).
There was sequential gross profit improvement of 50% in Q4 due to increased promotional
Points
PCOM activity by airline clients and also new business won through the Amadeus IT partnership. I
International
think it is interesting that the business is still winning partners in this environment. I will have
to look further into this IT partnership. As a side note, I’ve spoken with an analyst who’s hyper
bullish and believes that PCOM is an acquisition target for a business like ICE (I don’t really
buy this but thought it was interesting to bring up). Obviously, the easy money has been made
already, but the business is still decently cheap relative to our bull case (which seems to be
materializing). Further, the balance sheet is still quite clean. KPI’s to watch include major airline
RPM’s, hotel nights booked, and daily new cases in key geographies.
We propose a hold in our stake of Recro Pharma, although we remain concerned about various
risks such as management not being fully aligned with shareholders. However, we are
confident in REPH as a going concern and given the current investor sentiment relative to our
business development expectations, we remain a hold on this position. According to the
Recro Pharma REPH
company, Clinical Trial Materials (CTM) and Logistics Services launched in Q2 seeing positive
results. The company has been able to expand its business development team and continues to
win contracts. We would like to see short term catalysts like these play out before potentially
selling.
III. Key Holdings Update 11Portfolio Updates Since Dec 2020 Meeting
Company Ticker Update
We propose holding our position in TransDigm at 571.85 USD, a current return of 58.7%. Since
our last meeting, TDG published Q1 earnings and while the results were significantly worse
on a year over year basis, we are happy with the performance given the tough environment.
Additionally, as TDG has little control over the general commercial aviation space, they are
focused on the three areas where they do have control: cost cutting, liquidity,
M&A/Divestitures. On the cost cutting front, TDG was almost able to maintain their margin
profile on half the revenue base and considering the substantial scale implications, we expect
TransDigm
TDG some of these cost savings to be more permanent. In regard to liquidity, TDG raised an
Group
additional 1.2B USD in senior subordinated bonds in order to fully repay the 6.5% senior
subordinated debt. This was initially meant as an additional liquidity injection but given that
the environment is beginning to improve, management decided to paydown debt. Lastly, TDG
divested several Esterline businesses that were nonproprietary/non aviation in order to keep
their proprietary revenue at ~90%. Overall, we believe that this is a better business than it was
last oversight and when we bought into the position.
United Rentals has recently closed out their FY’ 20 and reported Q4 earnings. Overall, the
performance was well received by the market, with the company beating on both revenues
and EBITDA. The company reported $2.3B in Q4 revenue, beating consensus by 5.3%, and
Adj. EBITDA of $1.04B, beating consensus by 5.9%. Simple earnings figures aside, the
quarter’s performance raised a few questions and flags for investors. Firstly, EBITDA margins
came in at 45.5% (a 1.5% decrease from Q4’19), and gross margins on equipment declined by -
2.9%, decreasing for the 8th consecutive quarter. As for management guidance, sales YoY
United Rentals URI estimates seem to have been the only positive development, with management projecting
further pressure on EBITDA in 2021. There was also room for some continuing optimism,
however. Liquidity at the end of the year was ~$3.1 billion, with the company’s net leverage
ratio at ~2.4x. Fleet productivity similarly saw an improvement from Q3’20. This quarter, fleet
utilization declined -3.8% YoY, but when compared to Q3’s -8% YoY, the company is clearly
making up ground. Management also has been floating around the idea of continuing their
M&A strategy in 2021, as the company has significantly improved its financial leverage
position. Overall, I recommend holding the position.
III. Key Holdings Update 12Portfolio Updates Since Dec 2020 Meeting
Company Ticker Update
To revisit, XPO will reorganize into two parts in 2H21 per December announcement:
• NewCo: pure-play contract logistics. Long-term contracts with blue chip customers – high
revenue visibility, with growth levers such as outsourced e-commerce fulfillment.
• RemainCo: LTL, freight brokerage (original roll-up), and others, of which the former two
make up 90% of EBITDA.
• Asset-heavy business: Third-largest LTL operator with top-notch and still shrinking
operating ratio (to reach ~$1B in EBITDA in 2022)
XPO Logistics XPO • Asset-light business: the initial roll-up, now the second-largest freight broker with a
digital brokerage market place with the fastest carrier adoption rate in the industry
(mid-teen revenue growth in 2020).
On a SOTP basis, XPO currently trades at 9.6x 2021 EBITDA, which is below non-unionized
LTL (15.3x), contract logistics (11.2x), and freight brokerage (13.1x) peer groups. Assuming
closure of valuation gap, we are sitting with 30%+ upside post-spinoff. I incline towards
holding the LTL business post-distribution and potentially selling the contract logistics spin-
off, subject to valuation in 2H21.
We propose to hold our stake in ZTO express. During the past quarters, we’ve seen intensified
competition in the delivery industry, partly due to emerging new competitors such as J&T.
Ticket price deviated from volume growth, and thus profit growth deviated from revenue.
However, we do not believe this level of competition is sustainable because 1) the operating
cash flow of Tongda peers does not support further leverage increases to make capital
ZTO Express ZTO investments, and 2) the new entrants will need significant investments to truly scale their
businesses. In the long run, the consolidation story remains intact that a 30% - 40% market
share player will emerge from the price competition as tail players exit the market. In addition,
ZTO is increasing investment in its international business, which we believe bodes well for
additional opportunities. Despite some short-term headwinds, ZTO is still on track to become
the future monopoly and drive compounding stock gains.
III. Key Holdings Update 13IV. Update Notes
14Buy Note: Methode Electronics (NYSE: MEI)
Dear Board of Advisors,
We would like to add to our portfolio Methode Electronics, a global manufacturer Stock Overview (LTM)
and supplier of electrical, radio remote control, electronic, LED-based lighting,
wireless, and sensing technologies to the automotive, white goods, and broader Last
industrial markets. Since the last meeting, the company reported strong earnings in Current:
Meeting:
its latest quarter (Q2 FY’21), displaying strength in its automotive segment that Share Price: $35.32 $38.76
aligns with key strategic initiatives, such as EV exposure. Despite strong
fundamentals, MEI continues to trade below historic multiples (~8-9.5x EV/EBITDA 7.7x 7.6x
EV/EBITDA) and the industry median (10.6x EV/EBITDA), which makes current EBITDA
valuation an attractive entry point to buy shares. 19.3% 20.4%
Margin
Net Income
Thesis #1: Misunderstood Competitive Dynamics of a Highly-Specialized 12.3% 13.2%
Margin
Supplier with Strong Fundamental Automotive Business: In a highly competitive
space, MEI focuses on operating in niche product spaces that are less competitive,
and then expanding its market share by consolidating and specializing. Not only is Fig. 1 – 5 Yr Forward TEV/EBITDA
MEI recognized as a “one-stop shop for LED lighting solutions, integrated interfaces, and
sensors”, but MEI is aggressively expanding its product offerings within lighting
solutions with the past two acquisitions. Despite suppliers to OEMs suffering from
margin erosion of up to 5%, MEI is able to vertically integrate & currently maintain
industry-leading margins for its automotive segment. MEI’s fundamentally strong
automotive business can capitalize on several tailwinds that can boost top-line
growth: auto OEMs ramping up production, growing $ content/vehicle, and EV
exposure (expected to be >10% of sales by FY22).
Thesis #2: Strength of Non-Automotive Segments and Accretive Acquisitions
Not Fully Reflected in Price on Multiples Basis: Despite >70% of MEI’s annual
sales coming from its automotive segment and its two largest customers (GM &
Ford) contributing ~35% of total sales, earnings and margins aren’t as significantly Fig. 2 - EBIT Margins
impacted by headwinds of auto industry as the market expects. Much of this is
attributed to the fast-growing industrial segment that grew 21% YoY and is now a
fundamentally higher-margin business than MEI’s automotive segment.
Furthermore, along with opportunities to cross-sell products, management expects
its industrial segment to continue seeing margin improvement between ’20-’22 from
acquisitions that should reduce the company’s dependence on its automotive
segment.
Latest Earnings Update (Q2 FY’21): MEI reported record sales of $301 million and
record EBIT of $45 million, with 17% increase in net sales, 62% increase in net
income, and 60% increase in diluted EPS YoY. The recovery of the automotive
industry is reflected in the company’s record automotive segment sales (up 20%
YoY), with much of the organic growth coming from Asia that is seeing production Fig. 3 - Latest Earnings
ramping up in light vehicles. Furthermore, our thesis point of MEI tapping into EV
exposure with its recent acquisitions in order to increase top-line growth is evident
by EV sales representing >9% of Q2 consolidated sales. Management continues to
be confident of achieving $300 million in EBITDA by FY’25 with a new 5-year long-
term incentive plan, with non-automotive segments also displaying strength in
demand, especially industrials (4% sales growth YoY) and user interface (38% sales
growth YoY).
Since last board meeting, MEI’s stock price has appreciated 8%. Ultimately, the
fundamentals of MEI have not changed, with specialization, operational efficiency,
and synergies driving growth in earnings and margins. At current valuation, we
continue to be confident in MEI’s ability to create upside.
Best,
Achyut Seth
IV. Sell NoteSell Note: BorgWarner (NYSE: BWA)
Dear Board of Advisors,
We would like to propose selling our stake in BorgWarner at Stock Overview
around $45 a share, representing 19% upside. After reviewing the At Purchase Current:
company’s prospects and the latest industry challenges, as well as
Share Price: $38 $45
given that our portfolio is heavily weighted toward the industrials
sector, we believe it is right time to exit the position. EBIT Margin 12.3% 10.1%
Net Debt $1.37B $715M
BWA has proved to be resilient this year with COVID and has EV/EBITDA 5.4x 5.9x
pushed cost-saving initiatives to led to strong beats in earnings.
However, our initial investment theses will mostly be overlooked
by long term negative macro trends and the uncertainty of the
acquisition. Our rationale to exit the position includes: BWA Performance Since 03/2019
Thesis Point 1: Internal combustion engine business is expected to 50%
capitalize on rising demand for fuel economy (Partially Realized): 40%
Original expectation is that BWA’s engine segment – particularly 30%
fuel-efficiency products such as turbochargers – will benefit from 20%
10%
near term demand as regulators pressure OEMs to reduce CO2 0%
emissions, differentiating from the market’s view that the industry -10%
is dying. However, while the segment was resilient prior to the -20%
Pandemic, current diesel and sector production headwards have -30%
caused BWA to greatly miss out on this opportunity. It would take -40%
2-3 years for the whole auto sector to return to pre-COVID -50%
-60%
production level; the effects of this regulatory tailwind would be
much limited by then. BWA S&P 500
Thesis Point 2: Strengthening position in the hybrid market
(Realized): This segment has been very promising, as BWA
continues to secure and win across multiple Hybrid architectures
and products in both Asia and Europe. However, with the Hybrid
era shrinking as OEMs shift their focus toward EV development, we
expect the value of this segment to diminish over time.
Thesis Point 3: Future M&A efforts to expand electric vehicle
segment (Not Realized): BWA indeed made an acquisition to
strengthen its EV segment, but it was much different than we
expected. The magnitude and the cost of the Delphi acquisition
created lots of uncertainty ahead. It would take a long time for the
two companies to successfully integrate, and BWA’s growth and
margin profile will clearly be impacted by Delphi in the near-term.
With the threat of major OEMs insourcing electrified powertrain
becoming more notable, BWA’s long-term success in this segment
remains an open question.
Best,
Larry Wang and Chen Zhou
IV. Sell NoteSell Note: BorgWarner (NYSE: BWA)
BWA Model Update
2020E 2021E 2022E 2023E
EBITDA
BWA - Engine 757.4 1,004.4 1,241.0 1,303.5
BWA - Drivetrain 384.4 548.0 620.8 670.7
DLPH 306.2 443.0 507.0 480.0
Total EBITDA 1,448.0 1,995.4 2,368.7 2,454.2
Applied EV/EBITDA Multiple
BWA - Engine 6.0x 6.0x 6.0x 6.0x
BWA - Drivetrain 7.0x 7.0x 7.0x 7.0x
DLPH 6.5x 6.5x 6.5x 6.5x
Enterprise Value
BWA - Engine 4,544.2 6,026.2 7,445.7 7,821.3
BWA - Drivetrain 2,690.7 3,836.3 4,345.3 4,694.9
DLPH 1,990.6 2,879.2 3,295.4 3,120.0
Total EV 9,225.5 12,741.7 15,086.4 15,636.2
Synergies Schedule
SG&A + Procurement - 37.5 75.0 125.0
% Realized 0% 30% 60% 100%
NPV @ 15% - 142.6 237.7 330.2
Enterprise Value 9,225.5 12,741.7 15,086.4 15,636.2
(+) PV Synergies @ 15% - 142.6 237.7 330.2
(-) Total Debt 5,147.0 5,147.0 5,147.0 5,147.0
(+) Cash 2,553.0 2,553.0 2,553.0 2,553.0
(-) Minority Interest 284.0 284.0 284.0 284.0
Total Implied Equity Value 6,347.5 10,006.3 12,446.1 13,088.3
Shares Outstandings
BWA shares 207.3 207.3 207.3 207.3
Additional shares issuance 94.0 94.0 94.0 94.0
Total Expected shares outstanding 301.3 301.3 301.3 301.3
Equity Value / Share $21.07 $33.21 $41.31 $43.44
Implied Upside / (Downside) -53% -26% -8% -3%
IV. Sell NoteV. New Position Proposal
18At Home Group Inc. (NYSE: HOME)
Turning Lemons into Lemonade; Fractured Industry Creates Tailwinds for Value Retailer
Caleb Nuttle
Senior Analyst
Caleb.Nuttle@stern.nyu.edu
Price Target: $29.76 - $33.34 (23.72% - 38.61%) February 17th, 2021
Business Description:
Key Ratios and Statistics:
At Home Group is a home décor superstore retailer, founded and based out of Plano
Texas. The company was originally founded in 1979 as “Garden Ridge Pottery”, but
Recommendation Buy/Long
was renamed and turned around in 2014, following AEA Investors – a private equity
firm – acquiring the company in 2011. At Home currently operates 222 locations Price Target $29.76 - $33.34
across 40 states, but most of their locations are primarily clustered in the Midwest, Implied Return 23.27% - 38.61%
and South-East. Additionally, the store locations which At Home uses are Share Price (2/17/21) $24.05
significantly larger than most comparable retailers, at an average of 105,000 sq. ft. per Market Cap $1.56 B
store, using a warehouse format, similar to Kirkland or IKEA. This format obviously 52-Week Low $1.20
requires more real-estate, which is why At Home locations are primarily located in 52-Week High $28.44
or nearby suburban shopping-centers. Alongside the warehouse retail format, the
company positions itself as a “value” player within the home décor industry, with an Figure 1 – (HOME) 52-Week Stock Performance
average item price of $15. Revenues in FY’20 were 53% Accent Décor (i.e., candles,
pillows, vases, artificial flowers, etc.) and 47% Home Furnishings (i.e., mirrors, rugs, At Home Group. (NYSE: HOME)
52-Week Performance
wall art, etc.). $30
$25
Business Quality:
$20
• High ROI on New Store Locations: At Home has expanded very quickly over
the past 7 years, growing store counts from 58 to 220, representing a CAGR of $15
~21%. The reason for this expansion has to do with the attractive ROIs on new $10
store locations. New stores require between $4 - $5 million of upfront investment $5
when leased (or $2 - $3 million if built by the company with a sale lease-back), $0
and typically mature within ~6 months from opening. Additionally, the average
payback period on these locations have historically been 2 ½ years if leased, and
less than 1 ½ years if built. The average mature At Home location generates Volume Price
~$6.4 million in revenues a year, at an EBITDA margin of ~27%. Management
slowed new location expansions in 2020, due to COVID headwinds and debt Figure 2 – Map of At Home US Locations
concerns (discussed in detail below), but following a quick rebound this
summer, they anticipate continuing growing store count at ~10% per year.
• Private Label Products: Over 70% of the products which At Home sells in a year
are “private label”, meaning that the company works with manufacturers both
domestically - ~35% of merchandise – and internationally – primarily coming
from China, India, Vietnam, and Turkey – to source unbranded, higher margin,
products. On average, private label products generate 25-30% higher margins
than standard 3rd party manufacturer brands. Additionally, as of Q3’21, the
company directly sources ~15% of inventories.
• Warehouse and Distribution Strategy: At Home operates a leaner inventory
management and distribution strategy than other home décor competitors. The
company currently operates two distribution facilities, one in Plano, Texas and
the other in Carlisle, Pennsylvania. These DCs operate as cross-dock facilities,
with the entire supply chain holding no inventory (i.e., no warehouses). This is
because the warehouse style retail format allows At Home to quickly restock Figure 3 – At Home Store Expansion Historically
inventories with less manual touchpoints than direct competitors. With the two
DCs, At Home’s management believes they can service up to 350 locations. At Home Store Count
• Superior End Market Experience: At Home is popular within their end markets, 250 212 222
Number of Outlets
raking high in consumer surveys for Home Décor, and has seen strong results 225 CAGR: +20.98%
200 180
this past year in growing their “insider perks” member base. As of Q3’21, the 175 149
company has over 8.3 million registered members, up 27.7% this past year. This 150 123
popularity has translated to an organic annual comparable growth rate per store 125 100
100 68 81
is ~3% per year historically, once the stores enter maturity – i.e., 16 months after 75
58
opening. The average At Home customer’s basket size is ~$75, and despite the 50
25
fact that they operate as the value player within the fragmented industry, they 0
do not heavily rely on steep item discounts to clear inventories (such as BBBY or FY' 13 FY' 14 FY' 15 FY' 16 FY' 17 FY' 18 FY' 19 FY' 20 LTM
Pier 1). Roughly 80% of products are paid at full price. Existing Locations New LocationsIndustry Drivers: Figure 4 – Home Furnishings Market Share
• Fragmented Industry: The home furnishings/décor industry is fairly
fragmented among several large retailers. The space can largely be split into
three main groups of competitors to At Home. The first are the specialty home
décor retailers (e.g., Bed Bath & Beyond, The Container Store, Home Goods, etc.),
the second are the club retailers (e.g., IKEA, Costco, Walmart), and the third are
the online retailers (e.g., Amazon and Wayfair). The most direct competitors to
At Home are these specialty home décor stores and Wayfair. The other large
outlets generally dedicate only a small portion of their store space to home
furnishings, and generally focus on only the most popular products. The retail
furnishings industry generated ~$117.8 Billion in revenues for 2019.
• Suburban Housing Boom: US new home sales have garnered a lot of attention
over the past few months, as COVID has pushed a large number of families to
move from densely populated cities into the nearby suburbs. This shift greatly
increased new home starts and sales to reach levels higher than ’08 and has been
Figure 5 – Furniture and Home Furnishing Revenues
a significant tailwind behind the broader home décor industry. The US Census
Bureau publishes monthly data on new home permits, starts, completion and
Furniture & Home Furnishings Retail US Revenue
sales (Fig. 6), and 2020 has seen new home sales increase by ~18.7% YoY, with (1992-2019)
over 9.76 million new homes being purchased. While the longevity of this trend $125
is still unknown, it has created a large opportunity for smaller residential players
$100
(such as At Home) to grab market share.
$75
Investment Thesis:
• Significant Whitespace Opening Up Within the Home Décor Industry: 2019 $50
was undeniably a very poor year for At Home. The company was experiencing $25
and reporting negative same-store comparable revenues for the first time in their
$0
history and closed the year out at a -4.9% YoY same store revenue growth. The
market strongly punished the company during this time and pushed the stock
down over 75% during the year. However, this disappointing performance was
largely attributable to the flash fire sales and steep discounts At Home’s
Figure 6 – US New Home Construction and Sales
competitors (namely BBBY and Pier 1) were offering, often times taking losses
to clear their old inventories. These steeply discounted prices directly impacted
US New Home Permits, Start, Completions, Sales
At Home’s “value” positioning, as they lost order volume, a risk which comes (2013-2020)
from operating at the lowest rung of the industry. However, COVID has actually 1,750
cleared the industry of these underperforming retailers, creating lower volatility 1,500
# Homes (millions)
for At Home’s pricing power going forward. With Pier 1 Imports filing for 1,250
Chapter 7 bankruptcy in May 2020 (closing ~1,000 locations in the process) and 1,000
Bed Bath and Beyond closing ~200 locations, At Home is well positioned in their 750
local markets to fill the demand vacuum. Management previously reported that 500
over 90% of At Home locations are within 6-miles of a Pier 1, and my own 250
research has found that of the ~200 stores BBBY has closed (or is in the process 0
2013 2014 2015 2016 2017 2018 2019 2020
of closing) 10% of At Home locations will be losing their closest BBBY
competitor. Permits Starts Completed Sold
• Resistance to Online Retail Threat: At Home’s value positioning is additionally
attractive in this industry, in that it provides a cost barrier to online retailers. Figure 7 – At Home Comparable Store Sales YoY
Generally, since At Home retails their products for ~$15, it become unprofitable
for shippers such as Wayfair and Amazon to match or beat them on price. Since
At Home Comparable Store Sales YoY
At Home generally sells larger and bulkier items that are pre-built (i.e., wall (CY 2016-2019)
décor, mirrors, rugs), the shipping costs are quite high. It costs Amazon ~$5 - $8 10.00%
in shipping costs per package to deliver these bulkier items, and it is reasonable 8.00%
to assume similar rates for Wayfair. While Amazon will often eat these costs by 6.00%
offering free shipping, Wayfair will actually offload $4.99 in shipping on to the 4.00%
consumer if your order in under $35. Either way, shipping costs eating between 2.00%
33%-50% of margins on a cheap $15 product is very unprofitable for online 0.00%
retailers. This is why Amazon and Wayfair instead focus on bundling items -2.00%
together at lower per unit prices or by focusing on the premium end products, -4.00%
which cuts more into higher-end décor companies rather than At Home. Doing Q4 Q1 Q2 Q3 Q4 Q1 Q2 Q3 Q4 Q1 Q2 Q3 Q4 Q1 Q2 Q3 Q4
'16 '17 '17 '17 '17 '18 '18 '18 '18 '19 '19 '19 '19 '20 '20 '20 '20
a simple price check on a “standard” wicker basket shows the bundling pricing
strategy perfectly (Fig. 8).
• Room for Margin Expansion: There are several ways which At Home can
expand their EBITDA margins going forward, however I am choosing to focus
on two clear avenues which management has explicitly stated they will take.
First, the ongoing push to have more direct sourcing for At Home’s private label
goods will certainly push margins higher going forward, with management
estimating 1-2% higher EBITDA margins at their goal of 30% direct sourcing.Secondly, the opening of At Home’s 2nd distribution facility in PA marks the end
of a ~2-year corporate saga of the company being inefficient in their rollout of Figure 8 – At Home vs Wayfair Price Check
the facility, with several delays and additional “one-off” investments. However,
as the company begins to expand their store count further within the Eastern US,
the fixed costs of the facility will be more evenly spread across stores, lifting Company
reported gross margins. D
• Disciplined Management Going Forward: Up until recently there has been a
lot of concern surrounding At Home’s liquidity. The company was taken public
with significant leverage already on their balance sheet, and management fueled
their store count expansion primarily through new debt issuance. These
concerns came to a head during the Spring of 2020, as with weak retail sales and
illiquid inventory ballooning, the market feared bankruptcy. Luckily however Retail Price $21.99 $80.99
the company has come out of COVID and used significant amounts of its Per Unit Price $21.99 $20.24
operating cash flows to pay down and refinance its previous debt balance. The
company now sits at an all-time low leverage ratio, and management has
Figure 9 – At Home Leverage Ratios
signaled they intend to solely use operating cash flows to meet their 10% store
count growth rate going forward, signaling a change of tone from their
aggressive expansion strategy before.
6.0x
5.1x
Risks: 4.9x
Net Debt/EBITDA
5.0x
• Tariffs: One area of risk which has historically impacted At Home, is their
4.0x 3.2x
reliance on foreign manufacturers to produce their value-end private label 3.3x
2.9x 3.0x
products. While management has worked to diversify their supply chain away 3.0x
from China, the ongoing economic tension between the US and China is unlikely 2.0x
to abate even under the new administration. 0.9x
1.0x
• Strengthening Bed Bath and Beyond: At Homes impressive growth of market 0.0x
share has been driven by the ongoing struggles of the competitors such as FY FY FY FY FY FY LTM
HomeGoods and Bed Bath and Beyond. However, with the recent turnaround 2015 2016 2017 2018 2019 2020 Q3'21
strategy being employed by Bed Bath and Beyond, such as expansion into
private label products and heavy reinvestments into their supply chain, At
Figure 10 – At Home Brand Awareness Data
Home may soon face stiffer competition within their local markets.
• Reversion or Sharp Decline in Home Data: Many home décor companies have
been quickly adjusting their inventory levels to take advantage of the recent
spike in demand from new home sales, especially in the suburban areas. At
Home is no different in this regard, with management working to quickly ramp
up inventory purchases over this past summer. Should new home sales decline
sharply, or home décor demand prove to be less than expected, At Home may
be left with unclearable, low salvage-value merchandise.
Figure 10 – EV/NTM EBITDA At Home (2016-2020)
EV/EBITDA At Home (2016-2020)
25.x
20.x
15.x
10.x
5.x
0.x
Dec-18
Jun-20
Sep-16
Mar-17
Jun-17
Jun-19
Dec-16
Sep-17
Mar-18
Jun-18
Dec-17
Sep-18
Mar-19
Sep-19
Mar-20
Dec-19
Sep-20
Dec-20Business Overview
At Home Group Inc. History & Overview
At Home Business Overview
• At Home Group is a home décor superstore
retailer based out of Plano, Texas
• The company was founded in 1979, but was
turned around in 2014 by a group of private
equity investors
• Operate over 226 locations nationwide, utilizing
a warehouse style retail strategy
• Positions themselves within the fragmented
industry as a value player, with average item
prices of $15 and basket sizes of $75
At Home Store New Store ROI Metrics
• Above industry average store size, at 105,000
sq. ft. per location as of 2019
• ~$4-5 million in net investment for new Leases
• Average payback period of 2 ½ years
• 83% of new stores are leased at time of opening
• Typically mature in ~6 months
• The typical mature At Home location generates
~$6.4 million in revenues per year
• Store-level EBITDA margin of ~26%
• Typical organic same-store YoY growth rate
of ~3%, primarily driven by increased repeat
visits, in normal non-COVID & 2019 yearsBusiness Overview
2019 Comparable Stores and 2020 COVID Impact
$25
$20
$15
-60% +150%
$10
-71%
$5
$0
What Happened in 2019? COVID Impact
• 2019 was a tough period for At Home, as they • The initial liquidity fears from COVID disappeared
posted, for the first time, negative same store YoY after a very successful rollout of BOPIS during the
sales growth summer
• Management also cut guidance for their FY20 by • FY’21 estimated to close out at 25% topline
50% in one day growth
At Home Comparable Store Sales YoY At Home Revenue Growth & EBITDA Margin
10.0% 60%
7.5% 40%
5.0% 20%
2.5% 0%
EBITDA Margin %
0.0% -20%
Total Revenue
-2.5% -40%
Q4 Q1 Q2 Q3 Q4 Q1 Q2 Q3 Q4 Q1 Q2 Q3 Q4 Q1 Q2 Q3 Q4 Q1 Q2 Q3 Q4 Q1 Q2 Q3 Q4 Q1 Q2 Q3 Q4 Q1 Q2 Q3
'16 '17 '17 '17 '17 '18 '18 '18 '18 '19 '19 '19 '19 '20 '20 '20 '20 '18 '18 '18 '18 '19 '19 '19 '19 '20 '20 '20 '20 '21 '21 '21Industry Overview
At Home Historical Market Share Growth
Fragmented Industry
• The Home Décor industry is fairly fragmented
across three competitive “groups”
• The first, and largest, are the traditional mass
market retailers (i.e., Walmart, Target)
• The second, are specialty Home Décor retailers
(i.e., HomeGoods, IKEA)
• And the third are online operators (i.e., Wayfair,
and Amazon)
• COVID has significantly impacted the 2nd group,
opening “whitespace” for At Home to grow
At Home Market Share At Home Top Line Growth Comparison
• At Home has grown in Market Share over recent • Within the industry, At Home is the fastest grower
years, supported by store closures of competition on a top-line basis
Quarterly TAM Penetration (HOME Sales/ Industry) 2019 – 2022E Topline Growth
2.1% 60%
50%
1.8%
40%
1.5% 30%
1.2% 20%
0.9% 10%
0%
0.6%
-10%
0.3% -20%
0.0% -30%
Q1 Q2 Q3 Q4 Q1 Q2 Q3 Q4 Q1 Q2 Q3 Q4 Q1 Q2 Q3 Q4 Q1 Q2 Q3 -40%
17 17 17 17 18 18 18 18 19 19 19 19 20 20 20 20 21 21 21Industry Overview
Bed Bath & Beyond and Pier 1
Bed Bath and Beyond Pier 1 Imports
• Bed Bath and Beyond is the closest competitor to • Pier 1 filed for bankruptcy back in February 2020,
At Home, with a longer operating history and but later announced in May they would be
national footprint liquidating assets
• However, BBBY has been shuttering stores over • The company has been shutting down their 942
the past year store locations nationwide
• Management plans to shut down ~20% of their • Nearly 90% of At Home locations are within 6
stores (200 locations) by the end of 2021 miles of a Pier 1 store, and ~35% are within a
• The company has already announced ~150 mile
stores to be shuttered or are currently being • Management argued that Pier 1’s steep discounts
shuttered during 2019, was a primary reason for At Home’s
• ~10% of At Home stores will be losing their same-store comp. declines
closest BBBY competitor
Industry Competition Gradual Decline Even Pre-2020
Number of Home Furnishing Stores
(2017-2020)
48,000
47,500
47,000
46,500
46,000
45,500
45,000
Qtr1 Qtr2 Qtr3 Qtr4 Qtr1 Qtr2 Qtr3 Qtr4 Qtr1 Qtr2 Qtr3 Qtr4 Qtr1 Qtr2
2017 2017 2017 2017 2018 2018 2018 2018 2019 2019 2019 2019 2020 2020Valuation
Number of Store Locations
(Count of Operating Stores)
Upside Case 227 245 265 287 311
Base Case 225 241 259 279 301
Downside Case 224 238 254 272 292
Choice 149 180 212 225 241 259 279 301
New Store Locations
(# of New Stores)
Upside Case 15 18 20 22 24
Base Case 13 16 18 20 22
Downside Case 12 14 16 18 20
Choice 26 31 32 13 16 18 20 22Valuation
Valuation

                                                       Terminal Value
               23.72%      0.0%      0.5%      1.0%      1.5%      2.0%   2.5%   3.0%      3.5%
                 9.5%   -46.52%   -43.69%   -40.52%   -36.95% -32.90% -28.28% -22.95%   -16.73%
                 9.0%   -42.69%   -39.47%   -35.85%   -31.74% -27.05% -21.64% -15.33%    -7.87%
                 8.5%   -38.40%   -34.73%   -30.56%   -25.80% -20.31% -13.90%  -6.32%     2.76%
                 8.0%   -33.59%   -29.36%   -24.52%   -18.95% -12.44%   -4.75%  4.47%    15.75%
        WACC
                 7.5%   -28.13%   -23.22%   -17.56%   -10.96%    -3.15%  6.22% 17.66%    31.97%
                 7.0%   -21.90%   -16.15%    -9.44%    -1.52%     7.99% 19.61% 34.14%    52.82%
                 6.5%   -14.71%    -7.90%     0.15%     9.80% 21.60% 36.36% 55.32%       80.61%
                 6.0%    -6.33%     1.84%    11.65%    23.63% 38.61% 57.87% 83.55%      119.50%
                 5.5%     3.58%    13.53%    25.70%    40.91% 60.47% 86.54% 123.05%     177.81%
                 5.0%    15.45%    27.81%    43.26%    63.12% 89.60% 126.68% 182.29%    274.97%
                 4.5%    29.96%    45.65%    65.82%    92.72% 130.37% 186.86% 280.99%   469.26%

                                   Organic Same Store Annual Growth Rate (2023 Onwards)
               23.72%      0.0%      0.5%      1.0%      1.5%     2.5%      3.0%     3.5%   4.0%
                 9.5%   -58.07%   -53.93% -49.75% -45.52% -36.95% -32.59% -28.20% -23.76%
                 9.0%   -54.50%   -50.04% -45.53% -40.98% -31.74% -27.05% -22.32% -17.54%
                 8.5%   -50.42%   -45.60% -40.72% -35.80% -25.80% -20.73% -15.60% -10.43%
                 8.0%   -45.73%   -40.48% -35.18% -29.82% -18.95% -13.43%          -7.85% -2.22%
        WACC

                 7.5%   -40.26%   -34.52% -28.72% -22.86% -10.96%         -4.92%    1.18%  7.35%
                 7.0%   -33.81%   -27.48% -21.09% -14.63%       -1.52%     5.14% 11.86% 18.65%
                 6.5%   -26.07%   -19.05% -11.94%      -4.77%    9.80% 17.20% 24.67% 32.22%
                 6.0%   -16.64%    -8.75%    -0.78%     7.28% 23.63% 31.94% 40.32% 48.80%
                 5.5%    -4.86%     4.11% 13.17% 22.32% 40.91% 50.35% 59.89% 69.52%
                 5.0%    10.27%    20.62% 31.08% 41.65% 63.12% 74.02% 85.03% 96.15%
                 4.5%    30.42%    42.62% 54.95% 67.41% 92.72% 105.57% 118.55% 131.67%
Diamond Hill Investment Group, Inc. (NASDAQ: INVE)
Overcapitalized, underfollowed investment manager in harvesting mode
Tony Wang
Senior Analyst
akw401@nyu.edu
Price Target: $190.11 (31.54% Upside) February 19th, 2021
Business Description: Key Ratios and Statistics:
Diamond Hill Investment Group is a value-oriented, low-cost, multi-asset
investment manager with $26.4bn in AUM. The business runs 13 strategies, 9 of Share Price (2/17/21) $142.90
which are equities-based and 4 of which are fixed-income based, and generates Market Cap ($mm) $452.02
revenues from the associated fees (linked to AUM) for each account. Additional Enterprise Value $348.70
information regarding each fund’s respective performance can be found in the 52-Week Low $75.00
Appendix, but the majority of these strategies have outperformed their benchmarks 52-Week High $162.00
since inception. The business has a notable cap on AUM at $60bn for capacity Revenue (FY19) $136.62
reasons and has around 17% insider ownership. EBIT (FY19) $47.94
Investment Thesis: USD: mm 2018A 2019A 2020E 2021E
Underfollowed business with inflated multiples: As a small-cap equity with AUM 19,108 23,399 26,400 27,984
$1.9mm average daily trading volume, DHIL receives minimal institutional Revenue 145.63 136.62 127.65 151.11
scrutiny. With no sell-side analysts, no quarterly earnings calls, and bare-bones EBIT 71.26 47.93 38.73 52.89
investor relations, Diamond Hill’s common stock creates an opportunity to
capitalize on an underfollowed and mispriced asset. The large balances of cash Figure 1 – DHIL Price Action
and securities on the balance sheet also inflate the multiples (e.g. 13x LTM
earnings), meaning that the business does not screen well. The core operating
business netting out cash trades at 9x earnings. Furthermore, after netting out
the investments as well, the core business trades at 6x earnings. We believe that
these prices create an attractive level of downside protection. As the business
continues to whittle down its cash balances through dividends and buybacks,
the core operating business is a candidate for multiple expansion, given the
strong performance and track record of 6-9% annual AUM growth. However,
given the commoditized nature of this business, this optionality is not factored
into our models.
Increasing levels of distributable cash flow: Given management has ceased all
future openings of new strategies, increasing amounts of cash flow will be
returned to shareholders. Specifically, Diamond Hill has been approved for a Figure 2 – AUM History
quarterly dividend in October 2020. With the heavy insider ownership structure
and historical precedent (special dividends sequentially increasing for the past
5 years), we believe that incremental value will accrue to shareholders through
sensible capital allocation (opportunistic share buybacks and further special
dividends). Within the past two years, Diamond Hill has returned a combined
15% of its market capitalization through these initiatives. These cash flows
provide substantial protection against AUM outflows or future negative deltas
in the business’ take rate.
Institutional Consultancy AUM Growth (OTM Call): Diamond Hill has taken
on numerous initiatives to win institutional consultancy business (essentially
managers for university and hospital endowments). While this share gains are
low-visibility for aforementioned reasons, these clients could meaningfully
impact future AUM balances. Such clients prove quite sticky and Diamond
Hill’s established performance track record and industry-leading expense ratios
make for compelling value propositions. Regarding general AUM flows, the
business’ client composition is quite diversified across several distribution
channels, mitigating a portion of the redemption risk associated with asset
managers. Finally, even projecting 10% annual declines and -1 basis point delta
for the next 5 years, our conservative valuation would imply 9% downside.You can also read