Children's homes commissioning plan
←
→
Page content transcription
If your browser does not render page correctly, please read the page content below
Children’s homes commissioning plan
                 Authors: Kirsty Barrett, Ann James and Joanna Roberts

Services for children and young people

                                           1
Contents
1. Introduction ............................................................................................................ 4
1.1 Background ....................................................................................................... 4
1.2 Outcomes.......................................................................................................... 5
2. Legal and policy context ......................................................................................... 5
2.1 Legal framework ............................................................................................... 5
2.2 National policy................................................................................................... 6
2.3 Local policy and strategic objectives ................................................................. 7
3. Commissioning principles and process .................................................................. 8
3.1 Enabling commissioning framework .................................................................. 8
3.2 Outcomes based approach ............................................................................... 8
3.3 Value for money ................................................................................................ 9
3.4 Equalities .......................................................................................................... 9
4. Current services ................................................................................................... 10
4.1 Overview ......................................................................................................... 10
4.2 National data comparisons.............................................................................. 10
4.3 In-house residential ......................................................................................... 11
4.4 Independent residential homes ....................................................................... 14
5. Costs and benchmarking ...................................................................................... 18
6. Needs analysis ..................................................................................................... 19
6.1 Profile of children and young people placed in children’s homes .................... 19
6.2 Placement pathways and histories .................................................................. 21
6.3 Needs of young people in children’s homes.................................................... 24
6.4 Demand and forecasting ................................................................................. 25
6.5 Child in care overall trends (March 2013) ....................................................... 27
6.6 Children’s homes placements trends .............................................................. 30
7. Stakeholder feedback........................................................................................... 33
27.1 Views of children and young people ............................................................... 33
7.2 Views of practitioners ...................................................................................... 35
8. Research and good practice ................................................................................ 37
9. Challenges and potential for improvement ........................................................... 41
9.1 Rising numbers and reducing budgets ............................................................ 41
9.2 Complexity of needs ....................................................................................... 42
9.3 Relationships and behaviour ........................................................................... 43
9.4 Involving children and young people ............................................................... 44
9.5 Children who do not stay................................................................................. 44
9.6 Moving on from children’s homes ................................................................... 45
10. Commissioning recommendations ..................................................................... 46
10.1 Resources / budget ....................................................................................... 46
10.2 Commissioning recommendations ................................................................ 46
10.3 Options appraisal .......................................................................................... 46
10.4 Indicative timetable ....................................................................................... 47
Appendices
Appendix 1 – Voice young people living in Bristol children’s homes
Appendix 2 – Research messages: children’s homes
Appendix 3 – Children’s homes research report summaries
Appendix 4 – Draft outcomes matrix
Appendix 5 – Equality impact assessment
31. Introduction
1.1 Background
Bristol City Council is reviewing how it commissions placements for looked after
children to make sure there are the right type of homes available for all children and
young people in our care. Our objective is to commission a range of quality, local
placements that achieve good outcomes for children and young people and provide
value for money. To achieve this we have already done the following:
Established a new arrangement for purchasing placements from Independent
Foster Agencies
Reviewed our in-house foster service to identify improvements and steps to
increase the number of placements it provides
Developed a commissioning plan for specialist accommodation and support
services for young people with higher support needs under which new and
revised services will start from December 2013.
The other work on-going to achieve the right balance of placement types includes:
Reviewing specialist educational needs (SEN) provision in the city and
developing a plan to make sure we have provision, in the right locations, that
meets children’s needs. This will include consideration of what residential
schools provision we need to commission.
Developing a commissioning plan for services that provide short breaks to
disabled children and their families, including residential short breaks.
Consultation on this draft commissioning plan will start in December 2013.
Setting up a specialist foster service for 7-11 year olds with complex
emotional difficulties and challenging behaviour1.
Establishing a parent and child assessment scheme to provide specialist
foster placements and quality parenting assessments.
This plan sets out how we intend to commission children’s home placements for
children and young people in care. It does not deal with the commissioning of
residential placements in Registered Special Schools or residential short breaks as
those will be the subject of separate plans. It also does not cover secure placements.
We will consult on this plan in November and December. We will then revise the
plan, taking into account consultation feedback and invite the council’s Cabinet to
adopt the plan, probably in February or March 2014.
1
This will be a multi-dimensional treatment foster care (MTFC) scheme and is being partly funded by the DfE
as part of the DfE’s Evidence Based Intervention Programme.
41.2 Outcomes
Across all types of placement for looked after children, we intend to commission
placements that enable children to achieve their potential by providing them with
stability and supporting them to achieve positive outcomes, both short-term and
long-term. We will expect placement providers to focus on the outcomes below.
Be safe
Stable placements close to young people’s families
Children and young people will report that they feel safer and happier than they
did six months ago
Fewer children will go missing from care
Care leavers at 19 will live in suitable accommodation
Be healthy, socially engaged and a successful learner
Improved educational attainment
Fewer fixed term exclusions from school
Reduced offending and anti-social behaviour
Care leavers at age 19 will be in education, employment or training
Less problematic drug and alcohol use
More involvement in regular organised activities
Be supported
Children and young people will report that they have someone to talk to about
things that upset them
2. Legal and policy context
2.1 Legal framework
Registered children’s homes are covered by legislation and regulations and can only
be provided to children who are in the care of the local authority. The following
applies:
Children Act 1989 Part 3, ss. 20-22 set out the circumstances under which the
local authority must look after a child and provide that child with accommodation.
These provisions also require that local authority makes sure there is sufficient
local accommodation, with foster carers and in children homes, to meet the
needs of its looked after children and other children it has a duty to
accommodate.
The Children's Homes Regulations 2001 (amended by the Children’s Homes
(Amendment) Regulations 2011) set out how children’s homes should be
managed so that they offer children reliable, safe and stable care.
5 The National Minimum Standards for Children’s Homes are issued by the
Secretary of State under section 23 of the Care Standards Act 2000. Together
with the Children’s Homes Regulations they form the regulatory framework for
the conduct of children’s home providers. Minimum standards do not mean
standardisation of provision. Instead, the standards are designed to apply to the
wide variety of different types of children’s homes. They aim to enable, rather
than prevent, individual providers to develop their own particular ethos and
approach based on evidence of the most appropriate way to meet the child’s
needs.
Children Act 1989 Statutory Guidance and Regulations set out the functions and
responsibilities of local authorities and partner agencies under Part 3 of the
Children Act 1989. In particular the following volumes describe how local
authorities should carry out their responsibilities to children in care and in
children’s homes:
o Volume 2: Care planning, placement and case review
o Volume 5: Children’s Homes 2011 – Statutory guidance on the
Children’s Homes Regulations 2001 (amended)
o The guidance is issued under section 7 of the Local Authority
Social Services Act 1970 and is addressed to local authorities but
is also relevant to providers of children’s homes.
The Inspection of Children’s Homes Framework 2013 sets out the
framework and guidance for the inspection of children’s homes.
2.2 National policy
The Government sees rresidential care as an important placement option for looked
after children, stating that ‘children’s homes need to offer young people in their care
a positive, warm and caring environment so that they can flourish and achieve their
potential’. In September 2010, alongside the revised regulations detailed above, it
established a programme of work to support the residential care sector and
encourage continuing improvements in the quality of residential care for children.
This included induction standards for those working in children’s homes and revised
qualification and workforce development measures.
More recently, in response to the Report of the Office of the Children's
Commissioner's inquiry into child sexual exploitation in gangs and groups, and the
All Party Parliamentary Group joint inquiry report on children who go missing from
care, the Government has consulted on changes to the Regulations. These changes
aim to increase accountability for and oversight of decisions to place children in
homes at a distance from their responsible authority and to strengthen the inspection
framework for children’s homes.
In September 2013, the department for education published its second data pack on
children’s homes. Current research supports Bristol’s strategy to have local
responses to children in care in so far as is reasonably practicable, including the
6provision of sufficient children’s homes places for those whose needs cannot be met
in a family placement.
2.3 Local policy and strategic objectives
The council’s Children’s and Young Peoples Services is undergoing a series of
changes to respond to two major challenges:
reductions in Government funding, and
the rapidly growing number of children in Bristol, more of whom are disabled
and / or have special educational needs.
These change activities are combined with the “Children First” programme and are
focused on helping children and young people to be safe and achieve their potential.
We are working alongside our partners to make the changes.2
Our commissioning priorities are set out in the Children’s Specialist Commissioning
Plan 2012-20153. These priorities are:
(i) Support children to remain safely with their families
Securing sufficient accommodation requires a whole-system approach that
includes early intervention and prevention services to support children in
their families. We must be effective by focusing our work on those families
most at risk of requiring increasing levels of service provision, including
care.
(ii) Improve outcomes for children in care and care leavers
Children do better in well-matched stable placements. We will build upon
our trusted and confident relationship with the market to deliver an
increased choice of quality placements that are able to meet the needs of
our children locally.
(iii) Achieve value for money and reduce spend through effective cost
management
We will listen to what children and families tell us is effective, and work
with our partners and the market to deliver more with fewer resources. We
will work both locally and regionally, on a strategic and operational level to
ensure that the placements we commission deliver more effectively.
Expenditure will be controlled and monitored against delivery of outcomes.
2
Information about the Children First programme is available on the council’s website
http://www.bristol.gov.uk/page/children-and-young-people/changes-children-and-young-peoples-services-
children-first
3
https://www.bristol.gov.uk/sites/default/files/documents/children_and_young_people/about_bristol_child_
and_young_people_service/Children%27s%20Specialist%20Commissioning%20Plan%202012-15_0.pdf
73. Commissioning principles and process
3.1 Enabling commissioning framework
Strategic commissioning is the process by which the council identifies strategic
outcomes and priorities in relation to people’s assessed needs and designs and
secures appropriate services to deliver these outcomes. Services can be provided
in-house or by external providers.
In order to guide and standardise strategic commissioning practice, the council has
developed the Enabling Commissioning Framework. This includes a comprehensive
set of guidance, templates and checklists for use in all commissioning processes
which will support public, private and voluntary, community and social enterprise
(VCSE) organisations to better engage in commissioning processes and secure
contracts.
The Enabling Commissioning Framework is based on four key elements:
Analyse – understanding the service priorities, values and purpose, the needs they
must address and the environment in which they operate.
Plan – identifying the gaps between what is needed and what is available, and
planning how these gaps will be addressed within available resources.
Do – ensuring that the services needed are delivered as planned, to efficiently and
effectively deliver the priorities, values and purpose set out in the commissioning
plan.
Review – reviewing the delivery of services and assessing the extent to which they
have achieved the purpose intended.
More information about the Enabling Commissioning Framework is available on the
council’s website:
http://www.bristol.gov.uk/page/enabling-commissioning
3.2 Outcomes based approach
An outcomes based approach is not overly prescriptive in the specification about the
services to be provided. Instead the procurement process will specify the outcomes
being sought and the service users who will be eligible for services. This approach
aims to support innovation but, in such a highly regulated area, there will inevitably
be areas that must be subject to detailed specification and agreement about how
services will be delivered. Any procurement processes will include an assessment of
whether the proposed service is likely to address the needs of relevant young people
and enable them to achieve any outcomes identified (see p.2 above). The
assessment will be based on evidence provided about the specific approach and its
8appropriateness for the relevant young people. The strength of evidence base will be
critical to the chance of success.
Throughout the contract period, commissioners will work together with providers
positively and constructively to achieve outcomes for young people using the
services. The quality of services and achievement of outcomes will be evidenced
through reporting processes and regular monitoring. Proposed outcomes are set out
in this document.
3.3 Value for money
The general duty of best value requires the council to “make arrangements to secure
continuous improvement in the way in which its functions are exercised, having
regard to a combination of economy, efficiency and effectiveness.”4 This means that
we must consider overall value, including economic, environmental and social value,
when reviewing service provision.
The aim of commissioning is therefore to achieve value for money, i.e. services that
deliver the best balance between economy (cost), efficiency (degree of output) and
effectiveness (outcomes and results).
3.4 Equalities
This commissioning plan aims to tackle discrimination and promote equality for all
groups. We have done an initial equality impact assessment that we will consult on
during the consultation period (see Appendix 5).
Providers will be required to demonstrate their commitment to providing an inclusive
environment that is equally effective in meeting the needs of all protected
characteristics. Providers will also be required to comply with the s.149 Equality Act
2010 public sector duty to have due regard to equality objectives. Contract
monitoring will include comparing outcomes for children and young people in
different equality groups. We will expect providers to take action to address any
significant differences for particular groups.
4
Section 3(2) Local Government Act 1999
94. Current services
4.1 Overview
In the period April 2012 and August 2013, we had between 43 and 56 of our looked
after children living a residential care each month. These included children and
young people placed in children’s homes, residential schools and secure units.
We looked closely into the cases of those young people living in children’s homes
during the period October 2012 and April 2013, a total of 41 young people. Of these,
35 were placed in one of our council-run homes. The other six young people were
placed in six different independent children’s homes.
We carried out a review of our in-house children’s homes as well as the independent
homes we use regularly. The findings of those reviews are set out below. We also
considered how successful we are at finding suitable, local placements for our
looked after children, compared to other local authorities as well as the price we pay
for placements, compared to national averages.
We concluded that our in-house services provide good value for money and give us
a level of control over local services that is very important. This control means that
we are able to find local children’s homes places for nearly all young people who
need them. However, two of our in-house children’s homes have “adequate” Ofsted
judgments and require improvement. This plan sets out other improvements we want
from our in-house homes.
4.2 National data comparisons
Bristol is performing well, compared to other local authorities, both in terms of
placing looked after children within our local authority boundary and in the price we
pay for children’s homes placements.5 See section 5 for cost comparisons.
At 31.3.12, Bristol had placed 5% of its looked after children in children’s homes
compared to 7% nationally. Of those children, Bristol managed to place a higher
proportion of children within its border than any other local authority in the country:
97% compared to 54% nationally. We are also successful in making best use of the
homes located within our boundary -- 73% of the children living in children’s homes
in our local authority area were in the care of Bristol, compared to 55% nationally.
This is likely to be a reflection of the fact that a high proportion of the homes in our
area are run by the council. This gives us a high degree of control over local
provision enabling us to make sure that local homes take our children, even where
they may have challenging behaviour(s) or complex needs.
5
National data taken from DfE Children’s Homes Data Pack 13 September 2013
10At 31.3.12 there were ten children’s homes in the Bristol local authority area of which
six were local authority homes and four were private or voluntary homes. The
majority of Bristol young people (85%) were placed in Bristol City Council children’s
homes. Nationally only 28% of children’s homes places are in local authority run
children’s homes.
Of Bristol’s five in-house children’s homes, the latest full Ofsted reports for each
home as at August 2013 show that August 2013 three (60%) were rated “good” by
Ofsted and two (40%) were rated “adequate.” None were rated “outstanding” or
“inadequate.” Nationally 15% of children’s homes were rated “outstanding”, 57%
“good”, 24% “adequate” and 4% “inadequate.”
Bristol children’s homes, with five places each, are slightly smaller than the national
average for local authority children’s homes (5.8 places), but larger than the national
average for private and voluntary children’s homes (4 places). Nationally there were
101 (6%) homes registered for just one place and 239 (14%) for two places.
4.3 In-house residential
Bristol City Council has five children’s homes each with five beds. One is designated
as an independence training unit and tends to house older teenagers preparing to
leave care and live more independently. However, older teenagers also live and
prepare for greater independence in the other homes too.
In April 2013 the council closed Capgrave Crescent, which was a children’s home for
11–14 year olds with the intention children and young people in the 11-13 age group
should live in foster placements, not children’s homes.
Location and facilities
The remaining homes are located across the city:
MAP REMOVED FOR PUBLICATION
The council’s children’s homes are well-maintained and generally unobtrusive in their
neighbourhood. The homes have a similar range of internal spaces: including large
kitchens combined with dining areas, lounges, computer/games rooms and so on.
Each home has a minimum of one staff office where confidential records are kept.
The young people’s bedrooms are standard single sized rooms and, with the
exception of one home where each bedroom is en-suite, have shared bathroom and
toilet facilities. The focus of activity is usually the kitchen area or lounge areas.
Repair and maintenance of the internal areas of the homes is both planned and
responsive. The homes tend to be repaired as and when needed.
11Below, the total spends for repairs and maintenance (both planned and responsive,
including grounds), is summarised.
12/13 Spend
G £12,229
H £18,425
J £12,434
K £30,029
L £17,927
TOTAL £91,044
Staffing
Each house is staffed as follows:
Bristol Grade Job Title FTE Posts
BG12 Unit Manager 1
Ass Unit
BG10 Manager 2
Residential
BG8 Worker 8
BG7 Admin 1
BG1 Domestic 1
There are more female than male staff:
% of Male % of Female
Home
Staff Staff
G 29 71
H 23 77
J 31 69
K 46 54
L 23 77
Average 30.4 69.6
Quality
Home Ofsted judgment Overall effectiveness comments
(latest full report as at
August 2013)
G Good Provides good standard of care to young people.
The care each young person receives focuses
on their individual needs and abilities.
Young people form sound relationships with the
experienced and stable staff team and the
12Registered Manager.
H Adequate The home is managed by an experienced
manager and staff group.
Young people form positive relationships with
their staff team and the Registered Manager.
Young people say they are satisfied with the
quality of care that they receive and say that they
feel safe and are looked after well. The
improvements required relate to safety
precautions in case of fire, smoking, storage of
medication, checking visitors, monitoring visits,
supervision of staff and improvements to the
physical conditions of the home.
J Good Young people receive a good quality standard of
individualised care from an experienced
enthusiastic and stable staff team. Young
people are very positive about the quality of care
they receive and feel safe. Good role models
and excellent relationships facilitate positive
attachments between young people and the staff
team.
K Good The home provides an excellent level of care and
outcomes for young people are good. Young
people speak very positively about the care and
support they receive. Shortfall in the quota of
care staff with a first aid qualification.
L Adequate Lower levels of staff due to departures and
unforeseen absence of permanent staff
members.
Still maintains stable and effective relationships
with young people.
Young people say they feel safe and well cared
for. Several matters have been raised for
improvement. They relate to recording of
physical interventions and debriefing following
incidents of physical restraint or challenging
behaviour, staff supervision and appraisals,
notifications, safe recruitment and vetting of staff,
consultation with young people and providing the
children’s guide in different languages.
13Occupancy rates
The table below shows averages for 2012-2013.
% beds allocated by
Children’s home unoccupied
G 26%
H 12%
J 16%
K 4%
L 11%
As part of this review, we have been thinking about children who have an allocated
bed but who do not always stay. Can we meet those children’s needs in a different
way and utilise our children’s homes for those who really need the service?
4.4 Independent residential homes
National framework agreement
As a sub-regional consortium, Bristol City Council, Bath & North East Somerset,
Gloucestershire County Council, North Somerset Council, Wiltshire Council and
South Gloucestershire, have a sub-regional framework agreement for the
placement of Children and Young People in Residential Care Homes. There are
37 providers on this agreement and children are placed using the national
children’s homes contract. We spot purchase placements from providers on this
agreement when they are required.
The sub-regional consortium began to use the framework agreement in February
2012. The agreement expires in January 2015, with the option of a one year
extension to January 2016.
Children’s homes used
In the last year, Bristol children have been placed in eight independent children’s
homes. The information provided by each of these homes is summarised below:
Home A
A is a spacious home offering high-quality accommodation and care in Bristol. It is
registered to provide residential care and education for children with Autistic
Spectrum Disorders, physical and emotional behavioural difficulties. It is registered
for young people from the age of 8 to 18, male and female. The approach is stated
14as holistic and child-centred with care programmes and packages tailored to each
resident's specific needs.
Home B
B is part of a large national provider of independent children’s homes. It is a
registered children’s home for boys and girls with emotional and behavioural
difficulties, between the ages of 10 and 17 upon admission but may continue to
provide for young people above this age if it is part of an agreed care plan. It can
accommodate up to four young people for up to 52 weeks per year, however at the
time fo asking, accommodation was being restricted to two young people.
Home C
C is also a home delivered by a large national provider. It is a medium to long term
residential home for children and young people who require accommodation for the
period of time they have to live away from their families. Although the home can
cater for boys it currently specialises in providing residential care to vulnerable girls
who exhibit challenging and debilitating behaviour
Home D
D is one home in a group of homes with education, providing a residential service for
the care of up to four children and young people (boys and girls) aged between 8
and 18+ years (with a maximum five year age difference) who have a care history
and who may also present with emotional, psychological, behavioural, personality or
social difficulties, especially attachment disorders.
Home E
E provides a residential service for two young people aged 8 years to 18 years who
need to be looked after by the local authority and who require a clear and planned
stable placement. As the age range implies, we acknowledge the importance of clear
structured planning for young people who will eventually need to move on towards
independence and the environment and supportive structures in place facilitate this
effectively. E is ideally situated for those young people who require an intensively
supported placement away from peer group and other adverse influences.
Home F
F is a residential children’s home for 11-17 year old boys and girls and provides care
for five young people. Currently, it accommodates male placements only. All young
people placed exhibit social difficulties and are receiving support in addressing an
underlying lack of communication skills, awareness skills or self-esteem that is
contributing to these difficulties. Most of the young people at F also display forms of
challenging behaviour, are very vulnerable and are placed for their own welfare.
Some young people may experience other developmental delay, emotional or
cognitive difficulties.
Home G
G provides a specialist integrated day and residential service for children and young
people between the ages of eight and 19 years who have a diagnosis of an autistic
spectrum condition. Residents may attend G school or other educational provision in
the locality. There are currently 22 pupils on roll, most of whom are boys. Almost all
15pupils are in Years 8 to 13. All pupils have a diagnosis of an autistic spectrum
condition and have a statement of special educational needs.
Home H
H is a home in Bristol that was established to provide medium to long-term care for
young people who are looked after, whether on a voluntary accommodation basis or
by virtue of a care order. It provides child centred residential care for young people,
enabling them to achieve their potential in a safe and stable environment. Based in
the South West of England and Wales, We offer professional support to young
people who often experienced neglect resulting in behavioural and emotional
difficulties option.
Geographical spread of out of authority providers used:
MAP REMOVED FOR PUBLICATION
Quality
Home Ofsted Overall effectiveness comments
judgment
(latest full
report as at
August
2013)
A Good The standard of care provided at the home is
strong with good robust recording systems in
place.
Good personalised care ensures young people
feel valued and are treated as individuals.
Staff are valued and demonstrate a good
understanding of safe working practices.
Young people confirm they feel safe and happy
at the home and bullying is not an issue.
B Good Young people make good progress in relation to
their starting point on admission to the home in
all aspects of their care, well-being and
education
Young People have a committed, effective,
stable staff team who are appropriately trained
and proactive at meeting the needs of the young
people.
Young people are happy at the home and
support the staff
Leadership at the home is strong and the
manager is aware and understands the areas
which require further development
C Good The service has a positive impact on developing
16young people’s personal development, physical
and emotional health.
Each young person is valued, treated fairly and
is supported to reach their full potential.
Approach to behaviour management has helped
develop young people’s personal control and
anger management; this results in good
relationships and decreasing incidents of risk-
taking behaviour.
The home is well organised and managed, and
strengthened with an experienced and
competent care team.
D Good This home provides an excellent quality of care
to young people, who are at the centre of all that
the home does. Care is delivered in a highly
personalised way which meets young people's
needs and enables them to make good progress
and stay safe. This totally child-centred approach
is led by the very hands-on manager, and
determines everyday living in the home. There
are some shortfalls in relation to monitoring,
training, supervision and appraisal. These are
particularly relevant as the home is poised to
admit new young people and recruit new staff.
E Good Good - Young people progress well at this home
because they receive personalised and well-
planned care.
Young people, staff and a social worker were
very complimentary about the standards of care
in the home.
Young people say they feel safe and secure in
the home.
Leaders and managers understand the strengths
and areas for development of the home and
have plans in place.
F Good Taken from School Inspection (ESTYN, Wales),
as no residential inspection found (CSSIW also
do not ‘grade’ on first inspections, which this
would have been).
Behaviour is managed well; and proprietor ensures
that C&YP have access to a wide range of
appropriate specialist support services.
G Adequate Adequate - In July 2012, the full inspection of the
home judged its overall effectiveness to be good
and did not identify any problems.
This interim inspection found that the home has
made satisfactory progress since then, because
it has maintained the quality of care and
outcomes for young people.
Since the homes last full inspection Ofsted
17agreed to a minor variation to its categories of
registration to reflect that it is currently a home
for children with learning disabilities as well as
emotional or behavioural difficulties.
H Good Good - Young people living in this home benefit
greatly from enthusiastic, committed and
experienced staff.
Outcomes for young people are outstanding
because staff are persevering and energetically
supportive.
Young people confirm that their views are
genuinely sought and acted upon.
Educational needs are very well met with young
people making extraordinary progress.
5. Costs and benchmarking
Costs of children’s home placements
The average gross weekly unit costs set out below are the total cost of the
placement including SEN and NHS contributions. The net costs to social care
exclude those SEN and NHS contributions.
The average price Bristol pays for children’s homes placements is relatively low
compared to the national average6. We pay £2,361 per week for a place in one of
our local authority children’s homes, whereas the national average cost of a local
authority placement is £4,135. For independent children’s homes placements, BCC
pays an average of £3,271, whereas the average nationally for independent homes
is £3,800.
The weekly net cost we pay in Bristol for a council children’s home place (£2,361
excluding management costs and costs of buildings repairs and maintenance) is
broadly similar to that of the “care only” cost we pay for an independent children’s
home placement (£2,473).
Placement type Average gross Average net cost
weekly unit cost to social care
BCC children’s home £2,361 £2,3617
BCC placements with independent £3,131 £3,131
children’s home (with no SEN funding)8
BCC placements with independent £2,865 £2,352
children’s home (with lower level of SEN
6
The Bristol OOA calculations exclude two very costly placements of over £6,000 per week.
7
Unit cost calculated for 2011-12. There are also repairs and maintenance costs of c.£58/week and
management costs of c.£45/week – these should be added to provide a true total cost per unit.
8
Averages calculated from payments made in February 2013
18funding, £1,058 of less)9
BCC placements – average of all £3,271 £2,473
independent children’s home placements10
Local authority children’s home - national11 £4,135 NA
Private / voluntary children’s home - £3,800 NA
national12
BCC foster care (excluding kinship)13 £403 £403
BCC placements with independent foster £756 £756
agencies (IFAs)14
6. Needs analysis
6.1 Profile of children and young people placed in children’s homes
We considered the information we held about all young people we had placed in
children’s homes as at October 2012, to get a snapshot. At this time there were 41
young people placed in children’s homes (including in-house and out of authority
placements, but excluding those placed in residential special schools). We have
compared the local data with national data contained in the Children’s Home Data
Pack published on 13 September 2013 by the Department for Education.
Demographics
All the young people we had placed in children’s homes were aged 13 or more. The
ages of the children are set out in the graph below. The mode (the age that appears
most often) is 15 years, which is the same as the mode nationally for children living
in children’s homes.
Overall, 54% of the young people were boys and 46% girls. Nationally, 63% of
children’s homes residents are male. The majority, 71%, of the young people were of
9
As above
10
As above
11 th
Source: Children’s Homes Data Pack, DfE 13 September 2013
12
As above
13
Unit cost calculated for 2011-2012
14
Unit cost for April-July 2013 taken from A30 IFA analysis CHIPS report
19White British descent and 29% were non-white British. This broadly reflects the
proportions in the Bristol child population.
No. of young
Race
people
Any Other Black Background 1
Black - Sudanese 1
Black African 1
Black/Black British/Somali 1
Caribbean 2
Other - Afghan 1
Other - Iranian 1
White & Black African 1
White and Black Caribbean 3
White British 29
Total 41
90% of the young people in residential care spoke English as their first language.
First language No. of young people
Arabic 1
English 37
Farsi 1
Pashto 1
Somali 1
Total 41
Disabilities and SEN
24% of the young people in residential care had a diagnosed disability as follows:
Disability No. of young people
Autism/Asperger’s 2
Behaviour difficulties 2
Hearing impairment 1
Learning difficulties 4
Unspecified disability 1
Total 10
39% of the young people had a Statement of Special Educational Need (SEN) or a
Statutory Assessment for SEN underway. The vast majority of the young people’s
SEN category was Behavioural, Emotional and Social Difficulties (BESD).
206.2 Placement pathways and histories
Reason for entry into care
The majority (56%) of young people placed in children’s homes entered care as a
result of abuse or neglect.
Entry into No. of young people
Description
Care Code
N1 Abuse or Neglect 23
N2 Child's Disability 0
N3 Parental Illness or Disability 1
N4 Family in Acute Stress 2
N5 Family Dysfunction 8
N6 Socially Unacceptable Behaviour 4
N7 Low Income 0
N8 Absent Parenting 3
None Unknown 0
Age at entry into care
Analysis of all children in care at 31.10.12 shows that of young people living in Bristol
children’s homes and semi-independent supported accommodation, over three
quarters were aged 11 or over when they first came into care:
Age in years % of young people
0-5 6%
6-10 17%
11-15 42%
16 and over 35%
21Previous placement
Over one third of the young people in children’s homes previous placement was
another children’s home. Over one quarter were previously placed with foster carers.
Slightly less than a quarter moved from their family home to a children’s home.
Code Previous Placement Type No. of young % of young
people people
FP Relative or friend in LA boundary 1 2.4%
From Home 9 21.9%
H5 Residential Accommodation 1 2.4%
K1 Secure Unit 1 2.4%
K2 Children’s Homes & Hostels 15 36.6%
P1 Placed with own Parents 1 2.4%
Q2 Placement with Foster Carer 11 26.8%
R1 Residential Care Home 1 2.4%
R5 Young Offenders Institution or Prison 1 2.4%
TOTAL 41
Placement stability
The table below shows the number of placements for each young person as at
October 2012. The young person with 6+ placements had a total of seven
placements, three in secure units, two in residential care homes, one in a children’s
home and one with the NHS. National data suggest that Bristol placing a young
person in a children’s home is used more as a last resort compared to the national
picture. This is consistent with our policy of placing children and young people in a
family setting wherever possible.
% of BCC young
Number of Placements people % Nationally
1 14.6% 29%
2 19.5% 25%
3 12.2% 15%
4-5 24.4% 16%
6+ 29.3% 15%
Placement duration
Of those placed in Bristol children’s homes, 51% of placements lasted longer than
one year. The following pie chart shows the duration of the placements within Bristol
22Children’s Homes up to June 2013. As at this date, the majority of children and
young people (32.5%) had been in a children’s home placement for 0-6 months.
Duration % of young people
0-6 months 32.5%
6-12 months 22.5%
12-18 months 12.5%
18-24 months 20%
2-3 years 5%
< 3 years 7.5%
Move on placements
The pie chart that follows shows where young people moved on to from their
children’s home placement.
23The highest percentage (35%) of young people moved on to independent living with
formalised support (i.e. supported accommodation with Youth Projects or 1625
Independent People). Four young people moved on to a foster placement with a
relative or friend, but no young people moved on to unrelated foster care.
6.3 Needs of young people in children’s homes
Range of needs and presenting behaviours
The case files of young people in Bristol children’s homes identifies that they have a
range of needs and behaviours including:
Possible sexual exploitation
Drug and alcohol use
Offending
Running away and sleeping rough
Violence, anger and verbal abuse directed at others
Victim of violence (parental and from others)
Witness of violence including domestic violence
Possible sexual assault
Potential to harm younger children
Poor mental health, anxiety, emotional instability
Obsessive tendencies, including a fascination with blades
Experience emotional, physical and/or sexual abuse
Low self confidence
Vulnerable
Personality disorder
Feeling unsafe and overwhelmed
Findings from research
See Appendices 2 and 3 for more details.
Our research review indicates that generally young people in children’s homes in the
UK are getting older, with 14-15 years old now being the typical age. Local
authorities report that there has recently been a growth in complex needs, and that
more young people now need specialist support. The young people in children’s
homes tend to have more severe attachment issues following multiple breakdowns
of previous placements and significant emotional, social and behavioural difficulties.
They were six times more likely to have mental health problems compared to other
looked after children, and three quarters were reported to have been violent or
aggressive in the past six months, with the same proportion reported to have put
24themselves at risk. Children in children’s homes were also more likely to have low
levels of educational attainment compared to their peers.
Some young people preferred to live in a children’s home and actively rejected foster
care. There may be a number of reasons for this, most often related to attachment
difficulties of some sort but also a desire to display loyalty to their own parents or
previous negative experiences of being fostered.
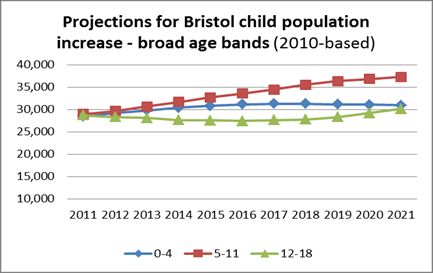
6.4 Demand and forecasting
Population projections by broad age band
The Bristol population of children aged 0-5 years increased significantly between
2000 and 2012 as shown in the graph below.
Projections indicate that numbers in the 5-11 year age band will continue to increase
significantly. However, the numbers in the 12-18 age band are not projected to
increase until around 2018 (see graph below). As this is the age group that tends to
be placed in children’s homes, we do not expect an increase in demand for
children’s homes places to result from population increases in the next five years.
However, we will continue to monitor this and revise our forecast projections as
appropriate.
25General children in care population
The past year has seen the number of children in care in Bristol rise from 685 to 720,
an increase of 5% compared to a 2% increase nationally. Bristol’s child in care
population has grown more rapidly in recent years, catching up with the national
average in terms of rate of increase.
It is helpful to look at the rate per 10,000 as detailed in the table below which shows
that Bristol’s rate has not changed significantly over the past five years whereas the
national rate has increased by 9% and by 6% amongst statistical neighbours. It is
worth noting that Bristol’s rate is still relatively high and when compared to the Core
Cities the rate per 10,000 has grown in the face of a reducing average.
Children in care per 10,000 at 31st March15
%
2009 2010 2011 2012 2013
change
Bristol number of children
650 645 680 685 720 +11%
in care
Bristol rate per 10,000 of
the under 18 population 82 80 84 78 82 0%
15
Taken from DfE Statistical First Release data in September 2011 for years 2009-2011; in September 2012 for 2012 and in September
2013 for 2013.
26Statistical neighbours
72 77 79 77 76 +6%
average rate per 10,000
Core cities average rate
92 97 96 88 88 -4%
per 10,000
England average rate per
55 58 59 59 60 +9%
10,000
The table below shows how Bristol is ranked in comparison to the rate per 10,000 of
both Core Cities and Statistical neighbours. In addition to the demographics of the
city, a number of factors have influenced this changing pattern including changes to
the statutory framework, case law decisions, the outcome of recent Serious Case
Reviews and potentially the impact of welfare reform, given that there is a close
correlation between deprivation and referrals to social care, including children
entering care.
Year Bristol Bristol rate National Ranked Ranked
Number of per 10,000 Average against against
children in Rate per Statistical Core Cities
care 10,000 Neighbours (rank 1 to 8)
(rank 1 to 11)
2009 650 82 55 2nd 7th
2010 645 80 59 4th 6th
2011 680 84 59 4th 6th
2012 685 78 59 5th 6th
2013 720 82 60 3rd 6th
6.5 Child in care overall trends (March 2013)
Length of care: The number of children looked after for more than 12 months
increased slightly from 484 in 2012 to 495 – a rise of 2%.
Entry and exit: In 2012/13, 299 children entered care during the year and 269 left
care (a net gain of 30). This is a 10% increase in the number of children entering
care, compared to 2011/12.
Adoptions and SGOs: In 2012/13, 9.3% of the population exited care with either an
adoption order (23 children) or Special Guardianship Order (31 children). As this is a
new indicator, we are unable to report on the trend compared to the previous year.
Age: The composition of the children in care population by age has not changed
significantly over the past year. It is the oldest age group of 16 and 17 year olds that
27has seen the greatest change over a longer period but has not changed significantly
with the 2011/12 figure. The proportion of children in care aged under twelve months
has fallen slightly, while the proportion of children in care aged 5 – 9 has increased
slightly.
It is the oldest age group (16 and 17 year olds) which has seen the greatest change,
with a one-third increase between 2009 and 2013. Bristol has a higher percentage of
Looked After Children aged 10-17 than the England average.
Gender: At 31 March 2013 the ratio of girls to boys in the children in care population
was 49.5% to 50.5% respectively, very similar to the ratio in 2012. This compares
with the national average in 2012 of 56% boys and 44% girls. There has been a
steady increase since 2009 in the number of girls looked after in the age bands 10-
15 and 16-17.
Legal status: 64% of children in care are subject to either an interim or full Care
Order, slightly higher than the national average of 59% and above the average of
52% for local authorities in the South West. A lower percentage of children are
accommodated on a voluntarily basis under Section 20 of the Children Act 1989.
Ethnicity: The pattern of ethnicity of the Bristol children in care population is largely
unchanged over the past year. In comparison with the Bristol Schools Census of
January 2013, children in care at 31 March 2013 were slightly more likely to be white
and slightly less likely to be Asian.
Placement types: The percentage of children living with Bristol foster carers
(including kinship) has increased from 53% in 2012 to 59% in 2013, and the
percentage of children living in fostering agency placements reduced from 25% to
22%. This is in line with Bristol’s stated placement strategy. Similarly to 2012, 10%
of children in 2013 lived children’s homes or residential special schools.
28Place type 2009 % 2010 % 2011 % 2012 % 2013 %
Children's home 21 3% 28 4% 35 5% 33 5% 41 6%
FC in Bristol (Agency) 25 4% 37 6% 55 8% 58 9% 62 9%
FC in Bristol (LA) 180 28% 202 31% 205 30% 201 29% 239 34%
FC outside Bristol
(Agency) 75 12% 86 13% 83 12% 93 14% 91 13%
FC outside Bristol (LA) 102 16% 99 15% 88 13% 98 14% 94 13%
FC rel / friend in Bristol 74 12% 64 10% 56 8% 53 8% 62 9%
FC rel / friend outside
Bristol 21 3% 18 3% 17 3% 25 4% 14 2%
Hostel 15 2% 7 1% 11 2% 22 3% 12 2%
Independent living 5 1% 6 1% 21 3% 11 2% 8 1%
Other 36 6% 25 4% 36 5% 21 3% 29 4%
Parents 37 6% 23 4% 16 2% 19 3% 13 2%
Placed for Adoption 28 4% 23 4% 37 5% 26 4% 28 4%
Residential School 15 2% 16 2% 12 2% 18 3% 17 2%
Secure unit 5 1% 8 1% 1 0% 4 1% 1 0%
Total 639 642 673 682 711
Distance from home: Of children newly looked after in the twelve months up to
March 2013, 95% were placed within 20 miles of their home address. This compares
to 96% in 2012 and outperforms the 2012 national average of 84%.
Placement stability: Bristol’s performance in terms of placement stability, both
number of moves and long-term stability has remained fairly static over the past
several years and is in line with the performance of Bristol’s statistical neighbours.
Given that placement stability is such a key predictor of future outcomes for children,
it is an area where Bristol wants to improve its performance as a way to both
29optimise children’s life chances and contain placement costs16. This table shows a
slight improvement in performance compared to last year’s performance.
Key Indicator Stat
Annual Q1 Q4 Q1 Progress England
(definitions at end of Neigh
Target 2012-13 2012-13 2013-14 Q1 to Q1 2011-12
report) 2011-12
OPI401 (NI62) Stability of
placement of looked after 10.9% 9.6% 9.1%
10.5% 10% 11%
children: number of 77/704 69 / 719 66/724
moves
CY263 (NI 63) Stability of 68.7%
placement of looked after 171/249 71.4% 71.7%
72% 70% 68%
children: length of 165/231 167/233
placement
6.6 Children’s homes placements trends
In the last 18 months there has been a small decrease in the rate of placements into
children’s homes.
The following graph shows that the number of placements into children’s homes
since April 2012 appears to have decreased slightly in 2013 and has remained at
about 43 since May 2013.17 The data is not included for November 2012 to February
2013 and for April 2013 as the introduction of a new case management system lead
to some inconsistencies in data recording in this period.
Total residential placements
60
50
40
30
20
10
0
Sep-12
Feb-13
Oct-12
Dec-12
Apr-12
May-12
Apr-13
May-13
Aug-12
Jan-13
Mar-13
Aug-13
Jun-12
Jun-13
Jul-12
Nov-12
Jul-13
16
See Demos Report: In Loco Parentis. Hannon, Bazalgette and Wood, 2010 and Loughborough university’s work on the Cost Calculator
for Children’s Services
17
These figures are taken from BCC CYPS social care monthly briefings and are likely to be slightly inflated because they include some
placements wrongly identified as residential. Numbers include all placements in Bristol residential and non-Bristol residential excluding
those made by the Care & After Team (which are unlikely to be placements into children’s homes).
30The table below shows the number of new placements made into children’s homes
since July 2012. 18
in-house OOA total
residential residential residential
Jul-12 4 2 6
Aug-12 3 2 5
Sep-12 2 1 3
Oct-12 2 2 4
Nov-12 4 0 4
Dec-12 2 1 3
Jan-13 1 1 2
Feb-13 3 0 3
Mar-13 1 1 2
Apr-13 4 0 4
May-13 0 1 1
Jun-13 0 1 1
Jul-13 0 1 1
Aug-13 2 3 5
Between July 2012 and July 2013, there was a decrease in the rate of placements
made into children’s homes. This may, in part, have been related to the closure of
one home as placements were not made into that home in the lead up to its closure
in April 2013. In August 2013 there was an unusually high number of placements
made into all placement types. We do not yet have the final data for September
2013, but it appears that the number of placements has reduced to pre-August
levels. The August blip is explained by an unusually high number of placement
breakdowns at a time when numbers entering care had also increased. Both are
likely to be associated with the school summer holidays.
Accepting that the increase in August does not represent a trend, the graph below
shows a pattern of slightly decreasing numbers of placements into all children’s
homes placements. This decrease is greater for placements into in-house children’s
homes.
18
Data provided by BCC Specialist Commissioning Team.
317
6
5
4
in-house residential
3
OOA residential
2 total residential
1
0
Nov-12
Sep-12
Feb-13
Oct-12
May-13
Aug-13
Aug-12
Jul-12
Apr-13
Jul-13
Jun-13
Dec-12
Mar-13
Jan-13
The following graph shows the numbers of new placements made each month for
children and young people who are new entries into care or returning to care. There
has been an increase in young people aged 16 and over, but no significant change
in the numbers of 10-15 year olds coming in to care.
18
16
14 New entries & returns to care
10-15 yrs
12 New entries & returns to care
16+
10 Total
8 Linear (New entries & returns
to care 10-15 yrs)
6 Linear (New entries & returns
to care 16+)
4 Linear (Total)
2
0
Jan-13 Feb-13 Mar-13 Apr-13 May-13 Jun-13 Jul-13 Aug-13
Factors that may reduce demand for children’s home places
We are currently re-commissioning post-16 services. These are specialist support
and accommodation services for young people with higher support needs. These
32services are mainly for 16-17 year olds as well as some older teenagers to whom the
council owes a duty, such as care leavers and unaccompanied asylum seekers. The
changes to these services, in place from the beginning of 2014, could deliver
alternative placements for a small number of young people who would currently be
placed in children’s homes.
We are also developing a treatment foster care service to support 7-11 year old
looked after children who display very challenging behaviours. We will be offering
this service in 2014. It will provide up to ten specialist foster care placements at a
time for each child for up to 12 months. This ‘team around the child’ care will include
treatment from a clinical psychologist. The formal name for this type of service is:-
"Multi-Dimensional Treatment Foster Care – Children”, or MTFC-C.19 As well as
recruiting and training MTFC-C foster carers, we will be creating a clinical team
consisting of various professionals.
Our intention is that the MTFC service will improve outcomes for our primary age
children in care with the highest levels of need. This includes those children who
have experienced significant trauma as a result of abuse within their birth family and
who present with complex or severe emotional difficulties (serious conduct
disorders). Such children might have already experienced multiple placements
possibly including failed moves to permanency, so will they may continue to struggle
to form secure attachments. They are more likely to continue to experience instability
and may go on to require residential care. There is an increased likelihood of these
children offending, having continued emotional and mental health difficulties,
insecure accommodation and very poor outcomes in later life.
We want to break this cycle by developing an MTFC-C service for 7-11 year olds. By
providing support earlier we can help reduce the numbers of children needing to go
into a residential children’s home when they reach 10 to 13 year olds and beyond.
And because of this we can help fulfil one of our strategic priorities of ensuring that
the majority of children can grow up within a family. We anticipate, therefore, that
there will be reduced demand for children’s homes placements from 2015 onward.
7. Stakeholder feedback
7.1 Views of children and young people
For a full report of our engagement with young people, see Appendix 1 (APPENDIX 1
REMOVED FOR PUBLICATION)
19
The service is part of the DfE’s intensive, Evidence Based Interventions Programme for looked after children,
children on the edge of care or custody and their families. Our services are conducted under License under the
“Oregon model” and have already been established across a number of English Authorities. For further
information go to: http://evidencebasedinterventions.org.uk/
33You can also read