CFA Institute Research Challenge Atlanta Society of Finance and Investment Professionals Team J - Hosted by
←
→
Page content transcription
If your browser does not render page correctly, please read the page content below
CFA Institute Research Challenge
                 Hosted by
Atlanta Society of Finance and Investment
              Professionals
                  Team J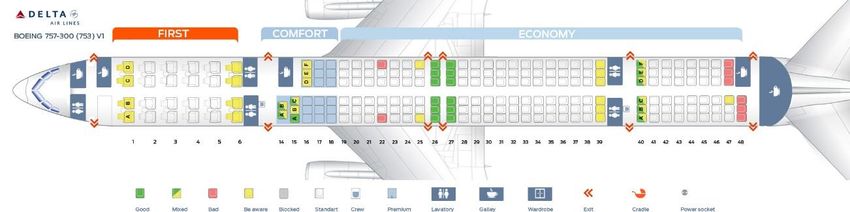
Team J
Industrials Sector, Airlines Industry
This report is published for educational purposes only by
New York Stock Exchange
students competing in the CFA Research Challenge.
Delta Air Lines
Date: 12 January 2017 Closing Price: $50.88 USD Recommendation: HOLD
Ticker: DAL Headquarters: Atlanta, GA Target Price: $57.05 USD
Investment Thesis
Recommendation: Hold
We issue a “hold” recommendation for Delta Air Lines (DAL) with a price target of $57 based on our
intrinsic share analysis. This is a 11% potential premium to the closing price on January 12, 2017.
Strong Operating Leverage
Over the past ten years, Delta has grown its top-line by 8.8% annually, while, more importantly,
generating positive operating leverage of 60% per annum over the same period . Its recent growth and
operational performance has boosted Delta’s investment attractiveness. Management’s commitment
to invest 50% of operating cash flows back into the company positions Delta to continue to sustain
profitable growth.
Growth in Foreign Markets
Delta has made an initiative to partner with strong regional airlines across the world to leverage its
world-class service into new branding opportunities with less capital investment . Expansion via
strategic partnerships is expected to carry higher margin growth opportunities.
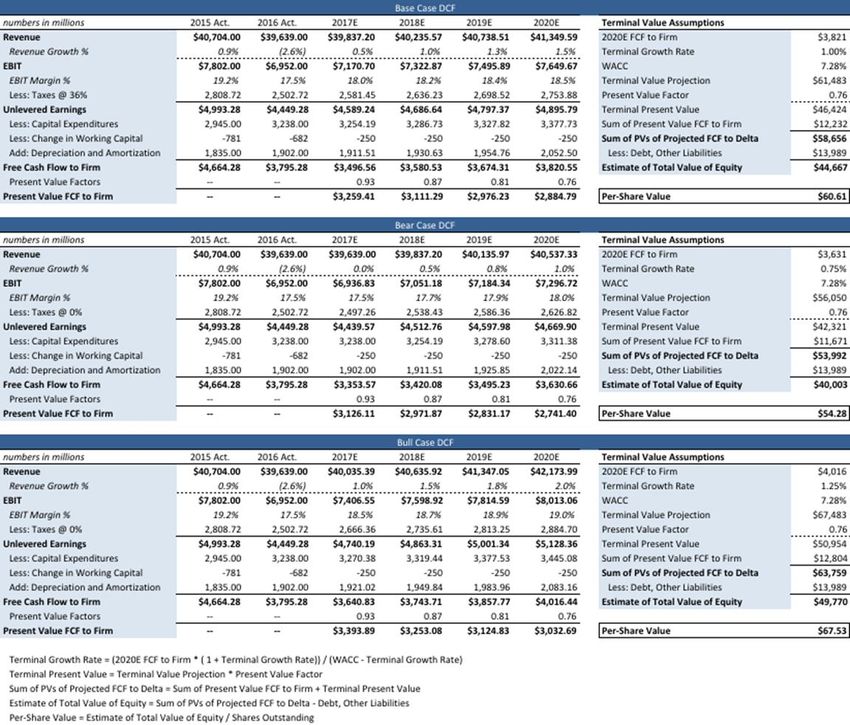
Figure 1: Valuation Summary
Valuation
The Discounted Cash Flows (DCF) and P/E analysis suggest a large range of potential share value
estimates. Taking a weighted average between the two valuations, our bullish case of $63 suggests an
attractive opportunity. However, this outcome presumes strong U.S. economic conditions, significant
and sustained top line revenue growth and operating expense containment .
Our baseline estimate of $57 is in line with the current share price which is benefitting from historically
high broad stock market valuations. Our bear case valuation estimate of $50 assumes the pace of
Figure 2: Holding Returns of Delta’s operating performance moderates from recent levels.
Delta Airlines versus Industry
Delta 1-Year Prices and Valuation Targets
Figure 3: Price Change of Delta
Airlines versus S&P 500 Airline
Index and S&P 500
1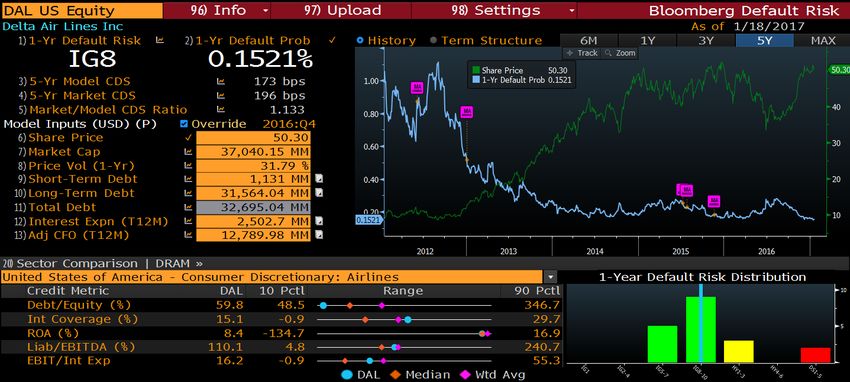
Investment Summary
Recommendation: Hold
Figure 4: Betas of Delta
We are initiating coverage of Delta Airlines “DAL” with a Hold rating and $57 price target.
Airlines, S&P500 Airline Index
and S&P500 Index We believe that as a long term investment, Delta faces several challenges in reaching of our
target price range.
As a maturing airline, growth in Delta’s topline is slowing, and margin growth has begun
to level off.
With 36% of revenue derived from the international market, both declining year-over-
year and compound growth rates in international revenues opens Delta to a more
significant risk than its competitors.
Figure 5: Employee Satisfaction Delta is focusing on competing in a highly saturated and competitive domestic market
Survey Results, 2012-2016 where larger industry competitors are finding growth harder to achieve .
Delta and the airline industry face some headwinds from global economic conditions:
Declining gas prices over the past 3 years has driven down demand for flights as
traveling via car is more affordable.
Stagnation in airplane technology within the industry has not provided excess efficiency
in the market through faster planes, higher fuel efficiency or dramatic increases in
capacity.
The 10YR compound annual growth rate (CAGR) for the quantity demanded within the
air transportation industry is -0.9%, while the 10YR CAGR for the average price paid
within the air transportation industry is 2.9%. If the trend in quantity demanded for air
transport continues to fall, airline companies will either be forced to keep increasing
Figure 6: Delta’s On-Time % prices to make up for lost business or find ways to cut costs in a capital-intensive market.
versus United Airlines (UAL),
American Airlines (AAL), and Revenue and Profitability Estimates
Southwest Airlines (LUV) Given Delta’s 2016 revenue results and a lackluster outlook for the airline industry as a
whole, we project relatively flat revenue growth moving into 2017 and 2018. Forward-
looking margins indicate that the company will maintain above average profitability with a
decline in both long-term debt and operating expense per available seat mile (ASM). Driving
down debt and costs will enhance Delta’s financial strength into the future.
Creating a World-Class Company
In the early 2000’s, Delta accumulated over $10 billion worth of excess debt outside of its
usual operations. In 2005, the Company declared Chapter 11 bankruptcy and restructured its
debt obligations to its employees and lenders. Delta’s management took pay cuts and
convinced lenders to provide debtor-in-possession (DIP) financing while the company
revitalized. Since 2007, Delta has grown to be one of the largest players in the airline
industry, both domestically and internationally. Delta has shifted its focus towards improving
customer experience through its implementation of unique technology, services and rewards
programs. In addition to earning its spot as one of the most preferred airlines by corporate
and non-corporate travelers alike, Delta has structured its debt payments from its
bankruptcy to be paid off by 2020, created strong margins, and has outgrown the S&P 500
Airline Index by over 150% in the last 5 years.
Industry Preview
The global airline industry has a total market revenue of $709 billion . The massive United
States market comprises just over $200 billion. Major airlines require large amount of capital
spending to handle the purchasing and financing of aircraft and equipment, as well as the
additional costs associated with gaining hub space in airports to expand route options. Airline
companies are exposed to various risks including the cyclical nature of the industry, interest
2
rate changes which may adversely affect loan obligations, and volatility in fuel prices. The
     Figure 7: Year over year                     International Air Transportation Association (IATA) predicts that by 2034, 7 billion people will
     Gapacity Graph                               travel via airlines worldwide. This assumes a rate of 3.8% annual average growth.

                                                  Investment Risks
                                                  Economic Risk
                                                  Interest Rates
                                                  At the end of 2015, Delta had $4.0 billion and $4.1 billion in fixed and variable rate debt,
                                                  respectively. A 100 bp increase in interest rates would decrease the fair value of the fixed
                                                  rate debt by $160 million and increase annual interest payments on the variable rate debt by
                                                  $39 million.
                                                  FOREX Rates
                                                  At the end of 2015, Delta had $94 million in open currency forward contracts. Its primary
Figure 8: Year over year Capacity                 exposures are the Japanese yen and the Canadian dollar. Delta estimates that a 10%
Graph                                             appreciation in one of those currencies would cause a $46 million loss, while a 10%
                                                  depreciation would cause a $38 million gain.
                                                  Internal Risk
                                                  Pension Obligations
                                                  Delta assumes a 9% rate of return on its pension obligations. Many forecasters do not
                                                  foresee market returns this high going forward, reflecting a maturing U .S. economy. Both
                                                  Delta’s pension funding gap and their expected return on their pension assets are higher
                                                  than their peers.
                                                  Technological Issues
                                                  An extended interruption in Delta’s systems would adversely affect profits. On August 8,
                                                  2015, Delta lost power at its operations center in Atlanta . This outage affected some 2,000
                                                  flights, and Delta estimates it cost the company $150 million.
Figures 9 and 10: Delta begins to                 Market Risk
Realize Fuel Price Savings in                     Fuel Costs
2014, and Obtains Advantage                       In recent years, fuel costs have been highly volatile. Fuel costs made up 23% of operating
over Industry Peers                               expenses in 2015, but 35.4% and 33.3% in 2014 and 2013, respectively. If fuel prices were to
                                                  rebound quickly, Delta may not be able to pass these costs fully on to customers . The airline
                                                  industry is highly competitive, and despite Delta’s brand loyalty, flyers have relatively low
                                                  switching costs if ticket prices are higher than competitors’. Additionally, many flyers book
                                                  tickets far in advance of travel. If fuel prices increase in the gap between ticket booking and
                                                  the customer’s flight, the price of the fare may not adequately cover the increase .
                                                  Fuel Supply Disruptions
                                                  Fuel supply could be disrupted by weather, geopolitical events, regulatory changes, or
                                                  environmental challenges. The resulting increased fuel costs could create a drag on Delta’s
                                                  profits. For example, Hurricane Sandy caused the Trainer refinery to post a $63 million loss in
                                                  2012.

            Unhedged Fuel Price                   Global Terrorism
                                                  If consumer demand for travel is dampened by fear of terrorism, airlines will be affected . In
      Period              DAL        Industry
                                                  the week following September 11th, the US Airlines Index fell by about a third. Even
             2011          $3.16         $3.16    if domestic demand for flights does not sink, Delta could still be affected by regional drops in
             2012          $3.23         $3.22    demand in conflict ridden areas. Security costs may also rise, pressuring Delta’s margins.
             2013          $3.11         $3.11
                                                  Competition Risk
             2014          $2.89         $2.94    Low Cost Carriers
             2015          $1.67         $1.76    Low-cost carriers provide a potential risk to erode market share of Delta . Southwest remains
             2016          $1.41         $1.43    the largest competitor to Delta and its business model reflects this low-cost strategy. To
Source:Source:
        Investor  Day
               Delta   Presentation
                     Investor          2015
                              Day Presentation,   counter this potential risk, Delta has opted to provide a more premium and efficient, reliable
                                         2016     service. The company also introduced a “basic economy” product to mitigate this risk .

      Figure 11: Seating Chart                    Loss of Hub Space

                                                                                                 3
Should Delta be forced to reduce its current supply of airport gates, they would experience a
decline in passenger revenue simply by having less capacity to provide flights. Regional
carrier partnerships play a key role in allowing the company to enter small hub spaces as
well. Should these partnerships fall through, it leaves space for competitors to gain more
flights.
(See Appendix A1)
Industry Overview: Broad Market Drivers of Airline Industry Performance
Global Economic Growth Fuels Discretionary Spending and Corporate Profits
Global economic growth increases the disposable income of consumers, raises the standard
of living, and boosts company profits—all of which spur demand for air transportation for
passengers and cargo. Estimates for 3Q16 indicate real gross domestic product (GDP)
increased at an annual rate of 3.2%. U.S. real disposable income in 2016 has remained
relatively flat, increasing only 0.1% in August, 0.2% in September, and 0.3% in October.
Corporate profits from current production (corporate profits with inventory valuation
adjustment and capital consumption adjustment) increased $13.8 billion in 3Q16, in contrast
to a decrease of $12.5 in 2Q16. In recent years, U.S. corporate profits have been stressed by a
strong dollar, rising labor costs, and the energy sector.
Vulnerability of the Airline Industry to Exogenous Events
The airline industry may be adversely affected by events such as infectious disease, weather
patterns, terrorism or other security concerns.
Regulation Minimizing Consolidation
Consolidation in the airline industry alleviates fragmentation and overcapacity, which has
driven financial performance of several airlines over the past 20 years. Though U.S. legal
frameworks limit consolidation among airlines, many have created strategic partnerships
which allow route sharing, among other synergies.
Data Analytics
Upgrading airplanes is incredibly expensive, which has caused airlines to shift focus towards
utilizing data analytics to improve airport operations, loyalty programs, baggage handling,
and customer engagement
Pricing Pressure and Cost Reductions
The airline industry is one of the few industries in which product pricing has declined over
the years. Deregulation of the airline industry in the 1970s and 1980s increased airlines’
competition for customers and drove prices down. The emergence of low-cost carriers in
recent years has led to further pricing pressure within the industry, which has caused
margins to suffer for many major carriers.
Fuel Costs
Fuel is a major cost for airlines, and volatility in fuel prices causes large swings in profitability
year-over-year. Delta purchased a refinery in 2012 that refines jet fuel, diesel and gasoline .
This allows Delta to trade with other fuel companies across the US to obtain the optimal
price for jet fuel. It also gives Delta power to lower the market price of jet fuel if it chooses to
unload its stores and raise supply in the market. The Company currently enjoys a 3-cent
discount compared to the industry average which has historically resulted in large fuel
savings. During periods of high price inflation for fuel, Delta enjoys an even better 10 cent
discount compared to the market. According to a Delta conference call on November 30th,
2016, every one-cent change in the price of jet fuel results in a $40 million profit or loss.
Economic Indicators’ Correlation to Revenue
4The demand for passenger flights, Delta’s largest revenue stream, tracks closely with key
economic indicators from the nations where the company provides air transport services.
Gross domestic product (GDP), disposable personal income, business confidence, and
consumer confidence can affect the demand for both business and leisure flights . US GDP
regressed with the company’s mainline revenue has the highest correlation. Disposable
income and consumer confidence also have noticeable statistical significance as noted in the
Figure 12: Delta’s Revenue as a %
tables. The random variable of weather is also a large factor that plays into the demand for
of Global Industry Market share
flights and the airlines’ abilities to deliver their services. (See Appendix C4)
Load Factor
Delta maintains a high load factor compared to the industry which helps drive higher profits
for the company. Load factor is the percent of seats that are filled on a flight . When airline
demand is high and supply stays low, load factor rises and allows for improved profitability .
Delta is a pioneer of revenue management and strategically manages seats available to offset
Total Market: pricing.
600 B Debt, Employee Pensions and the Impact of Interest Rates
The company has been managing their debt and pension costs exceptionally as management
expects to enter a rising interest rate environment. Historically, the airline industry has used
high amounts of debt financing to fund normal operating expenses. If Delta can continue its
path towards deleveraging, it will benefit more than its competitors as interest rates rise.
DAL Rest of Industry Top 5 Business Description
Figure 13: Delta’s Virtuous Cycle Delta Airlines was founded in 1928, and is headquartered in Atlanta, Georgia. Delta’s primary
operations can be divided into three segments: Air Transportation, Airport Services, and
Freight. It provides air transportation and freight serviced through a system of domestic and
international routes, with access to 57 countries and over 300 destinations . Delta has
remained an industry leader because of its network and has been ranked #1 by the Business
Travel News Annual Airline Survey for five consecutive years. The company prides itself in its
position as the industry leader for quality and efficient service, and ideal present in the
company’s use of “The Virtuous Circle”.
Monroe Energy LLC and MPIC LLC are wholly-owned subsidiaries of Delta, purchased in 2012.
Located near Philadelphia, Pennsylvania, these companies operate the Trainer refinery for oil
and jet fuel production. Their assets include pipelines and terminal assets, reflecting Delta’s
intention to mitigate the cost of jet fuel prices for its fleet . Delta estimates the refinery allows
the airline to purchase fuel at an average of 3 cents per gallon less than the industry average .
Market Share
Figure 14: Delta’s Ownership Delta prides itself on being a high-quality airline utilized by both business and leisure
Summary travelers. Delta represents 6.6% of the total market size for passenger transportation . Delta is
the largest U.S. airline by market cap ($35.7 billion), followed by Southwest Airlines ($30.0
Ownership Summary billion). The company maintains its market share through product differentiation, strategic
Type Percentage alliances, and continual investments in its fleet. Low-cost carriers, such as Southwest, have
Institutions 82.71% been eroding Delta’s market position over the last several years as both business and leisure
travelers become more cost conscience during the recession. However, we think this
Top 10 Inst. 30.34% represents an opportunity for Delta to regain share as the economy improves .
Insiders 0.26%
Shareholder Structure
Retail 17.03%
Source: Factset
5Figure 15: Maintenance Delta is currently owned 82.7% by institutional investors, 17.0% by retain investors and 0.3%
Cancellations since 2010 by company insiders. The top 10 institutional holders account for about 30% of all
outstanding shares of Delta and include funds owned by Vanguard, JP Morgan, and
Blackrock. Most recently, Berkshire Hathaway bought 6.3MM shares of Delta. This is an
interesting take as it represents a shift in sentiment towards airline stocks becoming more
favorable long-term investments (as Berkshire usually invests over long investment horizons).
Corporate Strategy
Innovative Technology
Delta set a fifth consecutive operational and customer service record in 2015, a product of its
investments in technology. This technology assists Delta in staying on time, which, in turn,
makes it a top choice for flyers. The company is also working towards increasing efficiency for
their passengers. For example, in early 2016, Delta acquired a 5% stake in CLEAR, a
biometrics firm. CLEAR produces iris and fingerprint scanners that may shorten wait times in
security lines. Delta TechOps, the Maintenance, Repair, and Overhaul (MRO) division has
been a huge point of strength for the company, providing excellent service to Delta’s fleet . As
Figure 16: Delta vs. Competitor such, maintenance related cancellations fell 93% from 2009 to 2015. In 2015, Delta reported
Missed bag Ratio approximately 200 days with no domestic flight cancellations. The next three largest airlines
combined had only 31 such days. This investment in serving customers ensures Delta remains
the foremost U.S. airline. We believe leading the industry in reliability causes customers to
both come back and spend more.
Delta is the first major airline to offer luggage tracking through its FlyDelta smartphone
application. The tracking system incorporates radio frequency identification (RFID) through
chips in luggage tags. Using this technology, scanners on the baggage belts read the chips on
each luggage tag and indicate whether bags are on their appropriate route . RFID technology
allows FlyDelta app users to check on their luggage at any point during their travel
experience, therefore reducing some of the stress associated with airplane travel . Delta’s
baggage accuracy is already outstanding, consistently rating near the top of the industry and
Figure 17: significantly better than main competitors Southwest, United, and American . Spokeswoman
Ashton Morrow said the system may increase Delta’s accuracy rate from 90 .0% to 99.9%.
Utilizing RFID technology to transition the task from employee to machine will not only
increase efficiency and reduce the likelihood of mishandled baggage, but may present a
money saving opportunity for Delta.
Maintaining Superior Culture
88% of Delta’s employees indicated they would recommend working at Delta to a friend—far
above the industry average of 76%. This employee satisfaction filters into how customers are
treated, improving their experience. Through Delta’s profit sharing plan, 10% of earnings
before taxes and managers’ salaries is paid in bonuses through Delta’s profit sharing plan .
Furthermore, 15% of Delta’s equity is owned by employees as part of Delta’s Equity Stock
Ownership Plan (ESOP).
International Partnerships
Delta benefits from both joint ventures and equity partnerships with international airlines .
The company has equity stakes in China Eastern, Virgin Atlantic, AeroMexico, and GOL,
Figure 17: Delta vs. Competitor allowing Delta to have a presence in areas that encompass 98% of US-international
CapEx as % of OFC passenger demand. International partnerships, such as SkyTeam, represent a significant
source of revenue for its members, and allow carriers to engage in joint sales and marketing
initiatives.
Cash Management
6Figure 18: Average Age of Delta has paid down $10 billion in debt since 2009, and has raised its S&P credit rating to
Aircraft in Delta’s Fleet BB+. It spends about half of its operating cash flow on fleet, facility, and technology
initiatives, totaling $2.5-3.0 billion annually. Delta has worked diligently to maintain its strong
financial position. As a result, default risk has steadily declined since the company’s 2007
emergence from bankruptcy and is now 0.1525, below the industry average of 0.1624.
Airplane Assets
In total, Delta utilizes 809 planes for its operations. Of these, 612 are owned, while the
remainder are either capital leases (79) or operating leases (118). The average airplane age is
17.1 years. Delta plans to replace about 50% of its mainline fleet by 2020, to make room for
more modern planes while simultaneously trying to control capital expenditures . This also
falls in line with its intention to have at least 75% of its planes owned and 25% leased .
(Appendix C2)
Financial Analysis
Financial Analysis
Ratios 2011 2012 2013 2014 2015 2016
Profitability
Net Operating Income (MM) $2,243.0 $2,600.0 $3,548.0 $5,268.0 $6,608.0 $6,502.0
Operating Margin 5.6% 5.9% 9.0% 5.5% 19.2%
Net Profit Margin 2.4% 2.8% 27.9% 1.6% 11.1%
Return on Assets 2.0% 2.3% 21.8% 1.2% 8.5%
Return on Equity 0.0% 0.0% 0.0% 6.4% 46.0%
EBITDA Margin 10.7% 11.4% 13.8% 17.4% 20.7%
Liquidity
Current Ratio 0.6 0.6 0.7 0.5 0.5
Quick Ratio 0.4 0.4 0.4 0.3 0.3
Total Line of Credit $1,825.0 $1,825.0 $1,925.0 $1,903.0 $2,207.0
Leverage
Total Debt to Equity 0.0 0.0 97.4 109.6 76.8
Total Debt to Assets 31.7 28.8 21.7 17.9 15.7
Equity Multiplier 0.0 0.0 4.5 6.1 4.9
Credit
Total Debt $13,791.0 $12,829.0 $11,342.0 $9,661.0 $8,329.0
Short Term Debt $1,944.0 $1,747.0 $1,547.0 $1,184.0 $1,563.0
Long Term Debt $11,847.0 $11,082.0 $9,795.0 $8,477.0 $6,766.0
Interest Coverage Rate 2.5 3.2 1.5 0.9 0.6
Net Debt/EBITDA 2.7 2.3 1.5 0.9 0.6
Standard & Poor's Rating B+ B+ BB- BB BB+ BB+
Source: Bloomberg
Figure 19: Revenue Streams
Delta’s operational revenue is derived from three segments: Passenger Transportation,
Airport services, and Cargo Transportation. Passenger Transportation is revenue generated
from tickets sold on flights, and accounts for 85.5% of total revenue. Airport Services consists
of additional customer-facing services such as curbside check-in, kiosks, Delta Sky Club, and
premium security lines, and accounts for 12.5% of total revenue. The remaining revenue is
generated through Cargo Transportation, which is the use of jets for freight . This structure of
revenue streams is similar to its United States peers—American Airlines and United
Continental derive 98.2% and 97.5% of revenue from Passenger Transportation, respectively .
With passenger transportation being its primary source of revenue, Delta looks to emphasize
growth in this segment through efficient network operations and leading customer service .
International Revenue
7Figure 20: Delta Revenue by Delta generates 64% of total revenue domestically, or within the United States.
International Region Internationally, the Company receives 19.0% of its overseas revenue from the Atlantic region,
followed by 9.0% in the Pacific, and the remaining 8.0% from Latin America. On a five-year
basis, Delta’s domestic revenue CAGR comes in at 6.36% while international revenue has
grown at a stagnant 0.6%. The growth rate for international is kept positive by a strong 6.5%
CAGR in Latin America. Delta has stated they plan to concentrate resources towards growth
in the domestic segment while relying on partnerships through international joint ventures
with Virgin Atlantic, Air France, and Virgin Australia to drive their non-domestic revenue.
Several other services provide growth and diversification opportunities, including:
SkyTeam Global Airline Alliance: Delta’s membership in the SkyTeam global airline
Figure 21: SkyTeam Logo and alliance, in addition to other partnerships, allows Delta to better serve its customers
Aeromexico Brand through a wider variety of travel destinations and frequencies as well as improved
connection schedules.
Delta Connection Regional Carrier Program: Regional partnerships allow Delta to
better serve customers in small and medium-sized cities. In 2015, Delta Connection
comprised approximately 17.0% of Delta’s total passenger revenue.
Delta SkyMiles Rewards Program: Delta’s partnership with American Express is
expected to produce over $300 million in incremental value for 2016, and is
expected to contribute $4 billion annually by 2021. (appendix discuss features etc.)
Revenue and Margin Growth
Between 2006 and 2011, Delta experienced revenue growth of 15.4%. As the company enters
the stage of maturity, its growth has since tapered off from such figures. The 10-year CAGRs
for revenue growth, gross margin and operating margin are 8.7%, 8.4% and 60.6%,
respectively. However, Delta has lowered its predicted operating margins due to increased
pay for it pilots. It is realistic for Delta to continue to generate moderate revenue growth, as
well as gross margin expansion, in future periods by staying focused on domestic growth
using regional carriers.
High Profitability
Since 2011, Delta has consistently grown its revenue and net income and expanded its
EBITDA margin. Compared to its peers, Delta ranks highly in profitability with an EBITDA and
profit margins of 18.9% and 10.0%, though these have grown at a slower pace over the past
five years relative to the industry. That said, on an absolute dollar basis, both revenue and
net income are strong relative to Delta’s competitors. The Company’s revenue outperforms
Figure 22: Competitor PRASM every other airline, with the exception of American and United.
Summary from 2013-2015
PRASM
Debt Management
Equity 2013 2014 As of 2015 Delta has committed to driving down total debt to $4.0 billion by 2020. Since 2011, the
DAL 14.15¢ 14.58¢ 14.1¢ average year over year decline in total debt is 11.8%. Applying this deleveraging rate to the
AAL 13.67 13.97 13.21
2015 year-end debt level ($7.3 billion), Delta should achieve its goal by its target year. In
UAL 13.5 13.72 13.11
LUV 12.83 13.48 13.02 2005, the Company filed for chapter 11 bankruptcy. Through debtor-in-possession financing,
ALK 12.67 12.69 12.01 restructuring of pension plans, worker layoffs, and selling off additional assets and
JBLU 11.61 11.88 11.96 subsidiaries, the management team successfully navigated the Company out of bankruptcy.
SAVE 11.94 11.82 10.08
ALGT 8.00 8.18 6.99 Management then set a new goal for financial stability and redeeming its investment grade
Source: Bloomberg status. Since 2007, Delta has seen its S&P credit rating increase from a B to a BB+ rating,
which is just under investment grade.
Earnings
8Figure 23: 2015 Return on Equity Including the most recent quarter (4Q16), Delta has only missed earnings seven times since
using 3-Step DuPont Analysis 2011; three of which occurred in the year 2011. Delta missed fourth-quarter 2016 earnings
by only 0.5 bps and is estimated to have an EPS of $0.93 for first-quarter 2017.
2015 Three-Step DuPont
Equity Result PRASM
AAL 111.27% At 14.10¢, Delta currently leads its industry in passenger revenue per available seat mile
ALGT 63.47% (PRASM). The Industry average according to MIT’s Global Airline Industry Program is 12 .48¢.
UAL 49.94% From 2014 to 2015, PRASM declined slightly across all airlines while available seat miles
ALK 34.92%
(ASM) grew steadily. For companies to maintain revenue growth in slowing PRASM
DAL 34.62%
conditions, reducing expenses and maximizing revenue on every flight is a priority. Delta
LUV 32.01%
SAVE 25.80%
reduced its operating expense per passenger mile, which offset the decline in PRASM over
JBLU 20.91% the period.
Source: Bloomberg DuPont Analysis
Figure 24: 2015 Return on Equity The three step DuPont Analysis provides a detailed look at a company’s return on equity
using 5-Step DuPont Analysis (ROE). By integrating profitability, efficiency, and financial leverage into one formula, changes
2015 Five-Step DuPont
in a company’s ROE can be understood by their individual components . A five step DuPont
Equity Result Analysis can be used to further analyze the effects of taxation and interest on a company’s
AAL 95.33% profitability. As of 1/16/2017, Delta is the only Airline to have released its 4Q15 earnings
UAL 42.84% which means all comparisons will be for 2015.
ALGT 35.52%
After negative years in 2011 and 2012, Delta has developed a strong and steady ROE relative
ALK 21.67%
LUV 19.30%
to its competitors. Using the 3-step DuPont Analysis for 2015, Delta had a ROE of 35% which
DAL 19.09% was up 1% from the previous year. This was the median for Delta’s comparable companies
SAVE 15.84% group. The 5-Step DuPont Analysis shows how some of the leading ROE’s in the peer group,
JBLU 10.59% American Airlines and United Airlines are benefitting from an effective tax rate of almost
Source: Bloomberg zero. While the average Airline pays between 34-38% tax, American and United pay 0.4% and
0.3% respectively.
Valuation
Figure 25: 2011-2015 Delta vs. Discounted Cash Flow
Competitors ROE using 3-Step We used the discounted cash flow method because of the correlation between financial
DuPont Analysis performance, growth, and profitability. To properly gauge for variations in performance
multiple scenarios were run to derive a range of valuations calculated in accordance with
different growth estimates. This was performed using our calculated WACC of 7.3%. Revenue
Delta vs. Comparable Companies growth rates used were conservative in their movement in response to Delta’s 2016 results.
Avg. ROE
100.00% Compared to market consensus revenue estimates for upcoming years, our growths are
revised downward to remain conservative. In our Bull, Bear, and Base valuations, we varied
50.00% growth rates and ran sensitivities to account for Delta’s ability to improve its margins on
0.00% differing levels. If Delta is able to increase its margins, more value will be available to
shareholders.
-50.00%
The terminal growth rate was calculated using compounded annual rates of the Air
-100.00% Transportation industry based off price and quantities served . Data was collected from the
2011 2012 2013 2014 2015 US Bureau of Economic Analysis during 2000 – 2015 indexes. We arrived at a terminal growth
value of 2%. Continuing our theme of remaining conservative, have revised it downward for
DAL Average 1% in our baseline valuation. Our intentions are to assume the industry may continue to slow
if quantity served continues to trend downward with prices within the Air Transportation
Figure 26: Discounted Cash Flow industry trending upwards. One of the reasons for our conservative estimates is that Delta is
Inputs the one of the largest in its industry, so we can reasonably expect its growth to slow.
Discounted Cash Flow Forecasted P/E
Weighted Average Cost of Capital (WACC)
Revenue $39,639
To properly value Delta for the upcoming 5 years, WACC was calculated as of 2016. Using
WACC 7.82%
publicly available comparable companies, a weighted average unlevered beta was calculated
Tax Rate 36.00%
from our chosen peer set within the airline industry . To re-lever the beta, we applied Delta’s
Equity Weight 82.60%
capital structure based on the current debt to market capitalization ratio . This beta was then
Debt Weight 17.40%
used for our CAPM calculation to arrive at a cost of equity of 7 .97%, which we rounded up to
8.0%.
9Figure 27: Cost of Equity Inputs Cost of debt was calculated as a mean value of interest rates for BBB bonds between the
period from 2002 – 2008. We added 25bps to the mean value as the credit rating of Delta
CAPM
recently moved into BB+ territory. The resulting cost of debt value is approximately 6. 0%. The
Risk Free Rate 2.36% current interest rate environment implies an abnormally low cost of debt, which in turn,
Expected Mkt Return 7.41% causes inflation in our valuation. In using historical rates, we are taking into account the
Comp Beta 1.250 likelihood of interest rates to move higher from current rates during the forecasted period
Unlevered Beta 0.99 and eventually return to pre-Great Recession levels. Using the market value of Delta’s equity
Relevered Beta 1.11 in tandem with the total amount of current debt for DAL, we find that about 83.0% of their
Cost of Equity 7.97% capital is equity and 17.0% relying on debt. Using aforementioned data and a tax rate of
Figure 28: Bureau of Economic 36.0%, a WACC of 7.3% was calculated and adopted for our DCF valuation .
Analysis Price and Personal
Consumption Indices P/E Valuation
A Delta share value estimate also was calculated using the Price-to-Earnings (P/E) Multiple
Method. In recent years, Delta's P/E has remained at a significant discount to the S&P500
Price and Real Personal Consumption Indexes
Air Transportation 2005 2015 CAGR P/E. A Delta share value estimate is obtained from estimates of the 2017 S&P500 P/E, an
Quantity 119.36 106.38 -0.09 assumed Delta’s P?E discount and market analysts' forecast of Delta's earnings per share for
Price 90.23 120.71 0.03 2017. Taking the average of the last 5 years’ P/E of the S&P500, our calculations put the
Total 0.02
Source: Bureau of Economic Analysis Tables 2.4.4,2.4.3
historical market P/E at 18.4. Comparing Delta’s historical P/E for the same period puts its
average at 9.9, a 0.53 ratio to the market P/E historically. Taking this ratio and expecting Delta
Figure 29 & 30: Historic and to continue to be at a 0.53 discount to the market, the estimated P/E comes out to be 10 .4
Forecasted P/E Ratios for Valuation when compared with a market consensus P/E of 19.3. This puts DAL on par with historical
Actual PE: S&P500 versus Delta Airlines numbers, implying moderate price growth in tandem with the growth in their earnings .
P E - annual S&P500 DAL Taking our estimate P/E and multiplying it by the market consensus EPS of $5.12 gives a
2016 20.86 9.36 baseline $53.49 one-year price target.
2015 19.00 14.30
2014 18.60 4.30 Monte Carlo Simulation
2013 18.60 11.40 A Monte Carlo simulation was used to model possible stock prices a year from now in order
2012 15.00 10.00
to validate the DCF, comparable companies, and P/E analysis. The median return was roughly
AVG PE 18.41 9.87
STD DEV 2.12 3.65
4.2%, and 56.25% of simulations showed positive one-year returns. The standard deviation of
Forecasted PE: S&P500 versus Delta Airlines
the final returns was 28%, or $14.16, putting the Base and Bull case prices derived from the
Forecast S&P500 DAL 2017 Est. PE DCF well within one standard deviation of the mean return. Our Bear case was slightly more
2017 Baseline 19.5 10.4 than one standard deviation less than the mean . (See Appendix G4)
OPTIM (+ 1 Std Dev) 21.6 11.6
PESSIM (-1 Std Dev) 17.4 9.3 Corporate Governance
Management
Figure 31: Valuation Price Estimates Chief Executive Officer: Ed Bastian
Bastian has been with Delta for 16 years. He has been the CEO since May 2016, and was a
vital leader during Delta’s restructuring following bankruptcy.
Delta Airlines Price Estimate Chief Operating Officer: Gil West
Delta EPS Forecast * 2017 DAL Price
West joined Delta in 2008 following the Northwest merger. As COO, he is responsible for
2017 Baseline 5.12 $53.49
OPTIM (+ 1 Std Dev) $59.33 several departments concerning operations and customer experience .
PESSIM (-1 Std Dev) $47.66
* Consensus EPS, Zacks Investment Research
Chief Financial Officer: Paul Jacobson
Jacobson was extremely important following Delta’s reemergence from bankruptcy . He has
Figure 32: Monte Carlo Simulation overseen the pay down of $10B in debt, an upgrade to investment grade credit status, and
Results the firm’s current capital allocation strategy.
Monte Carlo Results Social Responsibility
Low $19.29 Delta is committed to promoting diversity and acceptance. As a result, the company has been
High $140.20 awarded with the following in 2016:
Mean $53.64 Honor for workplace diversity by Fortune Magazine
Median $51.98 Best Place to Work for LGBT Equality by the Human Rights Campaign Foundation
% Above $49.19 58.50% Companies that Care Honor Roll
Most LGBT friendly airline in Latin America by GNETWORK360
10Appendices
Appendix A Investment Risks
Appendix A1: Mitigation Discussion
Global Terrorism: If consumer demand for travel is dampened by fear of terrorism, airlines will be affected . In the week
following September 11th, the US Airlines Index fell by about a third. Even if domestic demand for flights does not sink, Delta
could still be affected by regional drops in demand in conflict ridden areas . Security costs may also rise, pressuring Delta’s
margins.
Mitigant: Despite international terrorism negatively impacting airline stocks on a short-term basis, an investor with a lengthy
time horizon shouldn’t be affected by temporary drops in price.
Fuel Costs: For several years, fuel costs have been highly volatile. Fuel costs made up 23% of operating expenses in 2015, but
35.4% and 33.3% in 2014 and 2013, respectively. If fuel prices were to rebound quickly, Delta may not be able to pass these costs
on to customers. The airline industry is highly competitive, and despite Delta’s brand loyalty, flyers have relatively low switching
costs if ticket prices are higher than competitors’. Additionally, many flyers book tickets far in advance of travel. If fuel prices
increase in the gap between ticket booking and the customer’s flight, the price of the fare may not adequately cover the
increase.
Mitigant: Delta has maintained a fuel hedging program to reduce the risk imparted by fuel price fluctuations . For 2016, Delta
does not have any hedges in place.
Mitigant: Delta also maintains the Trainer refinery; a competitive advantage other airlines do not possess.
Fuel Supply Disruptions: Fuel supply could be disrupted by weather, geopolitical events, regulatory changes, or environmental
challenges. The resulting increased fuel costs could create a large drag on Delta’s profits. For example, Hurricane Sandy
caused the Trainer refinery to post a $63 million loss in 2012.
Mitigant: Delta forecasts fuel prices to rise 30% in 2017. Delta expects its refinery to operate profitably over the long term.
Pension Obligations: Delta assumes a 9% rate of return on its pension obligations. Many forecasters do not foresee market
returns this high going forward, reflecting a maturing U.S. economy. Both Delta’s pension funding gap and their expected return
on their pension assets are higher than their peers.
Mitigant: If the discount rate goes up by 2%, the pension plan will be considered fully funded .
Mitigant: Delta is contributing more than the minimum to its pension plans in order to reduce its funding gap .
iAppendix B: Industry Overview and Competitive Positioning
Appendix B1: Porter’s Five Forces Analysis
Industry
Competition LEGEND
6 0 No Threat
1 Insignificant Threat
4
Bargaining 2 Low Threat
Threat of
2 Power of 3 Moderate Threat
Substitutes
Buyers 4 Significant Threat
0
5 High Threat
Bargaining
Threats of
Power of
New Entrants
Suppliers
Existing Rivalries: High
The four-firm concentration ratio (CR4) of the U.S. airlines industry is 86.99%. The Herfindahl-Hirschman Index for the industry is
2047, indicating that it is moderately concentrated. However, airline companies are fiercely competitive. The average flier will
have a relatively similar experience no matter where they fly . Additionally, third party travel aggregators, such as Priceline, allow
every flier easy access to price comparison tools. These two factors lead to enormous downward pricing pressure.
Bargaining Power of Buyers: High
Buyers, as mentioned, have very strong bargaining power over airlines. A Delta customer dissatisfied with price can easily take
their business elsewhere. The switching costs for a prospective Delta customer to fly with United Airlines or Southwest are
relatively low. Delta, however, can counter this by offering strong rewards programs, such as its Delta SkyMiles credit card
rewards program. This increases switching costs, as consumers don’t want to leave free miles on the table.
Threat of New Entrants to the Marketplace: Moderate
The threat of new entrants into the airline industry is low. Start up and operating costs are extremely high, regulations are
growing more and more complicated, and there are few feasible ways to truly differentiate one’s experience from any other
airline. However, a larger threat is existing airlines pushing into new markets. For example, in 2015, Delta was forced to cancel its
Atlanta-Dubai route due to unprofitability as a result of competition from Gulf airline carriers Emirates, Eithad, and Qatar . This
brings up a second interesting point. Developing world airlines, such as the Gulf carriers, are often government-subsidized. The
Gulf carriers’ government subsidies total $42 billion and are growing. These subsidies distort the market, making competition
impossible.
Bargaining Power of Suppliers: Very Low
Suppliers to airline companies have very little bargaining power. Delta’s scale is so large that they are the main determiners of
pricing with their suppliers - Delta can always find another supplier, but the supplier likely won’t be able to find a customer as
large as Delta.
Threat of Substitutes: Very Low
There is little in the way of direct substitutes for long distance travel. Cars, buses, and trains are substantially slower than planes.
Additionally, per AAA, the cost per mile to operate a motor vehicle is about 60 cents per mile, making personal automobiles only
marginally cheaper by comparison.
iiAppendix B2: Herfindahl Index and Four Firm Concentration Ratio
Herfindahl Index and Four Firm Concentration Ratio
Equity Revenue Market Share Herfindahl
AAL $40,990 25.6% 656.38
DAL $40,506 25.3% 641.10
UAL $37,864 23.7% 560.27
LUV $19,820 12.4% 153.51
JBLU $6,416 4.2% 17.22
ALK $5,598 3.6% 13.11
SAVE $2,141 1.4% 1.92
ALGT $1,260 0.8% 0.66
Totals $154,595 87.0% 2044.19
Appendix C: Business Description, Management & Governance
Appendix C1: Analysis of Delta’s Strengths, Weaknesses, Opportunities, and Threats
Strengths
Brand equity, identity, recognition: Delta reports gaining a 20% revenue premium in the US air market from the Delta brand .
Delta has excellent brand recognition and is recognizable in all their US hubs where they receive most of their revenue . The
company is known for having an image of great reliability and customer service. The claim to reliability is backed by the
company’s more than 200 100% completion factor days this year. This means Delta has had over 233 days in 2016 without
canceling one mainline flights, “more than 4 times American Airlines, United Airlines, and Southwest Airlines combined” (per
DAL investor day).
The company has also been recognized by JD power as being a top satisfaction airline . This year’s rank put Delta closely behind
Alaska Airlines; the first ranked traditional carrier for satisfaction .
Wholly owned oil refinery: The company’s oil refinery gives it an advantage in minimizing one of the largest costs airline carriers
incur, jet fuel. This allows Delta to have more visibility into its fuel costs and receive a 3-cent discount to the industry.
Network of efficient hubs: Delta has a network of efficient hubs that aid in the brand’s functioning . Delta’s home and largest
presence is at the Hartsfield-Jackson International Airport in Atlanta, GA. This airport is the world’s most efficient per the Air
Transport Research Society (ATRS). Delta maintains its network and continues with only the routes and hubs that operate with a
high efficiency.
Cost saving maintenance strategy: Delta has a superior cost saving maintenance strategy for their planes. Proficient in-house
airline maintenance keeps third-party costs down, along with a longstanding partnership with Rolls Royce, who manufacturers
their engines. The company also keeps its maintenance costs low by its pioneering the part-out strategy, whereby the company
utilizes retired planes’ parts that are still serviceable.
Weaknesses
Dependence on North American market: Currently the most appealing air travel market, North America, accounts for 68.5% of
Delta’s revenue. If the company does not continue to expand out of its home market it could lose out on growth opportunities .
However, it could also realize promising returns with relatively less risk than competing in international markets.
Highly cyclical industry: Possibly the largest weakness inherent to the airline industry is the fact it is highly cyclical . If the US,
providing the majority of Delta’s revenue, incurred an economic slowdown, then the company would experience financial stress.
Opportunities
Regional partnerships: Regional carriers present a portion of the airline market that main-line Delta has not put a focus toward.
The company does have partnerships that allow it to benefit from these segments and expand the network. Recently they have
been upgrading the regional 50 seat planes in their fleet to 70+ seating efficient planes . The expansion into regional markets
allows Delta to grow its revenue base with the efficient airline practices they excel at as a large carrier.
iiiAsian markets: China is one of the largest international hubs for travel, however supply has grown more rapidly in recent years
than demand. It is difficult to capture revenues in this low passenger yield environment . Although Asia has seen local oversupply
in recent years, Delta has a similar partnership position there as it does with regional carriers domestically .
Developing markets: The company is more interested in expanding its flights to emerging markets in South America where the
potential for efficient networks is better. This region is producing positive RASM led by the Brazilian and Mexican markets .
Adopting newer planes: Delta continues to “Keep Climbing” and changing for the better. It has set out to replace 50% of the
planes it owns with newer models to realize the efficiency gains. The company also keeps some 25% of its fleet as leased vehicles
to allow for flex capacity; this giving Delta better pricing ability and demand response .
Threats
Pricing competition in industry: The airline industry has seen an overall trend in recent years to ultra-low cost flights. This is a
separate segment than the traditional type of airline that Delta competes with . However, price competition throughout the
airline industry is intense because of this and the sustained lower cost of fuel . Delta has tried to combat this by segmenting its
general cabin seating into “Basic Economy,” “Main Cabin,” and “Delta Comfort+ .”
The Basic Economy can compete with the fare pricing of the low-cost carriers while maintaining the basic benefits of flying Delta .
The company’s experience with Basic Economy pricing created some $20 million in additional revenue within the first quarter
after initiating the plan. Delta showed its ability to adapt and create profitable pricing strategies in difficult times. This also
reduces the threat of a domestic economic downturn drastically harming the company’s profits .
Changing regulations: The airline industry is subject to changing regulations. This possibility could hinder certain aspects of
profitability as well as limit the high customer service level Delta is used to maintaining . Delta’s mainline has been relatively
unaffected by this, although regional partners have experienced pressure . Republic Airways, a regional partner of Delta, suffered
from new regulations for pilots to have additional training while continuing with outdated pilot contracts . This pressured the
airline to ground a portion of its fleet that, in turn, created a loss of service for Delta. Delta has filed a lawsuit and reached a
settlement in Delta’s favor.
Appendix C2: Airline Fleet Age
Flight Equipment: Operating Aircraft Fleet, Commitments, and Options at December 31, 2015
Current Fleet Commitments
Aircraft Type Owned Capital Lease Operating Lease Total Average Age Purchase Lease
B-717-200 -- 13 74 87 14.3 -- 1
B737-700 10 -- -- 10 6.9 -- --
B737-800 73 -- -- 73 14.9 -- --
B-737-900ER 31 -- 19 50 1.3 70 --
B-747-400 4 5 -- 9 23.7 -- --
B-757-200 81 18 11 110 20 -- --
B-757-300 16 -- -- 16 12.8 -- --
B-767-300 13 -- 1 14 24.7 -- --
B-767-300ER 54 4 -- 58 19.8 -- --
B-767-400ER 21 -- -- 21 14.8 -- --
B-777-200ER 8 -- -- 8 15.9 -- --
B-777-200LR 10 -- -- 10 6.7 -- --
B-787-8 -- -- -- -- -- 18 --
A319-100 55 -- 2 57 13.9 -- --
A320-200 58 -- 11 69 20.8 -- --
A321-200 -- -- -- -- -- 45 --
A330-200 11 -- -- 11 10.8 -- --
A330-300 25 -- -- 25 8.8 6 --
A330-900neo -- -- -- -- -- 25 --
A350-900 -- -- -- -- -- 25 --
E190-100 -- -- -- -- -- 19 --
MD-88 83 33 -- 116 25.4 -- --
MD-90 59 6 -- 65 18.9 -- --
Total 612 79 118 809 17.1 208 1
Source: Delta 12/31/2015 10-K
ivAppendix C3: Management
CEO – Ed Bastian: Bastian has been with Delta airlines for 18 years. He was part of the team that led Delta out of bankruptcy in
2005. Starting as a VP of Finance and Control, Bastian eventually left Delta in 2004 . Just six months after his departure he
returned as Chief Financial Officer to play a leading role in Delta’s restructuring. After being named President in 2007 Bastian
was named CEO in May of 2016. His philosophy is as follows: “If you take care of your people, they take care of your customers,
whose business and loyalty allows you to reward your investors.”
COO – Gil West: West joined the Delta team in 2008 and played an integral role in Delta’s and Northwest’s customer service
merger. Prior to his position as COO he served as VP of Customer Service and Technical Operations . He oversees operations and
employees in several departments of Delta including but not limited to: Airport Customer Service; Cargo; Corporate Safety,
Security and Compliance; Delta Connection; Delta Global ServiceAir’s; Delta Private Jets; Flight Operations; In-Flight Service;
Information Technology etc.
CFO – Paul Jacobson: Jacobson joined Delta in 1997 as a Financial Analyst and has held several positions on his way to CFO . He is
responsible for Delta’s global finance organization. He has played a part in several projects of Delta including balance sheet
restructuring that led to $10BN in debt reduction and the airlines current capital allocation strategy . He took his current role in
March of 2012.
Appendix C4: Regression and ANOVA Tables
Summary Output for US GDP to Delta Mainline Revenue Summary
Regression Statistics
Multiple R 0.588882362
R Square 0.346782436
Adjusted R Square0.310492571
Standard Error 644.7617187
Observations 20
ANOVA
df SS MS F Significance F
Regression 1 3972557.87 3972557.87 9.555903246 0.006298529
Residual 18 7482918.13 415717.6739
Total 19 11455476
Coefficients Standard Error t Stat P-value Lower 95% Upper 95%
Intercept -7722.757019 4707.973877 -1.640356812 0.118289055 -17613.8431 2168.329063
Gross Domestic Product
0.913752787 0.295592113 3.091262403 0.006298529 0.292736801 1.534768773
Summary Output for US Consumer Confidence to Delta Mainline Revenue Summa
Regression Statistics
Multiple R 0.630468089
R Square 0.397490011
Adjusted R Square0.364017234
Standard Error 619.230648
Observations 20
ANOVA
df SS MS F Significance F
Regression 1 4553437.283 4553437.283 11.87502337 0.002882096
Residual 18 6902038.717 383446.5954
Total 19 11455476
Coefficients Standard Error t Stat P-value Lower 95% Upper 95%
Intercept 3984.098684 835.6627387 4.767591636 0.000153916 2228.436418 5739.76095
Consumer Confidence
33.74453038
Index 9.792332509 3.446015579 0.002882096 13.17160319 54.31745758
vSummary Output for US Disposable Income to Delta Mainline Revenue
Regression Statistics
Multiple R 0.500780872
R Square 0.250781482
Adjusted R Square0.209158231
Standard Error 690.5173083
Observations 20
ANOVA
df SS MS F Significance F
Regression 1 2872821.245 2872821.245 6.0250335 0.024509657
Residual 18 8582654.755 476814.153
Total 19 11455476
Coefficients Standard Error t Stat P-value Lower 95% Upper 95%
Intercept -3780.968994 4323.215 -0.874573435 0.393326018 -12863.70667 5301.768684
Disposable Personal
0.886500734
Income 0.361159769 2.454594366 0.024509657 0.127732215 1.645269253
The above data and regressions demonstrate the correlations between the main revenue stream for Delta,
Mainline, and the top economic drivers. The data spans the previous 20 quarters for Delta and economic indicators . This period
was chosen to show the recent performance of the company . This period has the greatest relevance to reflect forward looking
projections. The economic data is taken from the United States which accounts for the lion’s share of the company’s revenue .
From the ANOVA tables and regression, it is given that GDP for the United States has a high statistical likelihood to be correlated
with Delta’s Mainline Revenue. The significance F is 0.0063. As the overall economy of the United States performs well, Delta’s
revenue stream will perform well.
From the information, it is given that United States consumer confidence also has a high statistical likelihood of being correlated
with Delta’s Mainline revenue. The significance F is 0.0029. While consumers have a high confidence in the United States’
economy, they are more likely to purchase plane tickets with Delta.
From the information, it is given that United States disposable income is likely to correlate with the Mainline revenue . The
significance F is 0.0245. The greater the disposable income of the United States, the more plane tickets will be purchased with
Delta.
This information shows a positive prediction that it is likely Delta’s revenue will increase
as the United States’ economy continues performing well.
Data for regression sourced from FACTSET.
Appendix D: Corporate Strategy
Appendix D1: Recent Developments in International Partnerships
The US Department of Transportation granted Delta and Aeroméxico antitrust immunity to complete a joint venture agreement
to create the first and largest cross-border alliance between the US and Mexico. Delta’s partnerships with international airlines
Aeroméxico, WestJet, Gol, Air France-KLM, China Southern, China Eastern, Korean Air, Virgin Atlanta and Virgin Australia allow
Delta to maintain a presence in markets which encompass 98% of US-international passenger demand.
Appendix D2: Regional Carrier Program
Delta’s regional carrier program, Delta Connection, the company has contractual agreements with ExpressJet Airlines (check
appendix DAL 10k), SkyWest Airlines, Shuttle America Corporation, Compass Airlines, GoJet Airlines, and Endeavor Air (a wholly-
owned subsidiary of Delta). Regional partnerships allow Delta to better serve customers in small and medium-sized cities.
Through regional partnerships, Delta pays regional carriers an amount defined in the respective contracts in exchange for all
ticket, cargo, mail, in-flight, and ancillary revenues associated with the flights. In 2015, Delta Connection comprised
approximately 17% of Delta’s total passenger revenue.
viAppendix D3: Other Partnerships
Since 1996, Delta and American Express have offered a variety of co-branded credit cards which allow card holders to
accumulate SkyMiles and receive other travel benefits such as Delta Sky Club lounge access or priority boarding . The companies
announced a multiyear extension of the alliance in December of 2014, and project the partnership to bring long-term value to
customers as well as the companies.
Appendix D4: Pension Funding
Equity Funding Gap Expected Return % in Growth Assets Discount Rate
DAL 11.2B 8.94% 62% 4.57%
UAL 1.5B 7% 56% 4.58%
AAL 6.7B 8% 69% 4.70%
Appendix E: Shareholder Summary
Appendix E1: Top Institutional Holders
Top Institutions
# of
Holder Shares % Outstanding
Vanguard 4,558,400 6.09%
J.P. Morgan 3,300,800 4.41%
BlackRock 2,760,400 0.69%
Lansdowne 2,675,700 3.57%
SSgA 2,178,300 2.91%
PRIMECAP 1,991,900 2.66%
Fidelity 1,453,200 1.94%
T. Rowe Price 1,404,500 1.88%
AllianceBernstein 1,250,600 1.67%
PAR Capital Management 1,146,600 1.53%
Source: Bloomberg
Appendix E2: Top Insiders
Top Insiders
Holder # of Shares % Outstanding
Paul A. Jacobson 35,400 0.05%
Edward H. Bastion 23,800 0.03%
Richard H. Anderson 19,500 0.03%
Glen W. Hauenstein 16,600 0.02%
Wayne Gilbert West 9,500 0.01%
Source: Factset
Appendix E3: Share Repurchases
Through the first nine months of 2016, Delta paid $2.3 billion to repurchase 54 million of its shares. Of these, $350 million were
contributed towards Delta’s pension plan.
viiYou can also read