Fast Charging Infrastructure for the Electric Vehicle Revolution - INVESTOR PRESENTATION
←
→
Page content transcription
If your browser does not render page correctly, please read the page content below
Fast Charging Infrastructure for the
Electric Vehicle Revolution
INVESTOR PRESENTATION

MAY 2021
Disclaimer
This presentation (together with oral statements made in connection herewith, the “Presentation”) is for informational purposes only to assist interested parties in making their own evaluation with respect to the proposed business combination (the “Business Combination”) between Decarbonization Plus
Acquisition Corporation II (“DCRN”), Tritium DCFC Limited, an Australian public company limited by shares (“NewCo”) and Tritium Holdings Pty Ltd (“Tritium” or the “Company”).

The information contained herein does not purport to be all-inclusive and none of DCRN, NewCo, the Company, or Credit Suisse Securities (USA) LLC (“Credit Suisse”), nor any of their respective subsidiaries, stockholders, shareholders, affiliates, representatives, control persons, partners, directors, officers,
employees, advisers or agents make any representation or warranty, express or implied, as to the accuracy, completeness or reliability of the information contained in this Presentation. You should consult your own counsel and tax and financial advisors as to legal and related matters concerning the
matters described herein, and, by accepting this Presentation, you confirm that you are not relying upon the information contained herein to make any decision. The recipient shall not rely upon any statement, representation or warranty made by any other person, firm or corporation in making its
investment or decision to invest in NewCo. To the fullest extent permitted by law, in no circumstances will DCRN, NewCo, the Company, or any of their respective subsidiaries, stockholders, shareholders, affiliates, representatives, control persons, partners, directors, officers, employees, advisers or agents
be responsible or liable for any direct, indirect or consequential loss or loss of profit arising from the use of this Presentation, its contents, its omissions, reliance on the information contained within it, or on opinions communicated in relation thereto or otherwise arising in connection therewith. In
addition, this Presentation does not purport to be all-inclusive or to contain all of the information that may be required to make a full analysis of DCRN, NewCo, the Company, or the Business Combination. Please refer to the business combination agreement and other related transaction documents for
the full terms of the Business Combination. The general explanations included in this Presentation cannot address, and are not intended to address, your specific investment objectives, financial situations or financial needs.

Use of Data

Certain information contained in this Presentation, including that which relates to Tritium’s industry and markets in which it operates, relates to or is based on third party studies, publications and surveys and the Company’s own internal estimates and research. In some cases, we may not expressly refer to
the sources from which this information is derived. In addition, all of the market data included in this Presentation involves a number of assumptions, estimates and limitations, and there can be no guarantee as to the accuracy or reliability of such assumptions or estimates; none of the Company, DCRN,
NewCo, Credit Suisse, nor their representatives or affiliates assumes any responsibility for updating this Presentation based on facts learned following its use. Finally, while the Company believes such third party sources and its internal research are reliable, such sources and research have not been verified
by any independent source and none of DCRN, the Company, NewCo or Credit Suisse, nor any of their respective affiliates nor any of its or their control persons, officers, directors, employees or representatives make any representation or warranty with respect to the accuracy of such information. These
and other factors could cause Tritium’s future performance and actual market growth, opportunity and size and the like to differ materially from the Company’s assumptions and estimates presented herein.

Forward-Looking Statements

Certain statements in this Presentation may be considered forward-looking statements. Forward-looking statements generally relate to future events or DCRN’s, NewCo’s or the Company’s future financial or other performance metrics. For example (and without limitation), other than statements of
present or historical fact, all statements concerning the following are forward-looking statements: summary financial forecast; projections of operating performance, revenues, gross margin, expenses, capital expenditures, total cost of goods sold, gross (loss) profit; estimates and projections regarding
future manufacturing capacity; projections and estimates of market opportunity and market share; future profitability; the Company’s business plan; market acceptance of the Company’s offerings; the Company’s ability to further attract, retain, and expand its customer base; the Company’s ability to
timely and effectively scale its production and manufacturing processes; the Company’s ability to develop new products and services and bring them to market in a timely manner; the Company’s expectations concerning relationships with strategic partners, suppliers, and other third parties; the
Company’s ability to maintain, protect, and enhance its intellectual property; future acquisitions, ventures or investments in companies or products, services, or technologies; the Company’s ability to attract and retain qualified employees; continuation of favorable regulations and government incentives
affecting the markets in which the Company operates; the proposed Business Combination; DCRN’s ability to consummate the transaction in a timely manner or at all (including due to the failure to receive required shareholder approvals, or the failure of other closing conditions such as the satisfaction of
the minimum trust account amount following redemptions by DCRN’s public stockholders, the waiver or expiration of a Tritium shareholder’s rights to acquire Tritium under the shareholders’ deed in relation to Tritium and the receipt of certain governmental and regulatory approvals); the combined
company’s future financial performance; proceeds of the Business Combination and the Company’s expected cash runway; the combined company’s strategy, future operations, estimated financial position, revenues and losses, and plans and objectives of management; and other potential effects of the
Business Combination on DCRN and the Company. In some cases, you can identify forward-looking statements by terminology such as “believe,” “may,” “will,” “potentially,” “estimate,” “continue,” “anticipate,” “intend,” “could,” “would,” “project,” “target,” “plan,” “expect,” or the negatives of these terms or
variations of them or similar terminology. Such forward-looking statements are subject to risks, uncertainties, and other factors which could cause actual results to differ materially from those expressed or implied by such forward looking statements. These forward-looking statements are based upon
estimates and assumptions that, while considered reasonable by DCRN and its management, and the Company and its management, as the case may be, are inherently uncertain and subject to material change. New risks and uncertainties may emerge from time to time, and it is not possible to predict all
risks and uncertainties. Factors that may cause actual results to differ materially from current expectations include, but are not limited to, various factors beyond management’s control, including general economic conditions and other risks, uncertainties and factors set forth in the section entitled “Risk
Factors” and “Cautionary Note Regarding Forward-Looking Statements” in DCRN’s final prospectus relating to its initial public offering, dated February 3, 2021, and other filings with the Securities and Exchange Commission (SEC), the risks described in the section “Risk Factors” in the Appendix to this
Presentation, other risks and uncertainties indicated from time to time in the proxy statement/prospectus relating to the proposed Business Combination, including those under “Risk Factors” therein, and in DCRN’s other filings with the SEC, as well as factors associated with companies, such as the
Company, that are engaged in electric vehicle charging technology, including anticipated trends, growth rates, and challenges in those businesses and in the markets in which they operate; macroeconomic conditions related to the global COVID-19 pandemic; trends with respect to rebates, tax credits and
other financial incentives from governments, utilities and others to offset the purchase or operating cost of EVs and EV charging stations; expected rapid adoption of EVs for passenger and fleet applications; the size and growth of the market for alternative energy vehicles; the effects of increased
competition; the ability to stay in compliance with laws and regulations that currently apply or become applicable to electric vehicle charging technology; the failure to realize the anticipated benefits of the Business Combination; the amount of redemption requests made by DCRN’s public stockholders;
the ability of NewCo to issue equity or equity-linked securities or obtain debt financing in connection with the Business Combination or in the future. Nothing in this Presentation should be regarded as a representation by any person that the forward-looking statements set forth herein will be achieved or
that any of the contemplated results of such forward-looking statements will be achieved. You should not place undue reliance on forward-looking statements in this Presentation, which speak only as of the date they are made and are qualified in their entirety by reference to the cautionary statements
herein. None of NewCo, DCRN nor the Company undertakes any duty to update these forward-looking statements.

Use of Projections

This Presentation contains projected financial information with respect to Tritium. Such projected financial information constitutes forward-looking information, and is for illustrative purposes only and should not be relied upon as necessarily being indicative of future results. The assumptions and
estimates underlying such financial forecast information are inherently uncertain and are subject to a wide variety of significant business, economic, competitive and other risks and uncertainties that could cause actual results to differ materially from those contained in the prospective financial
information. See “Forward-Looking Statements” paragraph above. Actual results may differ materially from the results contemplated by the financial forecast information contained in this Presentation, and the inclusion of such information in this Presentation should not be regarded as a representation
by any person that the results reflected in such forecasts will be achieved.

None of DCRN’s, NewCo’s, nor the Company’s independent auditors have audited, reviewed, compiled or performed any procedures with respect to the projections for the purpose of their inclusion in this Presentation, and accordingly, none of them expressed an opinion or provided any other form of
assurance with respect thereto for the purpose of this Presentation. In preparing and making certain forward-looking statements contained in this presentation, Tritium, NewCo and DCRN made a number of economic, market and operational assumptions. Notably, statements regarding the Company’s
summary financial forecasts are, without limitation, subject to material assumptions regarding the Company’s ability to economically manufacture and distribute its products at scale and meet its customers’ business needs, the Company’s ability to successfully execute its growth strategy, the Company’s
ability to maintain required strategic supply and distribution arrangements and customer relationships, rates of adoption of battery electric vehicles by customers in the markets in which the Company operates, and continuation of favorable regulations and government incentives affecting the markets in
which the Company operates. DCRN, NewCo and the Company caution that these assumptions may not materialize and that current economic conditions render such assumptions, although believed reasonable at the time they were made, subject to greater uncertainty.

                                                                                                                                                                                                                                                                                                                     2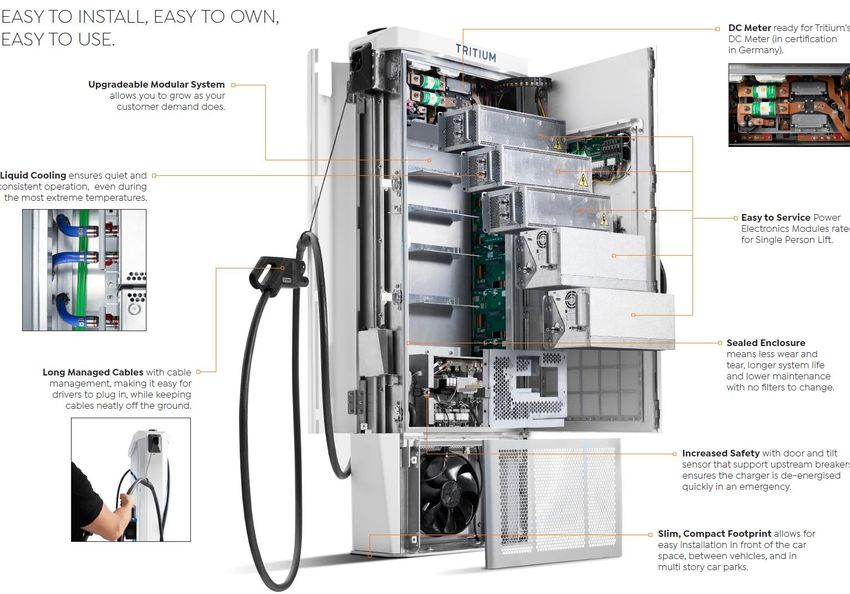
Disclaimer
Additional Information

In connection with the proposed Business Combination, DCRN and NewCo, which will be the going-forward public company, intend to file a registration statement on Form F-4 (the “Registration Statement”) with the SEC, which will include a proxy statement/prospectus, and certain other related
documents, to be used at the meeting of stockholders to approve the proposed Business Combination. INVESTORS AND SECURITY HOLDERS OF DCRN ARE URGED TO READ THE PROXY STATEMENT/PROSPECTUS, ANY AMENDMENTS THERETO AND OTHER RELEVANT DOCUMENTS THAT WILL BE FILED
WITH THE SEC CAREFULLY AND IN THEIR ENTIRETY WHEN THEY BECOME AVAILABLE BECAUSE THEY WILL CONTAIN IMPORTANT INFORMATION ABOUT TRITIUM, DCRN, NEWCO AND THE BUSINESS COMBINATION. After the registration statement is declared effective, DCRN will mail a definitive proxy
statement/prospectus relating to the proposed Business Combination and other relevant materials to its shareholders as of the record date to be established for voting on the proposed Business Combination. This Presentation does not contain all the information that should be considered concerning
the proposed Business Combination and is not intended to form the basis of any investment decision or any other decision in respect of the Business Combination. Shareholders will also be able to obtain copies of the preliminary proxy statement/prospectus, the definitive proxy statement/prospectus
and other documents filed with the SEC, without charge, once available, at the SEC’s website at www.sec.gov, or by directing a request to: Decarbonization Plus Acquisition Corporation II, 2744 Sand Hill Road, Menlo Park, CA 94025.

Financial Information

The financial information and data contained in this Presentation is unaudited and does not conform to Regulation S-X promulgated under the Securities Act of 1933, as amended (the “Securities Act”). Accordingly, such information and data may not be included in, may be adjusted in or may be presented
differently in, the registration statement to be filed by NewCo with the SEC. Some of the financial information and data contained in this Presentation, such as EBITDA, EBITDA margin and free cash flow, have not been prepared in accordance with United States generally accepted accounting principles
(“GAAP”). DCRN, NewCo and Tritium believe these non-GAAP measures of financial results provide useful information to management and investors regarding certain financial and business trends relating to Tritium’s financial condition and results of operations. DCRN, NewCo and Tritium believe that the
use of these non-GAAP financial measures provides an additional tool for investors to use in evaluating projected operating results and trends in and in comparing Tritium’s financial measures with other similar companies, many of which present similar non-GAAP financial measures to investors.
Management does not consider these non-GAAP measures in isolation or as an alternative to financial measures determined in accordance with GAAP. The principal limitation of these non-GAAP financial measures is that they exclude significant expenses and income that are required by GAAP to be
recorded in Tritium’s financial statements. In addition, they are subject to inherent limitations as they reflect the exercise of judgments by management about which expenses and income are excluded or included in determining these non-GAAP financial measures, in order to compensate for these
limitations, management presents non-GAAP financial measures in connection with GAAP results. This Presentation also includes certain projections of non-GAAP financial measures. Due to the high variability and difficulty in making accurate forecasts and projections of some of the information excluded
from these projected measures, together with some of the excluded information not being ascertainable or accessible, the Company is unable to quantify certain amounts that would be required to be included in the most directly comparable GAAP financial measures without unreasonable effort.
Consequently, no disclosure of estimated comparable GAAP measures is included and no reconciliation of the forward-looking non-GAAP financial measures is included. See "Use of Projections" paragraph above.

All monetary figures included in this Presentation are reflected in U.S. dollars unless otherwise indicated.

Participants in the Solicitation

DCRN, NewCo, the Company and their respective directors and executive officers may be deemed participants in the solicitation of proxies from DCRN’s shareholders with respect to the proposed Business Combination. A list of the names of DCRN’s directors and executive officers and a description of
their interests in DCRN is contained in DCRN’s filings with the SEC, including the final prospectus relating to its initial public offering, dated February 3, 2021, which was filed with the SEC and is available free of charge at the SEC’s web site at www.sec.gov, or by directing a request to Decarbonization Plus
Acquisition Corporation II, 2744 Sand Hill Road, Menlo Park, CA 94025. Additional information regarding the interests of such participants in the solicitation of proxies from DCRN’s shareholders with respect to the proposed Business Combination will be contained in the proxy statement/prospectus for
the proposed Business Combination when available.

No Offer or Solicitation

This Presentation shall not constitute a “solicitation” of a proxy, consent, or authorization, as defined in Section 14 of the Securities Exchange Act of 1934, as amended, with respect to any securities or in respect of the proposed transaction. This Presentation also does not constitute an offer, or a
solicitation of an offer, to buy, sell, or exchange any securities, investment or other specific product, or a solicitation of any vote or approval, nor shall there be any sale of securities, investment or other specific product in any jurisdiction in which such offer, solicitation or sale would be unlawful prior to
registration or qualification under the securities laws of any such jurisdiction. No offering of securities will be made except by means of a prospectus meeting the requirements of section 10 of the Securities Act of 1933, as amended, or an exemption therefrom. NEITHER THE SEC NOR ANY STATE
SECURITIES COMMISSION HAS APPROVED OR DISAPPROVED OF THIS PRESENTATION OR DETERMINED IF THIS PRESENTATION IS TRUTHFUL OR COMPLETE.

Trademarks and Trade Names

Tritium and DCRN own or have rights to various trademarks, service marks and trade names that they use in connection with the operation of their respective businesses. This Presentation also contains trademarks, service marks and trade names of third parties, which are the property of their respective
owners. The use or display of third parties’ trademarks, service marks, trade names or products in this Presentation is not intended to, and does not imply, a relationship with the Company, NewCo or DCRN, or an endorsement or sponsorship by or of the Company or DCRN. Solely for convenience, the
trademarks, service marks and trade names referred to in this Presentation may appear with the ®, TM or SM symbols, but such references are not intended to indicate, in any way, that the Company, NewCo or DCRN will not assert, to the fullest extent under applicable law, their rights or the right of the
applicable licensor to these trademarks, service marks and trade names.

Summary of Contracts

Insofar as this Presentation contains summaries of existing agreements and documents, such summaries are qualified in their entirety by reference to the agreements and documents being summarized.

Risk Factors

For a description of the risks relating to an investment in Tritium, including its business and operations, we refer you to “Risk Factors” in the Appendix to this Presentation.

                                                                                                                                                                                                                                                                                                                                3
Transaction Summary
Decarbonization Plus Acquisition Corporation II (“DCRN”) is a publicly listed special purpose acquisition company with an
estimated $403 million of cash in trust. DCRN has entered into a business combination agreement with Tritium,
Transaction pursuant to which the companies will combine and the post-closing company will be an Australian based company listed
on the Nasdaq
Investors will receive shares in the post-closing Australian company
Transaction reflects a pro-forma enterprise value of $1.4 billion
Valuation Compelling valuation multiple relative to electric vehicle charging infrastructure peers
Implied EV / 2026E revenue and EV / 2026E EBITDA of 0.9x and 4.0x, respectively
$300 million cash to pro-forma balance sheet at closing(1)
Pro-forma Capital Structure Forecast requires only $68 million of funding to achieve positive free cash flow in 2023
Existing shareholders retain majority ownership
Pro-forma Ownership ~70% existing Tritium shareholders, ~30% SPAC and founder shares
Listing / Ticker NASDAQ: DCFC (post-merger)
Robert Tichio
Chairman of the Board
DCRN priced IPO in February 2021
16-year history, Riverstone Holdings LLC
Partner; Menlo Park & New York Exclusive focus on six decarbonization families:
ESG & Sustainability investment strategy oversight
Decarbonization Team & 1. Electrification of transport
Investment Focus 2. Greening of fossil fuels
Erik Anderson
Chief Executive Officer 3. Grid flexibility and resilience
Founder & CEO, WestRiver Group 4. Agriculture
Exclusive focus on innovation economy,
disrupter/attacker business models, brand leaders in 5. Next generation liquids fuels (e.g., hydrogen)
breakthrough categories 6. Next horizon resource use (e.g., smart buildings)
Early-stage investor history: Docusign, Teledoc, TopGolf
(1) Assumes no redemptions from the public shareholders of DCRN.
4
An Established Infrastructure Pioneer in the New Mobility Era
with a 20 Year History

 Accumulating Benefits              Multiple Avenues                   Positioned for                          DCFC Focus Creates Strategic
 from EV Penetration                for Growth                         Continued Market Leadership             & Competitive Advantages

 • Rapidly growing TAM              • Strategic partnerships with      • Global, corporatized management       • Demonstrated track record of
   driven by clear and                diversified base of blue-chip,     structure with 348 staff and serves     innovation in power electronics
   accelerating shift to EV's         global customers                   customers on 4 continents             • Technology leader with clear,
 • Charging market expected         • Combined hardware with           • Founder-led product management          differentiated product roadmap
   to outpace EV adoption             IoT-enabled software               with long-tenured commercial          • High barriers to entry across
                                                                                5
 • DC fast charging (“DCFC”)          capabilities position Tritium      and technical experience                entire technology portfolio
   is a critical component of the     to lead the market               • Established manufacturing             • Uniquely positioned as a leading
   successful EV transition         • Increasing services revenue        and operational structure               manufacturer with exclusive
                                      stream via fleet expansion       • ~$160 million of cumulative             focus on DCFC
                                      and customer pull for service      capital investment to date
                                      licensing agreements

                                                                                                                                                    5
Enabling Clean Energy Through DC Fast Charging
  Global Reach                                    Intellectual Property
  Global sales and service                        The only liquid cooled, IP65 rated
  footprint across 4 continents                   charger technology

  4,400+                                           Software Capability
  DCFC chargers (>50kW) sold                       Market leading telemetry data
                                                   streams through Tritium Pulse

  41                                              100+
  Countries with Tritium chargers                 High-quality customers and growing

  $84 million                                     First Mover Advantage
  Forecasted 2021E revenue                        9+ years of DC charging experience

  55+ GWh                                         1.6+ million
  Energy delivered                                Gallons of gasoline offset

  1 Minute                                        2.7+ million
  Time to add 20 miles                            High-power charging
  with a 350kW charger                            sessions delivered

  DCFC Market Leader
  Will become only “Pure Play” DC fast charging infrastructure
  OEM upon merger closing

                                                                                       6
Table of Contents

THE EV INFRASTRUCTURE OPPORTUNITY

       TRITIUM OVERVIEW

          OPERATIONS

          TECHNOLOGY

           FINANCIALS

           VALUATION

           APPENDIX

                                    7
Table of Contents

THE EV INFRASTRUCTURE OPPORTUNITY

       TRITIUM OVERVIEW

          OPERATIONS

          TECHNOLOGY

           FINANCIALS

           VALUATION

           APPENDIX

                                    8
Energy and Mobility Are Undergoing a Revolutionary Transformation

                                                                              “The auto
   “Renewable energy, EVs, fuel        “The federal government also owns      industry will
   cells, batteries, charging, green   an enormous fleet of vehicles, which   change more in
   hydrogen … it’s all undergoing      we’re going to replace with clean
   a dramatic shift to the top of      electric vehicles made right here in   the next 5 to 10
   our energy ecosystem”               America made by American workers”      years than it has
                                                                              in the last 50”

                                                                                                  9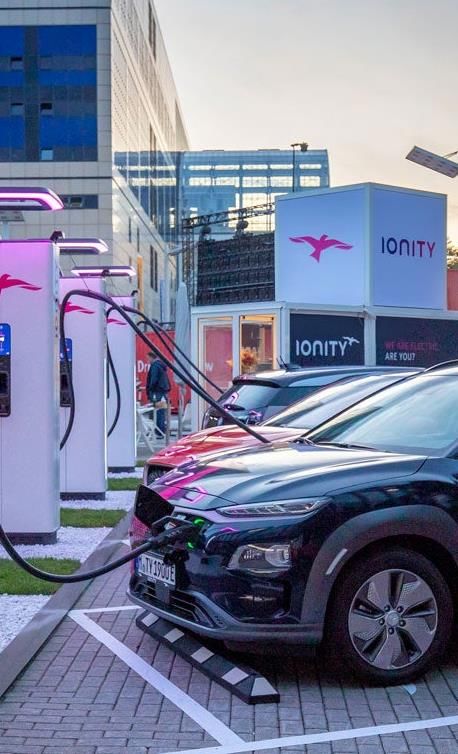
The Electric Vehicle Transition Is Here
                                                            EVs Will Soon Cost Less Than ICE Cars and Have Lower Fuel and Maintenance Costs

                                EV Battery Price v EV Battery Demand                                                                                     Medium Car Segment EV Price v ICE Price
       (GWh)                                                                                             ($ / kWh)         ($ in thousands)
       2,500                                                                                                140              $35
                                                                                                            120              $30
       2,000
                                                                                                            100              $25
       1,500                                                                                                80
                                                                                                                             $20
       1,000                                                                                                60
                                                                                                                             $15
                                                                                                            40
         500                                                                                                                 $10
                                                                                                            20
           –                                                                                                –                 $5
                2020    2021   2022     2023    2024    2025     2026   2027   2028    2029       2030                                  2020           2022            2024     2026              2028          2030

                          Total Battery Cell Market Size (LHS)          Battery Cell Cost (RHS)                                          EV Price (Vehicle + Powertrain)       EV Battery Price              ICE Price

    Committed Traditional OEMs                                                                                       Supportive Government Policies
                                                                                                                                   President Biden pledged to build 500k                In 2020, the European Commission began
                                                                                                                                   new chargers over the next decade                    to phase in automotive CO2 targets
                                                                                                                       USA                                                      EU
                                                                                                                                   President Biden promised to convert the              Ionity, the largest public EV charge point
                                                                                                                                   entire federal government's fleet (~650k             operator in EUR, received €39M in grants
                                                                                                                                   vehicles) to electric and that every US-             through the EU Connecting Europe Facility
                                                                                                                                   made bus will be a BEV by 2030                       for Transport

    Proliferating New EV OEMs                                                                                                      Executive order mandating all new cars               Germany has announced electrification
                                                                                                                                   sold by 2035 to be emission free                     of fuel stations will be included in its
                                                                                                                     California                                               Germany   €130B of Economic Recovery Funding

                                                                                                                                   ‘EV Make Ready’ initiative to accelerate             The UK is targeting 100% of new
                                                                                                                                   deployment of more than 50,000                       vehicle sales to be electric by 2030 and
                                                                                                                     New York      charging stations by 2025                    UK
                                                                                                                                                                                        may ban new sales of fossil fuel vehicles

                                                                                                                                                                                        £500M has been committed by the UK
                                                                                                                                                                                        government to a Rapid Charging Fund

Source: Bloomberg New Energy Finance, press releases.

                                                                                                                                                                                                                                   10
And the Charging Infrastructure Needs to Be Ready
The global transition to an EV-based transportation network is Front-loading of charger build-out by CPOs, utilities, fleets, retailers and
reliant upon the availability of sufficient charging infrastructure governments will ensure sufficient infrastructure will be in place to meet the
needs of the growing EV fleet
Global Passenger EV Sales Projected Global EV Charging Hardware Sales(1)
(Millions of vehicles sold, annual) ($ in billions, cumulative)
60 54.9 $60
$50
50
40 $40
+19% +25%
CAGR Avg. CAGR(2)
30
20 $20
10
$3
1.7
– $0
2020 2025 2030 2035 2040 2020 2021 2022 2023 2024 2025 2026
Source: Bloomberg New Energy Finance – 2020 EV Charging CIFM Model.
(1) Represents an average of market research reports Including Allied Market Research, Markets and Markets, IDTechEX, Guidehouse and BNEF.
(2) CAGR represents per annum growth rate.
11DC Fast Charging Has Clear Advantages Over AC
DC fast chargers reduce range anxiety and charging time, making EV charging more equivalent to filling up with gas
Onboard AC Charging Slow Due to Size and Cost Off-board Fast DC Charging Enables Driver Freedom
3.7kW 7.7kW 50kW 350kW
TIME TO ADD 20 MILES OF RANGE TIME TO ADD 20 MILES OF RANGE
91 47 7 1
Minutes Minutes Minutes Minute
Note: Most BEVs available are limited to 7-11kW onboard AC charging due to space, weight and heat restrictions. Few models are capable of 22kW AC. Nearly all BEV passenger vehicles can charge at 50kW DC, with newer models
capable of 200kW+ DC charging.
12DC Fast Chargers are Critical to Meet EV Energy Demand
4.6 million DCFC chargers are needed by 2040 and Tritium’s charging system is uniquely positioned to supply ALL charging operators
PROJECTED DC FAST CHARGER BUILD-OUT
DC FAST CHARGERS (IN 000’S)
+35x Global excl. China
global expansion by 2040 excl. China China Key Sectors Investing and Driving Exponential Growth
Leading first movers in the transition to electrification
+19x CPOs
expansion by 2040 in China 2,671
Charging as an enabler of EV sales
Auto
1,939
Driven by EV total cost of ownership advantages
Fleets
74
2040 Replace declining fuel sales with kW sales and use gas
Fuel station real estate to drive business (Kodak Moment)
96
2020 Retail
Drive sales via convenient charge points decoupled
from gas station locations
BEV/DC Opportunity to control the fuel to electricity transition
charger ratio
40 100
Utilities and grow profits via bundled customer offerings
EVs in millions 3 4 267 194
Source: Bloomberg New Energy Finance – 2020 EV Charging CIFM Model and Transport & Environment, Transport & Environment Study.
13Expanding Universe of Customers is Driving DC Fast Charging Deployment
Land-grab for control of charger deployments and energy supply is expected to accelerate DC fast charger demand and may ultimately
expand the TAM significantly
CURRENT 2021 FIRST MOVERS CPOs FAST FOLLOWERS ULTIMATE OPPORTUNITY
USA EU Asia
Electricity
Utilities ~3K ~4.5K +
Utilities
Retail
Establishments 1M+ 5M+ 1.5M+
Gas Stations ~120K ~78K 150K+
Commercial
Vehicle Sales ~13M ~3M ~8M
p.a.
Retail
Passenger
Vehicle Sales ~5M ~18M ~36M
p.a.
FUTURE
Auto Fleets Fuel
Source: Retail, NRF. Utility, EIA. Fuel, NACS. Autos and Fleets, OICA.
14A Leader Among Few, Supplying Many
Market structure drives robust EV adoption beta; Tritium’s superior technology and product roadmap generate alpha
Current product offering
Ancillary Ancillary
Services Software
DC Charging Providers
5 - 10 Major Players
100’s of Major Players
Site Prep and Energy Fleet Payments and Back End
Maintenance, Repair
Construction management Management Network Performance Software
and Installation
Fuel Retail Utilities
Autos CPOs Fleets
Passenger EVs Commercial EVs
~84 million in 2030 ~10 million in 2030
Source: Bloomberg New Energy Finance – 2020 EV Charging CIFM Model.
15Table of Contents
THE EV INFRASTRUCTURE OPPORTUNITY
TRITIUM OVERVIEW
OPERATIONS
TECHNOLOGY
FINANCIALS
VALUATION
APPENDIX
16Delivering Innovative Power Electronics for over 20 Years
Everyday Reliability
Experience has delivered robust
and reliable DC fast chargers
Hottest Coldest Highest Deepest
Tritium RT Tritium PK350 Ionity Custom Tritium RT175-S
Gold Controller WaveSculptor20 WaveSculptor200
50kW 350kW 350kW Tritium RTM75
1999 2007 2009 2012 2018 2019 2020
17Global Leader in DC Fast Charging
World-Leading IP Protections World-Leading
Differentiated One of Few Truly
Expertise in Place Rapid Product
Technology Global Players
Development
Exclusively focused Highly talented engineering Key components of leading Opening highest power Strategically located,
on developing DC fast team including Founders, with a architecture are protected: electromagnetic test facility global footprint:
charging solutions number of employees who are for EV chargers in 2021(1)
global leaders in their fields 2 Competitive advantage for rapid test,
24/7
patents and 1 non-provisional patent Global support
prototype, compliance and certification
application surrounding power
electronics and related cooling Manufacturing on
Unique liquid cooled
architecture delivers reliability
and the smallest footprint
348 3
Infrastructure to develop
Staff 4 and bring products to market
continents, personnel on 4
provisional patent in short timeframes Hardware fielded
applications covering future
and supported in
Differentiated modular technology MSC platform
and scalable charging design 41
allows site-wide scalability
13 Countries
identified inventions to be DCFCs comply with electrical
submitted as provisional certification regulations in all
patent applications major western markets
(1) Based on facilities available to Tritium for product testing.
18Leading Global Market Share
TRITIUM GLOBAL OFFICES
North America % OF TOTAL SALES
~15%
United States
~20%
Market Share(1)
29 Staff
Europe
~20%
European ~70%
Market Share(1)
50 Staff
Asia Pacific
>75%
Australian
& New Zealand ~10%
Market Share(1)
269 Staff
(1) Based on public DC chargers, excluding Tesla.
19Diverse Blue-Chip Customer
Base
“ We chose to partner with Tritium because they have
a world-leading technology and have shown they
can develop and deliver their products quickly
Michael Hajesch
IONITY CEO
Note: Non-exhaustive customer list.
20Table of Contents
THE EV INFRASTRUCTURE OPPORTUNITY
TRITIUM OVERVIEW
OPERATIONS
TECHNOLOGY
FINANCIALS
VALUATION
APPENDIX
211 2 3 4
R&D Product Development & Prototyping Supply Chain & Production Software Development
From Design Through Support
5 6 7 8
Quality Assurance Vehicle Testing & Interoperability Sales, Marketing & Distribution 24/7 Support & Warranty
22Table of Contents
THE EV INFRASTRUCTURE OPPORTUNITY
TRITIUM OVERVIEW
OPERATIONS
TECHNOLOGY
FINANCIALS
VALUATION
APPENDIX
23Total Cost
of Ownership
High density,
Small
modular
footprint
electronics
Why Customers Opportunity
Choose Tritium Performance Cost
Technology Liquid
cooling
Ingress
protection
65 rating
Scalability
24Lowest Total Cost of Ownership
Small footprint, sealed enclosure and liquid cooled technology results in up to 37% TCO reduction over 10 years of
operation compared to all other competitors who use air-cooled systems
TCO Comparison over 10 years of Operation
Standby Energy
Preventative Maintenance
Additional Costs for Air-Cooled Competitors
Repairs & Maintenance
In charger heater costs
Average Installation Cost
Up to
Extra site visits to wash and/or replace air filters
Equipment Cost +37%
Consumables (air filter)
Heater replacements
Extra transport costs
Larger footprint and foundations
Possible lost parking space
Other Competitors – Air Cooled
Note: Indicative assumptions based on a 50kW equivalent air cooled DCFC from competitors. Installation cost savings based on square meter reduction, reduced installation labor, reduced concrete, and reduced transport costs
due to smaller sized units. Preventative maintenance based on fewer maintenance visits to clean and replace fan air filters. Standby energy savings based ongoing heater costs.
25Maximum Revenue and Real Estate Usage
Small footprint allows chargers to be installed anywhere and ensures site hosts do not lose car parking spaces
NO NO
PARKING PARKING
Tritium Chargers Keep Parking Real Estate Lost Using
Valuable Car Parking Spaces Larger Competitor Products
26Modular, Scalable, Charging (“MSC”) Platform
Next Generation Products Leverage Tritium’s MSC Platform
CUSTOMER BENEFITS
DC Meter
Tritium’s DC Meter is available across the
TRITIUM BENEFITS
MSC platform
Upgradeable Modular System
allows you to grow as your Standardized Base
customer demand does
Components
Liquid Cooling ensures quiet and
consistent operation, even during
the most extreme temperatures
Easy to Service Power Electronics
Modules rated for Single Person Lift Rapid New Product
Development
Sealed Enclosure means less wear
Long Managed Cables with cable
management, making it easy for
and tear, longer system life and lower Streamlined
maintenance with no filters to change
drivers to plug in, while keeping Compliance &
cables neatly off the ground Certification
Increased Safety with door and tilt
sensor that support upstream breakers,
ensures the charger is de-energized
quickly in an emergency
Slim, Compact Footprint allows for easy
Optimized
installation in front of the car space, between Serviceability
vehicles, and in multi story car parks
Easy to install, easy to own, easy to use
27Product Roadmap
EASY ON SITE GRID-SCALE BATTERY INTEGRATION
2021 75kW 150kW
2022 150kW 360kW 1MW
Retail Applications Charging Park Applications Depot Charging Applications
Self-Contained System Sitewide System Configured Plug‘n’Play System
Convenience Charge Essential Charge Specialized Charging Requirements
Easy Installation More BEVs Served With Less Infrastructure Structured Deployment
28Integrated Software, Firmware and Data as Barriers to Entry
Tritium Data Advantage Barriers to Entry
Charging network optimisation Operations and Hardware regulations
product optimisation & standards
Customer offering & market insights Credit Card
Payment
DC Meter
Local laws and Driver
requirements experience
Stakeholder insights
All vehicles Operator software
compatible integrations
2030.5
Grid, utility, building Global 3rd party service
Interaction partners trained
Tritium Data Lake Tritium Deployed Chargers Software & Ecosystem Integrations
• 7 years operating history • Entire fleet 4G data connected • Dozens of detailed data feeds
• 2.7M charging sessions • Dozens of telemetry sensors • 100s of interfaces across the
• 4,400 chargers per charger ecosystem established and
• 12 microprocessors per charger continually updated
• 41 countries
• All climatic conditions
• Varying grid conditions
29Table of Contents
THE EV INFRASTRUCTURE OPPORTUNITY
TRITIUM OVERVIEW
OPERATIONS
TECHNOLOGY
FINANCIALS
VALUATION
APPENDIX
30Business Model Built for Long-Term Product Lifecycle
Deep customer partnerships and recurring revenue
Initial Purchase 2 Years + 1, 2 or 3 Years 10+ Years Expected Asset Lifetime End of Asset Life Services
Tritium Integrated Charging Solutions
Upfront 2 year
Paid warranty Replacement
hardware warranty as Proprietary spare parts sales
extensions product sales
purchase standard
Charger
Revenue Site expansions and power upgrades
Access to charger management platform (Pulse) and over the air software updates
Paid connectivity packages, 3G & 4G
Paid platform modules including predictive analytics and site, load management
Software On screen marketing and advertising platform
Revenue API access and software development kit access
Asset
Service level agreements Maintenance services
commissioning Decommissioning
Gold, Silver, Bronze Annual asset health check and preventative maintenance
services
Services
Revenue
Outside of warranty services
31Strong Revenue Base with History of Rapid Growth
Track record of successfully Numerous R&D successes and Mature operations
growing operations through key business wins enable next phase of
multiple periods of rapid growth Reputation for relentless execution and business expansion
ability to overcome hurdles
$ IN MILLIONS
COVID supply
$59 chain impact
+56% in 2020
CAGR $50
$31
$14
$10
2016A 2017A 2018A 2019A 2020A
Note: 2016 – 2018 based on AASB. 2019 – 2020 based on US GAAP.
32Revenue Scales with Industry Growth
$ IN MILLIONS
~4% ~10%
REVENUE GROWTH IS DRIVEN BY:
~17%
Diversified blue-chip customer base
~96% 2020A 2026E • Accelerating investment and providing
$1,522 continued momentum
~73%
Charge point operators installing ahead
of EV uptake for ‘land grab’ purposes or
to secure government incentives
$982
New product releases
• 17 new products, a range of software
modules and expanded service
$603 coverage is planned over next 5 years
$359 • Entry into new countries and
adjacent segments
$170
$59 $84 Increasing revenue from recurring software
and services as the installed fleet grows
2020A 2021E 2022E 2023E 2024E 2025E 2026E
Chargers Services Software
33Robust Growth and Near-Term Positive Cash Flow Conversion Profile
Differentiates Tritium from EV Charging Peers
($ in millions)
Revenue ($ in millions)
Gross Profit
$654
$1,522
$432
$982
$283
$603
$359 $162
$84 $170 $8 $46
2021E 2022E 2023E 2024E 2025E 2026E 2021E 2022E 2023E 2024E 2025E 2026E
% growth 42% 102% 111% 68% 63% 55% % margin 9% 27% 45% 47% 44% 43%
EBITDA Free Cash Flow
($ in millions) ($ in millions)
$306
$348
$196
$221 $131
$137
$65
$71
($38) ($18) ($44) ($24)
2021E 2022E 2023E 2024E 2025E 2026E 2021E 2022E 2023E 2024E 2025E 2026E
% margin (45%) (11%) 20% 23% 23% 23% % EBITDA 91% 96% 89% 88%
(1) Free Cash Flow defined as EBITDA less capex and change in NWC.
34Table of Contents
THE EV INFRASTRUCTURE OPPORTUNITY
TRITIUM OVERVIEW
OPERATIONS
TECHNOLOGY
FINANCIALS
VALUATION
APPENDIX
35Transaction Overview
Key Transaction Terms Illustrative Sources and Uses
($ in millions)
Sources Uses
$1.4B $1.2B $403M Cash in trust $403(1) Rollover equity $1,200
Pro-forma enterprise value transaction value DCRN cash in trust(1)
Implied 4.0x 2026E EBITDA Rollover equity 1,200 Cash to balance sheet 300
Investors will receive shares in
and 0.9x 2026E revenue combined company based in Existing cash 5 Debt repayment 53
Australia and listed on the Nasdaq
Total sources $1,608 Transaction expenses 55(2)
Total uses $1,608
Strong balance sheet with an estimated $300M cash
$300M upon closing of the transaction(1)
Ensures ability to deliver growth organically and via M&A
Illustrative Pro-Forma Valuation Pro-Forma Ownership(1)
($ in millions, shares in millions)
Illustrative price per share $10.00
Pro-forma outstanding shares 170.3 6%
Post money equity value $1,703 Sponsor Shares
(-) Pro-forma net debt (12/31/20) (300) 24% DCRN Investors
Enterprise value $1,404
Existing Tritium shareholders
70%
Existing Tritium shareholders are rolling their equity and are
collectively expected to own 70% of the pro-forma company
(1) Pro-forma ownership structure assumes $10.00 per share and no redemptions. Excludes public and private warrants.
(2) Estimated transaction expenses of $55 million.
36Differentiated Business Model and Financials
ELECTRIC VEHICLE CHARGING PEERS DIVERSIFIED ELECTRICAL EQUIPMENT
Public Comps De-SPACs
Leading DCFC Technology
Blue-Chip Customer Base
Leading mobility technology peers focused Leading OEMs across the diversified
Sustainable Growth on the charging infrastructure space electrical equipment space
Valuation at mature, steady-state levels
Disruptive growth business and financial
Scaling Margins profiles
Well-capitalized with significant resources to
invest in EV
Real Revenue Base Today Benefit from same fundamental trends of
growing EV penetration and charging buildout
Diversified with limited EV focus to date
Compelling Valuation Varied technology offerings; no “pure play”
Many commodity products
DCFC OEM
37Attractive Relative Valuation Opportunity
2026E
Illustrative EBITDA Implied Future Enterprise Illustrative Discounted Deal Value
Revenue EBITDA
Reference Range(1) Value Enterprise Value(2) Enterprise Value
$2.1 billion – $2.5 billion
$1,522 million $348 million 14.0x – 16.0x $4.9 billion – $5.6 billion $1.4 billion
(6.2x – 7.0x 2026E EBITDA)
29.1x
18.5x
19.3x Avg.
15.6x
EV / EBITDA
10.7x
7.0x ($2.5bn)
4.0x ($1.4bn)
6.2x ($2.1bn)
Pro-Forma Value Illustrative Discounted Electric Vehicle Charging Diversified Electrical Electric Vehicle (2026E)
(2026E) Enterprise Value De-SPAC Transactions(4) Equipment (2021E) Charging Peers(3)
Implied share price(5) $10.00 $14.36-$16.15 $23.56 $33.57 $61.30 $41.26
7.4x
4.2x
Avg.
EV / Revenue
2.4x 2.7x 3.2x
1.6x ($2.5bn)
0.9x ($1.4bn)
1.4x ($2.1bn)
Pro-Forma Value Illustrative Discounted Electric Vehicle Charging Diversified Electrical Electric Vehicle (2026E)
(2026E) Enterprise Value De-SPAC Transactions(4) Equipment (2021E) Charging Peers(3)
Implied share price(5) $10.00 $14.36-$16.15 $23.07 $26.14 $68.20 $30.16
Source: Company information, filings and FactSet as of 5/21/2021. (4) Electric Vehicle Charging De-SPAC Transactions include Chargepoint, EVgo and Volta, and Chargepoint, EVBox, EVgo, Nuvve
(1) Reference range in line with Diversified Electrical Equipment Peer group. and Volta for the EBITDA and revenue multiples, respectively, as described on page 39.
(2) Applies a 20% discount rate to implied future enterprise value at 12/31/2025 to 6/30/2021. (5) Excludes dilutive impact of public and private warrants.
(3) Electric Vehicle Charging Peers include Alfen, Blink and Fastned, as described on page 39.
38Selected Equity Comparables
Diversified Electrical
Electric Vehicle Charging Peers Electric Vehicle Charging De-SPAC Transactions
Equipment
Mean: 7.4x | Median: 8.7x Mean: 1.7x | Median: 1.7x Mean: 2.4x | Median: 2.6x Mean: 2.7x | Median: 2.4x
EV / Revenue
9.3x 8.7x
4.3x 3.6x
3.2x 2.8x 2.6x 2.9x 2.4x 2.4x 2.4x
1.4x 1.7x 1.6x
0.9x
1.2x 2.2x 2.3x 1.7x 1.4x
2025 2026 2025 2024 2023 2026 2023 2026 2025 2022 2021 2021 2021 2021 2021
Mean: 29.1x | Median: 26.4x Mean: 6.3x | Median: 6.2x Mean: 10.7x | Median: 7.2x Mean: 15.6x | Median: 15.0x
42.7x
EV / EBITDA
26.4x
18.3x 19.3x 19.1x
EV / 2023E 15.1x 15.0x 14.9x 13.7x
EBITDA: 527.4x
6.4x 7.2x
4.0x 5.6x
7.1x 6.2x 5.6x NA
2025 2026 2025 2023 2024 2026 2026 2025 2022 2023 2021 2021 2021 2021 2021
At Deal Announcement Current Trading
Source: Company investor presentations and FactSet as of 5/21/2021.
Note: Electric Vehicle Charging De-SPAC Transactions mean and median calculations include Chargepoint, EVgo and Volta, and Chargepoint, EVBox, EVgo, Nuvve and Volta for the EBITDA and revenue multiples, respectively.
39Discounted Future Enterprise Value
$ IN MILLIONS
FUTURE DISCOUNTED POST-MONEY
$5,568 / $34.46
~260% NTM at
Midpoint Premium December 2025
$4,872 / $30.37
$1,522
Revenue
million
$348
EBITDA
$2,451 / $16.15 million
~60%
Midpoint Premium
$2,145 / $14.36 $1,404 / $10.00
~28-31%
~28-32%
compoundin compounding equity return
g equity through 2025
14X - 16X return
DISCOUN TE D ENTER PRI S E V ALUE
NTM EBITDA 4.5 PERIO DS AT 20%
AT DECE MB E R 2025 through
Note: Implied share prices exclude dilutive impact of public and private warrants.
2025
40Table of Contents
THE EV INFRASTRUCTURE OPPORTUNITY
TRITIUM OVERVIEW
OPERATIONS
TECHNOLOGY
FINANCIALS
VALUATION
APPENDIX
41Leading Telemetry Data Streams and Interactive Software Platform
On-Charger Firmware and IoT Off-Charger Software Platform
Tritium Firmware Comprehensive vehicle compatibility Remote device monitoring
Connected on-device sensors and telemetry Interactive data platform and error diagnosis
and Software On-charger microprocessors Ongoing software optimization
Capability Grid condition sensors and data collection Predictive maintenance
Local Generates insights using artificial intelligence and machine
Computing learning locally inside the charger itself
Edge Computing
Local Eliminates transmission of large quantities of data; sensitive
Storage data only stored within the charger
Data Uses Charging Network Optimization Stakeholder Insights Customer Offering & Market Insights
Utilization Insights UX / UI Interaction Data Energy Delivery Insights
Maintenance Alerts Vehicle Trends Grid Interaction Trends
4224 / 7 Global Customer Support
Tritium Provides Global Service Coverage from 3 Locations
All chargers connected and monitored in real-time via 4G
Customer support team staffed by qualified and trained engineers
8 years and 40 million hours cumulative charger uptime
Warranty extensions available up to 10 years
Paid service level agreements available for life of the charger
Non-warranty services, repairs and spares available for life of charger
Delivering high uptime
43Select Future Product Adjacencies
Benefits to fleet operators include:
Low Power DC Chargers (25kW)
Low power AC charging requires an onboard AC/DC converter within the vehicle,
typically limited to ~7-11kW. Onboard charging speeds are limited due to
weight, size and heat constraints within the vehicle. DC charging speeds are
unrestricted due to the power electronics being situated outside of the vehicle Charger TCO Accessible Granular
Savings Maintenance Communications
The onboard AC charging component is a key cost reduction opportunity being
pursued by Automotive OEMs that will particularly benefit fleet operators Centralized rectification Centralized equipment Charger to vehicle
enables depot can improve service communications are
Low Power DC charging will be essential for non-AC charging capable vehicles managers to right size access and repair times possible via DC charging
and is a future product opportunity for Tritium their charging capacity and can provide fleet
Increased flexibility to
Additionally, fleet operators can design more effective depot charging solutions to duty cycles managers valuable
design redundant
via low power DC charging as opposed to relying on onboard AC charging operational data
DC cabling can reduce systems such as storage
install costs integration
Source: Graphic from Wallbox company website.
44DC Fast Charging Everywhere
Parking arrangement
Work Destination
Charging need
(e.g. office, govt property) (e.g. mail, supermarket, car park)
Shared parking Public parking Contractual party
2-10 hoursAttractive Relative Valuation Opportunity
2026E EV / EBITDA EV / REVENUE
Reference range:
15.0x(1)
Revenue $1,522 million Diversified Electrical Diversified Electrical
Equipment 15.6x Equipment 2.7x
(2021E) (2021E)
EBITDA $348 million
4.0x | $1.4bn 0.9x | $1.4bn
Pro-Forma Value Pro-Forma Value
(2026E) (2026E)
Illustrative EBITDA
14.0x – 16.0x
Reference Range
7.0x | $2.5bn 1.6x | $2.5bn
Illustrative Discounted Illustrative Discounted
Enterprise Value 6.2x | $2.1bn Enterprise Value 1.4x | $2.1bn
Implied Future $4.9 billion –
Enterprise Value $5.6 billion
Electric Vehicle Electric Vehicle
29.1x 7.4x
Charging Peers(3) Charging Peers(3)
Illustrative Discounted $2.1 billion –
$2.5 billion Electric Vehicle Electric Vehicle
Enterprise Value(2) Charging De-SPAC 6.3x 10.7x Charging De-SPAC 1.7x 2.4x
(6.2x – 7.0x 2026E EBITDA)
Transactions(4) Transactions(4)
Deal Value 7.1x 1.2x
$1.4 billion 19.3x 3.2x
Enterprise Value (2026E) (2026E)
At deal announcement Current trading
Source: Company information, filings and FactSet as of 5/21/2021. (3) Electric Vehicle Charging Peers include Alfen, Blink and Fastned, as described on page 39.
(1) Reference range in line with Diversified Electrical Equipment Peer group. (4) Electric Vehicle Charging De-SPAC Transactions include Chargepoint, EVgo and Volta, and Chargepoint,
(2) Applies a 20% discount rate to implied future enterprise value at 12/31/2025 to 6/30/2021. EVBox, EVgo, Nuvve and Volta for the EBITDA and revenue multiples, respectively, as described on page 39.
46Risk Factors
The below list of risk factors has been prepared as part of the proposed Business Combination between DCRN, NewCo and Tritium. All references to “Tritium” refer to the business of Tritium Holdings Pty Ltd and its consolidated subsidiaries. The risks presented below are certain of the general risks
related to the business of Tritium and the proposed Business Combination. This list is not exhaustive. The list below is qualified in its entirety by disclosures contained in future documents filed or furnished by DCRN, NewCo and Tritium, with the SEC, including the documents filed or furnished in
connection with the proposed Business Combination between DCRN, NewCo and Tritium. The risks presented in such filings will be consistent with those that would be required for a public company in its SEC filings, including with respect to the business and securities of DCRN, NewCo and Tritium and
the proposed Business Combination between DCRN, NewCo and Tritium, and may differ significantly from and be more extensive than those presented below.
If Tritium cannot address any of the following risks and uncertainties effectively, or any other risks and difficulties that may arise in the future, its business financial condition or results of operations could be materially and adversely affected. The risks described below are not the only ones Tritium may
face. Additional risks that Tritium currently does not know about or that it currently believes to be immaterial may also impair its business, financial condition, or results of operations. You should review the investors presentation and perform your own due diligence prior to making an investment in
Tritium.
Tritium is a growth-stage company with a history of losses, and expects to incur significant expenses and continuing losses for the near term.
Tritium has experienced rapid growth and expects to invest in growth for the foreseeable future. If it fails to manage growth effectively, its business, operating results and financial condition could be adversely affected.
Tritium currently faces competition from a number of companies and expects to face significant competition in the future as the market for EV charging develops.
Tritium faces risks related to health pandemics, including the recent COVID-19 pandemic, which could have a material adverse effect on its business and results of operations.
Tritium relies on a limited number of suppliers and manufacturers of certain key components and for its charging stations. A loss of any of these partners, including as a result of a global supply shortage, could negatively affect Tritium’s business.
Tritium is dependent on a limited number of significant customers and distributors for a substantial portion of its revenues. The loss of any such customer or distributor, a reduction in sales to any such customer or distributor, or the decline in the financial condition of any such customer or distributor
could have a material adverse effect on Tritium’s business, financial condition, and results of operations if they are not replaced with another large sales order.
Tritium’s current contract with its distributor for its largest fuel customer is set to expire in August 2021, and Tritium does not expect the distributor contract to be renewed prior to expiration. Tritium expects to continue to work with this distributor to fill this fuel customer’s orders until Tritium is
able to supply the fuel customer directly.
While Tritium to date has not made material acquisitions, should it pursue acquisitions in the future, it would be subject to risks associated with acquisitions.
If Tritium is unable to attract and retain key employees and hire qualified management, technical, engineering and sales personnel, its ability to compete and successfully grow its business would be harmed.
Tritium is expanding operations internationally, which will expose it to additional tax, compliance, market and other risks.
Tritium’s management team has limited experience in operating a public company in the United States.
Tritium’s future revenue growth will depend in significant part on its ability to increase sales of its products and services to fleet operators as that market matures.
Computer malware, viruses, ransomware, hacking, phishing attacks and similar disruptions could result in security and privacy breaches and interruption in service, which could harm Tritium’s business.
Depending on funds raised as part of this transaction, Tritium may need to raise additional funds and these funds may not be available when needed.
Any delay in Tritium achieving planned capital to the balance sheet will delay manufacturing expansion planned for Europe and could impact revenue forecasts associated with the facility.
A disruption in global trade, including local air and sea freight, could delay the ability of planned factories to begin production on forecasted timelines, which could adversely affect Tritium’s business and results of operations.
If a safety issue occurs with Tritium products, or similar products from another manufacturer, there could be adverse publicity around Tritium’s products or the safety of charging stations generally, which could adversely affect Tritium’s business and results of operations.
If products in Tritium’s product roadmap, including Tritium’s software licenses, do not achieve projected sales in their planned channel, revenue forecasts for that product will not be met and Tritium’s results of operations could be adversely affected.
Changes to fuel economy standards or the success of alternative fuels such as green hydrogen may negatively impact the EV market and depot charging sales opportunities for heavy vehicles and thus the demand for Tritium’s products and services.
Tritium’s future growth and success is highly correlated with and thus dependent upon the continuing rapid adoption of EVs for passenger and fleet applications.
47You can also read