Rocking Drones with Intentional Sound Noise on Gyroscopic Sensors
←
→
Page content transcription
If your browser does not render page correctly, please read the page content below
Rocking Drones with Intentional Sound Noise
          on Gyroscopic Sensors
 Yunmok Son, Hocheol Shin, Dongkwan Kim, Youngseok Park, Juhwan Noh,
  Kibum Choi, Jungwoo Choi, and Yongdae Kim, Korea Advanced Institute of
                     Science and Technology (KAIST)
 https://www.usenix.org/conference/usenixsecurity15/technical-sessions/presentation/son

        This paper is included in the Proceedings of the
               24th USENIX Security Symposium
                     August 12–14, 2015 • Washington, D.C.
                                 ISBN 978-1-931971-232

                                               Open access to the Proceedings of
                                             the 24th USENIX Security Symposium
                                                    is sponsored by USENIX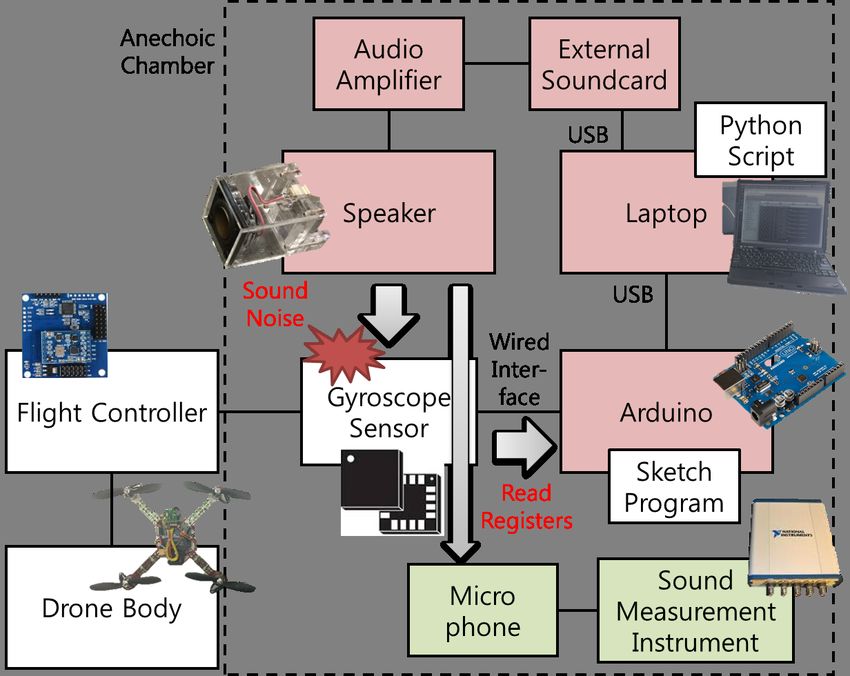
Rocking Drones with Intentional Sound Noise on Gyroscopic Sensors

    Yunmok Son, Hocheol Shin, Dongkwan Kim, Youngseok Park, Juhwan Noh, Kibum Choi,
                                Jungwoo Choi, and Yongdae Kim
                 Korea Advanced Institute of Science and Technology (KAIST),
                                   Daejeon, Republic of Korea
    {yunmok00, h.c.shin, dkay, raccoon7, juwhan, kibumchoi, khepera, yongdaek}@kaist.ac.kr

Abstract                                                      physical properties. Therefore, sensors can measure ma-
                                                              licious inputs that are intentionally crafted by an attacker
Sensing and actuation systems contain sensors to ob-          in addition to the physical stimuli that the sensors should
serve the environment and actuators to influence it. How-     detect. Because providing detection capabilities for at-
ever, these sensors can be tricked by maliciously fabri-      tacks against sensors increases production costs, most
cated physical properties. In this paper, we investigated     commercial devices with sensors are not equipped with
whether an adversary could incapacitate drones equipped       any ability to detect or protect against such attacks.
with Micro-Electro-Mechanical Systems (MEMS) gyro-
                                                                 Recently, many sensor-equipped devices, such as
scopes using intentional sound noise. While MEMS gy-
                                                              smartphones, wearable healthcare devices, and drones,
roscopes are known to have resonant frequencies that de-
                                                              have been released to make the devices easier and more
grade their accuracy, it is not known whether this prop-
                                                              convenient to use. In particular, commercial and open-
erty can be exploited maliciously to disrupt the operation
                                                              source drones have been widely used for aerial photog-
of drones.
                                                              raphy, distribution delivery [2, 3], and private hobbies.
   We first tested 15 kinds of MEMS gyroscopes against
                                                              These drones have multiple sensors, such as gyroscopes,
sound noise and discovered the resonant frequencies of
                                                              accelerometers, and barometers. A gyroscope measures
seven MEMS gyroscopes by scanning the frequencies
                                                              changes in tilt, orientation, and rotation based on angu-
under 30 kHz using a consumer-grade speaker. The stan-
                                                              lar momentum. It is thus a core sensor for flight attitude
dard deviation of the resonant output from those gyro-
                                                              control and position balancing.
scopes was dozens of times larger than that of the nor-
                                                                 To make the flight control modules of drones small,
mal output. After analyzing a target drone’s flight control
                                                              lightweight, and inexpensive, Micro-Electro-Mechanical
system, we performed real-world experiments and a soft-
                                                              Systems (MEMS) gyroscopes are used. MEMS gyro-
ware simulation to verify the effect of the crafted gyro-
                                                              scopes are designed as Integrated Circuit (IC) packages.
scope output. Our real-world experiments showed that in
                                                              Each design has a unique mechanical structure in the IC
all 20 trials, one of two target drones equipped with vul-
                                                              package. Depending on the structure of the MEMS gy-
nerable gyroscopes lost control and crashed shortly after
                                                              roscope, resonance occurs as a result of sound noise at
we started our attack. A few interesting applications and
                                                              resonant frequencies [37, 38, 39, 49]. This resonance
countermeasures are discussed at the conclusion of this
                                                              causes performance degradation of the gyroscope.
paper.
                                                                 The resonant frequencies of MEMS gyroscopes are
                                                              usually designed to be higher than the audible frequency
1   Introduction                                              band to prevent malfunctioning of the sensing and ac-
                                                              tuation systems. However, in our experiments, we dis-
Sensors are devices that detect physical properties in na-    covered that some MEMS gyroscopes that are popularly
ture and convert them to quantitative values for actua-       used in commercial drones resonate at audible frequen-
tors and control systems. In many sensing and actuation       cies as well as ultrasonic frequencies. Our experiments
systems, actuations are determined on the basis of infor-     were designed and conducted to analyze how drones are
mation from sensors. However, these systems can mal-          affected by this phenomenon from an adversary point of
function because of physical quantities that sensors fail     view. The flight control software of our target drone was
to measure or measure insensitively. Furthermore, most        also analyzed to examine the propagation of this phe-
sensors cannot distinguish between normal and abnormal        nomenon through the whole system. The results of our

USENIX Association                                                                24th USENIX Security Symposium 881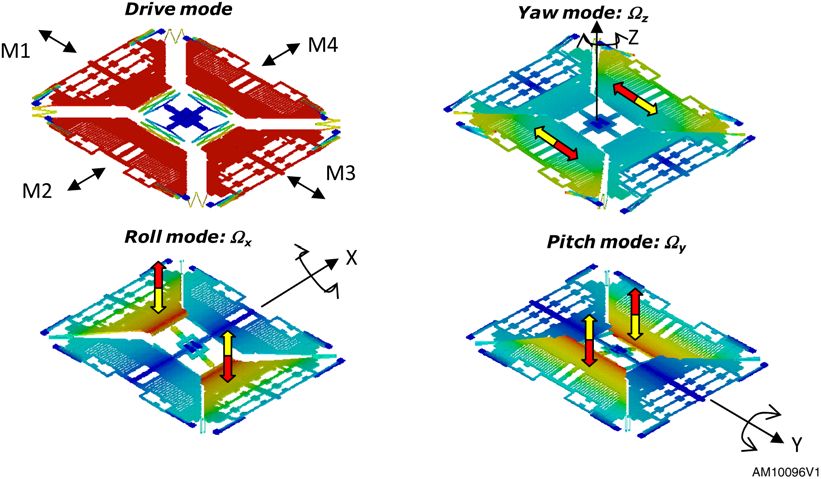
real-world experiments and a software simulation show                  the capability of the gyroscopes of smartphones to mea-
that this phenomenon could be exploited to launch inca-                sure acoustic vibrations at a low frequency band, a new
pacitating attacks against commercial drones.                          attack was proposed to eavesdrop speech [59]. The fo-
   The contributions of this research to the field can be              cus of these studies differed from that of this paper in
summarized as follows:                                                 that they examined the use of gyroscopes to extract pri-
                                                                       vate information, without affecting actuation.
    • We found, using a consumer-grade speaker, that the               Resonant Frequencies of Gyroscopes: Resonant fre-
      resonant frequencies of several popular MEMS gy-                 quency has been identified as a problem that causes
      roscopes are not only in the ultrasonic frequency                the performance degradation of MEMS gyroscopes. In
      band but also in the audible frequency band, and we              general, the vibrating structures of MEMS gyroscopes
      analyzed their resonant output.                                  have resonant frequencies. Resonance can occur as a
                                                                       result of sound noise [37, 38, 39]. Some mechanisms
    • We investigated the effect of the resonant output of             for mitigating interference from sound have been pro-
      MEMS gyroscopes on the flight control of drones                  posed. Roth suggested a simple and cheap defense
      via software analysis and simulations.                           technique that involves surrounding the gyroscope with
                                                                       foam [49]. Soobramaney proposed the use of an ad-
    • We developed a novel approach to attacking drones
                                                                       ditional structure in a gyroscope that responds only to
      equipped with vulnerable MEMS gyroscopes us-
                                                                       the resonant frequency to cancel out the resonant output
      ing intentional sound noise, and we demonstrated
                                                                       from the gyroscope [52]. Using an additional feedback
      the consequences of our attack in real-world exper-
                                                                       capacitor connected to the sensing electrode, the reso-
      iments 1
                                                                       nant frequency and the magnitude of the resonance ef-
                                                                       fect can be tuned [35, 43]. It is widely believed that
   This paper is organized as follows: Section 2 outlines
                                                                       most consumer-grade MEMS gyroscopes have resonant
security research to date on sensor systems. Section 3
                                                                       frequencies. However, these resonant frequencies are of-
provides background information on drone systems and
                                                                       ten considered to be commercial secrets or are designed
MEMS gyroscopes. Section 4 describes the analyses and
                                                                       to be just higher than the audible frequency range.
experiments conducted in this study to investigate the ef-
fects of sound noise on MEMS gyroscopes. Analysis of                   Security Analysis of Commercial Drones: There were
the flight control software, real-world experiments, and               a couple of works on hacking commercial drones. Sam-
simulations for attacking drones are described in Sec-                 land et. al. showed that AR.Drone [5] was vulnerable
tion 5. A discussion of the results and conclusion drawn               to network attacks due to unencrypted Wireless LAN
from the results are presented in Sections 6 and 7, re-                (WLAN) communication and the lack of authentication
spectively.                                                            for Telnet and FTP [50]. Kamkar showed that a drone
                                                                       can be hijacked by another drone using similar vulnera-
                                                                       bilities [44]. Attacks such as these are focused on hijack-
2     Related Work                                                     ing network connections or system privileges.
                                                                       Input Spoofing Attacks on Sensing Circuitry: All
The security of sensors recently started to draw atten-                sensing and actuation systems have sensing circuitry that
tion with the introduction of consumer-grade sensing and               is composed of the sensor itself and a wire that connects
actuation systems. As this study was focused on input                  the sensor to other components of the system. Kune et.
spoofing attacks on gyroscopes, we review in this section              al. showed that an adversary can inject an Electro Mag-
previous researches on 1) privacy issues related to gyro-              netic Interference (EMI) signal into the wire connect-
scopes, 2) resonant frequencies of gyroscopes, 3) secu-                ing an analog sensor and Analog-to-Digital Converter
rity analyses of commercial drones, and 4) input spoofing              (ADC) to fake a sensing signal [45]. By injecting fake
attacks on sensing circuitry.                                          waveforms, the researchers were able to inhibit pacing
Privacy Issues Related to Gyroscopes: Embedded de-                     or induce defibrillation shocks in Cardiac Implantable
vices can be used to record the private information of                 Electrical Devices (CIEDs). Without affecting the sen-
users without their recognition. Because a gyroscope can               sor itself, they were able to spoof the sensing signal by
be used to measure changes in tilt, orientation, and rota-             injecting an EMI signal into the sensing circuitry.
tion, it can be used to steal a smartphone user’s keystroke               It is also possible to affect the sensor itself. For exam-
information, such as unlock passwords, banking pass-                   ple, biometric imaging sensors have frequently been tar-
words, and credit card numbers [36, 47]. By exploiting                 geted in sensor spoofing attacks. Tsutomu et al. showed
    1 A demo video of our attack against the target drone in the       that a verification rate of more than 68 % could be
real world is available at https://sites.google.com/site/              achieved against 11 different fingerprint systems using
rockingdrone/.                                                         artificial fingers [46]. Galbally et al. fabricated fake

                                                                   2
882 24th USENIX Security Symposium                                                                             USENIX Association
years as the non-military drone market has grown [2, 3].
                                                                     Both finished drones and DIY drones with open-source
                                                                     drone projects for the flight control software are commer-
                                                                     cially available. AR.Drone [5] is a popular commercial
                                                                     finished drone product. Multiwii [24] and ArduPilot [7]
                                                                     are open-source flight control software used widely with
                                                                     both DIY and commercial drones. These drones are also
                                                                     known as multicopters (quadcoptors if they have four ro-
                                                                     tors) because they usually have multiple rotors.
    Figure 1: Block diagram of a typical drone system
                                                                        Typically, a drone system consists of multiple rotors,
                                                                     one flight controller, one wireless receiver, and one wire-
fingerprints from standard minutiae templates, and more              less transmitter (remote controller). Figure 1 shows a
than 70 % of the fake fingerprints were accepted by the              block diagram of a drone system. The flight controller
system tested [42]. In addition, a method for bypassing              receives control signals from the wireless transmitter
the user authentication of facial cognitive biometric sys-           through the receiver, and manipulates the speed of the
tems was proposed as an example of sensor input spoof-               rotors in accordance with the user’s control supported by
ing against the imaging sensor systems of commercial                 the flight controller.
laptops [40].
   We were able to find only one notable and relevant                3.2    Flight Attitude Control
study not related to biometric image sensors. Shoukry
et al. injected magnetic fields to spoof the wheel speed             It is very important for the drone flight controller to ad-
of vehicles by placing a magnetic actuator near the Anti-            just each rotor’s speed for horizontally leveling off in the
lock Braking System (ABS) wheel speed sensor of which                air, because multiple rotors are not always exactly the
is also a magnetic sensor also [51]. In other words, the             same and the center of mass cannot always be ensured.
researchers used the same physical property as that in-              To stabilize a drone’s balance automatically, a flight at-
tended to be sensed through the sensing channel of the               titude control system is implemented in the flight con-
target sensor for their spoofing attack. This work is sim-           trol software. This flight attitude control system com-
ilar to ours in that it explored intentional interference            putes the proper control signal for multiple rotors with
with sensors to cause malfunctioning of actuators How-               algorithms based on the data from Inertial Measurement
ever, we investigated whether intentional sound noise at             Units (IMUs), including gyroscopes.
the resonant frequency of a gyroscope can incapacitate                  IMUs, which consist of sets of sensors, are funda-
a drone. This means that our attack is an interference               mental components of flight control systems for air-
attack through a channel other than the sensing channel              craft, spacecraft, and UAVs, including drones. An IMU
that has to be insensitive for the gyroscope. Note that a            measures the orientation, rotation, and acceleration of a
MEMS gyroscope is the most basic sensor used in main-                drone, using a combination of a gyroscope and an ac-
taining a drone in an upright position without any exter-            celerometer, and in some cases also a magnetometer and
nal torque.                                                          a Global Positioning System (GPS) [55]. MEMS gy-
                                                                     roscopes are thus necessary components of drones and
                                                                     must be robust to control drones successfully.
3     Background                                                        In the case of open-source flight control software [7,
                                                                     24], the most common algorithm for flight attitude con-
In this section, we explain the operation and characteris-           trol is Proportional-Integral-Derivative (PID) control.
tics of the drone considered in this study, its flight control       The PID control algorithm is a control loop feedback
system and a MEMS gyroscope.                                         mechanism that minimizes the difference between the
                                                                     desired control and the current status. It is made up
3.1    Drone (Multicopter)                                           of three terms: the proportional, the integral, and the
                                                                     derivative terms, denoted by P, I, and D, respectively.
A drone is a kind of Unmanned Aerial Vehicle (UAV).                  The P term applies control to the system in proportion
Drones are used not only for military purposes but also              to the difference (error) between the current state and the
for various non-military purposes such as delivery ser-              desired state to the system. The I term is used to re-
vices, aerial photography, search and rescue (S&R),                  duce the steady-state error through proportional control
crop-dusting, and hobbies. Because of accessibility rea-             of the accumulation of past errors. The D term is used
sons, military drones were not considered in this paper.             to reduce overshoot and increase stability through pro-
Many commercial drones have been released in recent                  portional control of the changing rate of errors. Each

                                                                 3
USENIX Association                                                                      24th USENIX Security Symposium 883
term has a gain (GP , GI , and GD ) for tuning the control
system, and users can change each gain for stability and
sensitivity of drones of various types, sizes, and weights.

3.3     MEMS Gyroscope
3.3.1   Operation

The principle underlying the MEMS gyroscope [1, 9] is
the law of physics known as the Coriolis effect or Corio-
lis force. The Coriolis effect is the deflection of a moving
object in a rotating reference frame. This effect appears
only to an observer in the same rotating reference frame.
In the observer’s view, the path of the moving object is
observed to be bent by a fictitious force, i.e. the Corio-
lis force. In other words, when an object is moving in a
rotating container or package, the path of the moving ob-          Figure 2: Concept of MEMS gyroscope structure for one
ject is bent in a direction different from the moving direc-       axis
tion. Therefore, the observer on the container or package
can sense this bending. Figure 2 illustrates the concept
of a MEMS gyroscope structure for one axis. To sense
motion with respect to one axis such as Z-axis rotation,
there is a mechanical structure called a sensing mass in
a MEMS gyroscope. While a sensing mass is continu-
ously vibrating at a certain frequency with respect to the
X-axis, the Coriolis force is applied in the Y-axis direc-
tion as a result of the Z-axis rotation. The amount of
rotation is proportional to the amount of bending.
   Figure 3 shows an example of a MEMS gyroscope
structure with three axes. This gyroscope is manufac-
tured by STMicroelectronics [10]. In Figure 3, M1
through M4 correspond to continuous vibrations of the              Figure 3: Operation of a three-axis MEMS gyro-
sensing masses. Bending occurs in the direction orthog-            scope [10] (the X-, Y-, and Z-axes are defined as the
onal to both the vibrating axis and the rotating axis when         pitch, roll, and yaw, respectively.)
this structure rotates with respect to each axis [10].
   MEMS gyroscopes support digital interfaces such as              3.3.2   Acoustic Noise Effect
Inter-Integrated Circuits (I2 Cs) and Serial Peripheral In-
terfaces (SPIs) that communicate with the processors of            The accuracy degradation of MEMS gyroscopes by harsh
application systems. By reading registers of the gyro-             acoustic noise is well known to researchers who have
scopes that contain the sensed values, a system’s pro-             studied the performance of MEMS sensors [37, 38, 39,
cessor can calculate the amount of rotation that occurs.           49]. A MEMS gyroscope has a resonant frequency that
The maximum sampling frequency for reading the regis-              is related to the physical characteristics of its structure,
ters of the MEMS gyroscopes varies from a few hundred              and high-amplitude acoustic noise at the resonant fre-
to a few thousand samples per second. This means that              quency can produce resonance in the MEMS structure.
gyroscopes cannot sense and recover correctly from fast            As a result of this resonance, the MEMS gyroscope gen-
changes in rotation over a few kHz without additional              erates an unexpected output that may cause the related
signal processing, according to the sampling theorem.              systems to malfunction. To minimize the resonance ef-
The sampling theorem defines the minimum sampling                  fect of acoustic noise in daily life, MEMS gyroscopes
frequency as a frequency higher than 2 × B Hz when the             are typically designed with resonant frequencies above
given signal contains no frequency components higher               the audible frequency limit (i.e., above 20 kHz).
than B Hz. If this condition is not satisfied, distortion             However, we found that some MEMS gyroscopes have
occurs in the frequency response. This is referred to as           resonant frequencies in both the audible and ultrasonic
aliasing. Because of the aliasing problem, a frequency             frequency ranges, and these sensors generate ghost out-
analysis of the gyroscope output is not very useful.               puts with injected sound noise by an attacker. In addi-

                                                               4
884 24th USENIX Security Symposium                                                                        USENIX Association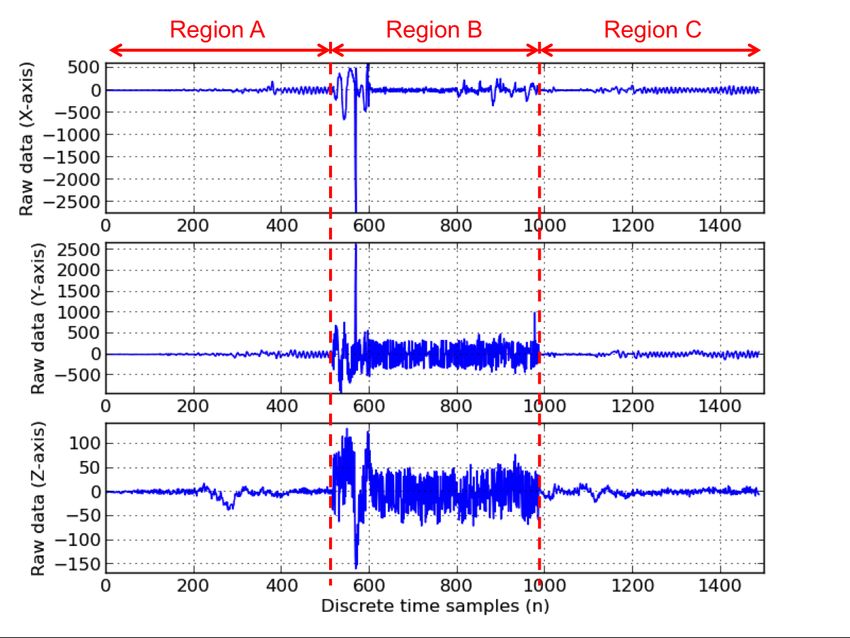
Figure 5: SPL and THD+N measurement using sound
         Figure 4: Overview of our experiment                     measurement instrument (National Instruments USB-
                                                                  4431)
tion, these MEMS gyroscopes are widely used in drone
flight controllers and smartphones. The accuracy degra-           was maintained until 1,000 samples had been collected
dation problem of MEMS gyroscopes has only been con-              from the target gyroscopes. We generated single-tone
sidered in the context of performance issues, but this phe-       noises at frequencies from 100 Hz to 30 kHz at inter-
nomenon can be used as a new attack vector. Therefore,            vals of 100 Hz. In other words, this experiment was per-
it is important to study this phenomenon as a vulnera-            formed using not only audible noise (below 20 kHz) but
bility that can cause critical loss of control of MEMS            also ultrasonic noise (above 20 kHz).
gyroscope application systems, such as drones.                       We evaluated 15 kinds of MEMS gyroscopes manu-
                                                                  factured by four vendors, which are readily available on
4     Analysis of Sound Noise Effects                             online websites. Most of the target gyroscopes were from
                                                                  STMicroelectronics and InvenSense, two leading vendors
To explore the effects of sound noise on drones, it is            of MEMS gyroscopes [22]. Each kind of gyroscope re-
necessary to identify the resonant frequencies of MEMS            quires a different application circuit and register config-
gyroscopes used for drones precisely. However, the                uration for proper operation. We therefore implemented
datasheets of some MEMS gyroscopes do not include                 simple application circuits and Arduino codes for the tar-
information on their exact resonant frequencies, and the          get gyroscopes by referring to their datasheets. The ef-
resonant frequencies are even classified in some cases. A         fects produced on each gyroscope by sound noise were
simple and reliable way to find the resonant frequency of         measured in an anechoic chamber (indicated by the dot-
a MEMS gyroscope is exhaustive search, i.e., scanning             ted line box in Figure 4).
with pure single-tone sound over a chosen frequency
band. In this section, the measurement and analysis of            4.2    Sound Source
the effect of sound noise on MEMS gyroscopes are de-
scribed.                                                          We considered the loudness and linearity of the sound
                                                                  source to select a sound source for further analysis.
4.1    Overview                                                      A common noise measurement unit for the loudness of
                                                                  sound is the Sound Pressure Level (SPL), because sound
An overview of our experiment is shown in Figure 4.               is a pressure wave in a medium such as air or water. To
Python scripts to generate sound noise with a single fre-         show the noise level generated by our sound source [12],
quency and to collect data from the target gyroscopes are         a consumer-grade speaker, SPL values were measured
run on a laptop computer. A consumer-grade speaker                with no weighting using a professional sound measure-
connected to the laptop is used as the noise source and is        ment instrument [26] and a microphone [8]. The speaker
set 10 cm above the top of the target gyroscope. We used          was placed 10 cm from the microphone, and single-tone
Arduino [6], a programmable microprocessor board, to              noises were generated from 100 Hz to 30 kHz at intervals
read and write registers of the target sensors. A single-         of 100 Hz. We used an audio amplifier to make the sound
tone sound noise scanning the sound frequency range               noise sufficiently loud. In addition, we set the sampling

                                                              5
USENIX Association                                                                   24th USENIX Security Symposium 885
Table 1: Summary of experiment results (investigation of the resonant frequencies of MEMS gyroscopes using inten-
tional sound noise)
                                         Inter-           Resonant freq. in                 Resonant freq. in
      Sensor     Vender∗      Axis
                                          face           the datasheet (axis)             the experiment (axis)
  L3G4200D†         STM      X, Y, Z    Digital             no information             7,900 ∼ 8,300 Hz (X, Y, Z)
    L3GD20†         STM      X, Y, Z    Digital             no information            19,700 ∼ 20,400Hz (X, Y, Z)
     LSM330         STM      X, Y, Z    Digital             no information           19,900 ∼ 20,000 Hz (X, Y, Z)
  LPR5150AL         STM       X, Y      Analog              no information            not found in our experiments
   LPY503AL         STM        X, Z     Analog              no information            not found in our experiments
   MPU3050           IS      X, Y, Z    Digital            33 ± 3 kHz (X)             not found in our experiments
   MPU6000†          IS      X, Y, Z    Digital            30 ± 3 kHz (Y)                26,200 ∼ 27,400 Hz (Z)
   MPU6050           IS      X, Y, Z    Digital            27 ± 3 kHz (Z)                25,800 ∼ 27,700 Hz (Z)
   MPU6500           IS      X, Y, Z    Digital         27 ± 2 kHz (X, Y, Z)         26,500 ∼ 27,900 Hz (X, Y, Z)
   MPU9150           IS      X, Y, Z    Digital            33 ± 3 kHz (X)                27,400 ∼ 28,600 Hz (Z)
    IMU3000          IS      X, Y, Z    Digital            30 ± 3 kHz (Y)             not found in our experiments
    ITG3200          IS      X, Y, Z    Digital            27 ± 3 kHz (Z)             not found in our experiments
     IXZ650          IS        X, Z     Analog 24 ± 4 kHz (X), 30 ± 4 kHz (Z) not found in our experiments
  ADXRS610           AD         Z       Analog             14.5 ± 2.5 kHz             not found in our experiments
  ENC-03MB        Murata        X       Analog              no information            not found in our experiments
  ∗ STM: STMicroelectronics, IS: InvenSense, AD: Analog Devices
  † 12 sample chips for experiments (2 sample chips for others)

Table 2: Effect of sound noise (standard deviations and their ratios for vulnerable gyroscopes, averaged for all sample
chips)
                        Without noise                      With noise                             Ratio
    Sensor
                   σXwo       σYwo      σZwo        σXw         σYw         σZw     σXw /σXwo σYw /σYwo σZw /σZwo
  L3G4200D         3.15      2.69        2.88       12.1       22.04        4.45       3.84       8.21        1.55
   L3GD20          2.92      2.47         2.3      62.03       76.67        3.09      21.21       31.04       1.35
   LSM330         13.09      16.03      21.45     177.71      114.34       30.44      13.57       7.13        1.42
  MPU6000         11.79      13.92       12.8      12.48       14.74      111.21       1.06       1.06        8.69
  MPU6050         13.21      12.32      11.17       13.8       12.55       58.17       1.04       1.02        5.21
  MPU6500         17.34      19.63      18.21     363.21       71.04       56.15      20.95       3.62        3.08
  MPU9150         10.69      11.47      10.71      10.98       11.97       58.59       1.03       1.04        5.47

rate of the sound source to 96 kHz rather than 48 kHz to          quency bands, the SPL values were above 80 dB and the
remove aliasing of the generating sound signal.                   THD+N values were less than 2 %. Because the sound
                                                                  source we used was a tweeter that is usually used for
   Another important property of a sound source is To-
                                                                  high-frequency sound, the performance was not good in
tal Harmonic Distortion plus Noise (THD+N), which is
                                                                  the low-frequency region (below 1 kHz). It is usually dif-
the ratio of the power of the harmonics and noise com-
                                                                  ficult to hear sound noise at frequencies above approxi-
ponents to that of a fundamental component, expressed
                                                                  mately 15 kHz, although we set the maximum volume at
as a percentage. Every speaker has a nonlinear charac-
                                                                  those frequencies. The measured SPL in our experiment
teristic to its frequency response. This nonlinearity leads
                                                                  was equivalent to the noise level (around 90 dB SPL) of
to harmonic distortions and noise of output sound at fre-
                                                                  a hand drill, hair dryer, heavy city traffic, noisy factory,
quencies that are different from a fundamental frequency.
                                                                  and subway in the real world.
If the power of these harmonics and noise is high (i.e.,
high THD+N), it is hard to regard the identified response
as the effect from a single frequency. However, it is not         4.3    Effect of Sound Noise
necessary for low THD+N of the sound source to attack.
                                                                  Raw data samples from the registers of the target gyro-
  Figure 5 shows the average values of both the SPL               scopes were collected for use in this analysis. The tar-
and THD+N for all of the experiments. In most fre-                get gyroscopes were fixed on a stable frame in an ane-

                                                              6
886 24th USENIX Security Symposium                                                                       USENIX Association
(a) Standard deviation of raw data samples for 12 identical             (b) Standard deviation of raw data samples for 12 identical
                       L3G4200D chips (X-axis)                                                 L3G4200D chips (Y-axis)

     (c) Standard deviation of raw data samples for 12 identical            (d) Raw data samples of one L3G4200D chip with the single
                       L3G4200D chips (Z-axis)                                              tone sound noise at 8,000Hz

Figure 6: Sound noise effect on L3G4200D gyroscopes (all samples were collected as raw data stored in the gyro-
scope’s register)

choic chamber, with and without sound noise. Because                           Our results show that seven of these gyroscopes (i.e.,
the standard deviation of the raw data samples should                       vulnerable gyroscopes) resonated at their own resonant
ideally be zero without sound noise when the target gy-                     frequencies in response to sound noise. Three of the
roscopes are on the frame, we consider the difference in                    vulnerable gyroscopes were manufactured by STMicro-
the standard deviations with and without sound noise as                     electronics, and the others were manufactured by In-
a criterion for the resonance of the target gyroscopes.                     verSense. No documentation on the resonant frequen-
   The results of the experiment are summarized in Ta-                      cies of the tested gyroscopes was available from vendors
ble 1. The third and fourth columns indicate the degrees                    other than InvenSense and Analog Devices. We figured
of freedom and the interface type of each gyroscope, re-                    out that the gyroscopes manufactured by STMicroelec-
spectively. The resonant frequencies 2 and axes from the                    tronics had resonant frequencies in the audible range (al-
datasheets [4, 13, 14, 15, 16, 17, 18, 19, 25, 28, 29, 30,                  most below 20 kHz), and that they were affected con-
31, 32] are listed in the fifth column, and the resonant                    siderably more along the X-axis and Y-axis than along
frequencies identified in our experiment are listed in the                  the Z-axis. In contrast, the gyroscopes manufactured by
last column.                                                                InvenSense resonated in the ultrasound range (above 20
                                                                            kHz) and were affected in the Z-axis direction only.
   2 These  are described as mechanical frequencies in the datasheets          Both keeping resonant frequencies secret and raising
for the InvenSense gyroscopes.                                              them to the higher-frequency region are good ways to

                                                                        7
USENIX Association                                                                                24th USENIX Security Symposium 887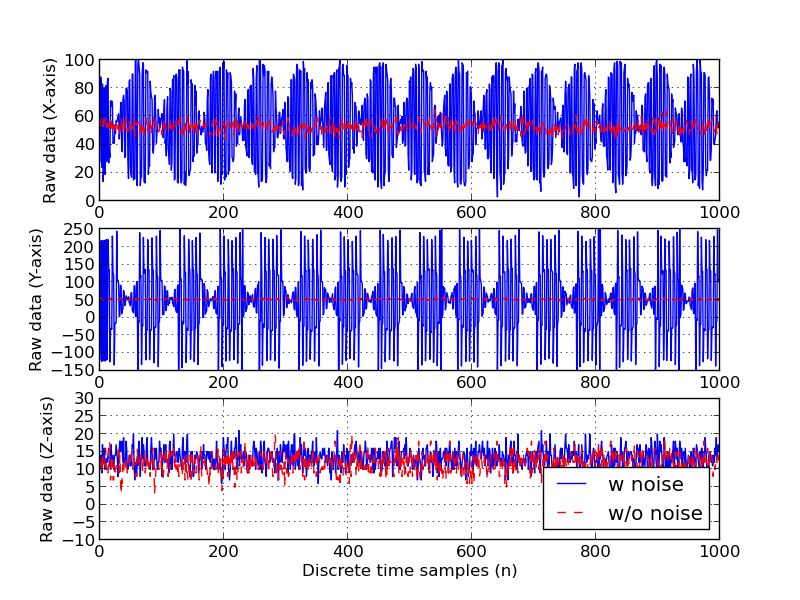
not found. It might be possible that the frequency in-
                                                                 tervals (100 Hz and 50 Hz) used in our tests were not
                                                                 sufficiently narrow. The fact that resonant frequencies
                                                                 were not detected in our experiments does not necessar-
                                                                 ily mean that they do not exist in the frequency range
                                                                 below 30 kHz.
                                                                    A comparison between the standard deviations (σaxis )
                                                                 with and without sound noise for the seven vulnerable
                                                                 gyroscopes is presented in Table 2. To validate our at-
                                                                 tack method, 12 individual gyroscope chips were tested
                                                                 for L3G4200D, L3GD20, and MPU6000, whereas only
                                                                 two chips were tested for the others. All of the values
                                                                 shown in Table 2 are average for all outputs from the
                                                                 same kind of vulnerable gyroscopes. The standard devi-
      (a) Raw data samples of one L3GD20 chip with               ations of the gyroscope outputs with sound noise at the
              a single-tone sound noise at 20,100Hz              resonant frequencies are relatively large. The ratios of
                                                                 the standard deviations with sound noise to those without
                                                                 sound noise are summarized in the last three columns.
                                                                 The standard deviations changed by factors up to dozens,
                                                                 with the greatest change being by a factor of 31.04 (for
                                                                 the Y-axis of L3GD20).
                                                                    Figures 6(a), 6(b), and 6(c) show the standard devia-
                                                                 tions of the raw data samples for each axis from the 12
                                                                 individual L3G4200D chips. The different L3G4200D
                                                                 chips have different output characteristics because of
                                                                 manufacturing variances. However, every L3G4200D
                                                                 chip has a peak in the range of 7,900 to 8,300 Hz. To
                                                                 investigate what happens at these frequencies in more de-
                                                                 tail, the raw data samples for one L3G4200D gyroscope
                                                                 with and without sound noise at 8,000 Hz were com-
                                                                 pared, as shown in Figure 6(d). This graph clearly shows
      (b) Raw data samples of one MPU6000 chip with
              a single-tone sound noise at 26,800Hz
                                                                 that resonances occur for all axes, and the amplitudes are
                                                                 dozens of times larger than the normal output. These am-
                                                                 plitudes are equivalent to the output produced by sudden
Figure 7: Sound noise effects on two vulnerable MEMS
                                                                 and fast shaking of the gyroscope or the target drone’s
gyroscopes (all samples were collected as raw data stored
                                                                 body by hands or rapidly changing winds. Raw data
in the gyroscope’s register)
                                                                 samples of two other vulnerable gyroscopes, L3GD20
                                                                 and MPU6000, are shown in Figure 7. L3G4200D and
reduce resonance due to sound noise. However, as our             MPU6000, two of the vulnerable gyroscopes in our ex-
results show, resonance can be induced by a malicious            periments, were used in the target drones described in the
attacker, as long as resonant frequencies exist in gy-           next section.
roscopes. Additionally, the standard deviations of the              It should be noted that a speaker generates sound
output data from these gyroscopes are largely increased          from a vibrating membrane fixed to the enclosure of
without any rotation or tilt when the resonance occurs as        the speaker, and thus vibration from the enclosure itself
a result of intentional sound noise. This abnormal out-          was unavoidable in the experiments. However, our ex-
put can potentially make gyroscope application systems           perimental results indicate that vibration had very little
malfunction.                                                     effect on the identification of the resonant frequencies
   We did not detect resonance effects for the other eight       of the target gyroscopes. Because we tested all of the
gyroscopes evaluated in our experiments. Particularly,           gyroscopes in the same environment, there should have
for five of these gyroscopes, no resonant frequencies            been consistent resonance frequencies for all of the gy-
were observed, even though their resonant frequencies            roscopes if any enclosure vibration had influenced the
are described in their datasheets. We obtained additional        motion of the gyroscopes. In addition, some of the gyro-
measurements with the frequency resolution enhanced              scopes listed in Table 1 exhibited no resonance (i.e., al-
by a factor of two (50 Hz), but resonant frequencies were        most constant standard deviation), which would not have

                                                             8
888 24th USENIX Security Symposium                                                                     USENIX Association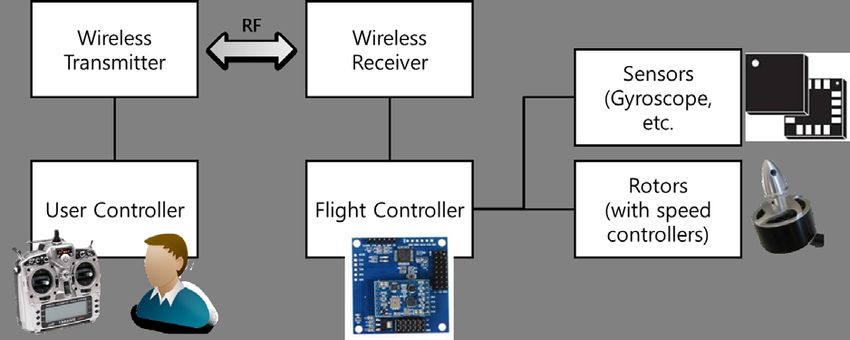
operation. Following the instructions in the manual for
                                                                  the flight control software, we calibrated the IMU sen-
                                                                  sors and four rotor controllers, and we adjusted the PID
                                                                  gains (see Section 3.2) for stable flight.

                                                                  5.2    Software Analysis
                                                                  Target drone A’s flight control software, Multiwii [24],
                                                                  supports various gyroscopes. However, the main routine
                                                                  of this software is essentially the same for all gyroscopes
    Figure 8: Propagation of the effect of sound noise
                                                                  except with respect to the way the sensors are prepared
                                                                  and the way the raw data are accessed. The main pro-
been possible if there had been a strong vibration due to         cessor reads the raw data from the gyroscope’s registers
vibration of the enclosure.                                       through an I2 C interface, along with the raw data from
                                                                  the transmitter controlled by the user. Each raw data
                                                                  sample for each axis was stored in two 8-bit registers.
5     Attacking Drone                                             These raw data were the main inputs to the flight control
                                                                  software, and the outputs were the rotor control data cal-
As described in the previous section, the outputs of
                                                                  culated by the PID control algorithm. The PID controller
MEMS gyroscopes fluctuate with the sound noise at the
                                                                  seeks to minimize the difference between the measured
gyroscopes’ own resonant frequencies. This section de-
                                                                  control and the desired control for the control systems.
scribes the impact of this fluctuation on the control of a
                                                                  While PID controller implementation and PID gains vary
drone. To understand this, we first need to understand
                                                                  depending on their application and the gyroscope used,
how the user input from a remote controller and the in-
                                                                  the fundamental algorithm remains the same.
put from the gyroscope propagate to the operation of a
                                                                     Algorithm 1 describes a high-level implementation of
drone. Figure 8 shows each step in this propagation. The
                                                                  the default PID control algorithm in this flight control
flight control software calculates each control signal for
                                                                  software. The details of the software are omitted for sim-
four rotors based on the user input and gyroscope out-
                                                                  plicity. Conceptually, the P, I, and D terms influence the
put. This control signal mechanically controls the speed
                                                                  target drone’s control as follows:
of each rotor, which determines the tilt, orientation, and
rotation of the drone in turn. This section describes the           • P is proportional to the present output of the gyro-
analysis of how sound noise at the resonant frequency of              scope, and if the present output value (gyro[axis])
a gyroscope affects control of target drones.                         of the gyroscope is abnormally large, the desired
   We took the following three steps. 1) To understand                control from the transmitter (txCtrl[axis]) can be ig-
the reaction of the target drones as actuators to the fluc-           nored (line 7).
tuation of the gyroscope output as abnormal sensing, the
flight control software was analyzed statically. 2) We              • I is proportional to the accumulated error between
then launched our attack on two target drones under real-             the output from the transmitter and the gyroscope
world conditions to assess the effect of the maximum                  (line 10), which can be ignored, because the default
sound noise against them. 3) To identify cost-efficient               value of the I term gain (GI ) for the target drone is
parameters for our attack, we performed software simu-                very small.
lations with gyroscope outputs varying from 1% to 100
% of the maximum noise.
                                                                  Table 3: Specifications of two target drones for the real
                                                                  world attacking experiment
5.1    Target Drones                                                                     Target              Target
                                                                       Spec.
For this experiment, two DIY drones were built for                                      Drone A             Drone B
use as the target drones, and they were equipped with                Processor     STM32F103CBT6 ATMEGA2560
L3G4200D and MPU6000 respectively, two of the vul-                  Gyroscope          L3G4200D            MPU6000
nerable gyroscopes. This approach was taken because                 Flight Ctrl.
                                                                                     Multiwii [24]        ArduPilot [7]
the gyroscopes on most finished drones are not user se-              Software
lectable, and it was necessary to evaluate the effect of             Diagonal
                                                                                         45 cm               55 cm
sound noise in the sensing and actuation systems. The               Frame Size
main specifications of the two target drones are given in            Propeller
                                                                                        10 × 4.5            10 × 4.5
Table 3. All DIY drones require calibration for stable                  Size

                                                              9
USENIX Association                                                                   24th USENIX Security Symposium 889
Algorithm 1: Simplified PID algorithm of Multiwii ArduPilot [7] for target drone B. A manual software anal-
flight controller (calculating the rotor control data ac- ysis shows that the PID algorithm used in ArduPilot is
cording to the output of the gyroscope) essentially the same as that used with target drone A.
Input: The sensed data from the MEMS gyroscope The only difference between two algorithms is in slight
Input: The received data from the transmitter changes of the gains that are multiplied to each of the P,
Output: The data to control the rotor I, and D terms. This can be considered a discrepancy in
1 initialization;
the configuration values of the sensors.
2 GP , GI , and GD : pre-configured P, I, and D gain by
user (configured as the default values); 5.3 Real-World Experiment
3 while True do
4 read data from the gyroscope for 3 axes; While the software analysis described in the previ-
5 receive data from the transmitter for 4 channels ous section led us to believe that the PIDCtrl[axis]
(3 axes and throttle); values would fluctuate when the gyroscope outputs
6 for axis do fluctuated, this information was not sufficient to an-
7 P = txCtrl[axis] − gyro[axis] × GP [axis]; swer the following questions: 1) Given user inputs
8 error = txCtrl[axis]/GP [axis] − gyro[axis]; txCtrl[throttle] and fluctuating PIDCtrl[axis], how much
9 erroraccumulated = erroraccumulated + error; does rotorCtrl[rotor] change? 2) How does a change in
10 I = erroraccumulated × GI [axis]; rotorCtrl[rotor] affect the behavior of the drone? To an-
11 delta = gyro[axis] − gyrolast [axis]; swer these questions, we decided to launch our attack in
12 deltasum = sum of the last three delta values; the real world with sound noise causing the fluctuation.
13 D = deltasum × GD [axis]; Attack Setup: In this experiment, we attached a small
14 PIDCtrl[axis] = P + I − D; Bluetooth speaker above the target system’s gyroscope at
15 end a distance of 10 cm to serve as an attacking sound source.
16 for rotor do The SPL of the fundamental frequency component was
17 for axis do 113 dB with the maximum volume of the speaker. Low
18 rotorCtrl[rotor] = THD+N was not a consideration for the sound source
txCtrl[throttle] + PIDCtrl[axis]; used in the attack. The sound noise was turned on while
19 end the target drones were stably maintained in the air. To
20 limit rotorCtrl[rotor] within the pre-defined observe the status of the target drones before, during, and
MIN (1,150) and MAX (1,850) values; after the attack, sound noise at the resonant frequency
21 end was turned off, turned on (attack), and turned off again
22 actuate rotors; for every 10 seconds.
23 end Attack Results: The results of our attack experiment are
summarized on two target drones (A and B) in Table 4.
Our attacks successfully disrupted control of target drone
A, but it did not affect target drone B. The reason of at-
• D is proportional to the changes (deltasum ) between
tack failure on target drone B is that the gyroscope of
the previous and present output values of the gyro-
target drone B resonated only along the Z-axis. The Z-
scope (line 13).
axis of target drone B corresponds to the horizontal ori-
entation that is also sensed by the magnetometer on the
These three terms directly affect the PID control val- board.
ues (PIDCtrl[axis]) for each axis (line 14). If the values We also attached a sonar device to gauge the altitude
of P and D are abnormally large, the PID control val-
ues will also increase abnormally. The desired throttle
control (txCtrl[throttle]) can thus be ignored (line 18).
In the end, all rotor control values are constrained by Table 4: Result of attacking two target drones
the pre-defined minimum and maximum values (line 20). Target Target
Item
Throughout the process, the raw data from the gyroscope Drone A Drone B
were not checked, filtered, or verified. In other words, Resonant Freq. 8,200 Hz 26,200 Hz
the target drone system fully trusted the integrity of the (Gyroscope) (L3G4200D) (MPU6000)
gyroscope output in its sensing and actuation. Therefore, SPL at Resonant
97 dB 95 dB
the control of the target drone could be directly affected Freq.
by our attack. Affected Axes X, Y, Z Z
We also analyzed the flight control software of Attack Result Fall down Not affected
10
890 24th USENIX Security Symposium USENIX Association(a) Raw data samples of the gyroscope (b) Received data samples from the transmitter
(c) Rotor control data samples (from the flight control software) (d) Altitude data samples from sonar
Figure 9: The results of our attack against target drone A in a real-world experiment (sound noise turned off, on, and
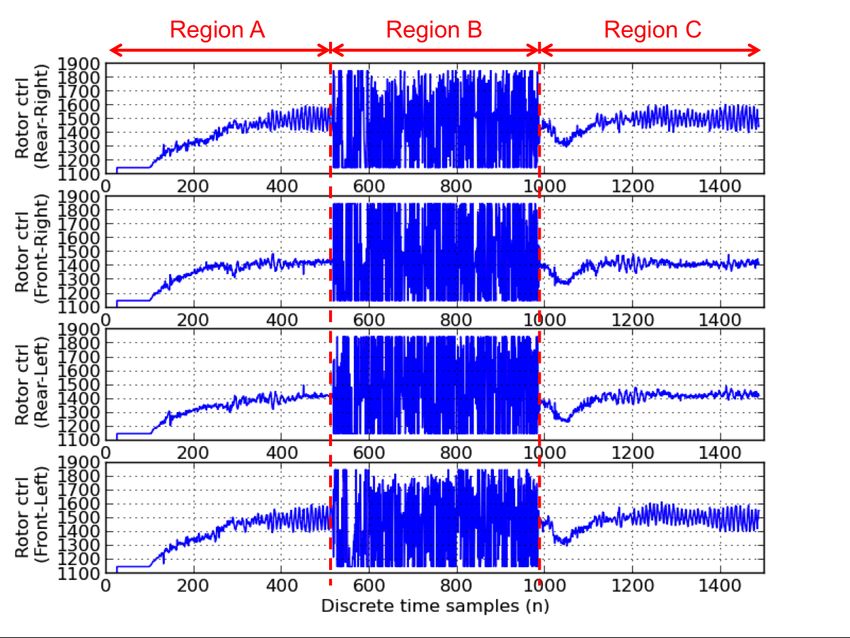
off every 10 seconds; note that the sonar’s sampling rate was different from that for the data in other figures)
and two Bluetooth-to-UART (Universal Asynchronous control data of the flight control software, and the alti-
Receiver/Transmitter) modules to collect real-time data tude data from target drone A in the air. Note that the al-
from target drone A. The Bluetooth-to-UART modules titude data were sampled at a different rate than the other
were connected to a UART interface on target drone A’s data because of a technical limitation of the sonar mod-
flight controller board and the sonar module. Using this ule, and the minimum sensing distance of the sonar was
UART interface, we were able to communicate with a 20 cm.
computer for configuration purpose. We were also able
to monitor the status of target drone A, including the raw Figure 9 shows the detailed results of the attack against
data from the sensors and the rotor control data, using the target drone A in the real-world experiment. Region A in
Multiwii [24] Graphical User Interface (GUI) program. Figure 9 corresponds to the period before the attack. The
By analyzing the Multiwii source code, we were able to user gradually raised the throttle (Figure 9(b)), and the
understand the protocol used for the UART communica- speeds of the four rotors were increased correspondingly
tion. Each request or response message consists of a 3- (Figure 9(c)). In response, target drone A rose over 100
bytes fixed header, 1 byte for the data length (n), a 1-byte cm in the air (Figure 9(d)). When the attack was started
command, n bytes of data, and a 1-byte checksum. Us- (Region B), the output of the gyroscope fluctuated be-
ing this protocol and the Bluetooth-to-UART modules, cause of the sound noise at the resonant frequency (Fig-
we were able to record the resonant outputs of the gy- ure 9(a)). According to the resonant output of the gyro-
roscope, the control data from the transmitter, the rotor scope, the rotor control data fluctuate between the max-
imum and minimum values (Region B in Figure 9(c)).
11
USENIX Association 24th USENIX Security Symposium 891Figure 10: Rotor control outputs from our software sim- Figure 11: Sound noise effect on one L3G4200D gyro-
ulation (the maximum change of the rotor control output scope versus sound noise amplitude with theoretical rela-
was 700) tive SPL (data averaged for ten identical experiments and
1,000 raw data samples collected per experiment)
When the attack started, target drone A dropped instan-
taneously. During the attack, target drone A could not the target drone with sound noise from outside during
ascend or recover its control, even though throttle control its flight without attaching any structure to it.
was maintained to allow it to ascend slowly (Figure 9(b)). Therefore, to minimize the number of trials and over-
After the attack was stopped (Region C), target drone A come the practical limitations mentioned above, we first
ascended normally again and recovered its control. We ran a simulation using the functions of Algorithm 1,
attacked target drone A 20 times in the real-world exper- which were extracted from the source code for target
iments, and it lost control and crashed shortly after our drone A. Based on the results of this simulation, we
attack in every test. found out the effective fluctuation (i.e., standard devi-
To assess the effectiveness and practicality of our at- ation) of the gyroscope output with a few real-world
tack, more real-world attack experiments are required. tests. Then, we measured the standard deviations of tar-
However, there are obstacles such as the damage to the get drone A on a desk exposed to sounds of various am-
target drone (e.g., broken arms) and the repetitive re- plitudes. By combining the results of this simulation
calibration required after each crash, because the unpre- and our measurements, we were able to identify an ap-
dictable changes in the drone’s balancing are fed back proximate range of sound amplitude for testing the tar-
into the gyroscope by our attack (see the dotted line and get drone in the air. We then derived the feasible attack
box in Figure 8). distance theoretically using the SPL value that we had
measured in our attack with the effective amplitude of
the sound noise.
5.4 Attack Distance
Simulation: For the software simulation, the recorded
Our real-world experiments showed that an acoustic at- gyroscope output and the control data from the trans-
tack can completely incapacitate a target drone equipped mitter in the real-world attack experiments were used as
with a gyroscope vulnerable to X-axis and Y-axis reso- the inputs. The recorded gyroscope output was linearly
nance due to sound incidence. We also want to determine scaled from 1 % to 100 % in increments of 1 %, and
the conditions or bounds of a cost-effective attack. For the control data from the transmitter were the same as in
example, we need to find out possible attack distance or the real-world experiment. Figure 10 shows the results
sound level of a sound source required to destabilizing a of the simulation. Because the rotor control output was
target drone in the air. bounded between 1,150 and 1,850 in Algorithm 1, the
We may try to conduct tests at various distances to dis- maximum change of the rotor control output was 700.
cover either the approximate minimum distance or the The minimum scale of the gyroscope output that could
sound level required to incapacitate target drone A in the achieve the maximum change in all rotor controls was
air. However, it would disrupt the stability of the target 37 % in our simulation (Figure 10).
drone to attach a longer structure with the sound source Indoor Measurements: The standard deviation of the
on the target drone. It is also difficult to take aim at gyroscope output with respect to the sound noise am-
12
892 24th USENIX Security Symposium USENIX Associationplitude was measured for the L3G4200D gyroscope of can generate sound of 120 dB at 100 m, and 450XL [21]
target drone A on a desk. Figure 11 shows the rela- from LRAD and HyperShield [33] from UltraElectronics
tive standard deviation of the gyroscope output measured can produce 140 dB at 1 m, which is equivalent to 108.5
at a 10 cm distance, which decreases logarithmically as dB at 37.58 m. Therefore, the possible attack distance
the sound level decreases. Theoretically, the relation- is 37.58 m, if an attacker uses a sound source that can
ship between the sound amplitude and SPL is described generate 140 dB of SPL at 1 m.
by Equation 1 [27]. At the point of the reference SPL
(SPLre f ), the amplitude of the sound noise signal is Are f .
6 Discussion
A
SPL = SPLre f + 20 log (1) In this section, we present a discussion of potential attack
Are f
scenarios and countermeasures.
The relative SPL obtained by changing the amplitude
is the second term in Equation 1, and it is illustrated in
Figure 11, along with the measured relative standard de- 6.1 Potential Attack Scenarios
viations. The decreasing trend in our measurements is The attack model used in this paper seems to be too
similar to that for the theoretical relative SPLs, but the strong in two ways: 1) Use of audible sound can be easily
amount of decrease in our measurements was smaller detected, and 2) the speaker is close to the drone body.
than that for the theoretical relative SPLs from the am- However, the more practical attack can be designed to
plitude range over 70 %. This mismatch is the typical weaken this attack model from the analysis result of this
output characteristic of consumer-grade speakers at high study.
amplitude levels, which is caused by the nonlinear dis- First, several gyroscopes listed in Table 1 have res-
tortion that also leads to the leakage of sound energy into onant frequencies in the inaudible band (i.e., above 20
harmonic and subharmonic frequencies. kHz). If the resonant frequency is above 20 kHz, a suc-
Distance Analysis: The amplitude of the sound noise cessful attack is possible using an ultrasonic sound gen-
corresponding to 37 % (-8.64 dB) of the standard devi- erator and transducer. In addition, sound at frequencies
ation in Figure 11 is approximately 27 %, because the higher than 15 kHz is difficult for humans to hear.
standard deviation of the gyroscope output is propor- Second, the distance analysis shows that various re-
tional to the scale of the gyroscope output. Accordingly, mote attacks are also possible using different types of
the sound noise greater than 27 % in amplitude can in- sound generators. Some of promising ways for the re-
duce the maximum changes in all rotor controls for target mote attack are described below.
drone A, if the drone is tested at the same environment Compromising the Sound Source: It is not hard to
as that of our real-world attack. imagine drones with speakers (consider police and mil-
In the real-world experiments, we changed the ampli- itary operations or search-and-rescue operations). If
tude of the sound noise in the same environment and ob- one can compromise the source of the sound from the
served that around 30 % sound amplitude is the lower speaker, the effect will be the same as that of our origi-
bound for making target drone A crash. The SPL mea- nal attack model. For example, insecurity of the Hybrid
sured at this 30 % sound amplitude was 108.5 dB. Us- Broadcast-Broadband Television (HbbTV) standard and
ing the following relationship between the distance and implementation would allow an adversary to control the
SPL [58], we can derive a possible attack distance of a TV stream [48].
remotely located sound source, where the reference dis- Drone to Drone Attack: In 2013, Kamkar demonstrated
tance (dre f ) and SPL (SPLre f ) are those measured from the ‘SkyJack’ attack, in which an adversary drone hi-
the real-world attack experiments. jacks a victim drone using a wireless denial-of-service
attack [44]. A similar attack could involve following
d
SPL = SPLre f − 20 log (2) and taking a picture of a moving object, which could be-
dre f come a popular drone application. An adversary drone
According to this prediction, the possible attack dis- equipped with a speaker could steer itself toward a victim
tance is approximately 16.78 cm using the same sound drone and generate a sound with the resonant frequency
source that we used for the real-world attack with the of the victim’s gyroscope to drag it down. Of course, in
maximum volume (113 dB). This attack distance range this case, the resonant frequency of the adversary’s gyro-
might not be sufficient for a malicious attacker. How- scope has to be different from that of the victim.
ever, attackers can overcome this distance limitation by Long Range Acoustic Device: Long Range Acous-
using a more powerful and directional source (e.g., a tic Device (LRAD) [56] could be used as a sonic
loudspeaker array) than the single speaker used in our weapon [57] or Acoustic Hailing Device (AHD) [54].
experiments. For instance, SB-3F [23] from Meyersound Sonic weapons can cause damages to human organs
13
USENIX Association 24th USENIX Security Symposium 893by inducing intense sound waves at certain frequencies,
even if the sound source is not in contact with oppo-
nents [41, 53]. AHDs are specially designed loudspeak-
ers that communicate over longer distances than normal
loudspeakers [21, 23, 33]. In both cases, the most im-
portant requirement is a high SPL in a specific frequency
band. Obviously, these technologies could be used to in-
crease the range of our attack.
Sonic Wall/Zone: Because drones can be made small,
they can be difficult to detect using radar. Therefore, it
might be desirable to enforce no-fly zones for drones, as
illustrated by recent drone incidents [11, 34]. One might
consider building a sonic wall or a zone that radiates con-
tinuous sound noise (at various frequencies) in a specific
area to enforce the no-fly zone.
Figure 12: Physical isolation test for one L3G4200D gy-
roscope with four different materials (data averaged for
6.2 Countermeasures
ten identical experiments and 1,000 raw data samples
Several researches that have been conducted to improve collected per experiment)
the performance of MEMS gyroscopes in harsh acoustic
environments are discussed below.
back capacitor connected to the sensing electrode, the
Physical Isolation: The simplest way to mitigate our
resonant frequency and the magnitude of the resonance
attack is to provide physical isolation from the sound
effect can be tuned [35, 43].
noise. This is the same concept as shielding against
Electro Magnetic Interference (EMI). For example, the These countermeasures may be used to mitigate our
iPhone 5S, which is equipped with an L3G4200D gyro- attack. However, physically surrounding the gyroscope
scope [20], would not be affected by our attack, because sensor with certain materials could cause several prob-
of the compact casing of the hardware circuit. Surround- lems, such as affecting other sensors or components and
ing the gyroscope with foam would also be a simple and raising the temperature of the board. These problems
inexpensive countermeasure. Foam that is 1 inch thick may cause malfunctions of the drone control systems.
has approximately 120 dB insertion loss in SPL [49]. In addition, use of a differential comparator with another
gyroscope implies an additional cost. The resonance tun-
Figure 12 shows the result of physical isolation exper-
ing countermeasure also has the limitation that the reso-
iments conducted using four different materials: a paper
nant frequency does not disappear as a result of tuning.
box, an acrylic panel, an aluminum plate, and foam. We
Because the resonant frequency still exists, an attack at
put these materials between the sound source and the tar-
that frequency remains possible.
get gyroscope. The isolation performances of the differ-
ent materials were not very different. Using these mate-
rials, the effect of the sound noise on one L3G4200D gy- 7 Conclusions and Future Work
roscope was decreased to 23.78%, 16.25%, and 60.49%
for the three axes. Many sensing and actuation systems trust their measure-
Differential Comparator: While physical isolation is a ments, and actuate according to them. Unfortunately, this
passive approach to mitigation, use of a differential com- trust can lead to security vulnerabilities that cause criti-
parator is an active approach to mitigation. Using an ad- cally unintended actuations. We found that the sound
ditional gyroscope with a special structure that responds channel can be used as a side channel for MEMS gyro-
only to the resonant frequency, the application systems scopes from a security point of view. In our experiment,
can cancel out the resonant output from the main gy- we tested 15 kinds of MEMS gyroscopes, and seven of
roscope [52]. The concept of this countermeasure was them were found to be vulnerable to disruption using
introduced by Kune et al. [45] to detect and cancel out intentional sound noise. The output of the vulnerable
analog sensor input spoofing against CIEDs. MEMS gyroscopes was found using a consumer-grade
Resonance Tuning: In the operation of MEMS gyro- spaeker to fluctuate up to dozens of times as a result of
scopes, the bending mentioned in Section 3.3.1 changes sound noise.
the capacitance between the sensing mass and the sens- To demonstrate the effects of this vulnerability, we im-
ing electrode, and this capacitance change is sensed as plemented an attack against two target drones equipped
the output of the gyroscope. By using an additional feed- with different kinds of vulnerable MEMS gyroscopes.
14
894 24th USENIX Security Symposium USENIX AssociationAs a result of a firmware analysis of the target drones [11] German pirate party uses drone to crash angela merkel event.
and a simulation of the flight control software output, http://www.slate.com/blogs/future_tense/2013/
09/18/german_pirate_party_uses_drone_to_crash_
the control signals of four rotors were found to fluctu- event_with_chancellor_angela_merkel.html.
ate up to the maximum value and down to the minimum
[12] Hi-Vi B1S Full Range Loudspeaker. https://www.
value by the injected gyroscope output. One of the target madisoundspeakerstore.com/approx-1-fullrange/
drones, which was equipped with with a small speaker, hi-vi-b1s-full-range/.
lost control and crashed in all 20 real-world attack exper- [13] InvenSense IMU3000 datasheet. http://www.invensense.
iments. We found in these experiments that an attacker com/mems/gyro/documents/PS-IMU-3000A.pdf.
with only 30% of the amplitude of the maximum sound [14] InvenSense ITG3200 datasheet. http://www.invensense.
noise could achieve almost the same effect at the same com/mems/gyro/documents/EB-ITG-3200-00-01.1.pdf.
distance. [15] InvenSense IXZ650 datasheet. http://invensense.com/
The countermeasures that are mentioned in the last mems/gyro/documents/PS-IXZ-0650B-00-01.pdf.
subsection have limitations and require hardware modi- [16] InvenSense MPU3050 datasheet. http://www.invensense.
fications and additional materials. Because these mitiga- com/mems/gyro/documents/PS-MPU-3000A.pdf.
tions would increase the production costs, it is necessary [17] InvenSense MPU6000/6050 datasheet. http:
to develop a low-cost, software-based defense mecha- //www.invensense.com/mems/gyro/documents/
PS-MPU-6000A-00v3.4.pdf.
nism against sensor attacks for various types of embed-
ded devices. [18] InvenSense MPU6500 datasheet. http://www.invensense.
com/mems/gyro/documents/PS-MPU-6500A-01.pdf.
Some MEMS gyroscopes are integrated with ac-
celerometers in the same IC package. In our experi- [19] InvenSense MPU9150 datasheet. http://dlnmh9ip6v2uc.
cloudfront.net/datasheets/Sensors/IMU/
ments, we found that some accelerometers are also af- PS-MPU-9150A.pdf.
fected by high-power sound noise at certain frequencies. [20] iPhone 5s Teardown. https://www.ifixit.com/Teardown/
It would be interesting to further investigate this finding. iPhone+5s+Teardown/17383.
[21] LRAD 450XL datasheet. http://www.lradx.com/
Acknowledgements wp-content/uploads/2015/05/LRAD_Datasheet_450XL.
pdf.
This work was supported by Samsung Research Fund- [22] Market share information of MEMS gyroscope in 2013
(page 17). http://www.semiconwest.org/sites/
ing Center of Samsung Electronics under Project Num- semiconwest.org/files/data14/docs/SW2014_JCEloy_
ber SRFC-TB1403-01. YoleDeveloppement_0.pdf.
[23] Meyersound SB-3F datasheet. http://www.meyersound.
References com/sites/default/files/sb-3f_ppi.pdf.
[24] Multiwii (open-source drone project). https://github.com/
[1] A Critical Review of MEMS Gyroscopes Technology and Com-
multiwii/baseflight and https://code.google.com/p/
mercialization Status. http://invensense.com/mems/gyro/
multiwii/.
documents/whitepapers/MEMSGyroComp.pdf.
[25] Murata ENC-03MB datasheet. http://www.mouser.com/
[2] Alibaba begins drone delivery trials in China. http://www.
catalog/specsheets/ENC-03M_ref.pdf.
bbc.com/news/technology-31129804.
[3] Amazon Prime Air (Amazon.com, Inc.). http://www.amazon. [26] National Instruments USB-4431, Sound and Vibration Data Ac-
com/b?node=8037720011. quisition Instrument. http://www.ni.com/pdf/products/
us/cat_usb4431.pdf.
[4] Analog Devices ADXRS610 datasheet. http://www.
analog.com/media/en/technical-documentation/ [27] Relative Sound Pressure according to Amplitude. http://www.
data-sheets/ADXRS610.pdf. indiana.edu/~emusic/acoustics/amplitude.htm.
[5] AR.Drone (Parrot, Inc). http://ardrone2.parrot.com/. [28] STMicroelectronics L3G4200D datasheet. http:
//www.st.com/web/en/resource/technical/document/
[6] Arduino UNO. http://arduino.cc/.
datasheet/CD00265057.pdf.
[7] ArduPilot (open-source drone project). https://github.com/
diydrones/ardupilot. [29] STMicroelectronics L3GD20 datasheet. http://www.st.com/
st-web-ui/static/active/en/resource/technical/
[8] Brüel & Kjær Microphone Unit Type 4189-A-021. document/datasheet/DM00036465.pdf.
http://www.bksv.com/Products/transducers/
acoustic/microphones/microphone-cartridges/4189. [30] STMicroelectronics LPR5150AL datasheet. http:
//www.st.com/web/en/resource/technical/document/
[9] Design and Analysis of MEMS Gyroscopes (Tutorial at
datasheet/CD00237211.pdf.
IEEE Sensor 2013). http://ieee-sensors2013.org/
sites/ieee-sensors2013.org/files/Serrano_Slides_ [31] STMicroelectronics LPY503AL datasheet. http:
Gyros2.pdf. //www.st.com/web/en/resource/technical/document/
datasheet/CD00237199.pdf.
[10] Everything about STMicroelectronics’ 3-axis digital MEMS
gyroscopes. http://www.st.com/web/en/resource/ [32] STMicroelectronics LSM330 datasheet. http://www.st.com/
technical/document/technical_article/DM00034730. web/en/resource/technical/document/datasheet/
pdf. DM00059856.pdf.
15
USENIX Association 24th USENIX Security Symposium 895You can also read