Socio-Economic Baseline of the Howe Sound Area - Stephen Foster David Suzuki Foundation - David ...
←
→
Page content transcription
If your browser does not render page correctly, please read the page content below
Socio-Economic Baseline of the Howe Sound Area

                            Prepared for:
                            Stephen Foster
                            David Suzuki Foundation

                            Prepared by:
                            Lions Gate Consulting
                            207-2902 West Broadway
                            Vancouver, BC
                            t/f: 604.733.5622
                            info@lionsgateconsulting.ca

                   May 30, 2016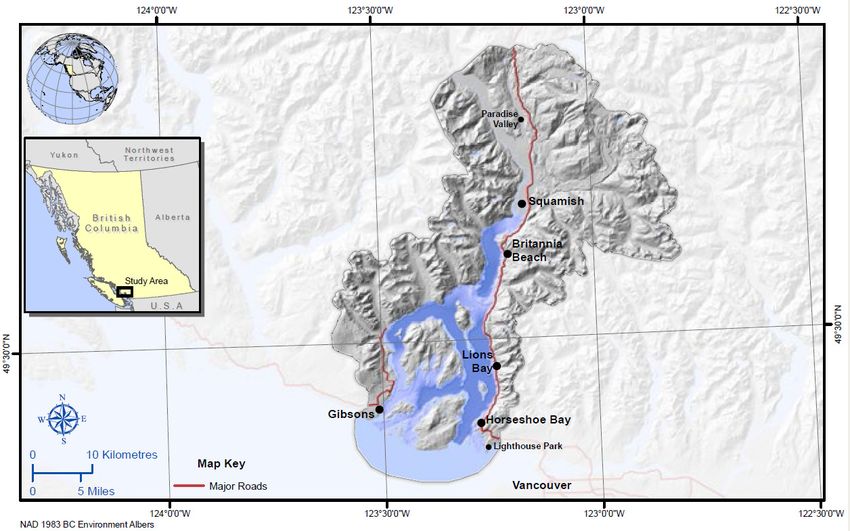
Socio-economic Baseline of the Howe Sound Area

Executive Summary

Introduction

This socio-economic baseline report is prepared in support of Howe Sound marine management
planning. Its purpose is to provide information about community and economic conditions within the
Sound and in adjacent communities.
Demographic, labour force and other socio-economic data were assembled for the region, while a GIS
analysis was undertaken to identify the type and scale of commercial, industrial and residential uses of
Crown land.

Community Profile
The local study area (LSA) includes the municipalities of Bowen Island, Lions Bay, Squamish, Gibsons
and West Vancouver, electoral areas E and F of the Sunshine Coast Regional District and Electoral Area
D of the Squamish Lillooet Regional District. The population of the LSA was approximately 78,760 in
2011, a 6.3% increase over 2006. Over the next 25 years, the LSA is expected to add approximately
20,870 new residents (29.1% increase).
Employment is concentrated in service industries as the manufacturing and resource sectors have
declined over the last two decades. There is a diverse occupational base, although there is a much
higher proportion of arts, culture, recreation and sport occupations when compared to BC. Average
personal and household incomes are relatively high, above the BC average, but there is also a
considerable range of incomes by community.

Economic Activity

The local economic base is varied, with employment and business activity in southern areas integrated
into the Metro Vancouver economy. The Sunshine Coast has a very small but robust tourism sector but
also active forestry and retirement sectors. The Squamish area has a relatively high dependency on
tourism due to the influence of Whistler and a growing list of destination attractions, but like the
Sunshine Coast it still has an important forestry sector due to the timber harvest in the Sea to Sky
Natural Resource District. Wood processing capacity, on the other hand, has declined significantly in
recent decades.
The number of business establishments has been growing steadily, at the same time a shift is
occurring in the types of businesses being established, with fewer primary and manufacturing firms
and more construction, trade and service operations. In 2014, more than one in five establishments
was classified as professional and technical services, which is further evidence of the gradual, but
consistent, transition in the economic base away from goods industries towards service activities.

In terms of major projects, there is a handful of residential developments either proposed or underway
that will drive local population growth in the years ahead. Three industrial projects are proposed,

Lions Gate Consulting                                                                             Page | i
May 2016
Socio-economic Baseline of the Howe Sound Area

BURNCO aggregate at Gibsons, Woodfibre LNG and Box Canyon hydro at Port Mellon, that would have
major implications for the west side of Howe Sound. The other proposed major project, Garibaldi at
Squamish has received its environmental certification but will have to navigate an anticipated lengthy
permitting process before construction is allowed to begin.

General Land Use
The approximate land area of the LSA is 222,000 hectares, 90% of which is Crown land and 9% private.
The province of BC has issued 1,387 Land Act tenures, covering a total of 258,785 hectares. Close to
half of all tenures are for residential use. In terms of land area occupied, environmental, institutional,
industrial and commercial recreation are major uses. Residential and community uses occupy very
little of the Crown land base.
The majority of Crown licences and leases issued authorize commercial and industrial activity.
Licences are primarily used for communications sites and log handling facilities but there are also a
large number of private moorage licences of occupation. Leases are mainly for log handling, marine
activities such as marinas and wharfs, and residential uses. Nine percent of the LSA is in designated
community watersheds, while water licences have been issued to 918 licensees.

The majority of the land area in the LSA is subject to the Sea-to-Sky Land and Resource Management
Plan (LRMP), approved in 2008. The remainder of the land base is in the Sunshine Coast and Chilliwack
natural resource districts, neither of which is subject to an LRMP.

Tourism
The Howe Sound area is renowned for its striking natural beauty and outdoor recreation features,
both marine-based and land-based. The LSA has many facilities and amenities supporting recreation
and tourism, including 30 recreation sites, 53 recreation trails and 14 provincial parks and reserves.
Eighteen percent of the land base is within protected areas. Park attendance has been steadily
growing—in 2014 attendance of 3.4 million was 36% higher than 2005 attendance of 2.5 million.
Sailing, power boating, paddling, diving, fishing, camping, hiking, backpacking, mountain biking, rock-
climbing, bird watching, nature observation and many other outdoor recreation opportunities are
prominent. Eco-tourism is a thriving sector in many communities, particularly Squamish and
Horseshoe Bay.
Howe Sound is a major boating destination with over 300 separate sites for boat havens , marinas,
private yacht clubs, public wharves, strata moorage and private moorage. There are multiple summer
and youth camps hosting thousands of children annually. Angling has been gaining strength as
salmon stocks rebound after a significant fall-off in the 1990s. In 2015, the number of angler days and
fish caught was 25% higher than the decade previous.
Tourism businesses and services are clustered around Gibsons and Squamish, but all communities
host infrastructure, amenities, attractions and services that support a growing tourism economy. The
LSA has approximately fifty accommodation facilities including B&Bs, hotels, motels, resorts and

Lions Gate Consulting                                                                               Page | ii
May 2016
Socio-economic Baseline of the Howe Sound Area

RV/campgrounds. Approximately 35 tour operators offer rental and tour services, featuring wildlife
viewing, fishing tours, bareboat, fishing and skippered charters, as well as cruise-and-learn boat trips
for day use and multi-day outings. Major new attractions like the Sea to Sky Gondola have drawn in
hundreds of thousands of new visitors, many of them international, to complement established
operators like Sewell’s Marina and the Britannia Mine Museum.

Commercial Fishing

Howe Sound is a major source of wild fish stocks, but up until 2014 there had been no commercial
fishery for any finfish. There are numerous closures in Howe Sound, including wild Coho, rockfish and
lingcod and bivalve molluscs, but recovering stocks led to limited fisheries in 2015 and 2016. The
largest commercial fishery in Howe Sound was Shrimp by Trap (64 tonnes in 2015), followed by Crab
by Trap (20 tonnes in 2015) and Shrimp Trawl.

Marine Transportation

Howe Sound is an active marine transportation corridor. In 2015, 12,921 commercial vessels arrived
with BC Ferry traffic and Tugs making up 95% of that traffic. This represents an average of 35 vessels
entering Howe Sound daily throughout the year. Most merchant traffic is associated with the forest
industry and the movement of logs and wood chips from the ports of Squamish and Port Mellon. A
major shipping point is Squamish Terminals’ deep-water, break-bulk facility.
During the most recent two-year period ending in March 31, 2016, 13 marine accidents and incidents
were reported in Howe Sound. Most of these were collision risks (i.e. close calls), machine or systems
failure or bottom contact while berthing. There was one sinking of a tug.

Forestry

Activity in the region’s forest industry has declined markedly over the last two decades due to mill
closures and harvest declines. Port Mellon is now the only major timber processing complex in or near
the LSA. There are some smaller facilities in the area, including AJ Forest Products (Brackendale) and
Terminal Forest Products chipping facility at Langdale.
Timber harvesting and management on Crown land in the LSA is administered by three separate
natural resource districts, Chilliwack, Sea to Sky and Sunshine Coast. Major licensees include Canfor,
Black Mount Logging and Northwest Squamish Forestry.

Utilities and Energy

Numerous utilities transect the LSA, including electric power lines, pipelines, sewer lines, telephone
lines and water lines. Major licensees include BC Hydro (electric lines), Fortis BC (gas lines), Telus
(telephone) and local government (water and sewer lines).
Most of the 1,096 water licences are for domestic (e.g. residential) use, followed by community
waterworks and storage. Two water bottle licences have been issued, one for Ellesmere Creek, across

Lions Gate Consulting                                                                              Page | iii
May 2016
Socio-economic Baseline of the Howe Sound Area

Howe Sound from Furry Creek and another on Powerhouse Creek to Garibaldi Springs Water
Company. There are 15 licences for Power-General use on numerous tributaries across the region. The
largest allocated water volumes are owned by two companies on the Mamquam River, Trans Alta and
the Atlantic Power Corporation.

Aggregates
There are six active sand and gravel sites in the LSA. The Howe Sound area has undeveloped
aggregate deposits with access to tide water. BURNCO Rock Products Ltd. has applied for
environmental certification to construct a sand and gravel pit at McNabb Creek. The project is
proposed to produce 16 million tonnes of sand and gravel with an expected economic life of 16 years.

Lions Gate Consulting                                                                         Page | iv
May 2016
Socio-economic Baseline of the Howe Sound Area

                                                             Table of Contents
Executive Summary ............................................................................................................................... i
1     Introduction ................................................................................................................................... 1
       1.1 Background and Scope................................................................................................................ 1
       1.2 Approach ..................................................................................................................................... 1
       1.3 Study Area ................................................................................................................................... 1
       1.4 Regulatory Setting....................................................................................................................... 2
2     Community Profile......................................................................................................................... 2
      2.1 Demographics ............................................................................................................................. 2
                 2.1.1 Population Projections ..................................................................................................................3
                 2.1.2 Education .......................................................................................................................................4
       2.2     Labour Force ............................................................................................................................... 4
                 2.2.1 Labour Force Trends ......................................................................................................................5
                 2.2.2 Incomes .........................................................................................................................................6
       2.3     Economic Activity ........................................................................................................................ 7
                 2.3.1 Local Area Dependencies ..............................................................................................................7
                 2.3.2 Business Counts .............................................................................................................................8
                 2.3.3 Proposed Major Projects ...............................................................................................................8
3     Land Use and Economic Activity................................................................................................. 10
      3.1 General Land Use ...................................................................................................................... 10
      3.2 Outdoor Recreation and Tourism ............................................................................................. 12
                 3.2.1 Recreation Infrastructure ............................................................................................................12
                 3.2.2 Recreation Activities ....................................................................................................................13
                 3.2.3 Commercial Recreation ...............................................................................................................16
                 3.2.4 Services and Major Attractions ...................................................................................................16
                 3.2.5 Festivals and Events.....................................................................................................................18
       3.3     Commercial Fishing ................................................................................................................... 19
       3.4     Marine Transportation .............................................................................................................. 20
                 3.4.1 Vessel Movements ......................................................................................................................20
                 3.4.2 Marine Incidents and Accidents ..................................................................................................23
       3.5     Forestry ..................................................................................................................................... 25
       3.6     Utilities and Energy ................................................................................................................... 26
       3.7     Aggregates ................................................................................................................................ 28
4     References .................................................................................................................................... 29
      4.1 Literature Cited ......................................................................................................................... 29
      4.2 Personal Communications ....................................................................................................... 31

Lions Gate Consulting                                                                                                                                         Page | v
May 2016
Socio-economic Baseline of the Howe Sound Area
Abbreviations
EA ............................................................................................................................................ Electoral Area
GIS.......................................................................................................Geographic Information System
LRMP ......................................................................................Land and Resource Management Plan
LSA.................................................................................................................................... Local Study Area
MCTS.........................................................................Marine Communications and Traffic Services
MV.................................................................................................................................... Metro Vancouver
OGMAs .............................................................................................. Old Growth Management Areas
RMIC ...........................................................................................Regional Marine Information Centre
RSA ............................................................................................................................ Regional Study Area
SCRD ................................................................................................. Sunshine Coast Regional District
SLRD ............................................................................................. Squamish Lillooet Regional District
SRMP ................................................................................. Sustainable Resource Management Plan
VTRZ ............................................................................................. Vancouver Traffic Regulation Zone
Lions Gate Consulting Page | vi
May 2016Socio-economic Baseline of the Howe Sound Area
1 Introduction
1.1 Background and Scope
This socio-economic baseline report is prepared in support of marine, land and resource planning in
Howe Sound. Its purpose is to provide information about community and economic conditions within
the Sound and in adjacent communities, and to inform discussions between stakeholders about the
need for and benefits of a coordinated multi-agency planning regime.
The content of the baseline was scoped to include those values most likely to be affected by changes
in use of natural resources. The following parameters highlight general community conditions and
activities linked to the land and marine base.
• Demographics
• Labour force
• Economic activity
• General land use
• Tourism and recreation
• Commercial fishing
• Marine transportation
• Forestry
• Utilities and Energy
• Aggregates
1.2 Approach
Demographic, labour force and other socio-economic data were assembled for the study area, using
data requests to government agencies, downloads from government and public agency websites and
a review of labour market and economic development studies and reports. Major information sources
were Fisheries and Oceans Canada, BC Stats and Statistics Canada. A list of source documents is
provided in Chapter 4.
A GIS analysis of Crown tenures and other values was the basis for identifying interests and values on
the land and marine base. Data were obtained from the BC Geographic Warehouse. The GIS results
were useful in identifying industrial, commercial, residential and community activities on Crown land,
which were then profiled in the baseline.
1.3 Study Area
This report is an update to a similar report prepared in 2013; however readers are alerted that the
physical study area has been expanded here to include all of Howe Sound, as shown in Figure 1-1. The
area runs from Lighthouse Park, up the eastern coastline of the sound, past the northern border of
Lions Gate Consulting Page | 1
May 2016Socio-economic Baseline of the Howe Sound Area
Squamish and Paradise Valley, and back down the western coastline to Gibsons. GIS work and all data
attributed to Hillcrest Geographics conforms to this study area.
Demographic and community information is not published for the exact study area shown in Figure
1-1. The closest available administrative geography was used to scope the collection of socio-
economic data—for this baseline, this is defined as the municipalities of Bowen Island, Lions Bay, West
Vancouver, Squamish and Gibsons, as well as electoral areas E and F of the Sunshine Coast Regional
District and Electoral Area D of the Squamish Lillooet Regional District.
1.4 Regulatory Setting
The management, use and protection of land and marine areas is subject to numerous legislative,
statutory and policy instruments, primarily at the provincial level in relation to Crown land and
resources. The provincial government owns most of the foreshore as well as the beds of inland sea
areas such as Howe Sound. Major pieces of legislation are as follows:
• General–Land Act
• Forestry, Range, Public Recreation–Forest Act, Forest and Range Practices Act, Range Act
• Mining–Mineral Tenures Act, Mines Act
• Agriculture–Agriculture Land Reserve Act
• Tourism–Tourism Act
• Trapping and Guide Outfitting–Wildlife Act
There are dozens of other provincial acts that legislate different aspects of resource-related industrial
activity, but the above are primarily responsible for allowing, through licensing (tenure) arrangements
with private-sector companies, development on Crown lands.
The Sea to Sky portion of the of the study area (basically the east side of the Sound north of Lions Bay)
is subject to a government-approved Land and Resource Management Plan (LRMP). It is a higher level
plan that broadly defines land use zones, establishes objectives that guide management of natural
resources, and outlines strategies for achieving those objectives for Crown land. Old Growth
Management Areas (OGMAs) have also been established through the Sunshine Coast, Chilliwack and
Sea to Sky Natural Resource Districts’ Sustainable Resource Management Plans (SRMPs). 1
The federal government has jurisdiction over tidal waters. Through Fisheries and Oceans Canada it is
responsible for managing and protecting fish populations and fish habitat under the Fisheries Act.
Maintenance of maritime safety is through the Coast Guard. Transport Canada is responsible for
preserving the public right of navigation under the Navigable Waters Protection Act. Port Authorities
are also established under federal legislation to manage major harbours and facilities.
1
https://www.for.gov.bc.ca/tasb/slrp/
Lions Gate Consulting Page | 2
May 2016Socio-economic Baseline of the Howe Sound Area Figure 1-1 Physical Study Area Source: David Suzuki Foundation (2015) Lions Gate Consulting Page | 1 May 2016
Socio-economic Baseline of the Howe Sound Area

2 Community Profile

2.1 Demographics
Table 2-1 shows population 6.3% between 2006 and 2011, with the District of Squamish seeing the
largest gain of 20.8%. During this time, the population of BC increased by 7.8% and neighbouring
Metro Vancouver by 11.1%. There is a significant temporary population in Howe Sound attributable to
secondary homes (e.g. cottages and cabins), tourism and the many summer camps that dot the
islands and coastline.

Table 2-1       Population, 2006 and 2011

                                                     2006               2011          Percentage Change
 District of West Vancouver                      42,865                44,125               +2.9%
 Municipality of Bowen Island                     3,470                 3,720               +7.2%
 Village of Lions Bay                             1,405                 1,410               +0.3%
 District of Squamish                            15,495                18,725               +20.8%
 Squamish Lillooet Electoral Area D                840                   835                 -0.6%
 Town of Gibsons                                  4,210                 4,450               +5.7%
 Sunshine Coast Electoral Area E                  3,550                 3,480               +1.9%
 Sunshine Coast Electoral Area F                  2,235                 2,015                -9.8%
Total                                            74,070                78,760               +6.3%
Source: BC Stats (2013a)

Age characteristics outlined in Table 2-2 indicate a noticeably larger share of residents in the over 65
age category when compared to BC, and a corresponding deficit in young adults, that is the 20 to 34
years category.

Table 2-2       LSA and RSA Age Characteristics Compared to British Columbia, 2011

             Local Study Area                Regional Study Area      British
                                                                     Columbia
  19 years and under                        17,220          21.9%    21.6%
  20 years to 34 years                      10,540          13.4%    19.2%
  35 years to 49 years                      15,985          20.3%    21.5%
  50 years to 64 years                      18,760          23.2%    22.0%
  65 years and older                        16,255          20.6%    15.7%
Total                                       78,760          100.0%   100.0%
Source: Statistics Canada (2012)

Lions Gate Consulting                                                                              Page | 2
May 2016
Socio-economic Baseline of the Howe Sound Area
2.1.1 Population Projections
The local population is expected to grow by approximately 22,000 residents or approximately 28%,
between 2011 and 2036. In comparison, the province will see population increase by 29.9% over the
same twenty-five year period.
Table 2-3 Population Projections for LSA and RSA, 2011 to 2036
2011 2021 2031 2036 Percentage
Change
West Vancouver 44,125 46,200 50,555 52,715 +19.5%
Bowen Island 3,720 3,895 4,260 4,440 +19.5%
Lions Bay 1,410 1,475 1,615 1,685 +19.5%
Squamish 18,725 23,180 27,190 29,045 +55.1%
Squamish Lillooet EA D 835 1,035 1,215 1,295 +55.1%
Gibsons 4,450 4,815 5,165 5,290 +18.9%
Sunshine Coast EA E 3,480 3,765 4,040 4,140 +18.9%
Sunshine Coast EA F 2,015 2,180 2,340 2,395 +18.9%
Total 78,760 86,545 96,380 101,005 +28.2%
Source: BC Stats (2013a)
However, as illustrated in Figure 2-1, population growth rates will vary within the region. Growth will
be below the provincial average on the Sunshine Coast and West Vancouver, but will exceed the
average within the Sound itself, particularly the Squamish area.
Figure 2-1 Projected Percentage Change in Population for Study Area and BC, 2016 to 2041
(2011=100%)
150.0%
137.8%
140.0%
130.0% 128.6%
127.7%
120.0%
114.4%
110.0%
100.0%
90.0%
2016
2017
2018
2019
2020
2021
2022
2023
2024
2025
2026
2027
2028
2029
2030
2031
2032
2033
2034
2035
2036
2037
2038
2039
2040
2041
Sunshine Coast Howe Sound West Vancouver BC
Source: BC Stats (2015)
Lions Gate Consulting Page | 3
May 2016Socio-economic Baseline of the Howe Sound Area
2.1.2 Education
Table 2-4 outlines the educational attainment for residents of Howe Sound and BC. There is a
considerably higher proportion of residents with university certificates, diplomas or degrees when
compared to BC. Conversely, the local area has noticeably lower share of its population that has no
certificate, diploma, or degree (including high school diploma) when compared to BC.
Table 2-4 Education Attainment for Total Population over 15 Years, 2011
Industry Howe Sound BC
No certificate; diploma or degree 5,930 10.1% 16.7%
High school certificate or equivalent 14,450 24.5% 27.7%
Apprenticeship or trades certificate or diploma 4,890 8.3% 10.6%
College; CEGEP or non-university certificate or 9,150 15.5% 17.2%
diploma
University cert. or diploma below the bachelor 3,725 6.3% 5.7%
level
University certificate; diploma or degree 20,840 35.3% 22.1%
Total population 15 years and over 54,450 100.0% 100.0%
Source: Statistics Canada (2013)
2.2 Labour Force
Table 2-5 shows the experienced labour force by industry for the LSA, RSA and BC. Employment
among resource industries (e.g., forestry, mining, fishing, agriculture) and manufacturing account for a
much smaller share of total employment in the LSA and RSA than they do for the province. Conversely,
the proportion of employment in Professional, scientific and technical services is higher locally than in
BC.
Table 2-5 Experienced Labour Force by Industry, 2011
Industry Regional Study Area BC
11 Agriculture and other resource-based industries 315 0.9% 2.7%
21 Mining, quarrying and oil and gas extraction 375 1.1% 1.1%
22 Utilities 170 0.5% 0.6%
23 Construction 2,650 7.6% 7.9%
31-33 Manufacturing 1,425 4.1% 6.5%
41 Wholesale trade 1,060 3.0% 3.9%
44 – 45 Retail trade 3,785 10.9% 11.6%
48 – 49 Transportation and warehousing 1,205 3.5% 5.1%
51 Information and cultural industries 1,070 3.1% 2.7%
52 Finance and real estate 1,945 5.6% 4.0%
53 Real estate and rental and leasing 1,760 5.1% 2.4%
Lions Gate Consulting Page | 4
May 2016Socio-economic Baseline of the Howe Sound Area
54 Professional, scientific and technical services 4,420 12.8% 7.8%
55 Management of companies and enterprise 80 0.2% 0.1%
56 Admin and support, waste management remediation 1295 3.7% 4.3%
61 Educational services 2,765 8.0% 7.3%
62 Health care and social services 3,395 9.8% 10.8%
71 Arts, entertainment and recreation 1,335 3.8% 2.5%
72 Accommodation and food services 2,530 7.3% 7.8%
81 Other services 1,475 4.2% 4.9%
91 Public administration 1,665 4.8% 6.2%
Total experienced labour force 15 years and over 34,720 100.0% 100.0%
Source: Statistics Canada (2013)
Note: The LSA includes Bowen Island, Lions Bay and Sunshine Coast Electoral Area F while the RSA includes: Squamish, Gibsons, West
Vancouver, Sunshine Coast EA E and Squamish-Lillooet EA D.
Table 2-6 shows occupations for the experienced labour force in the LSA, RSA and BC. Compared to
the RSA and BC, the LSA has higher proportions of art, culture, recreation and sport occupations and
lower proportions of business, finance and administration occupations.
Table 2-6 Experienced Labour Force by Occupation, 2011
Occupation Local Study Area Regional Study BC
Area
0 Management occupations 535 14.3% 5,845 16.8% 10.5%
1. Business; finance and administration occupations 445 11.9% 5,695 16.4% 17.1%
2. Natural and applied sciences and related occupations 485 13.0% 2,435 7.0% 6.3%
3. Health occupations 200 5.4% 2,365 6.8% 5.5%
4. Occupations in education; law and social, community 620 16.6% 4,455 12.8% 8.1%
and government services
5. Occupations in art; culture; recreation and sport 385 10.3% 1,745 5.0% 3.5%
6. Sales and service occupations 530 14.2% 7,605 22.0% 25.4%
7. Trades; transport and equipment operators and 390 10.5% 3,575 10.3% 15.5%
related occupations
8. Natural resources, agriculture and related production 55 1.5% 545 1.6% 3.9%
occupations
9. Occupations in manufacturing and utilities 85 2.3% 450 1.3% 4.2%
Total experienced labour force 15 years and over 3,730 100.0% 34,715 100.0% 100.0%
Source: Statistics Canada (2013)
Note: The LSA includes Bowen Island, Lions Bay and Sunshine Coast Electoral Area F while the RSA includes: Squamish, Gibsons, West
Vancouver, Sunshine Coast EA E and Squamish-Lillooet EA D.
2.2.1 Labour Force Trends
The labour force in the LSA and RSA have gradually but consistently shifted to a service base from a
goods base over the last two decades. In 2006 one in five workers in the LSA were employed in goods
production, versus close to one in three in 1986. The decline of goods employment is a trend being
Lions Gate Consulting Page | 5
May 2016Socio-economic Baseline of the Howe Sound Area
experienced by most industrialized, western nations due to globalization, competition from emerging
markets and the increasing adoption of technology, particularly computer systems and the Internet.
The BC economy, and many of its communities, was built around the exploitation of extractive
resources whose economic rents allowed companies to prosper, gave workers relatively high wages
and helped grow communities. Increased worldwide production, increased business costs,
substitution effects and other competitive drivers eventually eliminated those rents and the
competitive advantage producers used to benefit from. In BC, the agriculture, wild commercial
fisheries and forest sectors all experienced this transition and are no longer able to provide the tax,
employment, income and other economic benefits they once did. This decline has equally affected the
regional economy.
In contrast to primary and manufacturing industries, service industries and occupations that rely on
intellectual, technical and human resource capital are growing in importance in the LSA and RSA. Film,
movie and TV productions are an example of a growth service industry. In 2006, film accounted for
approximately 1% of the region’s economic base and indirectly contributes to the development of
other industries such as tourism. The expansion of the knowledge-led economy is also evident in the
regional labour force data. The proportion of the labour force employed in business services, natural,
applied and social sciences, and arts and culture, is much higher than it is for BC. Much of this labour
force has been attracted to the region because of quality of life factors, including low crime rates,
access to education and health services, diverse retail, personal and business service capacity, cultural
vibrancy, a healthy tourism sector, efficient transportation systems and an attractive, clean
environment.
2.2.2 Incomes
As seen in Table 2-7, personal incomes vary considerably among communities. Incomes in Lions Bay
are among the highest in BC, followed closely by West Vancouver and Bowen Island.
Table 2-7 Personal Income by Jurisdiction, 2009
Total Taxfilers Median Income Median Income
Provincial Index
Males Females Males Females Males Females
West Vancouver 15,940 19,050 49,855 33,655 1.37 1.40
Bowen Island 1,180 1,250 46,405 28,235 1.27 1.18
Lions Bay 490 500 53,150 36,800 1.46 1.53
Squamish 6,170 6,200 42,0390 25,725 1.16 1.07
Squamish Lillooet EA D 180 180 45,280 25,360 1.24 1.06
Gibsons 3,700 4,190 36,120 24,350 0.99 1.01
Sunshine Coast EA E n/a n/a n/a n/a n/a n/a
Sunshine Coast EA F 20 10 27,770 16,005 0.76 0.67
Source: BC Stats (2011)
Lions Gate Consulting Page | 6
May 2016Socio-economic Baseline of the Howe Sound Area
2.3 Economic Activity
2.3.1 Local Area Dependencies
Local area dependencies prepared by BC Stats for the Sunshine Coast and Squamish areas are show in
Table 2-8. The data identify and quantify the sources of income that support the local economies in
both areas. The profiles differ primarily in their dependency on tourism, which tends to be very high in
Squamish and less so on the Sunshine Coast. Forestry has diminished considerably in the Squamish
area since 1991 due to mill closures. These data are no longer being produced by BC Stats so update
tables for the 2011 and 2016 census years are not available.
Table 2-8 Percentage of Income by Economic Base Sector, 1991 to 2006
FOR MIN F&T AGF TOU PUB OTH TRAN ONEI
Squamish
2006 5 1 0 1 27 20 23 8 14
2001 12 1 0 0 29 21 20 9 7
1996 14 0 0 1 25 20 23 9 7
1991 15 2 0 1 14 17 26 12 13
Sunshine Coast
2006 14 2 1 1 3 20 17 18 22
2001 19 1 2 1 5 21 11 20 19
1996 20 2 2 1 5 19 14 19 19
1991 20 2 4 1 4 14 15 11 30
Source: Horne (2009)
Notes:
FOR – Forestry and related manufacturing, MIN – Mining, oil and gas, F&T – Fishing and trapping, AGF – Agriculture and food processing,
TOU – Tourism, PUB – Public sector including health and education, OTH – All other basic industries, TRAN – Transfer payments from
government, ONEI – Other non-employment income
Lions Gate Consulting Page | 7
May 2016Socio-economic Baseline of the Howe Sound Area
2.3.2 Business Counts
The number of businesses operating in the Howe Sound area in 2014 is presented in Figure 2-2. Close
to one quarter of all businesses are in professional and technical services, followed by finance, real
estate and leasing, transportation services, then construction.
Figure 2-2 Percentage Share of Business Location Counts by Major Industry, December 2014
Source: Statistics Canada (2015)
Note: Pri primary, Con construction, Man manufacturing, Tra trade, Tran transportation, Inf information and culture, Fir finance, real estate
and leasing, Pro professional and technical, Edu education, Hea health, Tou tourism, Oth other business and personal services, Pub
public administration
2.3.3 Proposed Major Projects
The Ministry of Jobs, Tourism and Skills Training (MJTST) tracks major development projects in the
province. The latest results, shown in Table 2-9, indicate only one major project (BURNCO) within the
LSA, although there are several major projects, including residential developments in Furry Creek and
Squamish and the Box Canyon Hydroelectric Project at Port Mellon, that are in close proximity.
It is noted that since the publication date of the major projects inventory, two projects, Garibaldi at
Squamish and Woodfibre LNG have each received environmental assessment process certification. On
January 26, 2016, Garibaldi at Squamish was given an Environmental Assessment certificate although
a considerable amount of permitting still has to be undertaken, including approval of a Master Plan by
the Mountain Resorts Branch. The project also does not conform to the Regional District’s Regional
Growth Strategy and will have to negotiate with the Regional District or Squamish (in the event a
boundary expansion is sought) for local government approval (BC Environmental Assessment Office
2016).
Woodfibre LNG received their certificate in October, 2015. The LNG facility includes various areas and
infrastructure, including:
Lions Gate Consulting Page | 8
May 2016Socio-economic Baseline of the Howe Sound Area
• Two LNG processing or production units;
• Floating storage and offloading unit, including mooring and marine terminal for carriers,
consisting of two converted LNG carriers
• A condensate storage tank;
• A seawater cooling system;
• Wastewater treatment facilities; and
• Flare systems, with a flare derrick (BC Environmental Assessment Office 2015)
Table 2-9 Major Projects in the Study Area, 2016
Location Project and Description Estimated Timing
Investment
($ millions) Start Finish
Construction Started
Furry Creek Furry Creek Recreation/Residential Project n/a 1999 n/a
Squamish Cheakamus Unit 1 and Unit 2 Generator Replacement 74 2014 2019
Eaglewind Master Planned Community 80 2006 n/a
Culliton Creek Power Project 45 2014 n/a
West Vancouver Rodgers Creek Development 120 2013 n/a
The Village at Park Royal Expansion 20 2012 n/a
Residential Development on Evelyn Drive 30 2012 n/a
Proposed
Gibsons BURNCO Aggregate Project 60 n/a n/a
Port Mellon Box Canyon Hydroelectric Project 61 n/a n/a
Squamish Britannia South Mixed-use Development 1,000 n/a 2026
Squamish Oceanfront Development n/a n/a n/a
Garibaldi at Squamish Ski Resort 3,500 2018 2040
Woodfibre LNG 1,600 n/a 2018
West Vancouver Cypress Mountain Village n/a n/a n/a
Ambleside Condominium Development 20 n/a 2017
Construction On Hold
Furry Creek Porteau Cove Residential Development 200 n/a n/a
Squamish Waterfront Landing Residential Development 350 n/a n/a
The Sustainability Block Condominiums 150 n/a n/a
Source: BC MJTST (2015)
Note:
n/a – data not available
Lions Gate Consulting Page | 9
May 2016Socio-economic Baseline of the Howe Sound Area
3 Land Use and Economic Activity
Major land uses and their associated economic activity are described in the following paragraphs.
3.1 General Land Use
The approximate distribution of land by ownership in the LSA is presented in Table 3-1. Crown land,
including Indian Reserves, account for 91% of the total area of 222,053 hectares. The remainder is
private land.
Table 3-1 Crown and Private Land Area in the LSA, 2016
Hectares % of
Total
Indian Reserves 1,867 0.8%
Crown 200,468 90.3%
Private 19,718 8.9%
Grand total 222,053 100.0%
Source: Hillcrest (2016)
Table 3-2 shows land act tenures in the LSA as of 2013. A total of 1,387 tenures cover a gross area of
258,875 hectares. Residential, industrial and utility uses account for more than two-thirds of all
tenures. In terms of land area occupied, environmental, institutional and commercial recreation are
major uses. Residential and community uses occupy very little of the Crown land base in the LSA.
Table 3-2 Land Act Tenures in the LSA by Main Purpose, 2016
Tenure Purpose Count Hectares
Alpine Skiing 2 5,495
Commercial 50 826
Commercial Recreation 61 90,597
Communication 67 99
Community 7 33
Energy Production 2 0
Environment, Conservation, & Recreation 65 74,137
First Nations 8 3,421
Industrial 113 1,115
Institutional 53 60,421
Miscellaneous Land Uses 21 6,169
Quarrying 29 486
Residential 601 485
Transportation 37 73
Utility 229 4,768
Waterpower 42 10,660
Grand total 1,387 258,785
Source: Hillcrest (2016)
Note: Most tenures are not for exclusive use of the land base and thus will overlap.
Lions Gate Consulting Page | 10
May 2016Socio-economic Baseline of the Howe Sound Area
Table 3-3 shows the major tenure types in the LSA. A lease is issued where long term tenure is
required and/or where substantial improvements are proposed. A licence conveys fewer rights than a
lease as it gives non-exclusive use for the purpose described. A statutory right-of-way (ROW) is used to
authorize linear uses of Crown land for transportation, communication, energy production and utility
developments. The Crown also issues a range of other administrative instruments such as reserves and
notations of interest for the optimal management and use of Crown land by government.
The majority of licences and leases in the LSA authorize commercial and industrial activity. The 371
licences are primarily used for communications sites and log handling facilities but there are also a
large number of private moorage licences of occupation. The 351 leases are mainly for recreation
residential, log handling, and marine activities such as marinas and wharfs.
Table 3-3 Land Act Tenures in the LSA by Tenure Type, 2016
Tenure Typea Count Hectaresb
Crown Grant 17 217
Inventory 76 339
Lease 351 62,131
Licence 371 94,501
Permission 207 20
Permit 12 131
Reserve/Notation 112 98,233
Right-of-way 237 3,196
Transfer of Administration/Control 4 18
Grand Total 1,387 258,785
Source: Hillcrest (2016)
Notes: a Does not include applications for tenure
b Tenures overlap so sum of areas will exceed gross crown land that is tenured
Other land use indicators are shown in Table 3-4, and include a very small area of Agricultural Land
Reserve, but significant authorizations for water licences and community watersheds. Water licences
are points of diversion that allow a licensee to divert or withdraw water from a stream or water body.
The community watersheds are for small, unincorporated communities and rural neighbourhoods and
authorized under the Water Act by the Comptroller of Water Rights.
Table 3-4 Other Land Use Indicators in the LSA, 2016
Indicator Count Hectares
Agricultural Land Reserve n/a 4,125
Water Licencesa 918 n/a
Community Watersheds 31 20,355
Source: Hillcrest (2016)
Notes: n/a not applicable
a Includes current, pending and active applications
Lions Gate Consulting Page | 11
May 2016Socio-economic Baseline of the Howe Sound Area
The management of the crown forest in the LSA is subject to one sub-regional plan. A major part of
the LSA is subject to the Sea-to-Sky Land and Resource Management Plan, approved in 2008. The
western reaches of the LSA is part of the Sunshine Coast Timber Supply Area, which does not have a
provincial government approved land use plan, although protected areas that have established
resource management objectives are set forth in legal designations for community watersheds,
landscape-level biodiversity (old forest retention), identified wildlife, ungulate winter ranges, First
Nations archaeological sites, scenic areas and other values (MFLNRO 2012). The Howe Landscape Unit
Plan of the Sunshine Coast SRMP also prescribes some land uses in the LSA.
3.2 Outdoor Recreation and Tourism
Outdoor recreation refers to activities in the outdoors undertaken by residents. Tourism refers to
activities undertaken by a person (i.e. a tourist) who travels to, or stays at, a place outside his/her usual
environment either for business or for pleasure. Howe Sound provides exceptional opportunities for
nature-based recreation and tourism.
3.2.1 Recreation Infrastructure
The Study Area is renowned for its striking natural beauty and outdoor recreation features, both
marine-based and land-based. Major features on the Crown land base in the LSA are shown in Table
3-5. The 30 recreation sites, 53 recreation trails and 15 parks and protected areas host thousands of
visitors annually and are a major destination for residents of the Lower Mainland.
Table 3-5 Recreation Sites, Trails and Parks in the LSA, 2016
Feature Count Hectares
Recreation Sites 30 2,768
Sea to Sky Natural Resource District 21 1,087
Sunshine Coast Natural Resource District 7 806
Chilliwack Natural Resource District a n/a 875
Recreation Trails 53 350
Sea to Sky Natural Resource District 42 295
Sunshine Coast Natural Resource District 10 34
Chilliwack Natural Resource District 1 21
Protected Areas 15 39,635
Provincial Parks Class A 14 39,633
Protected Area (Stawamus Chief) 1 2
Source: Hillcrest (2016)
Notes: Does not include Crippen Regional Park
a pending sites
Park attendance for the 2004 to 2014 period is shown in Table 3-6. Attendance for individual parks
often varies year to year due mainly to weather, which can be a key demand driver for day, overnight
and boat use on the southern coast of BC. Aggregate attendance, however, appears on the upswing,
Lions Gate Consulting Page | 12
May 2016Socio-economic Baseline of the Howe Sound Area
notably for parks on or near Highway 99, those being Porteau Cove, Murrin, Shannon Falls, Stawamus
Chief, and Alice Lake. Trail and recreation site use is not formally tracked so attendance trends at those
facilities are unknown.
Table 3-6 Provincial Park Attendance, 2004-2014
Park 2004/05 2005/06 2006/07 2007/08 2008/09 2009/10 2010/11 2011/12 2012/13 2013/14
Alice Lake Park 292,507 270,860 303,369 294,619 293,226 362,130 266,172 331,652 396,960 413,954
Cypress Park 928,428 1,102,539 1,307,219 1,286,926 1,346,583 1,138,379 1,338,789 1,383,130 1,443,162 1,415,033
Garibaldi Park 74,531 85,101 89,129 101,539 103,849 105,361 69,569 75,501 87,489 97,151
Halkett Bay Park 1,277 - - 355 230 438 234 413 286 133
Murrin Park 141,628 134,239 155,425 134,876 206,423 113,684 109,396 120,309 190,967 181,479
Plumper Cove Marine Park 14,159 6,909 11,186 7,722 8,312 10,561 9,245 14,119 11,003 14,667
Porteau Cove Park 321,695 302,024 356,067 392,513 427,337 405,395 483,458 385,542 547,899 527,884
Shannon Falls Park 412,216 218,407 243,359 144,498 123,753 199,563 277,225 190,151 393,322 427,979
Smuggler Cove Marine 17,633 22,036 14,578 21,109 17,290 12,821 18,613 18,313 11,181 29,295
Park
Stawamus Chief Park 283,261 290,795 447,467 364,199 400,779 203,663 251,423 175,972 268,956 332,058
Tetrahedron Park 3,059 1,078 1,715 2,174 1,582 1,967 1,964 1,412 830 763
Total 2,490,394 2,433,988 2,929,514 2,750,530 2,929,364 2,553,962 2,826,088 2,696,514 3,352,055 3,440,396
Source: BC Parks (2015)
Note: Includes day, camping and boating use
3.2.2 Recreation Activities
Howe Sound is noted for its sailing, power boating, paddling, diving, fishing, camping, hiking,
backpacking, mountain biking, rock-climbing, bird watching, nature observation and many other
outdoor recreation opportunities. The District of Squamish has billed itself as the Outdoor Recreation
Capital of Canada due its outstanding natural features, accessible play areas and diverse winter-
summer, water-land recreation opportunities. Eco-tourism is a thriving sector in the community.
Angling
Recreational angling continues to be a popular leisure activity in Howe Sound, supporting numerous
service businesses, including rentals, charters, food and beverage and accommodation. As seen in
Figure 3-1, more than 9,000 days of effort were expended in the area, resulting in a harvest of
approximately 8,500 fish. Activity tends to fluctuate because of weather, run strength, closures and
limits but has been particularly strong over the last five years when compared to the previous five year
period. More than three quarters of the angling harvest is salmon, led by Pink, Coho and Chinook.
Lions Gate Consulting Page | 13
May 2016Socio-economic Baseline of the Howe Sound Area
Flounder and sole make up another 16% of the catch. The catch of other ground species is limited due
mainly to closures.
Figure 3-1 Angling Effort, Fish Kept & Released for Area 28, Sub-areas 1-9, 2004-2015
Source: DFO (2016a)
Notes: Pacific Fishery Management Area (PMFA) 28, sub-areas 1-9, includes Howe Sound and English Bay between Point Atkinson and
Lions Gate Bridge.
Boating
The area is a major boating destination with 392 separate tenures for boat havens (3), marinas (25),
private yacht clubs (5), wharves (12), strata moorage (12) and the remainder private moorage. The
Thunderbird and Burrard yacht clubs have outstations on Gambier Island at Ekins Point, while Royal
Vancouver and West Vancouver yacht clubs have outstations at Centre Bay.
Howe Sound is expanding its non-motorized boating potential through the BC Marine Trails Network,
which is a network of marine paths that span 27,000 km of the BC coastline. The network consists of
rest stops, safe havens, campsites, or launch sites up and down the coast. The BC shoreline, which is
largely Crown land, is in high-demand due to commercial and private pressures. Though it is law that
shore below high tide line cannot be privately owned, much of it is in highly populated areas along
the coast, making it difficult for paddlers to access land that can be used as a rest area or for camping.
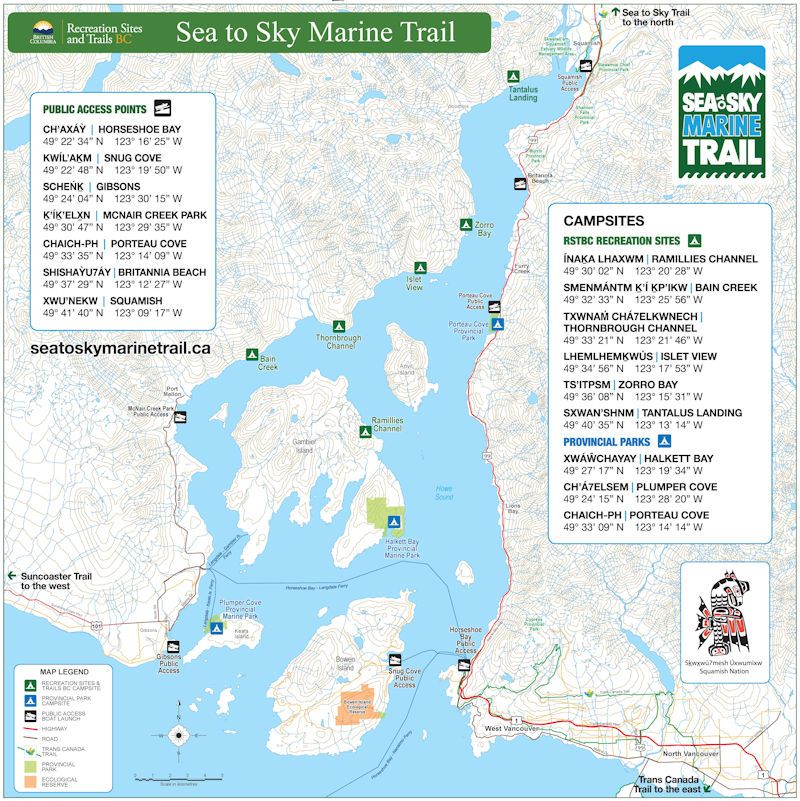
The Sea to Sky Marine Trail (Figure 3-1), officially opened in June 2015, is part of the BC Marine Trails
Network, but it also forms part of the Trans Canada Trail. The trail links six new campsites, several
access points to the trail, new signage, three existing provincial parks and a regional park for an
across-the-sound visitor experience (BC Marine Trails 2016).
Lions Gate Consulting Page | 14
May 2016Socio-economic Baseline of the Howe Sound Area Figure 3-2 Sea to Sky Marine Trail Source: BC Marine Trails Network (2016) Trails Trail-based activities such as hiking, backpacking, trail riding and mountain biking are a major contributor to the region’s recreation and tourism industry. In 2006, mountain biking in the Sea to Sky corridor generated $10.3 million in expenditures, $9.3 million in GDP and over 194 jobs (Mountain Bike Tourism Association 2007). Although studies of other trail activities have not been undertaken, they are believed to generate similar levels of use and economic activity. The Sea-to-Sky corridor has more than 700 km of recreation trails, 77% of which are Crown land. For the most part, local clubs, groups, or individuals maintain these trails. A dramatic increase in the number of trails and trail use is due to the popularity of cycling in the corridor, which in turn has resulted in a growing list of liability, user conflict, maintenance and management issues. The popularity of the region for trail activities was the impetus behind the creation of the Sea to Sky Lions Gate Consulting Page | 15 May 2016
Socio-economic Baseline of the Howe Sound Area

Corridor Recreation Trail Strategy (Sea to Sky Corridor Recreation Trail Strategy 2007), which continues
to be implemented.

Education
There are multiple summer and youth camps in the LSA, hosting thousands of children annually.
These include Firefly camp (Fireside Adventures), Camp Potlatch (Boys and Girls Club of South Coast
BC), the “Counting on Howe Sound” experiential learning program operated by the Vancouver
Aquarium, Camp Fircom (United Church), Camp Latona and Camp Elphinstone (YMCA) (Upland
Consulting 2013). The Sea to Sky Outdoor School offers structured sustainability learning programs to
over 2,000 students and adults annually.

3.2.3      Commercial Recreation
Table 3-7 shows licensed commercial recreation tenures in the LSA. The licensed territory of one guide
outfitter covers 42% of the LSA, while 24 trap lines cover two-thirds. The heli-ski tenures owned by
Black Tusk Helicopters of Squamish has portions of its heli-ski licence area in the northern extent of
the LSA. The community outdoor recreation tenures are mainly for summer camps. Guided freshwater,
saltwater and mountaineering licensees provide a sense of the diversity of recreation opportunities in
the LSA.

Table 3-7        Licensed Commercial Recreation on Crown Land in the LSA, 2016

                           Feature               Count      Hectares
Guide Outfitting Area                                1        92,420
Limited Entry Hunting Zones                          7        85,450
Trap lines                                          24       141,135
Commercial Recreation Tenures                       61        90,597
  Heli-ski                                           7        55,423
  Community Outdoor Recreation                       6            59
  Guided Freshwater Recreation                       9         4,523
  Guided Mountaineering/Rockclimbing                 4         3,457
  Guided Saltwater Recreation                        4        13,556
  Other                                             31        13,580
Source: Hillcrest (2016)

3.2.4      Services and Major Attractions

There are many tourism businesses and services within Howe Sound, with Horseshoe Bay, Gibsons and
Squamish having sizable clusters. Hellobc.com shows approximately 50 accommodation facilities
clustered around the LSA, 25 of which are B&Bs, 12 hotels and motels, 10 resorts and three RV facilities.
Approximately 35 tour operators offer rental and tour services in and around Howe Sound for
kayaking, fishing, boat tours, horseback riding, mountain biking, mountaineering, rafting, kite
boarding and general eco-tours. Major Vancouver-based operators such as Harbour Air, LandSea

Lions Gate Consulting                                                                            Page | 16
May 2016
Socio-economic Baseline of the Howe Sound Area
Tours and Adventures and Coastal Pacific Tours provide a variety of land/sea/air tours throughout
Howe Sound. The six area golf courses are anchored by the popular Furry Creek Golf and Country
Club. Charter operations in Horseshoe Bay, Gibsons, Squamish and Vancouver offer rentals, bareboat
charters and skippered charters, as well as cruise-and-learn boat trips for day use and multi-day
outings.
Major attractions include:
• Sea to Sky Gondola. The Sea to Sky Gondola opened in 2014. An 8-minute gondola ride to
over 885 metres above sea level offers sweeping views of Howe Sound, the forest &
surrounding mountains. At the top there is access to two interpretive loop trails, a suspension
bridge, and backcountry trails. The lodge provides the opportunity for cultural exhibits, events
and dining. Attendance in 2015 was in the range of 300,000, well ahead of projections, and
2016 is expected by better that by 30% (Dunn 2016, pers. comm.). What is surprising is that
close to half of all visitors are from outside BC which is a clear indication of the popularity of
not just the Gondola but of Howe Sound itself.
• Sewell’s Marina. In operation since 1931, Sewell’s Marina has served visitors to the Howe
Sound through fishing charters, Sea Safari Eco Tours, rentals and moorage. Moorage is fully
allocated and fishing charters and rentals has been growing in recent years as local salmon
stocks rebuild. The Eco Tours, which focus on the marine environment, were first offered in
1997 and have steadily developed over the years, with more and more international visitors
attracted by a vibrant, quality marine environment so close to a major metropolitan area. The
proximity to many different species of wildlife, including whales and dolphins, is a major draw
for visitors. Sewell’s can employ as many as 50 workers during the peak summer season.
(Sewell 2016, pers. comm.)
• Britannia Mine Museum. The Britannia Mine Museum is part of the Britannia National Historic
Site, established by Parks Canada in 1987. The museum oversees 23 historic industrial,
administrative and domestic buildings, and thousands of artifacts, archive photos, archival
documents and maps. The site is also a popular film set, having hosted many feature films and
TV productions. Attendance in 2015 was approximately 74,000, an increase of 8% over 2014.
More than one in six visitors are international. Admission revenues were over $1million in
2015, a three-fold increase since 2010. The museum receives high marks from Trip Advisor and
other travel media (Katherine Flett 2016, pers. comm.)
• Sea to Sky Corridor. The Sea to Sky corridor as a marketable concept is something that didn’t
exist 20 years ago but which, because the 2010 Winter Olympics especially, and the combined
effects of the development and marketing of many different experiences locally, has emerged
as a destination in and of itself. So, for example, when the New York Times featured Squamish
and the Sea to Sky Gondola in its “52 Place to Go in 2015” one of the calling cards was the
draw of “an unusual combination of West Coast wilderness and accessibility” (New York Times
2015). Similarly, when CNN named Squamish as the best mountain town to visit in 2014, it was
because “the Squamish area, ...was becoming a destination in its own right” (Ipick 2014).
Millions of visitors are travelling to and through Howe Sound annually and account for tens of
Lions Gate Consulting Page | 17
May 2016Socio-economic Baseline of the Howe Sound Area
millions in spending that accrue to local businesses and communities. As previously noted in
Table 2-8, the region is the only one in BC where the economic base is dominated by tourism.
3.2.5 Festivals and Events
Festivals and events regularly draw thousands of attendees to Howe Sound communities every year.
Outdoor recreation and arts/culture themes predominate, and the many road and mountain bike
races have international attendees.
Table 3-8 Major Festivals and Events in the Howe Sound Area
Annual Howe Sound Herring Festival Family
ARC'TERYX Climbing Academy Outdoor recreation
BC Bike Race Outdoor recreation
Cheakamus Centre 47th Annual Open House Family
Conscious Goddess Festival Lifestyle
Dancing Bear Music Festival Arts and culture
Gibsons Landing Jazz Festival Arts and culture
Gibsons Sea Cavalcade Family
Howe Sound Music Festival Arts and culture
International Howe Sound Outrigger Race Outdoor recreation
Just Another Bike Race (JABR) Outdoor recreation
Loop the Lakes Trail Race Outdoor recreation
Ore Crusher Outdoor recreation
RBC GranFondo (Whistler) Outdoor recreation
Rogue Arts Festival Visual and performing arts
'Round Bowen Challenge Outdoor recreation
Sea to Sky Scramble Trail Run Outdoor recreation
Squamish 50 Outdoor recreation
Squamish ArtCrawl Arts and culture
Squamish Beer Festival Lifestyle
Squamish Days Arts and culture
Squamish Gear Jammer Outdoor recreation
Squamish Wind Festival Outdoor recreation
Squamish Youth Triathlon Outdoor recreation
Sunshine Coast Festival of the Performing Arts Arts and culture
Test of Metal Outdoor recreation
West Coast Yoga Festival Lifestyle
Lions Gate Consulting Page | 18
May 2016You can also read