Participation, catches and economic impact of sea anglers resident in the UK in 2016 & 2017 - Gov.uk
←
→
Page content transcription
If your browser does not render page correctly, please read the page content below
World Class Science for the Marine and Freshwater Environment

Participation, catches and economic
impact of sea anglers resident in the
UK in 2016 & 2017
Final report of the Sea Angling 2016 and 2017 project
Author(s): Kieran Hyder1, Adam Brown2, Mike Armstrong1, Brigid Bell2, Kirsty Bradley1, Elena
Couce1, Iain Gibson3, Francesca Hardman3, James Harrison2, Vanessa Haves2, Samantha
Hook2, Jo Kroese4, Gavin Mellor2, Eleanor MacLeod1, Angela Muench1, Zachary Radford1, and
Bryony Townhill1
1
  Cefas, Pakefield Road, Lowestoft, Suffolk NR33 0HT, UK
2
  Substance, Canada House, 3 Chepstow St, Manchester M1 5FW, UK
3
  The Nursery Research & Planning, 3 – 5 Rathbone Place, London W1T 1HJ, UK
4
  Constructive Data, Spuistraat 139F, Amsterdam 1012 SV, Netherlands

Issue Date: 3 July 2020
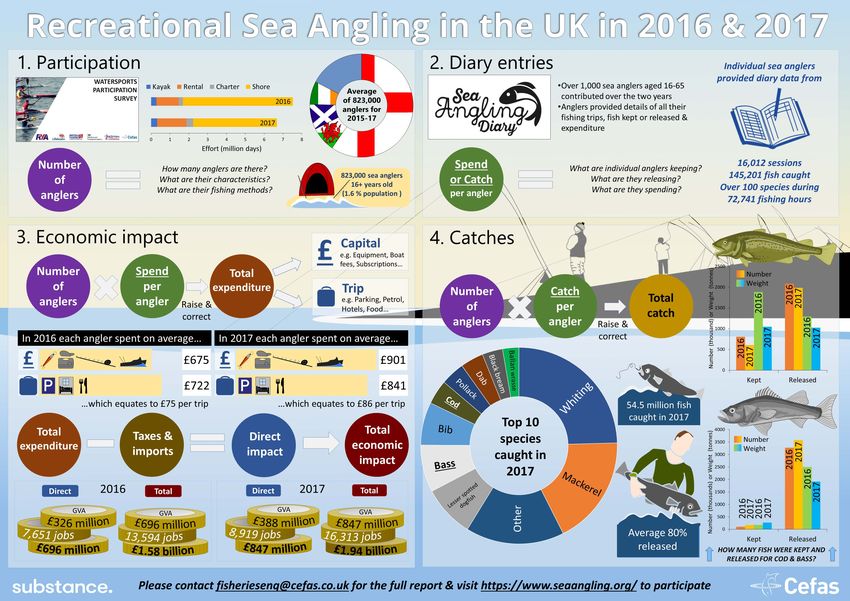
Graphical summary

Sea Angling in the UK in 2016 & 2017   Page 2 of 39

Executive Summary
Sea angling is a popular activity in the
UK that has social and economic
benefits, and catches can be
significant. Data on participation,
catch and economic value of sea
angling are needed by government
and stakeholders to support well-
informed decisions and sustainable
management of fisheries. As part of
our statutory monitoring obligations
to Europe, the UK must report annual
catches of recreational sea fishing. Following from “Sea Angling 2012” survey in England, a revised
monitoring programme with new methods was tested in 2015 and expanded in 2016 and 2017 to
estimate numbers of UK sea anglers, how often they fish, what they catch and how much they spend
on their sport (Box 1).
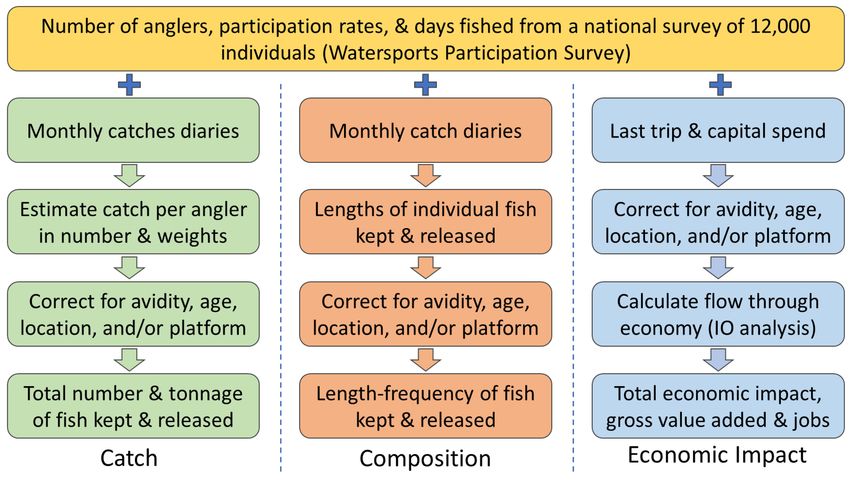
To obtain these estimates, the outputs from two
separate survey methods were combined. Firstly,
an existing survey of 12000 UK residents
(Watersports Participation Survey - WPS) was
extended to estimate fishing effort in terms of how
many people went recreational sea fishing, and the
number of days on which they fished from the
shore or from different types of boats. On average,
823000 UK residents aged 16 years or older went
sea angling in the years 2015 -2017, representing a participation rate of 1.6%, and in total they fished
on 7.0 million days (Box 2). Numbers of sea anglers were greatest in England, and within England were
largest in the South West. The participation rates and days fished for Wales, Scotland and Northern
Ireland were uncertain due to small numbers of sea anglers interviewed in these regions.
The second of the two annual surveys was designed to estimate the average catch per day by sea
anglers each year. A nationwide panel of sea anglers was recruited to complete a diary recording all
their marine recreational angling activities, catches
and spend during the year (www.seaangling.org). A
total of 476 diarists in 2016 and 1 495 in 2017 signed
up, but not all provided the minimum of six months
of data needed for them to be included in the
analysis. In 2016, 292 anglers meeting this threshold
caught 45874 fish from 3824 day-sessions, and 639
anglers caught 76510 fish from 7353 sessions in 2017.
The outputs from the WPS survey and diary panel
were combined to estimate total UK catches, after
Sea Angling in the UK in 2016 & 2017 Page 3 of 39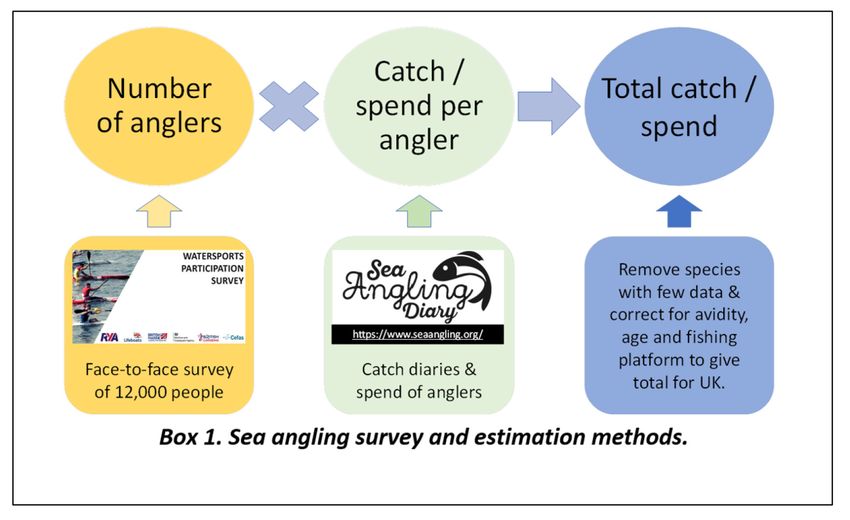
correcting for differences in frequency of fishing
(avidity), age, and type of fishing (shore, boat) between
the diary sample and the UK WPS sample. In total, 100
different fish species were caught by sea anglers in the
UK in 2016 and 2017. Sufficient data were available to
provide raised estimates of total UK numbers caught for
68 individual species and tonnage for 32 species. For the
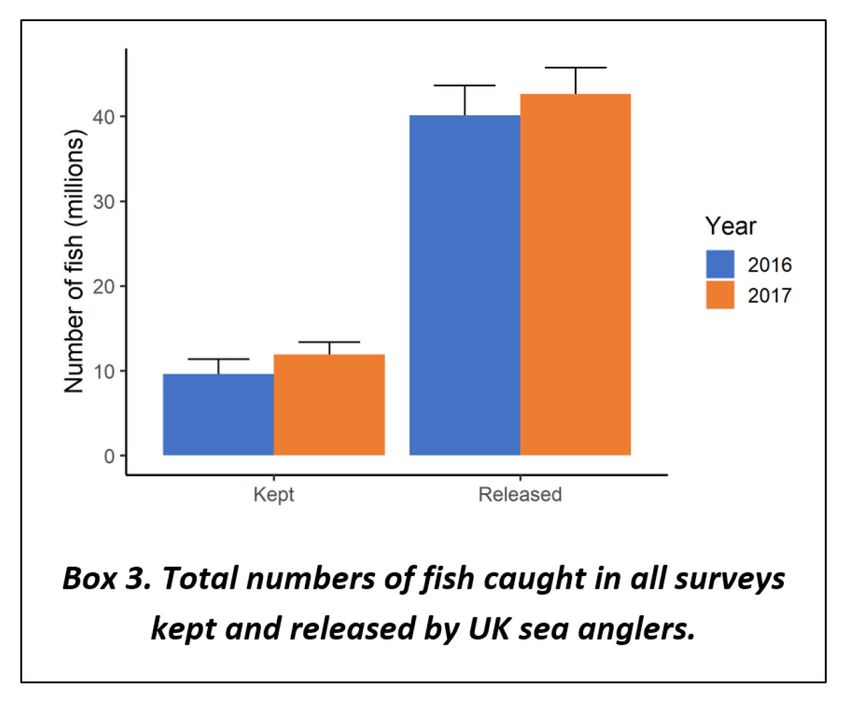
68 species raised, the total number of fish kept and
released for the whole UK was 49.7 million in 2016 and
54.5 million in 2017 (Box 3) with release rates of 80%.
The species composition of the catch was similar in 2016
and 2017, and the four most common species were
whiting, mackerel, dogfish, and bass (Box 4).
At intervals in the year, diarists provided data on expenditure on capital (major) items and a
breakdown of spend on their most recent sea angling day trip, allowing estimation of the total
economic impact and jobs supported by sea angling in the UK. The total expenditure estimate per
adult anglers in the UK was £1108 in 2016 and £1318 in 2017 (Box 5). Removing imports and taxes and
scaling to the UK gave total direct expenditure estimates of £696 million in 2016 and £847 million in
2017. This resulted in a total economic impact of sea angling in 2016 of £1.58 billion, providing £326
million of Gross Value Added (GVA) and supporting almost 13600 jobs. Total economic impact in 2017
was £1.94 billion, providing £388 million of GVA and supporting around 16300 jobs in 2017. These
were slightly lower than the estimates for England in 2012 probably due a combination of differences
in allocation between industries, taxes, and survey method.
Catch estimates for England from the
2016 and 2017 surveys were higher
across many species than from the Sea
Angling 2012 survey programme,
particularly for released fish. It was not
possible to use an on-site approach in
2016-17 due to resource constraints.
Instead an angler diary panel was
implemented that was both resource
efficient and has been used to provide
robust catch estimates in other
countries. As the 2012 data are for only
one year and used different survey methods, it has not been possible to determine the extent to which
the increased catch estimates are due to survey bias, random sampling error, or changes in fish
abundance. It is likely that a combination of these factors generated the differences. Although a
method was applied to reweight the panel to be more representative of the population in terms of
avidity, age or predominant sea angling method, some bias may remain if sea anglers who complete
a diary are on average more experienced or skilled than the general population, and this might affect
their catches and expenditure. Further work is underway in 2019 to assess the level of bias including
a validation survey and correcting for fishing experience and skill.
Sea Angling in the UK in 2016 & 2017 Page 4 of 39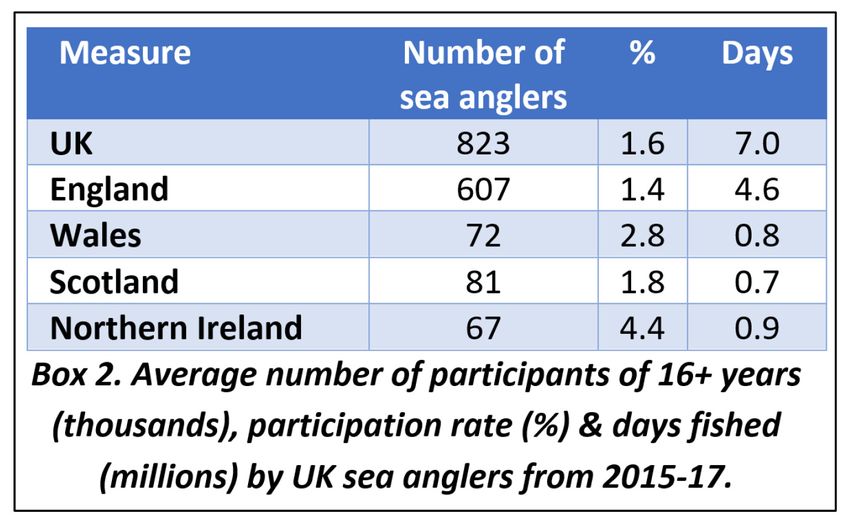
Table of Contents
Graphical summary ................................................................................................................................. 2
Executive Summary................................................................................................................................. 3
Table of Contents .................................................................................................................................... 5
Annexes to the main report .................................................................................................................... 6
Table of Tables ........................................................................................................................................ 6
Table of Figures ....................................................................................................................................... 7
1      Introduction .................................................................................................................................... 8
           1.1        Overview of marine recreational fisheries...................................................................... 8
           1.2        Sea angling across the UK ............................................................................................... 9
           1.3        Why do we need sea angling data? .............................................................................. 10
           1.4        Survey methods ............................................................................................................ 11

           1.5        This study ...................................................................................................................... 12
2      Methods ........................................................................................................................................ 13
           2.1        Participation, numbers, and effort ............................................................................... 13
           2.2        Catches .......................................................................................................................... 14

           2.3        Economic impact ........................................................................................................... 15
3      Results ........................................................................................................................................... 19
           3.1        Participation, numbers, and effort ............................................................................... 19
           3.2        Catches .......................................................................................................................... 20

           3.3        Economic impact ........................................................................................................... 25
4      Discussion...................................................................................................................................... 28
           4.1        Current survey............................................................................................................... 28

           4.2        Comparison with previous surveys ............................................................................... 30

           4.3        Further work ................................................................................................................. 32
5      Acknowledgements....................................................................................................................... 34
6      References .................................................................................................................................... 35

Sea Angling in the UK in 2016 & 2017                                                                                                       Page 5 of 39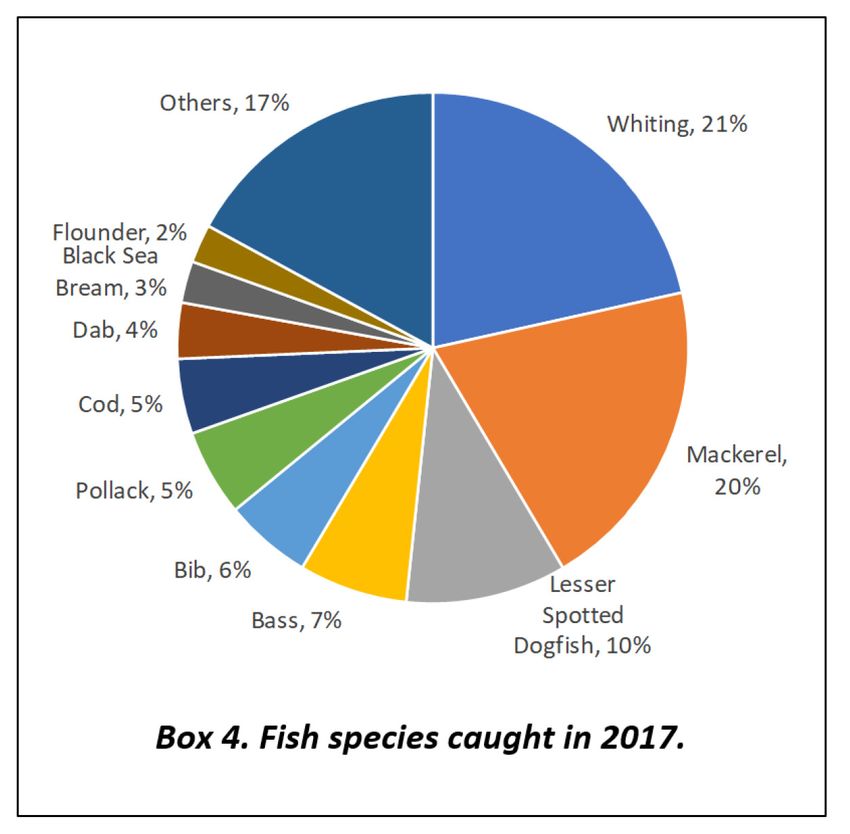
Annexes to the main report
Annex 1. Estimating the participation rate, numbers, and days fished by sea anglers resident in the UK
from the Watersports Participation Survey.
Annex 2. Implementing a diary panel to report sea angling catches in 2016 and 2017.
Annex 3. Estimating the total economic impact, gross value added, and numbers of jobs supported by
sea anglers resident in the UK in 2016 and 2017.
Annex 4. Estimating catches by sea anglers resident in the UK in 2016 and 2017.

Table of Tables
Table 1. Categories of trip and major item expenditure provided by individual anglers. Trip relates to
the last trip and major item captures large purchases. ........................................................................ 16

Table 2. Percentage of imports by sector in Input-Output table.......................................................... 17

Table 3. Allocating spend by anglers between industries for input-output analyses. Percentage of
spend category that flows into an industrial sector. ............................................................................ 18

Table 4. Sea angler numbers, participation rates, days fished by platform, and days fished by an
individual in 2012, and 2015-17. The numbers for 2012 were from surveys of Great Britain (Armstrong
et al., 2013) and Northern Ireland (McMinn, 2013). UK indicates resident in the UK. In 2016, some
postcodes were missing making assigning location impossible for around 6,000 sea anglers, but were
assigned to England for this analysis. Average is the mean of the 2015-17 results. Standard errors are
given in brackets. .................................................................................................................................. 19

Table 5. Summary of the fishing activity of the diarists in each year. .................................................. 21

Table 6. Number of diarists signed up and entering data from different home locations. .................. 21

Table 7. Species excluded from the analysis in 2016 and 2017 because there were fewer than 15
recorded entries in the diary of they were caught by fewer than 4 diarists. ....................................... 23

Table 8. Response rates, last trip spend, and annual major item spend for 2016 and 2017. Raised total
expenditure split into trip and capital. Standard errors are given in brackets. .................................... 25

Table 9. Total direct expenditure, imports, and taxes in millions provided by sea anglers in 2016 (raw
and inflated to 2017 prices). ................................................................................................................. 26

Table 10. Total economic impact (million GBP), employment, and Gross Value Added (GVA) create
indifferent industrial sectors by direct, indirect and induced (Ind) expenditure by sea anglers in the UK
in 2016 and 2017. Errors are provided in brackets............................................................................... 27

Sea Angling in the UK in 2016 & 2017                                                                                                   Page 6 of 39
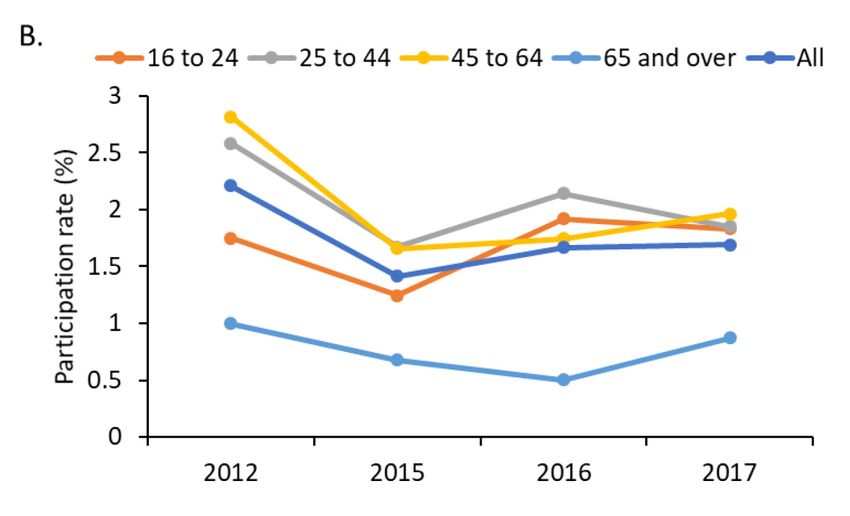
Table of Figures
Figure 1 Overview of sampling methodology, raising the diary records of catch and spend to the
national estimates, using the participation rates from the WPS.......................................................... 13

Figure 2. The percentage (panels A, C, E) and participation rates (B, D, F) of sea anglers by age (A&B),
gender (C&D) and socio-economic group (E&F). .................................................................................. 20

Figure 3. Schematic demonstrating the final estimation procedure for each species and/or group.
Stratification methods were strata 12 in 2016 (three avidity strata (
1     Introduction
1.1 Overview of marine recreational fisheries
Marine recreational fisheries (MRF) has been defined as: “the capture or attempted capture of living
aquatic resources mainly for leisure and/or personal consumption. This covers active fishing methods
including line, spear, and hand–gathering and passive fishing methods including nets, traps, pots, and
set–lines” (ICES, 2013). In Europe, MRF has been shown to be important economically and socially,
and can also have an impact on fish stocks (Hyder et al., 2017; 2018; Radford et al., 2018; Lewin et al.,
2019). As MRF is exploiting a scarce fish resource alongside commercial fisheries, market failure in
form of the “tragedy of the commons” is possible (Gordon, 1954; Hardin, 1968). This occurs if access
to marine fish is not restricted when the stock is being overexploited. Information on the social,
economic, and biological impact of MRF is needed to underpin balanced management, but is often
lacking, so data collection programs have been introduced to provide evidence for decision makers
(Hyder et al., 2014; 2017; 2018).

Participation in MRF is highly variable between countries in Europe varying between 0.2% in Germany
to 33% in Norway (Hyder et al., 2018). Many factors have been shown to influence participation rates
(e.g. population size, population density – e.g. Arlinghaus et al., 2015; Edwards, 1989; Heberlein et al.,
2002), but it is likely that complex interactions between factors drive differences in participation rates
between countries. Individual motivations for participation in MRF are very diverse, including
relaxation, experiencing nature, exercise, personal consumption, and socialising (Arlinghaus, 2006;
Armstrong et al., 2013; Beardmore et al., 2011; Fedler and Ditton, 1994). For example, angler
behaviour can affect harvest rates through the importance to the angler of catching fish to eat (e.g.
Aas & Vittersø, 2000; Beardmore et al., 2011). In fact, MRF can also an important source of food in
some countries (Cooke et al., 2018).

Expenditure on MRF in Europe is significant and has been estimated to be €5.9 billion each year (Hyder
et al., 2018), creating a total economic impact of €10.5 billion and supporting almost 100000 jobs
(Hyder et al., 2017). In addition, there are many social benefits including environmental improvement,
experiencing nature, spending time with friend and family, and health and wellbeing (McManus et al.,
2011; Armstrong et al., 2013; Griffith et al., 2017). Although most individual fisher’s catches are small,
the combined catches of a million fishers on all their fishing trips in a year can be large enough to have
a significant impact on some fish stocks (Armstrong et al., 2013; Cooke and Cowx 2004; Hyder et al.,
2017; 2018; Lewin et al. 2006; 2019; Radford et al., 2018), and potentially have other environmental
impacts such as lead loss and introduction of non-native species (Lewin et al., 2006; 2019). In Europe,
recreational removals (harvest plus fish that die after release) for some species can represent between
2-43% of the total catch (Hyder et al., 2017; 2018; Radford et al., 2018). Along with fish kept for eating,
this includes fish that are released but die due to injuries or stress (Kerns et al., 2012), with high
released rates found in Europe (Ferter et al., 2013). Despite these catches, MRF is rarely included in
stock assessment in Europe which may impact on sustainable management of fisheries (Hyder et al.,
2014; 2017; 2018).

The benefits and impacts of recreational fishing must be documented alongside similar data from
commercial fisheries to help local and national policy makers make balanced and well-informed

Sea Angling in the UK in 2016 & 2017                                                           Page 8 of 39
decisions (Hyder et al., 2018). This information also helps angling and commercial fishing
organisations, and other non-governmental bodies, to develop their own policies and provide best
practice advice.

1.2 Sea angling across the UK
Sea angling is the capture of resources for leisure or personal consumption, by line only, and is the
most common method of marine recreational fishing in the UK. There are no complete lists of marine
recreational fishers nor licensing schemes in the UK, so an independent study is required to estimate
participation, effort, and catches (see ICES, 2010; Jones and Pollack, 2013; Pollack et al. 1994). A
number of studies have included an estimation of the numbers of sea anglers and participation rates
in the individual countries of the UK (e.g. Armstrong et al., 2013; Drew, 2004; McMinn, 2013; Radford
and Riddington, 2009; Simpson and Mawle, 2005, 2010), including omnibus surveys using face-to-face
methods. In 2003, an omnibus survey in England and Wales estimated there were 1.1 million sea
anglers equating to a participation rate of 5% for over 16-year olds (Drew, 2004). Surveys to assess
public attitudes to angling in England and Wales found that 2 million (5%) and 1.9 million (4%) of
individuals aged 12 years or over in 2005 and 2010 respectively, had been sea angling in the past year
(Simpson and Mawle, 2005; 2010). The most recent information on MRF participation and effort in
Great Britain (England, Wales and Scotland) was carried out in 2012 using an omnibus survey of over
12000 households which estimated that 2.2% or 1.08 million people of 16 years or older had been sea
angling in the past year, with 884000 from England, 125000 from Scotland, and 76000 from Wales
(Armstrong et al., 2013). Other surveys showed that in 2009, there were an estimated 125188 sea
anglers of 18+ years in Scotland (Radford and Riddington, 2009) and 64800 sea anglers of 18+ years
(3.6% participation) in Northern Ireland in 2012 (McMinn, 2013).

Several studies have been done in the UK to assess the economic value and impact of sea angling
(Armstrong et al., 2013; Drew, 2004; Lawrence, 2005; Monkman et al., 2015; Radford and Riddington,
2009; Roberts et al., 2017). In 2003, the expenditure by sea anglers resident in England and Wales was
estimated at £538 million per year based on 12.7 million angler days of activity, and with this spending
supporting nearly 19000 jobs directly and £71 millions of supplier income (Drew, 2004). In south west
England in 2004, it was estimated that 240900 residents and 600000 visitors were active sea anglers
spending a total of £165 million (Lawrence, 2005). The impact of sea angling in Scotland in 2009 was
estimated at £70 million, supporting 3148 jobs (Radford and Riddington, 2009). In Wales, the total
annual expenditure of sea anglers was estimated as £39 million for visitors and a further £87 million
for residents, supporting around 1700 jobs (Monkman et al., 2015). The most comprehensive study
for England was done in 2012 estimating an economic impact using a household survey of effort
(numbers of anglers) and an online and face-to-face survey of expenditure (spend per angler) in
combination with an Input-Output (IO) methodology to calculate total economic impact, Full Time
Equivalents (FTEs), and Gross Value Added (GVA) (Armstrong et al., 2013; Roberts et al., 2017). It was
found that sea anglers residing in England spent £1.23 billion on the sport, equivalent to £831 million
in direct spend, and supported 10400 full-time equivalent jobs with almost £360 million of GVA. Taking
indirect and induced effects into account, it was estimated that sea angling supported £2.1 billion in
total spending, GVA of £978 million, and a total of over 23600 jobs (Armstrong et al., 2013; Roberts et
al., 2017).

Sea Angling in the UK in 2016 & 2017                                                        Page 9 of 39
Total economic impact studies are not generally used to assess the impact of a change in policy. This
is because complete cessation of sea angling would only to lead to a partial loss of the total economic
impact generated as most anglers would redistribute their spend to other recreational activities. For
example, Radford and Riddington (2009) estimated that a total cessation of sea angling would lead to
a net loss of 1,675 jobs (out of 3,148) and £37 million annual income (out of £70 million) which
presents about 53% of the economic impact created. In 2012, sea angling in England represented
about 6% of the UK GVA created by the recreational sector based on leisure industry values from the
nominal and regional GVA tables published by the Office for National Statistics 1. Hence, this sector
had a relatively large economic impact compared to its participation rate of 2.2.% in 2012 (Armstrong
et al., 2013). As a result, spending on other recreational activities may not offset the economic loss
completely, but this depends on how the spend is redistributed. However, it is difficult to use this
approach to assess the impact of policy, with stated or revealed preference approaches usually used
for this purpose (EFTEC 2015).

1.3 Why do we need sea angling data?
Sea angling data are needed to support local, national, and regional management of fish stocks,
environmental protection, marine spatial planning, and development of the blue economy (ICES,
2015). Information is needed at local scales (e.g. UK Inshore Fisheries and Conservation Authorities),
national scales (e.g. government departments), and international scales (e.g. the International Council
for the Exploration of the Seas, ICES and the European Commission and its Scientific, Technical and
Economic Committee on Fisheries) to inform marine management and policy. Data are also needed
by the angling community for development of their own policies (ICES, 2017). It is a statutory
requirement under the EU Data Collection Framework (DCF) for the UK to report recreational catches
and releases of cod, sea bass, pollack, elasmobranchs, eels, salmon, and highly migratory species (the
EU Data Collection Framework (Council Regulation (EC) No 199/2008) and the Multi-Annual
Programme (Council Regulation (EU) 2017/1004)). There is also the requirement to report all catches
of recovery plan species by boats flying the UK flag under the Control Regulations, which includes
recreational charter boats (EU, 2009).

Europe has lagged behind some countries such as the USA and Australia in collecting and making use
of data on recreational sea fishing (e.g. NOAA, 2015; Ryan et al. 2016). There is a paucity of catch
estimates making it difficult to include recreational fisheries when assessing the conservation status
of marine fish stocks and advising on future catches to achieve goals for sustainability (Hyder et al.,
2014; 2017; 2018). As a result, it has therefore been largely ignored in stock assessments in Europe
(Hyder et al., 2014; 2017; 2018). Marine recreational fishing has been included in stock assessments
for European sea bass, western Baltic cod, Baltic sea trout, and Atlantic salmon in the Baltic, leading
to recreational fisheries management measures including bag limits and closed seasons (e.g. sea bass,
western Baltic cod). A decline in a stock and reduction in fishing opportunities for both commercial
and recreational fishing brings these sectors into conflict and makes allocation between them a

1
 Online available: https://www.ons.gov.uk/economy/grossvalueaddedgva/datalist?filter=datasets (published
19 December 2019).

Sea Angling in the UK in 2016 & 2017                                                       Page 10 of 39
challenge (Williams et al., 2018). Therefore, accurate data are needed to enable robust assessments
and management decisions.

1.4 Survey methods
      Catches

To estimate total annual catches and releases by sea anglers for a country or sea area, it is typically
necessary to carry out independent surveys of MRF effort and catch per unit effort, along with
biological information on the lengths and weights of catches (ICES, 2010; Jones and Pollack, 2013;
Pollack et al. 1996). On-site (e.g. creel, aerial, camera) or off-site (e.g. household) approaches are used
to estimate the effort (e.g. numbers of anglers, trips, boats). The effort can be partitioned among
groups that have different characteristics (e.g. age, avidity, platform, mode). Catch per unit effort
(CPUE) can also be collected using on-site (e.g. access point, roving creel) or off-site (e.g. diary, recall)
approaches. Characteristics of the respondents are usually recorded to correct for differences
between the sample and population (e.g. age, avidity, platform, mode). The approaches for data
collection vary and there is no single preferred method, as each is subject to different potential biases
(ICES, 2010; Jones and Pollack, 2013; Pollack et al. 1996). Bias in sea angling surveys can arise at the
design stage, for example insufficient spatial coverage or use of non-random sample selection
methods. During implementation, additional biases can arise such as non-response, prestige bias
(exaggeration), recall errors, and rounding up or down of numbers.

Different methods can be used to reduce these biases as much as possible. Catch and effort surveys
used are often selected based on a detailed evaluation of logistics, staffing and resources needed,
available budget, likely response of anglers, potential for bias, and the types and quality of information
needed by end users. Logbook (or diary) surveys involving recruitment of a representative panel of
fishers are a popular method of collecting marine recreational fishing data in Europe and potentially
worldwide, due to the low cost per sample (Bellanger and Levrel, 2017) and the ability to collect
detailed catch, demographics, and effort data. However, this only provides information on resident
fishers, so is not suitable where there are large tourist fisheries, unless data for tourists are available
from surveys in their own countries, or on-site sampling is possible to quantify the number of tourist
anglers. The survey approaches used can impact on the outcome as there are different challenges and
biases. In fact, comparisons between on-site creel and off-site diary panel surveys in New Zealand
showed that the results from off-site diary were between 2 and 50% higher for the harvested
component of the five most commonly caught species with the largest differences for less commonly
caught species (Hartill et al., 2015).

      Economics

Most studies of recreational fisheries focus on either the economic value from a social welfare
perspective (e.g. Toivonen et al., 2004) or the macro-economic impact of the activity (Armstrong et
al., 2013; Hyder et al., 2017; Monkman et al., 2015; Roberts et al., 2017). There are many approaches
to estimate the economic value of an activity or sector (e.g. EFTEC, 2015; Parkkila et al., 2010). These
vary according to the questions being asked and range from the non-market benefits to society (such
as willingness to pay surveys) to the impact that marine recreational fishing has on a given economy
(ICES, 2018).

Sea Angling in the UK in 2016 & 2017                                                           Page 11 of 39
Economic impact identifies, from a macro-economic perspective, the monetary funds a particular
project or industry brings to the area where it is located (EFTEC, 2015). Hence, this approach calculates
the impact of the demand for MRF on the regional or national economy. This is done using Input-
Output (IO) models, which is a quantitative static approach to represent the interdependencies
between multiple economic sectors (EFTEC, 2015; Parkkila et al., 2010). The IO method measures the
potential impact of an increase in activity in one sector on the total economy through the direct output
of the sector, indirect and induced effects, employment, and GVA due to this change in activity
(Kowalewski, 2009). The direct effect relates to the increased production output, indirect effects
capture the increase in production in the other sectors, and the induced effect is where more
employment is generated which allows households to increase their income and spending. The direct,
indirect and induced effects are summed to get the total economic impact of an activity. This approach
has been commonly used to estimate the economic impact of marine recreational fishing (Armstrong
et al., 2013; Hyder et al., 2017; Poudel et al., 2018; Roberts et al., 2017).
1.5 This study
This study estimated participation, effort, catch, and economic impact of sea anglers resident in the
UK in 2016 and 2017. To achieve this, the outputs from two separate surveys were combined. Firstly,
an existing nationwide survey of UK residents (the Watersports Participation Survey - WPS) was used
to estimate fishing effort in terms of how many people go recreational sea fishing, and how often they
use different methods. Secondly, a nationwide panel of sea anglers was recruited to complete a diary
recording all their marine recreational angling activities and catches during the year, from which the
average catch per unit effort was calculated 2. The diary results were then raised to the total UK
population using information from the WPS. To minimise bias in the estimates, differences in avidity,
age, and fishing platform between the diary sample and UK population were corrected in the analysis.
This report describes the methodology, participation, catch and economic results, and discusses the
implications for future surveys. As the methods are complex, full methodologies and results for each
survey are provided in the four Annexes (WPS, diary, economic impact, and catch).
2
https://www.seaangling.org/
Sea Angling in the UK in 2016 & 2017 Page 12 of 392 Methods
The overall aim of the analysis was to estimate the numbers and tonnages of fish kept and released
by adult sea anglers resident in the UK by species, along with the associated estimates of precision.
Two datasets formed the basis of the analysis:
• Watersports Participation Survey (WPS): a face-to-face omnibus survey of 12000 randomly
selected households within strata across the UK that provides a population level estimate of
the numbers, profile, and activity of sea anglers in the UK (see Annex 1 for a full description).
• Sea angling diary: a year-long online catch diary tool that provides a record of the catches
from a self-selecting panel of sea anglers (see Annex 2 for a full description) and regular
surveys of expenditure.
The estimates of the number of anglers (effort) from the WPS (Annex 1) were combined with catches
by individual anglers (catch per unit effort) from the sea angling diary survey (Annex 2) (Figure 1). To
minimise bias in the estimates, differences in avidity, age and fishing platform between the diary
sample and UK population were corrected for. This type of two-stage survey is done for most sea
angling surveys (see Jones and Pollock, 2013; Pollock et al., 1994 for a general review) to account for
differences in the composition of the sample and population.
Figure 1 Overview of sampling methodology, raising the diary records of catch and spend to the national estimates, using
the participation rates from the WPS.
2.1 Participation, numbers, and effort
The WPS was delivered by the market research consultancy Arkenford (now part of The Nursery
Research & Planning Ltd3). The survey includes a face-to-face omnibus survey of 12000 UK households
3
https://the-nursery.net/
Sea Angling in the UK in 2016 & 2017 Page 13 of 39to estimate participation and trends in watersport activities. Questions were added to the omnibus
survey in 2015, 2016, and 2017 on sea angling to generate information on effort (numbers of anglers
and days fished) that could be used to calculate catches and releases by sea anglers in the UK. The
sample frame, sample points and interview methodology are described in detail in Annex 1.
The sampling frame was created from the 2011 Census small area statistics and the Postcode Address
File (PAF). This was used to identify non-overlapping areas of similar population sizes within a single
Government Office Region (GOR) that then became the sample points in the sampling frame. Each
year, 605 sample points were identified across the UK, with 600 south of the Caledonian Canal.
Sampling points north of the Caledonian Canal differed in size from those south of the canal and from
each other, in order to ensure that the Scottish Highlands and Islands were adequately covered The
addresses selected for sampling at each selected sampling point were issued to achieve an adult
sample of 13, 15, or 17 in London and 15, 17, or 19 elsewhere per sampling point, depending on the
questionnaire length.
All respondents were 16 years or older and each was asked if they had taken part in any of 32 different
watersport activities. For marine recreational fisheries, the following categories were defined: sea
angling from a kayak; sea angling from a private or rental boat; sea angling from a charter boat; sea
angling from the shore; and recreational sea fishing (using pots, traps, nets, spears). From 2015
onwards, if the respondent answered yes to any of these categories, they were then asked how many
days that they had been fishing in the UK in the last year. Responses were weighted based on the
interviewee’s location, age, sex, and social grade. A breakdown of demographics published by the
Office of National Statistics (ONS) were used to raise the weighted samples (questionnaire responses)
to the entire population of the UK over the age of sixteen. Participation rates, numbers, and days
fished in 2016 and 2017 were calculated for the UK and compared with previous surveys.
2.2 Catches
Catch diaries
Recruitment of diarists in 2016 and 2017 involved the identification of a sample of people who fish for
recreation in the sea and who were willing to keep catch diaries. Recruitment varied between years,
but was done by contacting an existing database of around 17000 anglers by email, through angling
clubs, internet fora, adverts in published media, social media, and flyers in tackle shops. The diarist
panel was self-selecting rather than random, so has potential for bias due under- or over-
representation of anglers in terms of avidity, fishing methods, age or region or other factors that affect
catches. Regional sampling targets for recruitment of diarists were set to ensure a distribution of
diarists across the UK that matched the distribution of sea anglers from previous population surveys.
Phase one for both surveys was conducted during the autumn/winter months to obtain the initial
sample of 600 and 1000 in 2016 and 2017, respectively, to begin in January, and then from July 2017
on a ‘rolling’ basis to add numbers to the diary panel.
Diarists were given a fish identification booklet, tape measure, and waterproof notebook to record
details of location, methods, and catches on each session. An explanation of the recording
requirements (including location, duration, method, and catches) and access to the online diary
Sea Angling in the UK in 2016 & 2017 Page 14 of 39system 4 to record catches each month. Diarist recorded whether they had fished each month, and
details of each session (location, duration) including catch (species, size, fate). The data was
anonymised, so that individual anglers could not be identified and no entries could be linked to an
individual. Each fishing location recorded was jittered to protect individual marks. All personal data
was removed from the database before data analysis. Significant effort was put into following up with
diarists to ensure that data were completed each month, but there were still issues with missing data.
Sizes could be provided as length or weight, so weights were calculated for each species using known
length-weight relationships (Silva et al., 2013).
Catch by UK sea anglers
The numbers and tonnages of fish of each species kept and released were calculated from the number
of UK sea anglers (effort) from the WPS in each year multiplied by the average annual catch of each
species by panel members (catch per unit effort) from the sea angling diary survey to give total catches
for the UK population (see Jones and Pollock, 2013; Pollock et al., 1994 for a general review). No
estimates were provided where there were fewer than four diarists or 15 records for an individual
species as these were considered too uncertain to provide robust estimates. In addition, tonnages
were not calculated for species with fewer than five diarists or 50 individual fish reported. Only diarists
that provided six or more months of data were included and the highest and lowest three catches
were removed (trimmed) to reduce this impact of single large catches. There was potential bias
because the diarists were self-selecting rather than random, so the data from the panel were post-
stratified and reweighted to reduce the effects of bias. The sensitivity of the results to number of
months of data each year and trimming was tested. Different strata for reweighting were tested
including avidity, fishing methods, and region, and precision of the total catch estimates was
evaluated. Balancing the numbers of respondents (WPS and diary) and metrics led to selection of
different post-stratification in 2016 (3 avidity and 2 platform) and 2017 (3 avidity and 2 age). The
numbers of fish kept and released (total and catch per angler) and release rates were compared in
2012 (Armstrong et al., 2013), 2016 and 2017 (this study). The catch composition by numbers caught
was assessed for 2016 and 2017 for the UK and composition within England compared to 2012
(Armstrong et al., 2013).
2.3 Economic impact
At three points in 2016 (June, September, and December) and two in 2017 (July, December), an
economic survey was conducted with anglers who were part of the catch diary in order to obtain
estimates of annual expenditure on sea angling. Multiple surveys were done to reduce recall bias by
asking about recent expenditure and to generate information in different seasons of the year. Through
an online tool, diarists provided expenditure on capital (major) items in the last six months and a
breakdown of spend on their most recent trip in the preceding month. Trip expenditure included:
transport, accommodation (only for the night of and/or night after day sea angling), food and drink,
bait, tackle, other fishing equipment bought for the trip, car parking, pier/harbour/launch fees, charter
or private boat hire and boat fuel (Table 1). All respondents were asked to provide their expenditure
on capital or ‘major items’ over the preceding six months (in June and December in 2016 and both
4
https://www.seaangling.org/
Sea Angling in the UK in 2016 & 2017 Page 15 of 39surveys in 2017). Major item categories included: fishing rods/reels, clothing, other fishing equipment
(excluding terminal tackle), boats/kayaks used mainly for sea fishing, and any other major items
relating to sea angling (Table 1). These were voluntary surveys, with 250 and 576 responses in 2016
and 2017, respectively.
The methodology used to estimate total economic impact, jobs, and GVA (Figure 1) followed a similar
approach to that used in previous surveys of economic impact of sea angling (Armstrong et al., 2013;
Hyder et al., 2017; Monkman et al., 2015; Roberts et al., 2017). The results of the WPS and the spend
diaries were used to estimate the total expenditure by UK sea anglers. The three highest and lowest
values were trimmed, and two age groups (18-54, 55 or more), two avidity groups (less than 20, 20 or
more) and two platform types (boat, shore) defined the sampling strata for each year in the analysis.
The total expenditures by sea anglers in the UK was calculated for each individual category of trip
(effort based) and capital (major item/investment) expenditure (based on the categories in Table 1).
Taxes and imports were removed (taken from Office for National Statistics (ONS) 5) from the total
expenditure by sea anglers in the UK as these do not affect the demand in each industry (Table 2) and
expenditure split between industries (Table 3). Standard errors were estimated for each category and
the trips and capital expenditure was summed to give a total expenditure by sea anglers in the UK.
Table 1. Categories of trip and major item expenditure provided by individual anglers. Trip relates to the last trip and major
item captures large purchases.
Trip Capital
• Accommodation • Rods
• Food & drink • Clothing
• Bait • Other equipment
• Terminal tackle (trip) • Terminal tackle (capital)
• Other fishing equipment • Boats
• Car parking • Engines
• Pier fees • Other major spend
• Charter
• Fuel (boat & own vehicle)
• Public transport
• Other trip spend
5
https://www.ons.gov.uk/economy/nationalaccounts/supplyandusetables/datasets/inputoutputsupplyanduse
tables
Sea Angling in the UK in 2016 & 2017 Page 16 of 39Table 2. Percentage of imports by sector in Input-Output table.
Sector Sector number Imports (%)
Agriculture 1 26.6
Food, drink and tobacco 3 20.0
Textiles, clothing, footwear 4 29.0
Wood, paper, publishing 5 0.2
Coke and refined petroleum products 6 24.8
Machinery, electronics 10 38.0
Furniture and other manufacturing 11 27.0
Wholesale/retail 14 0.4
Hotels and restaurants 15 6.0
Transport 16 0.0
Other services 21 0.0
Total economic impact, GVA, and number of jobs supported were estimated using the Input-Output
(IO) approach. In this approach, the total expenditure by sea anglers in the UK is partitioned between
the industrial branches identified as impacted by the sea angling activity (Table 1, following Armstrong
et al., 2013; Roberts et al., 2017). To calculate the total direct expenditure, taxes and the proportion
of goods that each industry imports need to be removed from each spend category. The sectoral
supply structure of the UK economy which was used for calculating Leontief output multipliers and UK
imports, were taken from the supply and use tables (SUT) published by the ONS UK 6. Leontief output
multipliers (type II) were calculated, which allowed estimation of the indirect and induced impact of
the direct spending, the numbers of jobs supported, and the GVA created by the contribution of sea
angling to the UK economy (Figure 1). To provide estimates of the error, the standard error for each
expenditure category were included in the IO analysis. This is likely to be an underestimate of the error
as uncertainty in the IO analysis is excluded from this calculation.
Total economic impact, GVA, and jobs supported were calculated for 2016 and 2017. Results from
2016 were corrected for inflation to 2017 prices using the Harmonised Consumer Price Index from
EUROSTAT 7. Comparisons were made between angler expenditure (capital, trip, total), population
expenditure (spend, direct, imports, tax), economic impact (direct, indirect and induced, total),
employment (direct, indirect and induced, total), and GVA (direct). A visual comparison was made to
2012 results, as lack of error estimates for 2012 prevented a statistical comparison.
6
https://www.ons.gov.uk/economy/nationalaccounts/supplyandusetables/datasets/inputoutputsupplyanduse
tables
7
https://ec.europa.eu/eurostat/web/hicp
Sea Angling in the UK in 2016 & 2017 Page 17 of 39Table 3. Allocating spend by anglers between industries for input-output analyses. Percentage of spend category that flows into an industrial sector.
Spend Category Agriculture Food, Textiles, Wood, Coke and Machinery, Furniture and Wholesale / Hotels and Transport Other Total
drink and clothing, paper, refined electronics other retail restaurants services
tobacco footwear publishing petroleum manufacturing
products
Accommodation 100 100
Food & drink 25 25 50 100
Bait 50 50 100
Other fishing equipment 5 95 100
Car parking 100 100
Pier fees 100 100
Charter 50 50 100
Fuel 90 10 100
Public transport 100 100
Other trip spend 67 33 100
Rods 60 40 100
Clothing 50 50 100
Other equipment 5 95 100
Terminal tackle 10 90 100
Boats 85 15 100
Engines 85 15 100
Other major spend 85 15 100
Sea Angling in the UK in 2016 & 2017 Page 18 of 393 Results
3.1 Participation, numbers, and effort
It was estimated from the WPS that 874000 16+ year olds in the UK went sea angling in the 2016, and
902000 in 2017, representing an average participation rate of 1.6% in each year (Table 4). Numbers of
sea anglers were greatest in England, but participation rates were highest in Northern Ireland and the
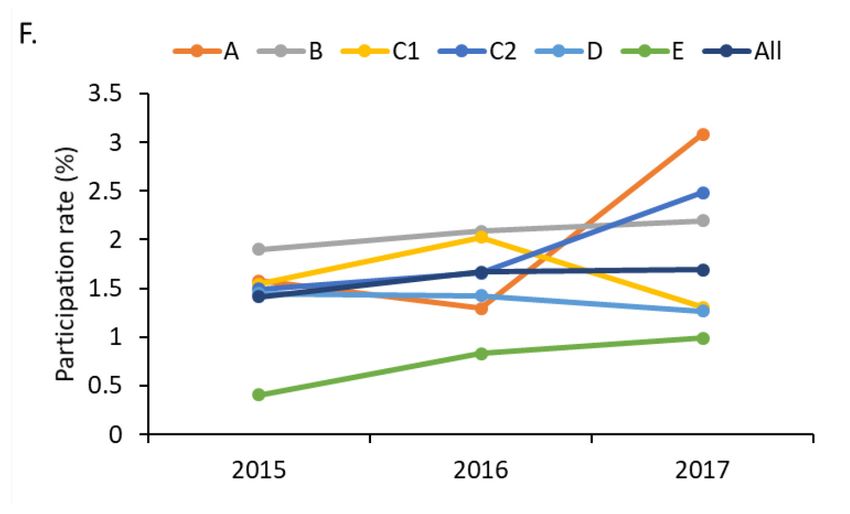
South West of England (Table 4). The majority of sea anglers were between 25 and 64 years old and
there were similar participation rates across age groups apart from a lower rate for those over 65
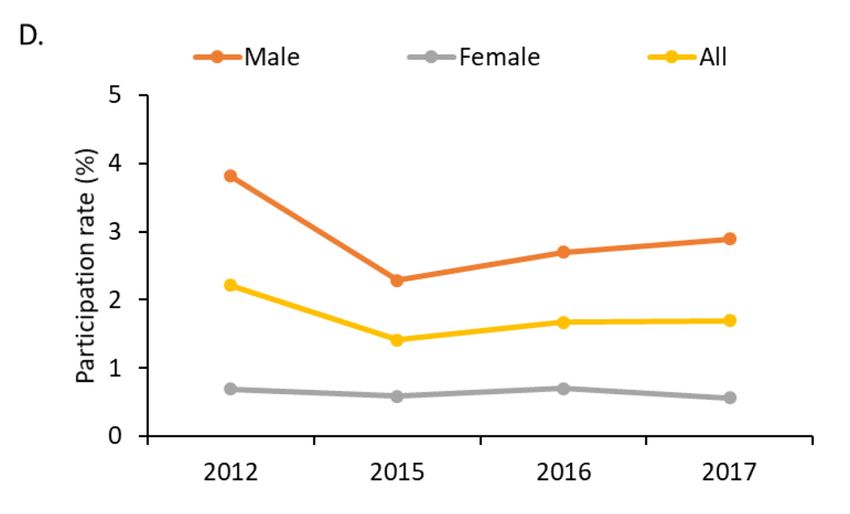
years old (Figure 2). Most sea anglers were male, but the percentage of males was lower than in most
other surveys at 80% (Figure 2). Sea anglers were mainly from socio-economic groups B, C1 and C2,
with a lower portion from A and E (Figure 2). Participation rates were reasonably consistent except
for a lower rate for group E (Figure 2). Due to the relatively low numbers of anglers responding, these
results are likely to be very uncertain.
Table 4. Sea angler numbers, participation rates, days fished by platform, and days fished by an individual in 2012, and 2015-
17. The numbers for 2012 were from surveys of Great Britain (Armstrong et al., 2013) and Northern Ireland (McMinn, 2013).
UK indicates resident in the UK. In 2016, some postcodes were missing making assigning location impossible for around 6,000
sea anglers, but were assigned to England for this analysis. Average is the mean of the 2015-17 results. Standard errors are
given in brackets.
Measure 2012 2015 (UK) 2016 (UK) 2017 (UK) Average
A. Numbers (thousands)
Total sea angling UK 1,145 694 (99) 874 (128) 902 (149) 823
England 884 525 (87) 601 (101) 677 (103) 603
Wales 76 46 (24) 99 (49) 69 (33) 72
Scotland 125 75 (31) 88 (46) 81 (40) 81
Northern Ireland 65* 47 (24) 80 (37) 75 (38) 67
Total non-angling methods --- 104 131 242 159
B. Participation (%)
Total sea angling UK 2.2 1.4 1.7 1.7 1.6
England 2.2 1.3 1.4 1.5 1.4
Wales 3.1 1.9 3.8 2.6 2.8
Scotland 2.4 1.8 2.0 1.7 1.8
Northern Ireland 3.6* 3.2 5.2 4.8 4.4
Total non-angling methods --- 0.2 0.2 0.5 0.3
C. Effort (million days)
Total sea angling UK 4.8 6.7 7.5 6.7 7.0
Kayak --- 0.2 0.3 0.3 0.3
Private 0.5 1.3 1.2 1.6 1.3
Charter 0.4 0.2 0.2 0.3 0.3
Shore 3.9 5.0 5.8 4.5 5.1
Total non-angling methods --- 0.2 0.6 0.6
D. Effort (days/angler)
Total sea angling UK 4.2 9.7 8.6 7.4 8.5
*Northern Ireland numbers are from McMinn (2013).
Sea Angling in the UK in 2016 & 2017 Page 19 of 39Figure 2. The percentage (panels A, C, E) and participation rates (B, D, F) of sea anglers by age (A&B), gender (C&D) and socio-
economic group (E&F).
3.2 Catches
Catch Diaries
A summary of the fishing activity recorded in 2016 and 2017 is provided in Table 5. While there were
more diarists in 2017 (both initial sign ups who had signed up before the start of 2017, and final
numbers who had joined by the end of 2017), there were more sessions per diarist in 2016, and the
fishing sessions were longer on average, resulting in more hours per diarist. However, because there
were more diarists overall, by the end of 2017 there were nearly twice as many fishing hours recorded
as in 2016 (47462 and 25279 respectively). In total 106 species plus ‘others’ were recorded over the
two years, with 100 fish species caught by sea anglers in the UK.
Sea Angling in the UK in 2016 & 2017 Page 20 of 39Table 5. Summary of the fishing activity of the diarists in each year.
Item 2016 2017 initial 2017 final
Total diarists in study 476 932 1,495
Total diarists fishing in year 348 677 878
Total sessions recorded 5410 9663 10602
Average number of sessions per diarist in the study 11.4 10.4 7.1
Average number of sessions per diarists who fished 15.5 14.3 12.1
Average session length 4.7 4.4 4.5
Total fishing hours recorded 25279 42527 47462
Average number of hours per diarist in the study 53.1 45.6 31.7
Average number of hours per diarists who has fished 74.6 62.8 54.1
Most of those who agreed to complete the diaries were resident in England, followed by Wales,
Scotland, and Northern Ireland (Table 6). Nearly twice as many diarists signed up in 2017 compared
with 2016, and even more signed up during 2017, giving a total of 1495 diarists by the end of 2017. Of
the diarists who signed up to the survey, not all entered data with 432 and 1216 diarists providing
data in 2016 and 2017, respectively (Table 6).
Table 6. Number of diarists signed up and entering data from different home locations.
Location 2016 2017 initial 2017 final
Signed up Data Signed up Data Signed up Data
East Midlands 17 14 34 30 58 44
East of England 43 39 85 79 141 120
London 12 10 20 17 38 28
North East 26 23 55 49 79 66
North West 49 38 75 67 108 91
South East 84 80 173 161 304 235
South West 92 90 222 206 343 274
West Midlands 18 16 30 30 44 39
Yorkshire & Humber 32 28 38 38 62 55
England Total 373 338 732 677 1177 952
Northern Ireland 25 23 31 30 66 50
Scotland 34 31 73 71 103 92
Wales 44 40 85 83 125 110
Republic of Ireland 0 0 2 0 10 1
Other 0 0 7 6 11 9
France 0 0 2 2 3 2
Grand Total 476* 432 932 869 1495 1216
*Note that some of the initial diarists that signed up dropped out and requested removal of their data accounting for the
difference between the initial number of 507 and the 476 given in this table
Catch by UK sea anglers
In order to correct for biases in the self-selected diary results using post-stratification and reweighting,
different combinations of post-stratifying by age, avidity, location, and platforms were tested, and the
sensitivity of the raised catches assessed. In addition, different levels of trimming (removal of the
equal numbers of diarists with the largest and smallest catches) were assessed to reduce the impact
of single very large catches on the results. (Armstrong et al., 2013; Roberts et al., 2017). Finally, the
sensitivity of the number of months of data each year was tested. Six months or more data was needed
Sea Angling in the UK in 2016 & 2017 Page 21 of 39for a diarist to be included in the analysis, leaving 292 diarists catching 45874 from 3842 sessions in 2016 and 639 catching 76510 fish from 7353 sessions in 2017. The final analysis configuration was as follows: trimming the three anglers with highest and lowest catches; post stratification in 2016 using “strata 12” which included three avidity strata (
Table 7. Species excluded from the analysis in 2016 and 2017 because there were fewer than 15 recorded entries in the diary
of they were caught by fewer than 4 diarists.

 2016                                                        2017
 Anchovy                                                     Black-mouthed Dogfish
 Black-mouthed Dogfish                                       Blue Whiting
 Bull Rout (short spined sea scorpion)                       Bull Rout (short spined sea scorpion)
 Common Skate                                                Four-bearded Rockling
 Connemera Sucker (Clingfish)                                Giant Goby
 Greater Weever Fish                                         Greater Pipefish
 Lemon Sole                                                  John Dory
 Leopard-spotted Goby                                        Lemon Sole
 Lesser Sandeel                                              Leopard-spotted Goby
 Monkfish (Anglerfish)                                       Long Rough Dab (American Plaice)
 Porbeagle Shark                                             Megrim (Cornish Sole, Whiffy)
 Red Mullet (Striped Mullet)                                 Norway Pout
 Red Sea Bream                                               Pandora Sea Bream
 Rock cook Wrasse                                            Pilchard
 Rock Goby                                                   Red Mullet (Striped Mullet)
 Sand Goby                                                   Red Sea Bream
 Shad (twaite)                                               Salmon (North Atlantic Salmon)
 Smelt (Small-scaled)                                        Sand Sole
 Sprat (skipper)                                             Shad (twaite)
 Vivaporous Blenny (eelpout)                                 Smelt (Small-scaled)
                                                             Spanish Mackerel
                                                             Starry Ray (Thorny Skate)
                                                             Stingray (Common Stingray)
                                                             Topknot
                                                             Triggerfish
                                                             Vivaporous Blenny (eelpout)
                                                             White Sea Bream

 A.                                                           B.

 C.                                                           D.

Figure 4. Numbers of fish kept and released (A) and release proportions (B) for the whole UK in 2016 and 2017 (A&B); and
numbers of fish kept (C) and released (D) for individual countries within the UK in 2012, 2016 and 2017. The error bars
represent standard errors.

Sea Angling in the UK in 2016 & 2017                                                                        Page 23 of 39
In total, 100 fish species were caught by sea anglers in the UK in 2016 and 2017 varying from small unusual species (e.g. tompot blenny), common angling species (e.g. cod, bass, dab, whiting and mackerel) to large pelagic fish (e.g. blue shark). The composition of species in the catch was similar between 2016 and 2017 with the same top four most common species being whiting, mackerel, dogfish and bass (Figure 5). The next four most common species were cod, pollack, dab and bib, but appeared in a different in order in the two years (Figure 5). The composition of catches was similar for England in 2012 was similar to 2016 and 2017 although there were differences in the order. A. B. Figure 5. Catch composition by number for the UK in 2016 (A) and 2017 (B) with the top 20 most commonly caught fish displayed. Sea Angling in the UK in 2016 & 2017 Page 24 of 39
Figure 6. Numbers and tonnage of data collection framework species kept and released by sea anglers resident the UK in
2012, 2016 and 2017. The results for 2012 are for England only and error bar are standard errors.

For EU Data Collection Framework species (sea bass, cod, eel, pollack, salmon, sea trout,
elasmobranchs and highly mobile ICCAT species (e.g. Atlantic Bluefin Tuna)), catches were similar in
2016 and 2017, apart from pollack and cod where the numbers and tonnage kept varied (Figure 6).
There were minimal catches of eel, sea trout and salmon, but significant catches of sea bass, cod and
pollack. The kept and released components of the catch were generally higher than in 2012, especially
for the released component, with the exception of sea bass, which had bag limits and closed seasons
in place from 2015 onwards.

3.3 Economic impact
There were 250 and 576 respondents to the economic surveys in 2016 and 2017, respectively (Table
8; Figure 7A). The average per trip expenditure was £75 in 2016 and £86 in 2017, with over £750 spent
each year on capital items (Table 8; Figure 7B). Stratification approaches varied between years and
was determined using a similar approach for catch and included trimming of three values (Section
2.2). The total expenditure was similar between years with anglers of 18 years or older spending £1.11
billion in 2016 and £1.32 billion 2017, with a roughly equal split between capital and trip spend (Table
8). After partitioning to different sectors and removing imports and taxes (Table 2; Table 3), the
majority of the direct expenditure was in the wholesale/retail (mainly tackle and rods) in both years,
followed by machinery/electronics (mainly boats and engines), furniture and other manufacturing
(mainly rods), and hotels and restaurants (Table 9).

After removing imports and taxes, scaling up to the whole UK population left a direct expenditure of
£696 in 2016 and £847 million in 2017 as an input to the IO analysis, with the majority acting on the
retail and wholesale sectors (Table 10). In 2016, the total economic impact of sea angling was £1.58
billion, providing £326 million of GVA (direct) and supporting around 13,600 jobs (Table 10). The total
was slightly higher in 2017, with a total economic impact of sea angling was £1.94 billion, providing
£388 million of GVA (direct) and supporting around 16,300 jobs (Table 10).

Table 8. Response rates, last trip spend, and annual major item spend for 2016 and 2017. Raised total expenditure split into
trip and capital. Standard errors are given in brackets.

                                                       Average Expenditure               Total Expenditure (million GBP)
 Year                               Responses        Last Trip      Capital          Trip          Capital            Total
 2016                                  250           £75 (£20)    £772 (£136)     £517 (£139)    £591 (£104)      £1108 (£173)
 2017                                  576           £86 (£22)    £841 (£145)     £682 (£173)    £637 (£110)      £1318 (£205)

Sea Angling in the UK in 2016 & 2017                                                                          Page 25 of 39
Figure 7. Comparison between the results from 2012, 2016 and 2017 for numbers of respondents (A), spend per angler (B), raised expenditure (C), economic impact (D), Gross Value Added (E) and employment (F). All values in GBP are presented in 2017 value. Figures for 2012 are for England only, 2016 and 2017 are for the whole of the UK. Table 9. Total direct expenditure, imports, and taxes in millions provided by sea anglers in 2016 (raw and inflated to 2017 prices). Industry 2016 2016 inflated 2017 Agriculture £28 (£20-£37) £29 (£20-£38) £33 (£24-£42) Food, drink and tobacco £18 (£14-£23) £19 (£15-£23) £17 (£14-£21) Textiles, clothing, footwear £24 (£19-£28) £24 (£20-£29) £21 (£18-£25) Wood, paper, publishing £5 (£4-£6) £5 (£4-£7) £32 (£15-£50) Coke and refined petroleum products £28 (£21-£35) £29 (£22-£36) £32 (£25-£39) Machinery, electronics £83 (£57-£109) £85 (£59-£112) £110 (£75-£145) Furniture and other manufacturing £88 (£72-£104) £90 (£74-£107) £94 (£79-£109) Wholesale/retail £287 (£228-£346) £295 (£234-£356) £304 (£240-£369) Hotels and restaurants £70 (£49-£91) £72 (£50-£93) £74 (£54-£94) Transport £42 (£28-£55) £43 (£29-£57) £100 (£49-£152) Other services £23 (£18-£29) £24 (£18-£30) £29 (£20-£37) Imports £152 (£111-£193) £156 (£114-£198) £177 (£131-£224) Fuel tax £67 (£51-£83) £68 (£52-£85) £76 (£60-£92) VAT £193 (£147-£238) £198 (£151-£245) £218 (£164-£271) Total £1108 (£838-£1378) £1137 (£861-£1414) £1318 (£968-£1669) Estimation of the total economic impact, GVA and jobs supported has been done for England in 2012 (Armstrong et al., 2013; Roberts et al., 2017) and for the UK in 2016 and 2017 in this study. The Harmonised Consumer Price Index was used to inflate the results from 2012 and 2016 to 2017 prices, so that a comparison could be made. In 2012, total economic impact of sea angling in England by anglers of 16 years or older was £2.1 billion, supporting 23,600 FTE jobs and £978 million of GVA (Armstrong et al., 2013; Roberts et al., 2017) (Figure 7C-F). The annual expenditure for each individual angler on trip and capital items each year was very similar ranging from £1,447 to £1,742, as was the split between trip and capital spend. There was little difference in the total expenditure ranging from £1.11 to £1.31 billion, but the direct expenditure was lower for 2016 and 2017 due to higher levels of tax and imports in 2016 (37%) and 2017 (36%) than in 2012 (33%) (Figure 7C-F). The largest differences were in the total economic impact, GVA, and jobs supported, with 2016 and 2017 lower than 2012 (Figure 7C-F). This was driven by several factors including spend profiles, ages, use of a different IO multiplier, and differences in taxes. Despite the differences with 2012, the results from 2016 and 2017 are reasonably consistent. Sea Angling in the UK in 2016 & 2017 Page 26 of 39
You can also read