ECONOMICS, ECOLOGY AND THE ENVIRONMENT - THE UNIVERSITY OF QUEENSLAND
←
→
Page content transcription
If your browser does not render page correctly, please read the page content below
ISSN 1327-8231

             ECONOMICS, ECOLOGY AND
                THE ENVIRONMENT

                                 Working Paper No. 173

                                   Antarctic tourism:
                     Environmental concerns and the importance of
                       Antarctica’s natural attractions for tourists

                                            by

                                      Clem Tisdell

                                      October 2010

                 THE UNIVERSITY OF QUEENSLAND
ISSN 1327-8231
                             WORKING PAPERS ON
                  ECONOMICS, ECOLOGY AND THE ENVIRONMENT

                                      Working Paper No. 173

                                         Antarctic tourism:
            Environmental concerns and the importance of Antarctica’s
                                natural attractions for tourists*

                                                    by

                                            Clem Tisdell†

                                            October 2010

© All rights reserved

*
    This is a draft chapter for the book Nature-based Tourism and Conservation by Clem Tisdell and Clevo
    Wilson to be published by Edward Elgar, in 2011. There is some overlap between this paper and No. 102 in
    this series. Feedback is welcome.
†
    School of Economics, The University of Queensland, St. Lucia Campus, Brisbane QLD 4072, Australia
    Email: c.tisdell@economics.uq.edu.au
WORKING PAPERS IN THE SERIES, Economics, Ecology and the Environment are
published by the School of Economics, University of Queensland, 4072, Australia, as
follow up to the Australian Centre for International Agricultural Research Project 40
of which Professor Clem Tisdell was the Project Leader. Views expressed in these
working papers are those of their authors and not necessarily of any of the
organisations associated with the Project. They should not be reproduced in whole
or in part without the written permission of the Project Leader. It is planned to
publish contributions to this series over the next few years.

Research for ACIAR project 40, Economic Impact and Rural Adjustments to Nature
Conservation (Biodiversity) Programmes: A Case Study of Xishuangbanna Dai
Autonomous Prefecture, Yunnan, China was sponsored by the Australian Centre for
International Agricultural Research (ACIAR), GPO Box 1571, Canberra, ACT, 2601,
Australia.

The research for ACIAR project 40 has led in part, to the research being carried out
in this current series.

For more information write to Emeritus Professor Clem Tisdell, School of Economics,
University of Queensland, St. Lucia Campus, Brisbane 4072, Australia.
Antarctic tourism: environmental concerns and the importance of
                   Antarctica‟s natural attractions for tourists

                                          ABSTRACT

This article provides general background on the development of tourism in Antarctica and
environmental concerns raised by it. However, the major part of it reports on and interprets
the results from a survey of tourists visiting Antarctica on a cruise ship. Particular attention is
given to the socioeconomic profiles of these tourists, their stated level of knowledge of
Antarctica before and after their visit, the relative importance to these visitors of seeing
different species of Antarctic wildlife and whether or not the opportunity of seeing Antarctic
wildlife was of critical importance for their decision to visit Antarctica. The relative valuation
by the sampled tourist of features of their Antarctic cruise is explored along with changes in
their attitude to nature conservation following their visit to Antarctica. The opinions of
respondents about environmental issues involving Antarctica are summarised and their
attitudes towards increased tourism in Antarctica are outlined. The article concludes with a
discussion of environmental policy issues raised by the development of tourism in Antarctica.

Keywords: Antarctica, Antarctica‟s natural attractions, cruise ships in Antarctica,
environmental conservation in Antarctica, tourism in Antarctica, wildlife conservation in
Antarctica.

JEL Classifications: L83, Q26, Q57.

1. INTRODUCTION

This article draws on the results of surveys of tourists who undertook an Antarctic journey in
January 2003 aboard the Antarctic cruise ship, „Akademik Ioffe‟. The prime purposes of
these surveys were to determine the socio-economic profile of these travellers, evaluate the
importance of Antarctic wildlife for their travel, their attitude to Antarctic wildlife
conservation as well as environmental issues involving Antarctica, both prior to their visit to

                                                1
Antarctica and following it. This article reports on the socio-economic profile of respondents,
their willingness to pay for their Antarctic trip, and their knowledge of Antarctica. The
comparative importance of Antarctic wildlife as a factor motivating respondents to undertake
their journey is assessed and the evaluation of travellers following their Antarctic visit is
considered. The relative importance of different Antarctic wildlife species is taken into
account as well as Antarctic attractions other than wildlife. The attitudes of respondents to
several environmental issues involving Antarctica, (for example, the commercial use of its
natural resources and global environmental change impacting on Antarctica) are canvassed
and summarised. In conclusion, the relevance of the survey results for Antarctic conservation
are discussed. Particular attention is given to the question of whether Antarctic tourism
favours or threatens Antarctic nature conservation.
While visits by tourists to Antarctica have increased considerably, Antarctica is still far from
a mass tourism destination partly because the cost of an Antarctic cruise is quite high. For
example, in January 2003, we asked tourists joining the cruise to Antarctica on the ship
„Akademik Ioffe‟, „How much do you expect that you/your accompanying partner/family will
have spent per person (approximately) specifically for this journey by the time it ends?‟. The
mean value mentioned was AUS$15,540 with a median of AUS$15,000. The actual cruise
was of nine days duration from the Argentinean port of Ushuaia. Approximately 75 per cent
of tourists to Antarctica start and finish their journey in this port (Barrio and Roldaln, 1997).
There has been a rapid increase in the number of tourists visiting Antarctica and this growing
interest has resulted in the production of a large guide book (Rubin, 2000) for prospective
tourists.
Fifty-two passengers filled out the structured pre-visit survey forms on board this vessel on
their way to Antarctica. Fifty passengers filled out post-visit survey forms on their return
journeys. The survey forms (pre- and post visit are reproduced in the Appendix to this
article). Only one form was completed per party. The questionnaires were designed to detect
possible differences between expectations on the outward journey and evaluations after the
visit of the tourists to Antarctica.
According to the International Association of Antarctica Tourist Operators (2003), the
maximum capacity of the „Akademik Ioffe‟ is 117 passengers and it carries an average of 90
passengers per trip. When this survey was conducted 68 passengers were on board and 52
2survey forms were completed on the outbound journey; 50 on the return journey. Because
only one completed survey was required per party travelling on this ship, coverage of the
survey was relatively complete.
2. GENERAL BACKGROUND ON TOURISM IN ANTARCTICA AND
ENVIRONMENTAL CONCERNS
Growth in tourism
The International Association of Antarctica Tour Operators (IAATO), claims that Antarctic
tourism began in 1966 when Eric Lindblad led the first traveller‟s expedition to Antarctica on
a cruise ship especially built for this purpose (IAATO, 2009a). IAATO states that “he
believed that by providing a first-hand experience to tourists you would educate them to the
ecological sensitivity of the Antarctic environment and promote a greater understanding of
the earth‟s resources and the important role of Antarctica in the global environment.”
(IAATO, 2009a).
It was not until after the formation of IAATO in 1991 that statistics began to be collected
regularly on tourist visits to Antarctica. In 1992-93, 6,704 seaborne tourists landed in
Antarctica. By 2007-08, this had risen (with some fluctuations) to 32,637. However, in 2008-
09 the number of sea-borne tourists landing in Antarctica declined to 25,921 and a further
decline (to 20,681) in landings was estimated for 2009-2010 season by IAATO. This has
been attributed primarily to the global financial crisis.
Commencing in 1999-00, cruise ships carrying passengers who do not come on land began to
arrive in Antarctica. In 2007-08, they carried 13,015 passengers but this declined to 10,652 in
2008-09 as a consequence of the global financial crisis.
Types of Antarctic tourism
Sea-borne visits by tourists to Antarctica account for the majority of tourist visits to
Antarctica as can be seen from the preliminary estimates of IAATO (IAATO, 2009b see
Table 1) for the 2009-10 season. A noticeable feature is the expected increase in the relative
importance of seaborne cruise-only tours to Antarctica. This may reflect the increasing
3importance of cruise-based tourism globally. Overflights of Antarctica without landing are no
longer in demand by tourists.
Table 1: Preliminary estimates for 2009-10 of IAATO of the number of tourists visiting
Antarctica by the type of visit and the percentages of visits by type
Number of Percentage
Type of visit
visits of total
Seaborne traditional tourism (with landings) 20,681 55.9
Seaborne tourism cruise-only (no landing) 15,531 42.0
Air/Cruise 450 1.2
Air/Land-Based „traditional‟ tourism 335 0.9
Overflights (no landing) 0 0
Total of visitors 36,997 100.0
Source: Based on IAATO (2009b)
Location of visits by tourists
Most tourism to Antarctica is focussed on the Antarctic Peninsula. The Peninsula accounts
for over 97% of visitors whereas visitors to the Ross Sea and Continental Antarctica amount
to only about 2.7% of visitors. The proximity of the Antarctic Peninsula to South America
influences this pattern. Some scientists believe that the geographical concentration of
Antarctic tourism tends to intensify the likely adverse environmental effects on Antarctica
from tourism.
Costs of cruises and the nationality of tourists
Antarctica cruises of about 7 days cost from US$5,000. However, preparing for the journey
and travelling to the embarkation point for the cruise can cost more than this. Hence, a cruise
to Antarctica is relatively expensive. This is one reason why most Antarctic tourists are from
high income countries.
Table 2 shows the composition of tourists landing in Antarctica in the 2002-03 season, the
season in which our survey was conducted. Table 3 shows this composition for the 2008-09
season. Based on IAATO data (IAATO, 2009c) almost 86% of passengers came from the
higher income countries listed in Table 3. Compared to 2002-03, there were some changes in
this composition. For example, the proportionate number of visitors from the USA and
Germany fell whereas there was a rise in this for Australia and Canada. Not only do tourists
4to Antarctica tend to come from higher income countries but they are usually well educated
and older than the average of the population of their countries (Kriwoken and Rootes, 2000).
Table 2: Composition by nationality of tourists landing in Antarctica, 2002-03
Country Number %
United States 5,343 39.37
Germany 1,948 14.35
United Kingdom 1,779 13.11
Australia 865 6.37
Japan 450 3.32
Canada 409 3.01
Sweden 395 2.91
Others 1,917 14.13
Unknown 465 3.43
Total: 13,571 100.00
Source: Based on IAATO (2003, p.21)
Table 3: Composition by nationality of tourists landing in Antarctica, 2008-09
Nationality Number of visitors % of total
United States 12,837 34.0
United Kingdom 5,496 14.6
Germany 3,842 10.2
Australia 3,035 8.0
Canada 2,350 6.2
Netherlands 1,383 3.7
Switzerland 1,151 3.1
Japan 1,104 2.9
France 739 1.9
New Zealand 457 1.2
Other 5,340 14.2
Source: Based on IAATO (2009c, p.5)
According to Rubin (2000, p.108), “One of the most important factors in the large increase in
Antarctic tourist numbers during the late 1980s and early 90s was the collapse of the Soviet
Union”. Many scientific academies leased their ice-strengthened boats to Western tourist
companies to earn much needed income. This is why many of today‟s Antarctic tour vessels
are Russian registered ships.
5Environmental issues
Environmental issues surrounding increasing tourism to Antarctica remain controversial.
Views range from the contention that environmental impacts of tourists are minimal and are
grossly exaggerated by some of the media and by some environmentalists to the opposite
view that these effects are serious, are likely to become more so, and are not sufficiently
recognised.
According to Rubin (2000, p.55), for example, “with its extremely harsh climatic conditions,
Antarctica has a sensitive ecology. Visitors must respect that sensitivity to ensure that no
damage is done… Although tourism to Antarctica is sometimes criticised as being harmful to
the Antarctic environment, in truth the impact made by tourists is absolutely minimal when
compared to scientific activities on the continent”. He argues that the latter activities account
for more than 99 per cent of man-days spent in Antarctica and that the permanent scientific
stations involve more substantial negative environmental impacts than Antarctic tourists.
While that is a serious environmental issue, it is not a reason for lack of concern about actual
and potential environmental impacts of Antarctic tourism.
Adverse effects from Antarctic tourism can come from oil spills, accidents to travel vehicles,
trampling on the Antarctic Peninsula, disposal of human wastes and stress placed on some
wildlife species by visitors.
The environmental implications of increasing growth and diversity of Antarctic tourism has
become of growing concern to Antarctic Treaty members. Concerns include inadequate
insurance by some operators, the possibility that tourists may disrupt scientific work and the
risks of cumulative environmental impacts combined with the absence of good monitoring
programmes (Anon, 2001, p.42).
Nevertheless, it would be wrong to conclude that no legal framework exists for the control
and regulation of the development and conduct of tourism in Antarctica. The Protocol on
Environmental Protection was added in the 1990s to the Antarctic Treaty to provide for some
environmental protection in Antarctica. It is known as the Madrid Protocol and came into
effect in 1998.
6However, not all of the many Antarctic Treaty nations (for example, India) have drawn up
supporting laws and regulations to control the activities of their citizens in Antarctica.
Countries such as the US, UK, Australia and New Zealand have. Nevertheless, even when
such relevant regulations and laws exist, the matter of their enforcement remains problematic.
Sovereignty disputes between a few claimant states (for example, Argentina, Chile and the
UK) may be a barrier to regulation in disputed areas. Thirdly, it is one thing to pass laws and
regulations and another to monitor compliance with these and enforce them. The cost of
policing regulations in Antarctica is high and so even when regulations exist, policing is
likely to be very limited. This is not to suggest that the Madrid Protocol has had no impact on
environmental protection in Antarctica but rather to suggest that it is of limited effectiveness.
For instance, one effect has been for nations with supporting regulations to require
environmental impact assessments (EIA) for tourist developments in Antarctica when these
are proposed by tourist businesses registered in their country (Kriwoken and Rootes, 2000).
Nevertheless, such procedures are far from seamless for reasons outlined by Kriwoken and
Rootes (2000).
IAATO and environmental conduct
Because of the slow evolution of environmental regulations in Antarctica and shortcomings
in these regulations, the International Association of Antarctica Tour Operators (IAATO), an
association of tour operators in Antarctica, has adopted a code of environmental conduct for
its members. This self-policing system is intended to reduce or better manage the
environmental impacts of tourism development in Antarctica. This is a proactive move by
IAATO which has increased the focus on environmental issues involving Antarctic tourism.
Nevertheless, self regulation is not the complete solution. While the majority of Antarctic
tour operators belong to IAATO, some are not members. Furthermore, the businesses and
vessels of some Antarctic tour operators are registered in nations that are not parties to the
Antarctic Treaty system. Thirdly, industry codes of conduct are not always complied with by
industry members or members of a relevant association. Overall, therefore, environmental
regulation in Antarctica seems to be fraught with uncertainty and lacks precision and rigour.
73. THE ANTARCTIC JOURNEY AND THE ADMINISTRATION OF THE SURVEY
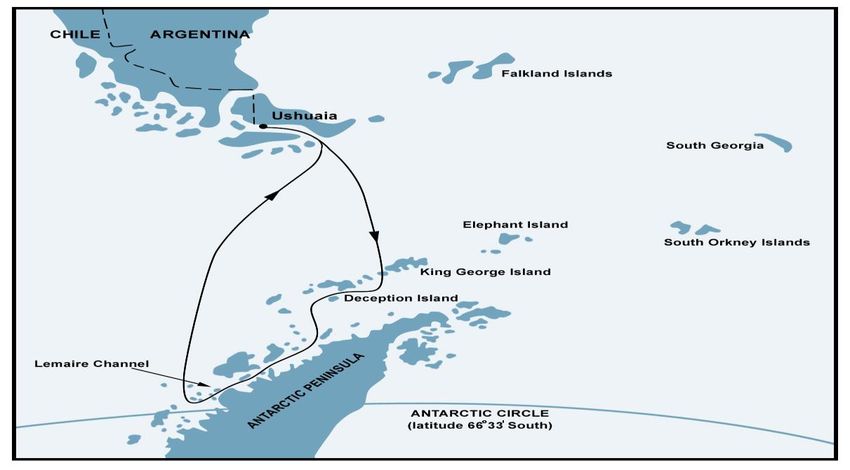
Passengers travelling on board the „Akademik Ioffe‟ to the Antarctic Peninsula were
surveyed in January 2003. The route of this journey is shown in Figure 1. Passengers
travelled by the Russian registered ship the „Akademik Ioffe‟ on a ten night‟s journey leaving
from Ushuaia port in Argentina. They crossed the Drake Passage and then travelled west of
the Antarctic Peninsula, visiting islands in the associated archipelago, and landing on the
west coast of the peninsula, before returning to Ushuaia.
Figure 1 The route of the trip undertaken by tourists surveyed for this study aboard the
‘Akademik Ioffe’
The „Akademik Ioffe‟ was one of two vessels chartered by the Australian-based Peregrine
Adventures tour company, which specialises in promoting ecologically based tours. In
relation to this tour, the company‟s website (2002) stated: “The itinerary focuses on the areas
with the greatest promise of wildlife – opportunities abound for viewing and encountering
nesting penguins and seals, and whales seem to be everywhere!”.
Two questionnaires were administered to passengers on board the „Akademik Ioffe”.
Passengers were surveyed prior to arriving in Antarctica and after their departure from
8Antarctica using similar questionnaires. This was done to detect any possible changes in their
responses as a result of their visit to Antarctica. The questionnaires are appended. Lorna
Krikwoken arranged for the survey forms to be distributed aboard the „Akademik Ioffe‟ and
for their collection on completion. He then sent these to Tisdell and Wilson for processing.
There were 68 passengers on this voyage. Fifty two survey forms were completed for the
outbound journeys and 50 on the return journeys. The response rate was high because most
respondents were accompanied, and only one survey form per touring party was requested.
4. SOCIO-ECONOMIC PROFILES OF THE RESPONDENTS AND THE COST OF
THEIR JOURNEY
A slight majority of respondents were females (51.9 per cent). Most respondents (76.9 per
cent) were accompanied but 23.1 per cent of respondents travelled alone. Only one
respondent had previously visited the South Polar Region.
The countries in which the respondents normally reside are shown in Table 4. Only one
respondent did not indicate their country of residence but otherwise all were from Western
countries, with those from Australia, Sweden and the USA accounting for most respondents.
A high number of Australians is not usual for Antarctic trips. Normally, Americans make up
the majority of travellers to Antarctica (see Tables 2 and 3). The high proportion of
Australians in our sample is a reflection of the location of Peregrine in Australia.
Table 4: In which country do you normally reside? (Pre-visit question) Distribution of
responses
Country Frequency % of total
Australia 20 38.5
Sweden 15 28.8
USA 6 11.5
UK 4 7.7
Italy 2 3.8
Switzerland 2 3.8
Austria 1 1.9
France 1 1.9
No response 1 1.9
Total 52 100
9More than half the respondents were over 50 years of age and the modal age group was 51-
60. The age distribution of respondents is shown in Table 5. Typically respondents are
„empty-nesters‟ and belong to older age groups. This accords with results from other studies.
Table 5: To what age group do you belong? (Pre-visit survey) Distribution of responses
Age in years Frequency % of total
20-30 2 3.8
31-40 8 15.4
41-50 8 15.4
51-60 17 32.7
61-70 12 23.1
71-80 2 3.8
81+ 0 0.0
No response 3 5.8
Total 52 100.0
Respondents had a high degree of education (see Table 6). This has also been found in other
studies, for example, by Kriwoken and Rootes (2000). Almost 75 per cent had university
degrees with most in this group having postgraduate degrees.
Table 6: Indicate your highest educational qualification (Pre-visit survey). Distribution
of responses
Level of education Frequency % of total
Primary only 0 .0
Some junior schooling 0 .0
Completed year 10 secondary or equivalent 1 1.9
Completed year 12 or equivalent 4 7.7
Trade certificate or equivalent 1 1.9
Diploma or equivalent 3 5.8
Degree or equivalent 16 30.8
Post-graduate degree or equivalent 22 42.3
No response 5 9.6
Total 52 100.0
The family income of most of the cruise ship passengers was found to be high. However, this
needs clarification. In the survey the respondents were asked to state their family income in
their home currency since there were many passengers from different nationalities using
various currencies. An income comparison using diverse currencies is difficult and hence, the
various currencies were converted into Australian dollars using the prevailing exchange rates
at the time. The adjusted family income levels are shown in Table 7. Of the 52 respondents,
10in the survey 77 per cent of the respondents answered this question and the rest did not. Of
the respondents who did, it is clear that the majority (60 per cent) of the respondents had an
income of more than AUS$100,000. Of those who did not have an income of more than
AUS$100,000, 17.5 per cent had a family income of more than AUS$50,000, but less than
AUS$100,000. The rest of the respondents (22.5 per cent) had an income of less than
AUS$50,000. A closer examination of data show that the majority (90 per cent) of those
having a family income less than AUS$50,000 were Swedish and close to half (44 per cent)
of them were retirees perhaps using their savings to make this journey. This partly explains
how those with less than AUS$50,000 family income could undertake an expensive journey
such as this to Antarctica. Another 44 per cent of this group belonged to the 51-60 age
category perhaps using up their savings to undertake this journey. Only 11 per cent of this
group of passengers who had a family income of less than AUS$50,000 belonged to the 20-
30 age group. These were single.. Therefore, the data show that in addition to the level of
income, other factors such as being able to use up savings, empty-nesters and being single
also influence the affordability of the journeys and that affordability is not solely explained
by income levels. Nevertheless, the results accord with the finding of Kriwoken and Rootes
(2000) that most Antarctic tourists have a high level of income or are wealthy.
Table 7: Your family income level per annum in your home currency? (Pre-visit survey)
Distribution of responses
Family income range
Number Frequency (%)
(in AUS$)
Below 25,000 1 2.5
25,001-50,000 8 20.0
50,001-75,000 6 15.0
75,001-100,000 1 2.5
100,001-125,000 8 20.0
125,001-150,000 1 2.5
150,001-175,000 2 5.0
175,001-200,000 3 7.5
200,001-225,000 3 7.5
225,001 and above 7 17.5
Total 40 100.0
Note: 12 respondents did not answer this question
Respondents indicated in the pre-visit and post-visit surveys that, on average, they would
have been prepared to pay more for their trip than they actually paid. The study tried to
determine the views of visitors about what they had actually paid for the journey and what
11they would be willing to pay after the journey. In order to make a comparison, it is necessary
to compare those who had stated how much they had actually paid and how much they were
willing to pay after the visit. There were only 33 respondents who had answered the pre- and
post-visit questions. From this limited data, it seems that the amount of money spent on the
journey was consistent with the expectations of the visitors. For example, the pre-visit mean
of expenditure by these 33 respondents was AUS$14,194 and the post-visit mean was
AUS$14,362 which is only marginally larger. These figures differ from those given in
Section 1 because those in Section 1 are based on 47 responses.
Some of the comments from respondents received after their journey about the cost of their
journey were:
Quite expensive.
It is too much!!
Just within my reach.
We spent three-quarters of our savings on this journey; a life-long dream for my
husband but still cannot justify the expense. We would have spent $15,000 for this
dream.
It was a lot of money compared to travelling to other areas of the world but a great
one off.
It was about AUS$2,000 over my budgeted amount but worth it.
Well worth it for the experience.
5. PRIOR AND POST VISIT KNOWLEDGE OF ANTARCTICA
Respondents were asked whether they considered their knowledge of Antarctica to be poor,
average, good or excellent. Most considered their knowledge before their visit to be average
but after their visit, most rated their knowledge of Antarctica as good, a rating above the
average. In general, there was a sharp rise in the perceived level of knowledge of respondents
about Antarctica. Weighting poor as one, average as 2, good as 3 and excellent as 4, the
weighted average of knowledge of respondents of Antarctica rose from 2.23 pre-visit to 2.84
following their visit. The upward shift in the distribution is evident from Table 8.
12Table 8: Do you regard your current knowledge of Antarctica/sub-Antarctica as
excellent, good, average or poor? Distribution of responses
Rating Pre-Visit Post-Visit
Frequency % Frequency %
Excellent 1 1.9 3 6
Good 16 30.8 38 76
Average 29 55.8 7 14
Poor 6 11.5 2 4
Total 52 100.0 50 100
(a)Index of knowledge 2.23 2.84
(a) Index of knowledge calculated using the following weights:
Excellent knowledge = 4
Good knowledge = 3
Average knowledge = 2
Poor knowledge or no response = 1
Prior to their visit, just under 40 per cent of respondents said that they had read widely about
Antarctica and around 55 per cent said they had watched many TV programmes on
Antarctica. Nevertheless, a substantial proportion of the respondents did not have such
exposure before their journey. In other words, many of these tourists were not well informed
about Antarctica before their journey. This diversity of knowledge of buyers (tourists) about
tourist attractions and its imperfection is consistent with findings reported in Chapters 7 and 8
(Tisdell and Wilson, forthcoming). It is not taken into account in neoclassical economic
theories of choice by consumers or tourists.
6. THE IMPORTANCE TO TOURISTS OF VIEWING ANTARCTIC WILDLIFE
PRE- AND POST-VISIT AND THEIR STATED SATISFACTION EXPECTED
AND OBTAINED
Prior to their visit, 94.2 per cent of respondents said they were interested in Antarctic wildlife
and 5.8 per cent said they were not. Of those interested in Antarctic wildlife, their greatest
interest was shown in penguins, followed by whales and dolphins, and then seals.
The stated interest of respondents in Antarctic wildlife species before and after their visit is
shown in Table 9. Penguins continued to be of greatest interest and whales and dolphins of
second highest interest after the journey. A major change, however, was the very substantial
13rise in valuations of sea birds (other than penguins) following the visit of respondents to
Antarctica. Most respondents said that they became more interested in Antarctic wildlife
following their visit.
Table 9: If you are interested in Antarctic wildlife, is your interest mainly in which
species listed? (You may tick more than one box) Distribution of responses
Type of wildlife Pre-Visit Post-Visit
Frequency % Frequency %
All wildlife 33 32.7 24 25.8
Penguins 27 26.7 25 26.9
Whales and dolphins 24 23.8 18 19.4
Seals 14 13.9 10 10.8
Other polar seabirds 3 3.0 16 17.2
Total 101 100.0 93 100.0
The majority of respondents suggested that a special feature of Antarctic wildlife is that most
species do not occur elsewhere. The proportion saying this was about the same before and
following their visit. Prior to their visit to Antarctica about 40 per cent of respondents said
that Antarctic wildlife can be easily seen in large numbers whereas after their visit this rose to
54 per cent. While the majority of respondents stated on their outbound journey that the
adaptations of Antarctic wildlife would be a special attraction, only a half said this on the
return journey. As for other features and comments, on the outward journey some
respondents said they would be able to get close to the wildlife and many thought that it
would be a special attraction to see Antarctic wildlife in its natural environment. Getting
close was not, however, mentioned in the post-visit survey responses but seeing wildlife in
their own environment was. One respondent said that the journey enabled him/her to see
several new bird species for the first time.
Following their cruise, 94 per cent of respondents said that they had learnt more about
Antarctica and its wildlife as a result of their cruise and 76 per cent said that they had become
more aware of conservation issues involving Antarctica wildlife. Nearly all (94 per cent)
were in favour of conserving Antarctic wildlife, none expressed opposition to it but 6 per cent
did not respond.
14The importance placed by respondents on seeing Antarctic wildlife increased as a result of
their cruise, see Table 10. This result is also supported by the increase in the weighted
average of the importance of seeing wildlife. To calculate this index „no response‟ or „of no
importance‟ responses are weighted as zero, „not very important‟ as 1, „important‟ as 2, and
„very important‟ as 3. This index increased from 2.48 prior to the journey to 2.66 after it.
Although 70 per cent of respondents were satisfied with their wildlife watching experience in
Antarctica, 30 per cent were not satisfied.
Table 10: Responses to the questions: (Pre-Visit): How important was the possibility of
seeing Antarctic/Sub-Antarctic wildlife in your decision to come on this
journey? (Post-Visit): How important was seeing Antarctic/Sub-Antarctic
wildlife during this cruise? Distribution of responses
Rating Pre-Visit Post-Visit
Frequency % Frequency %
Very important 32 61.5 37 74
Important 13 25.0 11 22
Not very important 7 13.5 0 0
Of no importance or no
response 0 0.0 2 4
Total 52 100.0 50 100
(a)Index of importance 2.48 2.66
(a)Index is calculated on the basis that
Not important or No response = 0,
Not very important = 1,
Important = 2,
Very important = 3
The importance of Antarctic wildlife as an attraction for Antarctic tourists is evident from
responses to a pre-visit question. Respondents were asked: „If there was no wildlife to be seen
in the South Polar Region, would you have still decided to come on this cruise, given your
present costs‟. The majority (61.5 per cent) said „No‟, 34.6 per cent said „Yes‟ and 3.8 per
cent did not respond. Furthermore, 53.1 per cent of those saying „No‟ said that they would
not come on this cruise even if it were much cheaper should there be no Antarctic wildlife.
Some of the reasons given by those who said they would have decided to join the cruise even
in the absence of Antarctic wildlife are as follows:
The ruggedness/isolation/ice/wind etc, landscapes.
Because I am also interested in geology/science.
15Wonderful scenery.
To see scenery in the region, ice, etc.
More to see than I thought.
Probably if the landscape is beautiful.
It would have been a travelling option.
Interest in photography (scenery) and plants.
Fascinated by the icebergs and sheer isolation.
The nature, landscape is …. There.
Comments from those who said they would not join the cruise in the absence of Antarctic
wildlife were as follows:
Would not be a complete experience.
Wildlife factor is most important.
Wherever I go wildlife is my major interest along with people and cultural
differences.
Can visit glaciers/national parks for much fewer dollars without requirement of a boat
trip.
For me, the interactive behaviour of wildlife with its environment is very important to
see/understand.
Wanted to see wildlife.
Absolutely impossible to say, completely theoretical question, we go for the existing
Antarctica as it is.
Ice I can see at home.
Appearance/experience of ice alone is not sufficient.
Following their cruise, however, 50 per cent of respondents stated that they would still have
enjoyed their cruise if they had not seen any wildlife, 34 per cent said they would not have
and 16 per cent did not reply. While many respondents still said they would have enjoyed
their cruise in the absence of wildlife, it is nonetheless clear that for most, wildlife is a highly
significant contributor to their willingness to visit Antarctica and to the level of their
enjoyment of it.
16On the outward journey, all respondents expected to see whales and dolphins, penguins,
seals, and all (except one) expected to see polar seabirds, other than penguins. Respondents
were asked to say how much seeing this wildlife would add to their satisfaction along a scale
of „not at all‟, „a little‟, „much‟ and „very much‟. Whales, dolphins and penguins topped the
list in terms of expected added satisfaction, followed by seals and their relatives, and then
polar seabirds other than penguins. Nearly all respondents said after their Antarctic visit that
they had seen those species. The added satisfaction they claimed to have obtained by seeing
them, accorded with their original expectations about how much relative extra satisfaction
they would obtain if they saw these species. Seeing whales and dolphins was said (on
average) to add most to satisfaction followed by penguins, seals and their relatives, and then
polar birds (other than penguins). These results are summarised in Table 11.
Table 11: Index(a) of satisfaction anticipated from seeing Antarctic wildlife species based
on responses to the following question: Pre-Visit (Q9). Please tick in the
second column if you expect to see any of the following wildlife in Antarctica
or Sub-Antarctica during this cruise. Would it increase your satisfaction (1) a
little; (2) much; (3) very much; or (4) not at all to see the following wildlife?
Please put the appropriate number in the last column. Post –Visit (Q6). Tick
in the second column if you saw any of the following wildlife in Antarctica or
Sub-Antarctica during this cruise. Did they increase your satisfaction (1) a
little; (2) much; (3) very much; or (4) not at all to see the following wildlife?
Pre- Post- Change in % variation
Type of wildlife
Visit Visit value of index in index
Whales and dolphins 2.33 2.19 -0.14 -6.01
Penguins 2.31 2.15 -0.16 -6.93
Seals (and relatives) 1.98 1.96 -0.02 -1.01
Polar seabirds (other than penguins) 1.71 1.66 -0.05 -2.92
(a)
Index of added satisfaction calculated using the following weights:
Very much =3
Much = 2
A little = 1
Not at all/No response = 0
Nevertheless, one should be cautious in drawing conclusions from Table 11 for the reasons
discussed in Chapter 1 (Tisdell and Wilson, forthcoming). This is because the responses are
based on an ordinal (and to some extent subjective) Likert-like scale. In calculating the index,
it is assumed to be legitimate to assign cardinal values to the responses and weight these to
calculate a simple average. Nevertheless, the results are consistent with the view that
penguins and whales (including dolphins) are the major wildlife attractions for tourists
17visiting Antarctica and that seeing seals and polar seabirds (other than penguins) is an
additional attraction.
7. VALUATION OF FEATURES OF THE ANTARCTIC CRUISE AND CHANGES
IN ATTITUDES TO CONSERVATION
Respondents were requested to rank various features of their cruise prior to their visit to
Antarctica and to rank the same set of features after their visit using a scale of „very
important‟, „important‟, „not very important‟ or „of no importance‟. Weighting these rankings
as 3, 2, 1 and zero respectively and treating a non-response as indicating „no importance‟, the
weighted means before and after visits to Antarctica are as set out in Table 12.
Table.12: Average weighted indices (a) of importance to respondents of features or
attributes of Antarctica/Sub-Antarctica prior to and following their visit.
Changes in indices are also shown.
Pre- Post- Change in %
Visit Visit value variation in
Features
index index of index index
Landscapes and seascapes 2.75 2.74 -0.01 -0.36
Wildlife 2.60 2.56 -0.04 -1.54
Different or unique environment 2.58 2.52 -0.06 -2.33
Unspoilt wilderness 2.58 2.48 -0.1 -3.88
Antarctic summer 2.12 1.94 -0.18 -8.49
The thrill of expedition 1.98 1.90 -0.08 -4.04
Continent without permanent human
habitations 1.69 1.82 0.13 +7.69
Few others have visited it 1.50 1.52 0.02 +1.33
Connections with explorers 1.40 1.40 0 0.00
Ship cruise pleasures 0.73 1.20 0.47 +64.38
(a)
Index of importance calculated using the following weights:
Very important = 3
Important = 2
Not very important = 1
Of no importance/No response = 0
From Table 12, it can be seen that respondents ranked Antarctic landscapes and seascapes as
the most important feature (both pre- and post-visit) followed by wildlife. Various Antarctic
cruise features are also ranked in Table 12 by the index of importance given to them by
respondents before their Antarctic visit. On average, the rank ordering by respondents
18remained the same after their visits as before their visits. While most indices of importance
showed little change before and after the Antarctic visit by respondents, a few showed
substantial variation. Appreciation of ship cruise pleasures increased by a comparatively large
amount and the fact that Antarctica is a continent without permanent human habitation also
increased as did, to a small extent, the realisation that few others have visited Antarctica.
Most other items showed only small declines in their ratings of importance. However, the
importance of the Antarctic summer as an attraction showed a decline of around eight per
cent, as measured by the index of importance.
There was an increase in the degree of advocacy of respondents of nature conservation
following their visit to Antarctica, as can be seen from Table 13. However, the index in Table
13 fails to indicate fully the extent to which tourists increased their advocacy of conservation
after visiting Antarctica. If non-responses are ignored (and not treated as showing a neutral
attitude towards conservation), the index of advocacy of conservation rises from 1.58-1.77
following the visit of tourists to Antarctica. More significantly, there is a sharp rise in the
proportion of respondents saying they are either extremely strong or strong advocates of
conservation. Their proportion rises from 50% before the visit to Antarctica to 70.2%
following this visit. Furthermore, whereas some respondents expressed a neutral attitude to
conservation prior to their visit to Antarctica, all respondents expressed positive support for
conservation following their visit. It is, therefore, safe to conclude their visit to Antarctica
fostered a pro-conservation attitude among responding travellers. The results therefore, lend
support to Eric Lindblad‟s view that experiences of tourists in Antarctica can generate
increased support for conservation. However, the strength of the conservation stimulus from
this experience may decay with the passage of time in accordance with the theory outlined by
Tisdell et al. (2008). Because our survey was administered to tourists soon after their visit to
Antarctica, support for Antarctic conservation may have been at a high level then.
19Table 13: Attitudes of respondents to nature conservation based on responses to pre-visit
and post-visit questions. Pre-Visit (Q8). How would you rate your attitude
towards conservation. Post-Visit (Q14). How would you rate you attitudes
towards nature conservation after your experience of Antarctica. Distribution
of responses
Attitude to nature conservation Pre-Visit Post-Visit
Frequency % Frequency %
Extremely strong advocate 6 11.5 3 6
Strong advocate 20 38.5 30 60
Moderate advocate 24 46.2 14 28
Neutral towards this subject 2 3.8 0 0
More oriented towards
development than conservation 0 0 0 0
No response 0 0 3 6
Total 52 100 50 100
Index of environmental advocacy(a) 1.58 1.66
(a)Index of environmental advocacy calculated with the following weights:
Extremely strong advocate = 3
Strong advocate = 2
Moderate advocate = 1
Neutral towards this subject = 0
No response = 0
More oriented towards development than conservation = -1
On the whole, the importance placed by respondents on natural environments and wildlife in
Antarctica as a part of their cruise expectations and experience appear to be much the same
before their visit and following it. There was, however, an increase in their advocacy of
nature conservation following their visit to Antarctica. In addition, expectations about seeing
different species of Antarctic wildlife and stated realisation of satisfaction from doing so
were quite similar in both pre- and post-visit.
8. OPINIONS OF RESPONDENTS ABOUT VARIOUS ENVIRONMENTAL ISSUES
INVOLVING ANTARCTICA
Several environmental issues involving Antarctica were raised with respondents by asking
similar questions before their visit and following it. This was done to assess the general
attitudes of respondents to such issues and to detect any changes as a result of their visit to
Antarctica.
20Before their visit, 80.8 per cent of respondents said that they believe that global warming is
melting icebergs in Antarctica. This fell slightly to 76 per cent in the post-visit survey.
However, there was a slight increase in the percentage of respondents saying that they would
like more action to be taken to reduce such melting. Almost 95 per cent of those respondents
who were convinced that global warming is melting Antarctic icebergs thought that more
action should be taken to reduce such melting (see Table 14).
Table 14: If you believe global warming is melting icebergs in Antarctica, would you
like action to be taken to reduce such melting? Distribution of responses
Response Pre-Visit Post-Visit
Relative frequency % Relative frequency %
Yes 92.9 94.7
No 0.0 2.6
No response 7.1 2.6
Total 100.0 100.0
Around 75 per cent of the respondents were opposed to krill harvesting in Antarctica but 9.6
per cent favoured it in the pre-visit survey. Those in favour rose to 14 per cent in the post-
visit survey (see Table 15).
Table 15: Do you think that krill harvesting should continue in Antarctica? Distribution
of responses
Response Pre-Visit Post-Visit
Relative frequency % Relative frequency %
Yes 9.6 14
No 75.0 74
No response 15.4 12
Total 100.0 100
Most respondents (over 90 per cent) were opposed to Antarctica‟s vast non-living natural
resources (eg. petroleum, minerals, water) being commercially exploited for consumptive
use. This is evident from Table 16.
21Table 16: Are you in favour of Antarctica’s vast resources (eg. petroleum, minerals,
water) being exploited? Distribution of responses
Response Pre-Visit Post-Visit
Relative Frequency % Relative Frequency %
Yes 0.0 2
No 92.3 94
No response 7.7 4
Total 100.0 100
Furthermore, over 90 per cent of respondents wanted Antarctica to be preserved in a pristine
state (see Table 17), with a slight rise in this percentage being evident following the visits by
respondents. The most frequently given reason was because it was seen as unique (see Table
18). The mere knowledge that Antarctica would remain unspoilt was also frequently
mentioned as a reason for preserving it in a pristine state (existence value), as well as its
influence on the Earth‟s climate, an indirect use value. The desire to retain the uniqueness
and unspoilt character of Antarctica reflects the non-use values. Use values such as tourism
potential and conservation of resources for future use were mentioned very infrequently as a
reason for wanting to conserve Antarctica in a pristine state. Bequest and altruistic values („I
would like my children and others to enjoy it‟) were mentioned relatively frequently. No
major changes (between responses on the outward journey and the return one) occurred in the
relative frequencies with which the reasons were given for wanting to conserve Antarctica in
a pristine state. There was very little support for the conservation of Antarctica‟s resources
for future (consumptive) use.
Table 17: Do you want Antarctica (including wildlife, plant life and its landscape) to be
preserved in its pristine state? Distribution of responses
Response Pre-Visit Post-Visit
Relative frequency % Relative frequency %
Yes 92.3 94
No 1.9 4
No response 5.8 2
Total 100.0 100
22Table 18: The distribution of reasons given by those who said they want Antarctica
(including its wildlife, plant life and its landscape) to be preserved in its
pristine state
Reason Pre-Visit Post-Visit
% of Total % of Total
Frequency Frequency
responses responses
It is unique 46 28.9 47 29.2
It has a large influence on the
Earth‟s climate 38 23.9 37 23.0
I would like to know that it
could remain unspoilt 36 22.6 37 23.0
I would like my children and
others to enjoy it 26 16.4 28 17.4
It has tourism potential 7 4.4 7 4.3
It has great resources that
could be used in the future 6 3.8 5 3.1
Total 159 100.0 161 100.0
Opinions were divided about whether there should be increased tourism activity in
Antarctica. Around half of respondents were against it whereas about 40 per cent favoured it.
The results are summarised in Table 19.
Table 19: Are you in favour of increased tourism in Antarctica? Distribution of
responses
Response Pre-Visit Post-Visit
Relative frequency % Relative frequency %
Yes 40.4 38
No 50.0 54
No response 9.6 8
Total 100.0 100
Comments by those respondents who favoured increased tourism into Antarctica included the
following:
It is inevitable, need to be proactive in developing an action plan.
Public awareness.
If environmental impact is managed.
Good education.
Controlled tourism allows populations to experience this wilderness and will motivate
them to help preserve it.
23To give others the opportunity to experience Antarctica as we have.
People who have seen Antarctica will probably be in favour of preserving it.
Awareness.
The unique experience.
Done in sensitive ways to inform the world about this treasure.
Learning.
It was great to see it.
If controlled.
To get to understand it.
To encourage more donations and better protection of wildlife.
Comments by respondents who opposed increased tourism to Antarctica included the
following:
Inevitable damage.
Difficult to control.
Increased tourism can only mean increased impact on wildlife and environment.
Not to disturb wildlife.
Increased activity likely to result in increased impact.
Limit the numbers to preserve wilderness.
Would spoil it.
More people than come now could have an adverse effect.
Seems to be well managed at existing tourism levels.
At present there seems to be no impact analysis.
Consequences.
Not to damage and disturb wildlife.
Save the nature.
Mass tourism will damage some spots at least.
Damage.
Not to spoil Antarctica.
More chance of damage.
Pollution.
24Environmental issue.
To maintain environment.
Greater risk of pollution and damage to ecosystems.
Disturbance of wildlife.
Keep it pristine/pure.
Destruction to environment.
A high proportion of respondents (around 90 per cent) favour the Antarctic continent and
surrounding seas being declared a world park and for it to be managed under the auspices of
the United Nations and/or by the twelve Antarctic Treaty Nations. [These are the original
claimant nations and do not include all Antarctic Treaty Nations]. Although there was some
increase in opposition to this in the post-visit survey, no major change is apparent (see Table
20).
Table 20: Are you in favour of the Antarctic continent and surrounding seas being
declared a world park and managed under the auspices of the United Nations
and/or by the twelve Antarctic Treaty nations? Distribution of responses
Response Pre-Visit Post-Visit
Relative frequency % Relative frequency %
Yes 90.4 88
No 1.9 6
No response 7.7 6
Total 100.0 100
Respondents were in addition asked „If an organisation such as the United Nations were to
raise money to declare Antarctica and the surrounding seas as a world park and conduct
further research into its unique wildlife and landscapes/seascapes, would you be willing to
make an annual contribution for the next ten years‟? The percentage of respondents‟ pre-visit
who said „Yes‟ was 46 per cent and this rose to 54 per cent post-visit. Those who said „No‟
declined from 52.7 per cent pre-visit to 26 per cent post-visit whereas the percentage of non-
respondents declined slightly. The results are shown in Table 21.
25Table 21: If an organisation such as the United Nations were to raise money to declare
Antarctica and its surrounding seas as a world park and conduct further
research into its unique wildlife and landscape/seascapes, would you be
willing to make an annual contribution for the next ten years? Distribution of
responses
Response Pre-Visit Post-Visit
Relative frequency % Relative frequency %
Yes 46.2 54
No 32.7 26
No response 21.2 20
Total 100.0 100
Reasons given by those who said they would not contribute included the following:
I prefer to make donations to charities that improve the lives of humans.
Money should come from countries involved in Antarctic Treaty.
I would need to know what the purpose of the contribution is first.
Should be funded by states in the UN.
Study funding should be supported by tourism access (charge per visit).
This is a state/government responsibility.
Would give to other priorities.
My first option is the Scandinavian area.
Can‟t make decisions based on a 10 year plan.
It is worth noting that under The Protocol to the Antarctic Treaty on Environmental
Protection (Madrid Protocol) Article 2 declares that “The Parties commit themselves to the
comprehensive protection of the Antarctic environment and dependent and associated
ecosystems and hereby designate Antarctica as a natural reserve, devoted to peace and
science”. Hence, it is a declared natural reserve. This in itself, however, does not ensure that
it is managed as a strict nature reserve and that its pristine nature will necessarily be
preserved.
269. A SUMMARY OF THE SURVEY RESULTS
Representatives of virtually all travellers on the „Akademik Ioffe‟ completed the questions for
this survey during their journeys to and from Antarctica for two of its trips in January 2003.
Respondents were found, on the whole, to be relatively well-off economically, to be well
educated and typically they were over 50 years of age. Prior to their visit most respondents
regarded their knowledge of Antarctica to be „average‟, but this rose to „good‟ following their
visit.
Prior to their visit, most respondents (86.5 per cent) thought that the presence of Antarctic
wildlife was a very important or an important reason for their joining the cruise, although
13.5 per cent thought it was not a very important reason for this. After their visit, 96 per cent
of respondents stated that seeing Antarctic wildlife was a very important or an important
feature of their cruise and no one stated that it was not very important. However, two
individuals did not respond. Answers by respondents indicated that (on the whole) their
valuation of the importance of Antarctic wildlife as an attraction rose as a result of their
cruise. Penguins vied with whales and dolphins as being of particular interest or importance
to the responding tourists. Seeing these animals added most to the satisfaction of respondents.
Most ratings of respondents about the importance of natural attributes or features of
Antarctica and their cruise remained relatively unchanged before and after their visit.
Landscapes and seascapes were on average rated as most important in relation to this cruise
both before and after visits to Antarctica, followed in importance by wildlife. The attributes
of „different or unique environment‟ and „unspoilt wilderness‟ continued to be highly ranked
in importance both pre- and post-visit. The largest comparative increase in importance
following the visit was for „ship cruise pleasures‟. Attitudes of respondents in favour of
environmental conservation strengthened considerably following their visit to Antarctica.
As for environmental policy in Antarctica, nearly all respondents thought that more action
should be taken to reduce the melting of icebergs as a result of global warming, most were
against the consumptive use of Antarctica‟s natural resources, and most favoured the
conservation of Antarctica in a pristine state. Attitudes in relation to these matters did not
change very much after the visit of respondents to Antarctica. Support by respondents for
these objectives was already high prior to their visit and although support for these objectives
27rose the scope for an increase was small. While there is some difficulty in interpreting
reasons given by respondents for wanting to conserve Antarctica in a pristine state, non-use
economic values appear to be of predominant importance.
Respondents were divided about whether there should be increased tourism activity in
Antarctica. A half of the respondents were against it prior to their trip to Antarctica and this
increased slightly following their visit. On the other hand, 40 per cent of respondents said
prior to their visit to Antarctica that they favoured increased tourism activity in Antarctica but
this fell slightly (to 38%) following their visit. Many of those who favoured increased
tourism in Antarctica qualified their answer, for example, by saying that safeguards should be
imposed to ensure that the increased tourism does not jeopardise environmental conservation.
Around 90 per cent of respondents favoured the declaration of the Antarctic and surrounding
seas as a world park managed under the auspices of the United Nations and/or by the twelve
Antarctic Treaty nations. However, only about half of respondents said that they would be
prepared to donate funds for this enterprise. There was, however, some increase in the
proportion of respondents who said they were willing to donate once they had visited
Antarctica. In addition, although a third of respondents said they would not donate when
asked prior to their visit to Antarctica, this fraction fell to a quarter after their visit. Since the
question of the contribution is hypothetical, upward bias may be present in the respondents‟
expressed willingness to donate funds to support the creation of and maintain an Antarctic
world park. Nevertheless, very strong support clearly exists amongst this sample of tourists
for the idea that the Antarctic continent and surrounding seas should be a world park
managed under the auspices of the United Nations and/or by the twelve Antarctica Treaty
nations. About 90 per cent of respondents favoured this proposal. This is consistent with the
view that most tourists to Antarctica are likely to be advocates of its environmental
conservation even prior to visiting it.
It seems that visits to Antarctica by the tourists sampled tended to reinforce their pre-existing
values and to a considerable extent, their preconceptions. It is possible that tourist
experiences may reinforce the preconceptions of most tourists about the places they visit.
Differences between pre- and post-tourist expectations and valuations are worthy of more
investigation because diverse reactions are possible. For example, depending upon their
predisposition, some tourists may typically rate their tourism experience as positive and
28others may normally rank it as negative after the event: some normally tend to give praise and
others might typically be grumblers. Such psychological factors have important implications
for the import and validity of stated preference methods of valuation, for example, for the
results obtained by applying the contingent valuation method. Fortunately, economists are
paying increasing attention to psychological factors and observed behavioural patterns as
influences on human behaviour and valuation. Therefore, reliance on introspection as a basis
of economic theory is becoming less common.
10. CONCLUDING COMMENTS
Antarctic tourists in large numbers can endanger the relatively pristine state of Antarctica,
especially in the absence of appropriate environmental management. Furthermore, apart from
the volume of visitors to Antarctica, the geographical distribution of their visits is very
important. Presently, tourism is concentrated on the Antarctic Peninsula and particularly on a
few tourist „hotspots‟ there, and nearly all such spots are shoreline and coastal ones (Barrio
and Roldaln, 1997).
While a voluntary association of Antarctic tourist operators exists, [International Association
of Antarctica Tour Operators, (IAATO)] with a code of conduct favourable to environmental
conservation, not all Antarctic tourism operators belong to it. Furthermore, it is not known
how rigorously members observe the code of conduct of IAATO. In addition, the nature and
extent of cumulative-type impacts associated with Antarctic tourism have not been
adequately studied.
Johnson and Kriwoken (2009, p.7) that
“Increasing operations [in Antarctica and sub-Antarctica] by non-IAATO members
threatens Australia‟s policy reliance on industry self-regulation and will prove
difficult for Australian policy makers to ignore, particularly in light of the potential
resource implications. It is anticipated that Australia may be expected to take a more
active regulatory role when assessing non-IAATO operator proposals. Consideration
should be given to incorporating IAATO operating standards and procedures into
the Australian legal framework”.
29You can also read