Modeling Least Bell's Vireo Habitat Suitability in Current and Historic Ranges in California - Open-File Report 2020-1151
←
→
Page content transcription
If your browser does not render page correctly, please read the page content below
Wildlife Program

Modeling Least Bell’s Vireo Habitat Suitability in Current and
Historic Ranges in California

Open-File Report 2020–1151

U.S. Department of the Interior
U.S. Geological Survey

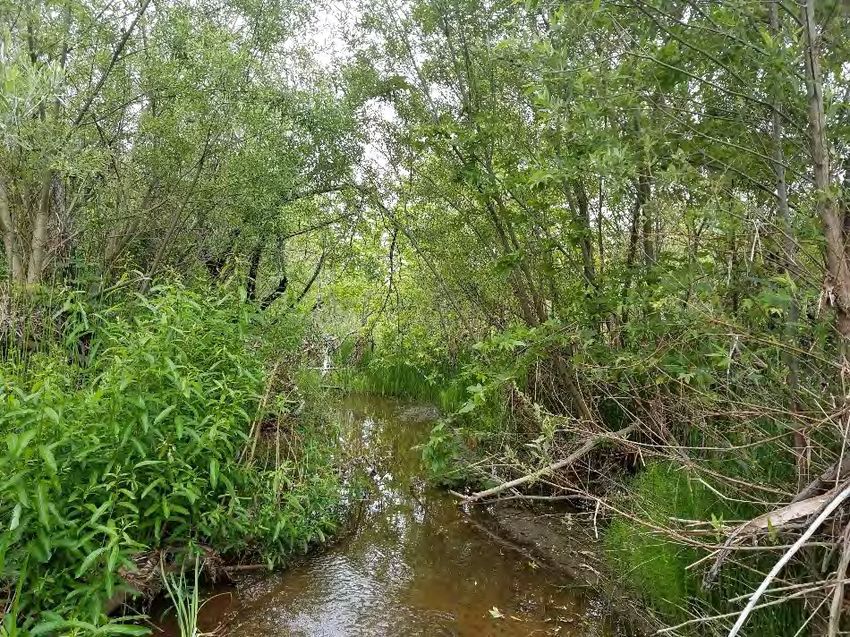
Cover Photos: (Front) A male vireo incubating a nest in the “Mars” territory on the Middle San Luis
River. Photograph taken by Alexandra Houston, U.S. Geological Survey Western Ecological Research
Center, June 15, 2012.

(Back) Least Bell’s Vireo habitat, looking east along De Luz Creek. Photograph taken by Barbara Kus,
U.S. Geological Survey Western Ecological Research Center, May 13, 2019.
Modeling Least Bell’s Vireo Habitat
Suitability in Current and Historic Ranges
in California

By Kristine L. Preston, Barbara E. Kus, and Emily Perkins

Wildlife Program

Open-File Report 2020–1151

U.S. Department of the Interior
U.S. Geological Survey
U.S. Geological Survey, Reston, Virginia: 2021 For more information on the USGS—the Federal source for science about the Earth, its natural and living resources, natural hazards, and the environment—visit https://www.usgs.gov or call 1–888–ASK–USGS. For an overview of USGS information products, including maps, imagery, and publications, visit https://store.usgs.gov/. Any use of trade, firm, or product names is for descriptive purposes only and does not imply endorsement by the U.S. Government. Although this information product, for the most part, is in the public domain, it also may contain copyrighted materials as noted in the text. Permission to reproduce copyrighted items must be secured from the copyright owner. Suggested citation: Preston, K.L., Kus, B.E., and Perkins, E., 2021, Modeling Least Bell’s Vireo habitat suitability in current and historic ranges in California: U.S. Geological Survey Open-File Report 2020–1151, 44 p., https://doi.org/10.3133/ofr20201151. Associated data for this publication: Preston, K.L., Kus, B.E., and Perkins, E.E., 2019, Least Bell’s Vireo habitat suitability model for California (2019): U.S. Geological Survey data release, https://doi.org/10.5066/P90T9WT2. ISSN 2331-1258 (online)
iii

Acknowledgments
We are grateful to the National Fish and Wildlife Foundation and Bureau of Land Management
for funding the project. We thank our partners in the Collaborative Wildlife Protection and
Recovery Initiative for their support of the project.

Thank you to U.S. Geological Survey colleagues, Ryan Pottinger and Shannon Mendia, for
compiling vireo location and Geographic Information System datasets. We appreciate helpful
comments by U.S. Geological Survey reviewers Jeff Tracey and Steven Hanser that improved
the report.
v
Contents
Acknowledgments����������������������������������������������������������������������������������������������������������������������������������������iii
Abstract�����������������������������������������������������������������������������������������������������������������������������������������������������������1
Introduction����������������������������������������������������������������������������������������������������������������������������������������������������1
Methods����������������������������������������������������������������������������������������������������������������������������������������������������������3
Study Area���������������������������������������������������������������������������������������������������������������������������������������������3
Data���������������������������������������������������������������������������������������������������������������������������������������������������������3
Least Bell’s Vireo Data����������������������������������������������������������������������������������������������������������������3
Environmental Variables�������������������������������������������������������������������������������������������������������������8
Modeling Approach������������������������������������������������������������������������������������������������������������������������������8
Model Selection and Evaluation������������������������������������������������������������������������������������������������������10
Model Construction�������������������������������������������������������������������������������������������������������������������10
Quantitative Model Evaluation in the Current Range of Southern California������������������11
Model Evaluation in the Historic Range���������������������������������������������������������������������������������11
Qualitative Evaluation������������������������������������������������������������������������������������������������������11
Quantitative Evaluation����������������������������������������������������������������������������������������������������12
Using the Model to Assess Suitable Habitat����������������������������������������������������������������������������������12
Results�����������������������������������������������������������������������������������������������������������������������������������������������������������12
Southern California and California Environmental Grids�������������������������������������������������������������12
Southern California Habitat Modeling Results������������������������������������������������������������������������������12
Selected Model Performance and Environmental Conditions in California’s
Historic Range�����������������������������������������������������������������������������������������������������������������������13
Amount of Suitable Habitat and Conservation in California��������������������������������������������������������21
Discussion�����������������������������������������������������������������������������������������������������������������������������������������������������21
Interpreting Model Results���������������������������������������������������������������������������������������������������������������21
Application of Model to Conservation and Management������������������������������������������������������������22
References Cited�����������������������������������������������������������������������������������������������������������������������������������������23
Appendix 1. Vegetation Maps for Various Geographic Areas of California and Selected
Riparian Vegetation Community Categories Used to Model Least Bell’s Vireo Habitat�����26
Appendix 2. Twenty Top Performing Least Bell’s Vireo Habitat Suitability Models�����������������������29
Appendix 3. Suitable Habitat in California and Conservation Levels by County and
Hydrological Unit Code 8 Watersheds����������������������������������������������������������������������������������������32
Figures
1. Map showing California and southern California study areas with modeling
extents defined by riparian vegetation communities potentially used by Least
Bell’s Vireos and buffered 500 meters by other types of land cover������������������������������������4
2. Map showing southern California Least Bell’s Vireo spatially distinct location
datasets for constructing alternative models and evaluating performance����������������������6
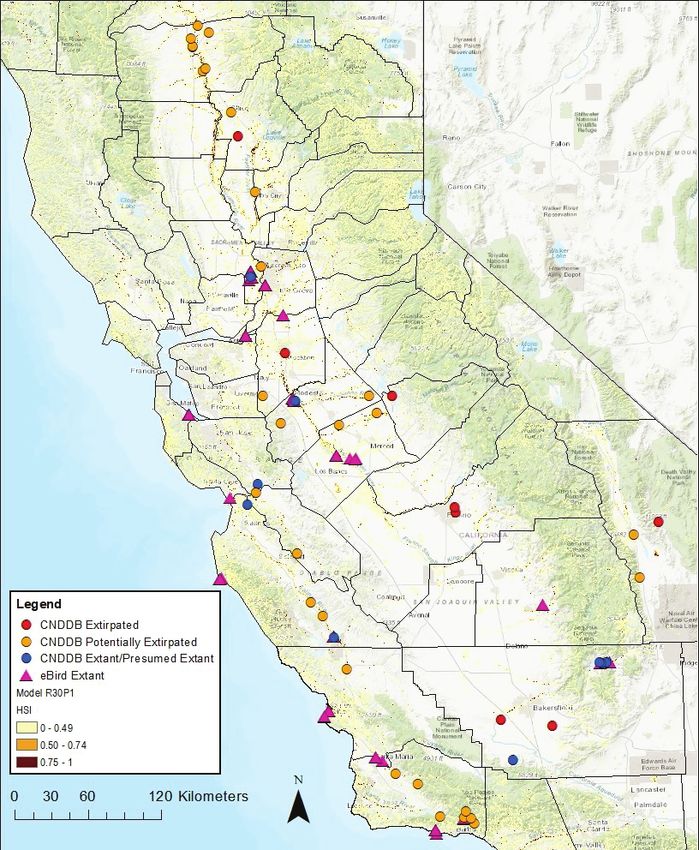
3. Map showing California Least Bell’s Vireo California Natural Diversity Database
historic and recent observations and eBird recent observations used to
qualitatively evaluate model predictions in the historic range���������������������������������������������7
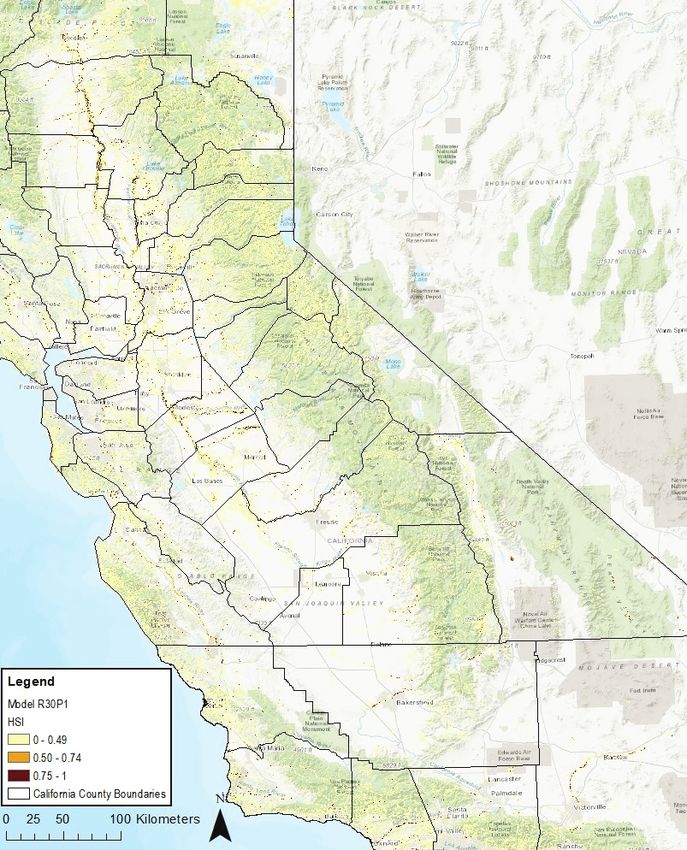
4. Map showing model R30-P1 habitat suitability predictions for the current range
in southern California�����������������������������������������������������������������������������������������������������������������14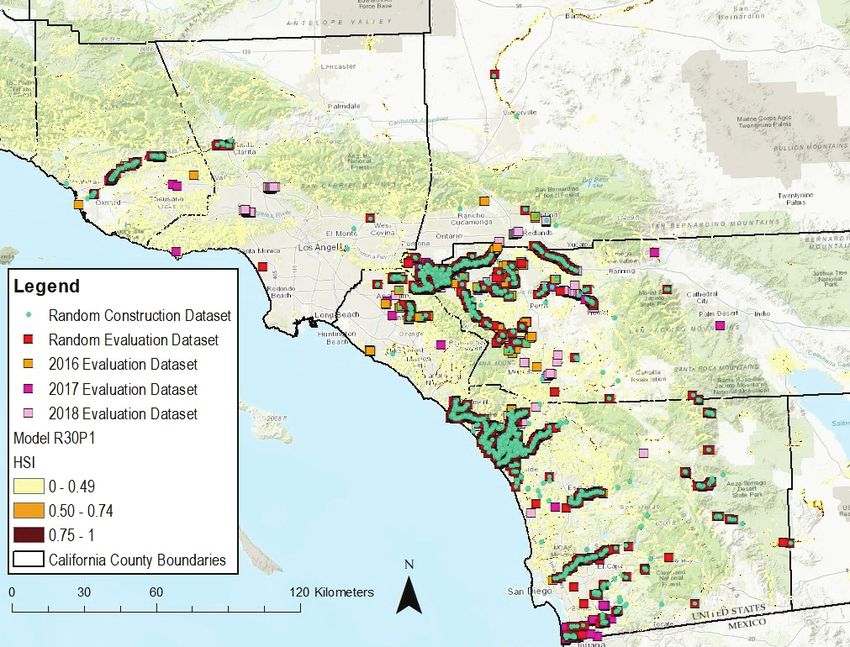
vi
5. Map showing model R30-P1 habitat suitability predictions for the historic range
in California����������������������������������������������������������������������������������������������������������������������������������15
6. Map showing model R30-P1 habitat suitability predictions and Least Bell’s Vireo
1990–2018 locations used to construct and evaluate models for the current
range in southern California�����������������������������������������������������������������������������������������������������16
7. Map showing model R30-P1 habitat suitability predictions for the historic range
in California����������������������������������������������������������������������������������������������������������������������������������17
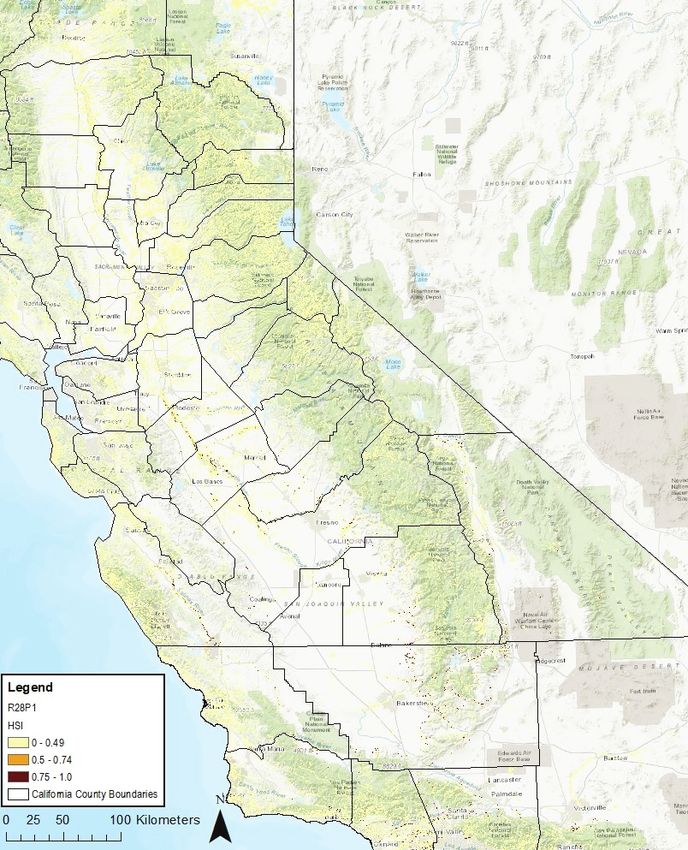
8. Map showing model R28-P1 habitat suitability predictions for the current range
in southern California�����������������������������������������������������������������������������������������������������������������18
9. Map showing model R28-P1 habitat suitability predictions for the historic range
in California����������������������������������������������������������������������������������������������������������������������������������19
Tables
1. Least Bell’s Vireo location datasets used for habitat modeling with sources
of observations, total number of observations per dataset, and how datasets
were used in model construction and evaluation in the current and historic ranges������5
2. Description of variables included in the southern California and California
environmental grids to create alternative Least Bell’s Vireo models����������������������������������9
3. Environmental variable means and standard deviation calculated for the Least
Bell’s Vireo model construction dataset and for the riparian modeling grids in
historic and current ranges������������������������������������������������������������������������������������������������������13
4. Assessment of historic and recent Least Bell’s Vireo observations and R30-P1
model performance in California’s historic range�����������������������������������������������������������������20
5. Comparison of environmental variable means and standard deviation
calculated for suitable and unsuitable habitat across California, for Least
Bell’s Vireo locations in the current range and for historic and recent vireo
observation areas in the historic range����������������������������������������������������������������������������������20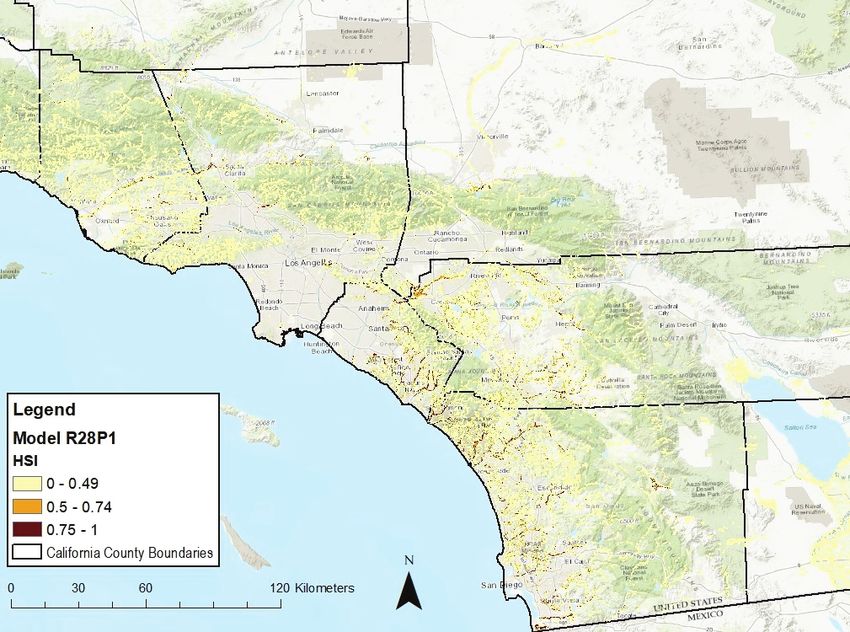
vii

Conversion Factors
International System of Units to U.S. customary units

    Multiply              By            To obtain
                      Length
 meter (m)             3.281           foot (ft)
 kilometer             0.6214          mile (mi)
    (km)
                       Area
 hectare (ha)          2.471           acre

Temperature in degrees Celsius (°C) may be converted to degrees Fahrenheit (°F) as follows:
                                               °F = (1.8 × °C) + 32.
Temperature in degrees Fahrenheit (°F) may be converted to degrees Celsius (°C) as follows:
                                                °C = (°F – 32) / 1.8.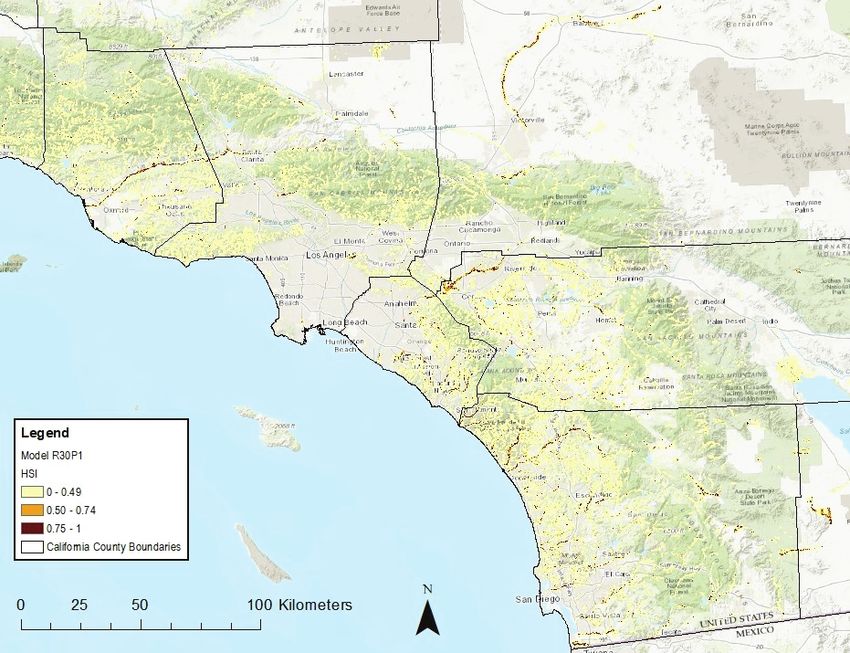
Abbreviations
AUC         area under the curve
CNDDB       California Natural Diversity Database
CWD         cumulative water deficit
FRAP        Fire Resource Assessment Program
GIS         Geographic Information System
HSI         habitat similarity index
HUC         hydrological unit code
NDVI        normalized difference vegetation index
SAWA        Santa Ana Watershed Association
std         standard deviation
USFWS       U.S. Fish and Wildlife Service
WRC MSHCP   Western Riverside County Multiple Species Habitat Conservation Plan
Modeling Least Bell’s Vireo Habitat Suitability in Current
and Historic Ranges in California

By Kristine L. Preston, Barbara E. Kus, and Emily Perkins

                                                                  150-meter scale, little-to-no slope, and was within 130 meters
Abstract                                                          of water.
     We developed a habitat suitability model for the
federally endangered Least Bell’s Vireo (Vireo bellii pusillus)
across its current and historic range in California. The          Introduction
vireo disappeared from most of its range by the 1980s,
remaining only in southern California and northern Baja                 Least Bell’s Vireo (Vireo bellii pusillus) is a small
California, Mexico. This decline was due to habitat loss          migratory songbird currently restricted as a breeding resident
and introduction of brood parasitic brown-headed cowbirds         to dense willow-dominated riparian habitats along streams,
(Molothrus ater) into California in the late 1800s. Habitat       rivers, and floodplains in southwestern California, United
protection and management since the mid-1980s increased           States and northwestern Baja California, Mexico. Three other
southern California vireo populations with small numbers          subspecies of Bell’s vireo have separate geographic breeding
of birds recently expanding back into the historic range.         ranges in the United States and northern Mexico, and all
The vireo habitat model will help meet the U.S. Fish and          subspecies winter in Mexico (Kus and others, 2020). This
Wildlife Service recovery objectives by distinguishing            subspecies was listed as endangered by the state of California
specific areas to survey for new occurrences; characterizing      in 1980 and by the federal government in 1986. Historically,
important vireo-habitat relationships; and identifying areas      Least Bell’s Vireo was one of the most abundant songbird
for habitat management. We constructed models based on            species in the lowlands of California, including the central
the vireo’s current range to predict suitable habitat in the      coast and San Joaquin and Sacramento Valleys (U.S. Fish
historic range, which differs substantially in environmental      and Wildlife Service, 1998). At the time of federal listing, the
conditions. We used the partitioned Mahalanobis D2 modeling       species was considered to have declined more dramatically
technique designed to predict habitat suitability in areas not    than any other songbird species in the state (U.S. Fish and
included in a sample of species locations and under novel         Wildlife Service, 1986). Reductions in vireo populations were
conditions. We constructed alternative models with different      first noted in the 1930s and 1940s (U.S. Fish and Wildlife
combinations of environmental variables hypothesized to           Service, 1986). By the 1970s, vireos had disappeared from
be important components of vireo habitat. We selected a set       the northern and central parts of their historic breeding range,
of best performing models to predict suitable habitat for a       including from Tehama County in the northern Sacramento
riparian vegetation grid buffered 500 meters across California.   Valley and south through the San Joaquin Valley and major
Most models for southern California did not predict suitable      river systems on the central coast (Goldwasser and others,
habitat in the historic range. The top performing model has an    1980; U.S. Fish and Wildlife Service, 1986). By 1985, there
area under the curve value of 0.93. It is a simple model and      were only 291 known territories remaining in southwestern
discriminated among riparian habitats, with only 6 percent        California, with the greatest concentration in San Diego
predicted as suitable. On average, suitable vireo habitat had     County (U.S. Fish and Wildlife Service, 1986).
more than 60-percent riparian vegetation and flat land at the
2 Modeling Least Bell’s Vireo Habitat Suitability in Current and Historic Ranges in California
Least Bell’s Vireo populations disappeared in response to and metapopulations in San Diego, Orange, and Ventura
large-scale loss of California’s riparian habitat to agricultural Counties (University of California Agriculture and Natural
and urban land uses, flood control projects, gravel extraction, Resources, 2018a).
and livestock grazing (U.S. Fish and Wildlife Service, Least Bell’s Vireo is a covered species in 17 Natural
1986, 1998; Kus and others, 2020). In the late 1970s, it was Community Conservation Plans and Habitat Conservation
estimated that 90 percent of riparian habitat had disappeared Plans developed during the last 23 years (California
from areas in California where vireos were present during Department of Fish and Wildlife, 2018). These plans include
the 1850s (Smith, 1977). A second factor associated with the conserving lands and implementing specific management
vireo’s decline is brown headed-cowbird (Molothrus ater) objectives to protect and enhance Least Bell’s Vireo
brood parasitism (U.S. Fish and Wildlife Service, 1986, 1998; populations. Habitat protection, enhancement, and restoration,
Kus and others, 2020). Female cowbirds lay their eggs in vireo along with brown-headed cowbird population management,
nests and the vireo eggs typically are destroyed by the female have proven effective in increasing the size and distribution
or nestling cowbird, or they fail to hatch. Vireo pairs with of Least Bell’s Vireo populations (Kus, 1998, 2002; Kus
parasitized nests often raise the cowbird at the expense of their and Whitfield, 2005). By 2005, the California population
own young, which can greatly reduce vireo productivity and had increased nearly tenfold since the time of listing to
lead to population decline (Laymon, 1987; Kus, 2002; Kus 2,968 territories (U.S. Fish and Wildlife Service, 2006). This
and Whitfield, 2005). Cowbirds are native to the Great Plains population growth has been tempered during extreme drought
and began arriving in southern California in the late 1800s years by declines in nesting effort, productivity, and breeding
with the arrival of settlers and their livestock. By the 1920s, success (Kus and others, 2017). Vireo population growth has
cowbird populations had increased and spread through much been especially high in San Diego, Orange, Riverside, and
of the vireo breeding range, with the expansion of agriculture Ventura Counties (U.S. Fish and Wildlife Service, 2006; Kus
and intensive cattle production (Laymon, 1987; Goguen and and others, 2017).
Mathews, 1999). In addition to an increase in population size, there has
A potential new threat to Least Bell’s Vireo is the been a range expansion of the Least Bell’s Vireo into areas
invasion of the Kuroshio and polyphagous shot hole borers where it was previously extirpated. One to a few individuals
(Euwallacea sp.) into native riparian habitats in southern or breeding pairs have shown up sporadically in Kern,
California (Howell and Kus, 2018; University of California Monterey, San Benito, Stanislaus, Yolo, and San Bernardino
Agriculture and Natural Resources, 2018a). These ambrosia Counties (U.S. Fish and Wildlife Service, 2006). In 2005, the
beetles are native to Southeast Asia. The polyphagous shot first documented breeding since the 1950s was confirmed for
hole borer was first detected in Los Angeles County in a single pair in the San Joaquin Valley (Howell and others,
2003 and has rapidly expanded into Orange, Riverside, San 2010). Breeding also was confirmed for a single pair at the
Bernardino, and Ventura Counties (University of California same site in 2006 and unsuccessfully attempted by a single
Agriculture and Natural Resources, 2018b). The Kuroshio female in 2007.
shot hole borer was first detected in 2015 in the Tijuana River The draft recovery plan (U.S. Fish and Wildlife Service,
Valley and is spreading in San Diego County (University of 1998) calls for habitat protection and restoration and
California Agriculture and Natural Resources, 2018b). There brown-headed cowbird management at important riparian
are also a few isolated occurrences of Kuroshio shot hole borer areas to facilitate population increase and expansion into
in Orange, Los Angeles, Santa Barbara, and San Luis Obispo historic breeding habitat. Specific recovery criteria (U.S. Fish
Counties. These beetles form an association with Fusarium and Wildlife Service, 1998) include:
fungal species causing a disease complex called Fusarium Criterion 1. Stable or increasing populations in 11 key
dieback, which can kill reproductive host trees of many population and metapopulation units (these are within San
species (64 tree species documented for polyphagous and 15 Diego, Orange, Riverside, Los Angeles, Ventura, and Santa
for Kuroshio; University of California Agriculture and Natural Barbara Counties).
Resources, 2018b). Both beetle species invade willows and Criterion 2. Stable or increasing populations in the
other riparian tree species, which causes extensive mortality 14 key population and metapopulation units that include
(Boland, 2016; University of California Agriculture and 11 units in Criterion 1, plus 3 additional population and
Natural Resources, 2018b). In the Tijuana River Valley, a metapopulation units (Salinas River population, San Joaquin
total of 355,510 willows (88 percent) were infested during metapopulation, and Sacramento Valley metapopulation) that
2015–2017 (Boland, 2017). Dead trees resprouted in 2017, represent full expansion into the historic range.
which provided potential breeding habitat for vireos (Howell Criterion 3. Threats are eliminated so that the 14 key
and Kus, 2018). The Tijuana River Valley is a key Least Least Bell’s Vireo populations and metapopulations are
Bell’s Vireo population in the U.S. Fish and Wildlife Service capable of persisting without intensive human intervention or
(USFWS) draft recovery plan (U.S. Fish and Wildlife Service, management commitments to control threats from cowbird
1998). Shot hole borer invasion also is occurring in riparian parasitism and habitat degradation in perpetuity.
habitats supporting other key Least Bell’s Vireo populationsMethods 3
Recovery actions are being planned and implemented The current southern California range is where Least
by the U.S. Fish and Wildlife Service (USFWS) and partners Bell’s Vireo populations have persisted and grown since the
throughout the vireo’s current range. The next steps are to species was listed in 1986. It extends from southern Ventura
assess habitat suitability and management potential throughout County south to the international border with Mexico and
the vireo’s historic range to identify and prioritize key areas from the Pacific coastline east into western San Bernardino
for recovery. This process will entail conducting surveys to and Riverside Counties and the eastern border of San Diego
determine vireo occupancy, habitat conditions, and threats, County. The California study area includes the current range
such as from cowbird parasitism and shot hole borer Fusarium and the historic range along the central coast and through the
dieback. Knowledge of the location and extent of suitable San Joaquin and Sacramento Valleys. The California study
vireo habitat will allow managers to focus conservation area also includes riparian areas where there are no historic
effort on sites that facilitate recolonization of the historic or current Least Bell’s Vireo records, including the northern
range through expansion of source populations in southern coast and higher elevations in mountains surrounding the San
California. This Least Bell’s Vireo habitat modeling project Joaquin and Sacramento Valleys.
was funded by the National Fish and Wildlife Foundation
and the Bureau of Land Management to facilitate these
recovery actions. Data
The goal of our project was to develop a statewide habitat
suitability model for Least Bell’s Vireo in California by using Least Bell’s Vireo Data
the partitioned Mahalanobis D2 modeling approach. We We developed models for the southern California
followed methods that have been successfully used to model current range using vireo locations from a variety of sources
habitat for many species, including federally listed species recorded from 1990 to 2018. We compiled Least Bell’s Vireo
(for example, Rotenberry and others, 2006; Preston and digital data collected by the U.S. Geological Survey (USGS)
others, 2008; Barrows and Murphy-Mariscal, 2012; Knick and and other agencies. The USGS also maintains a database of
others, 2013). biologist reports submitted to the USFWS that detail Least
This habitat model will help achieve Least Bell’s Vireo Bell’s Vireo survey results. We identified and filled in data
recovery goals (U.S. Fish and Wildlife Service, 1998), and gaps by digitizing locations from several reports for the Santa
it will help managers meet the objectives of distinguishing Clara River and desert populations in San Diego County. We
specific areas to survey for new vireo occurrences, selected vireo records for 13 years with the most spatially
characterize important vireo-habitat relationships at the comprehensive location data reflecting average (1997, 2004,
landscape-scale, and identify areas that may benefit from 2010, 2016), below average (1990, 2007, 2012, 2013, 2018)
habitat management. The habitat suitability model will allow and above average (1993, 2005, 2011, 2017) rainfall years.
proactive identification and evaluation of areas where suitable This approach allowed us to evaluate normalized difference
vireo habitat is vulnerable to invasion by Fusarium dieback vegetation index (NDVI) values associated with vireo
and allow greater coordination of regional efforts to control locations across environmental conditions and time.
this disease complex (Eskalen and others, 2019). For each rainfall category, we selected 3–4 years of
spatially precise southern California location data for the
1990–2013 period. We created a 150-meter (m) grid of
Methods the study area with ArcGIS 10.5 software. We processed
data to randomly select and remove spatially redundant
vireo locations at each 150-m cell. We divided this overall
Study Area
dataset into a randomly selected model construction dataset
We modeled two geographic areas: the current range in consisting of 2,270 observation records (70 percent) and used
southern California and the entire state of California, including the remaining 972 observations (30 percent) as a random
the current and historic range (fig. 1). The historic and current evaluation dataset (table 1; fig. 2).
ranges are generalized from boundaries delineated in the draft We used the most recent survey data reflecting different
recovery plan (U.S. Fish and Wildlife Service, 1998). We annual rainfall conditions to evaluate model performance,
expanded the current range in southern California to include especially for those models including NDVI variables. These
some areas previously classified as historic but that support data included 2016 (average rainfall), 2017 (above average
post-1990 vireo observations used for modeling. The modeled rainfall), and 2018 (below average rainfall) evaluation
study areas were clipped to riparian vegetation types known or datasets with 610, 1,066, and 882 observations, respectively
hypothesized to support Least Bell’s Vireo and buffered 500 m (table 1; fig. 2).
by other land cover types.4 Modeling Least Bell’s Vireo Habitat Suitability in Current and Historic Ranges in California
Historic range
Current range
Figure 1. California and southern California study areas with modeling extents defined by riparian vegetation
communities potentially used by Least Bell’s Vireos and buffered 500 meters by other types of land cover. The California
modeling area also includes the southern California modeling extent. Approximate boundaries of the historic range are
indicated by the blue polygons and the current range by an orange polygon. Some recent vireo observations have been
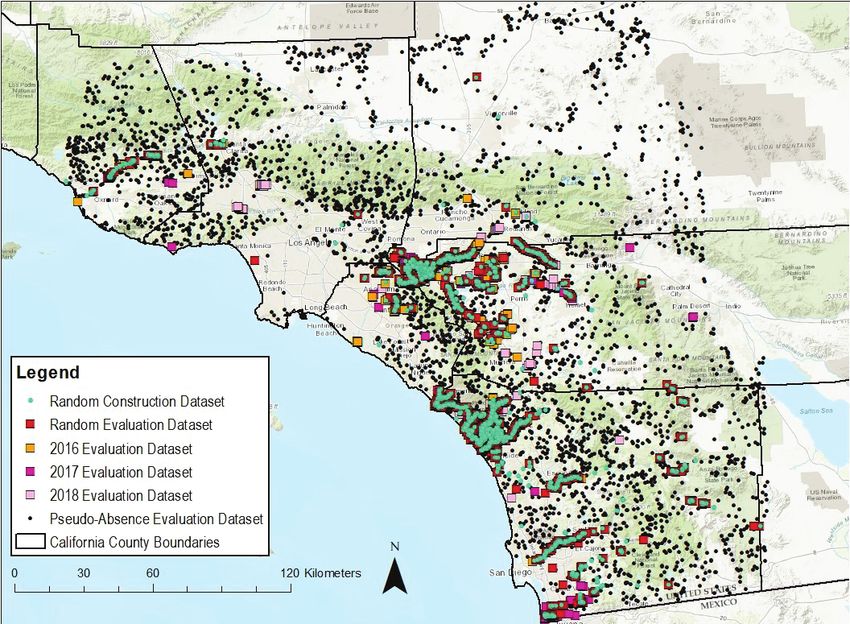
made within the historic range.Methods 5
Table 1. Least Bell’s Vireo location datasets used for habitat modeling with sources of observations, total number of observations per
dataset, and how datasets were used in model construction and evaluation in the current and historic ranges.
[HSI, habitat similarity index; AUC, area under the curve; m, meter]
Dataset and observation Number of Evaluation
Dataset use Sources
years observations metrics
Anza Borrego State Park
Bloom Biological
Bon Terra Consulting
California Natural Diversity Database
Center for Natural Lands Management
1990–2013 observations Davenport Biological Services
Model construction in
randomly selected Friends of the Santa Clara River 2,270 Median HSI
current range
(70 percent) Griffith Wildlife Biology
Ogden Environmental
San Bios
Santa Ana Watershed Association
U.S. Geological Survey
Western Riverside Conservation Authority
Anza Borrego State Park
Bloom Biological
California Natural Diversity Database
Center for Natural Lands Management
Model selection/ 1990–2013 observations Friends of the Santa Clara River
evaluation in current randomly selected Griffith Wildlife Biology 972 Median HSI
range (30 percent) Ogden Environmental
San Bios
Santa Ana Watershed Association
U.S. Geological Survey
Western Riverside Conservation Authority
Model selection/ California Natural Diversity Database
2016 observations
evaluation in current Santa Ana Watershed Association 610 Median HSI
(average rainfall)
range U.S. Geological Survey
California Natural Diversity Database
Model selection/ Orange County Water District
2017 observations (above
evaluation in current RECON 1,066 Median HSI
average rainfall)
range Santa Ana Watershed Association
U.S. Geological Survey
Model selection/
2018 observations (below
evaluation in current U.S. Geological Survey 882 Median HSI
average rainfall)
range
Presence-absence:
Presence points from
random, 2016, 2017,
7,060:
Model selection/ and 2018 evaluation
3,530 presences;
evaluation in current datasets; absence points See previous list of dataset sources AUC
3,530 pseudo-
range randomly selected
absences
from grid of riparian
vegetation buffered
500 m
Model evaluation in 52 observations at Qualitative
1877–2016 observations California Natural Diversity Database
historic range 47 sites assessment
Model evaluation in 117 observations Qualitative
2012–2019 observations eBird
historic range at 20 sites assessment6 Modeling Least Bell’s Vireo Habitat Suitability in Current and Historic Ranges in California
Figure 2. Southern California Least Bell’s Vireo spatially distinct location datasets for constructing alternative models
and evaluating performance. Pseudo-absence locations are randomly selected from the environmental grid for riparian
vegetation buffered 500 meters.
We created a presence and pseudo-absence dataset to vireo location in the construction and evaluation datasets.
assess how well models distinguished between areas where These data were used to develop and assess habitat models for
vireos occur and where they have not been detected. We the current range.
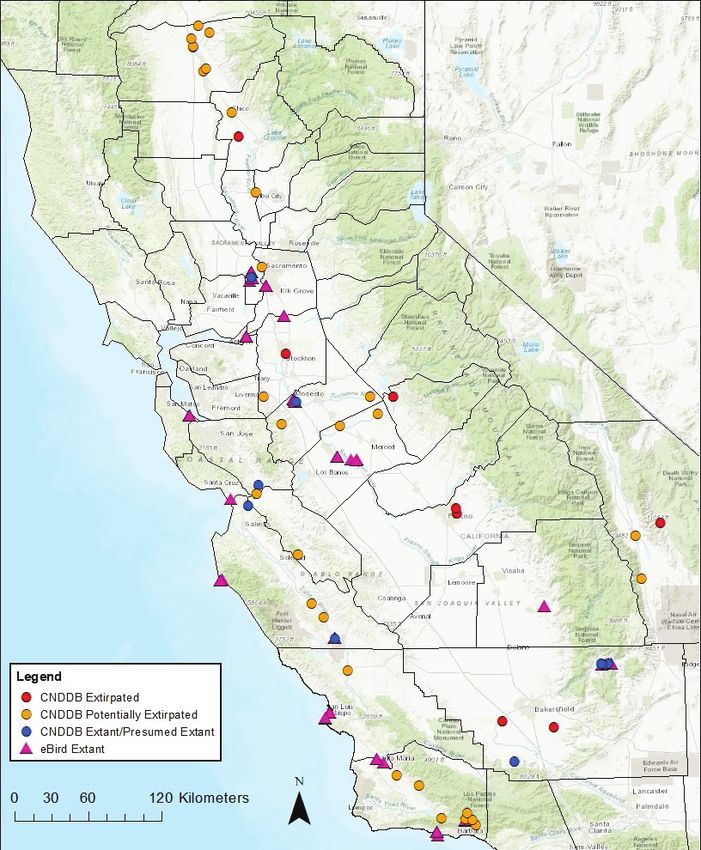
combined the random evaluation dataset with 2016, 2017, We created vireo location datasets to qualitatively
and 2018 evaluation datasets for a combined 3,530 presence evaluate model performance in the historic range. These
points. We randomly selected an equivalent number (3,530) of datasets consisted of historical (1877–1989) and recent
pseudo-absence points from the grid of points encompassing (detected since 1990) California Natural Diversity Database
riparian vegetation buffered 500 m in the vireo’s current (CNDDB; California Natural Diversity Database, 2018)
range. By selecting pseudo-absences from environmental observations and recent eBird (eBird, 2019) observations
conditions similar to where Least Bell’s Vireo occur (within (table 1; fig. 3). Many of the recent records represent multiple
the current range and in buffered riparian habitat), we avoided sightings of the same bird(s) in the same year or bird(s) at the
overpredicting suitable habitat (Chefaoui and Lobo, 2008). same site over different years. Most historic records and some
Selecting pseudo-absences from environmental regions (in recent observations are of low spatial accuracy, representing
other words, non-riparian habitat) farther from the vireo general survey sites and not specific bird locations. We
environmental optimum can lead to inflated accuracy scores used aerial photo interpretation and CNDDB and eBird
and overprediction of suitable habitat. information to evaluate current land use (developed versus
We extracted values for environmental variables from the natural vegetation) at each site and categorize vireo records as
grid cell (see later in the report) at each southern California extirpated, potentially extirpated, and extant/potentially extant.Methods 7 Figure 3. California Least Bell’s Vireo California Natural Diversity Database (CNDDB) historic and recent observations and eBird recent observations used to qualitatively evaluate model predictions in the historic range. Vireo locations are classified as extirpated, potentially extirpated and extant/potentially extant.
8   Modeling Least Bell’s Vireo Habitat Suitability in Current and Historic Ranges in California

Environmental Variables                                           classification. These selected riparian vegetation types are
                                                                  merged into one “riparian” class, independent of original
      We calculated environmental variables at the center point   classification, and used to approximate riparian vegetation
of each 150- by 150-m grid cell using ArcGIS 10.5 software        potentially used by Least Bell’s Vireos across California. The
and various spatial data layers. Variables reflect various        selected riparian vegetation communities form the riparian
aspects of topography, climate, hydrology, and land cover         modeling grid and are buffered 500 m by other landcover
(percent riparian vegetation and urbanization at 150-m, 500-m,    types. We calculated percent riparian vegetation at each grid
and 1-kilometer [km] scales). We calculated 28 environmental      point for local (150-m) and landscape (500-m, 1-km) scales. In
variables to use in developing alternative models (table 2). To   addition to riparian vegetation, we calculated urban land use at
display model predictions, we clipped each grid to selected       these multiple scales.
riparian vegetation types buffered 500 m with adjacent land            We employed Landsat NDVI remote imagery to calculate
cover types.                                                      NDVI variables reflecting growing vegetation across the
      For each 150-m grid cell, we computed median                landscape. For each vireo observation, we calculated NDVI
elevation, slope and topographic heterogeneity, and percent       variables for the year of each observation to develop the
flatness. We calculated precipitation and average minimum         model construction and evaluation datasets. We selected
and maximum temperatures to reflect winter (October–              2017, an above average rainfall year, to calculate NDVI
December), pre-breeding (January–March), and breeding             variables for the southern California and California modeling
(April–June) conditions. We used cumulative water deficit         grids. Normalized difference vegetation index variables are
(CWD) to quantify water availability for vegetation across        calculated as means, maximums, and percentages of pixels
sites. Cumulative water deficit is the cumulative difference      with a minimum specified value at the 150-m and 500-m
between potential evapotranspiration and actual evaporative       spatial scales (table 2).
transpiration during a specified period.
      To calculate land cover, we assessed several different
Geographic Information System (GIS) vegetation maps and           Modeling Approach
selected the statewide Fire Resource Assessment Program
(FRAP) 2015 Vegetation Map as a base map for California                 Niche models use species occurrence data and
(California Department of Forestry and Fire Protection,           environmental variables calculated in GIS to identify suitable
2015). This map best depicted riparian vegetation at Least        habitat (Guisan and Zimmerman, 2000; Elith and others,
Bell’s Vireo locations. Through previous modeling efforts,        2006). We used the partitioned Mahalanobis D2 modeling
we discovered mapping and classification inaccuracies, as         approach to predict suitable habitat across the current and
FRAP merges multiple vegetation maps across the state with        historic range of the Least Bell’s Vireo. Predicting suitable
differing classification schemes, spatial scales and mapping      habitat in a novel environment where there is a lack of species
years, many of which are outdated. To improve riparian            records is challenging because environmental conditions
vegetation mapping, we cross-walked and merged FRAP with          can differ substantially from conditions where the species
six recent and detailed regional vegetation maps for southern     occurs. The partitioned Mahalanobis D2 technique, unlike
California (table 2). We used the Klausmeyer and Howard           most modeling algorithms, is designed to predict habitat
(2016) groundwater dependent ecosystems map for California        suitability in areas not included in a sample of species
to capture riparian areas not mapped with the other source        locations, in dynamic landscapes, and under novel conditions
layers. From each vegetation mapping source, we added             (Knick and Rotenberry, 1998; Rotenberry and others, 2002).
riparian vegetation communities used by Least Bell’s Vireos       This type of approach is intended to model large areas of
into one riparian habitat layer to include in our modeling grid   California historically supporting vireos, but from where
(appendix 1, table 1.1).                                          they have been extirpated and there is little or no recent
      To better characterize the historic range, we used the      location data. Particularly challenging is the situation where
same or similar vegetation communities identified for southern    the historic range in northern and central California differs
California and added in new community classifications that        in many environmental characteristics (for example, climate,
include plant species used by vireos or that have similar         topography, vegetation communities) from the currently
species and structure. For the merged vegetation map,             occupied range in southern California. This difference in
we selected 260 vegetation categories across the 8 map            characteristics complicates predicting suitable habitat for
sources (appendix 1, table 1.1). Many of these categories         the vireo in the historic range based on current habitat
are redundant classifications among the mapping sources or        relationships in southern California.
are slight variations of a similar vegetation or hydrological
Methods 9
Table 2. Description of variables included in the southern California and California environmental grids to create alternative Least
Bell’s Vireo models.
[m, meter; USGS, U.S. Geological Survey; =, equal to; BCM, Basin Climate Mode; mm, millimeters; km, kilometers; NDVI, normalized difference vegetation
index; >, greater than]
Variable Scale Description
Topography
Median topographic heterogeneity (Sappington and others, 2007) for a 150-m
Median value for 150-m by
topo150m neighborhood centered on each grid point and calculated from the USGS 10-m
150-m area
Digital Elevation Model (DEM) raster.
Median value for 150-m by Median elevation for a 150-m neighborhood centered on each grid point and calculated
dem150m
150-m area from the USGS 10-m DEM raster.
Median value for 150-m by Median percent slope for a 150-m neighborhood centered at each grid point and
slope150m
150-m area calculated from the USGS 10-m DEM raster.
Percentage of 150-m by 150-m Percentage of flat land (floodplain) for a 150-m by 150-m or 500-m by 500-m
flat150m
or 500-m by 500-m areas neighborhood centered at each grid point and calculated from the USGS 10-m DEM.
Distance in meters to the nearest perennial/intermittent stream and measured from
waterdistm m
hydrological data layers.
Climate
prec_OD_av Seasonal (OD = October–December, JM = January–March, AJ = April–
prec_JM_av June) precipitation averages (mm) for each grid point from BCM rasters
Extracted at grid point (http://climate.calcommons.org/lists/datasets).
prec_AJ_av
prec_anntot Average annual precipitation.
minT_OD_av
minT_JM_av
minT_AJ_av Seasonal (OD = October-December, JM = January–March, AJ = April–June) minimum
Extracted at grid point and maximum average temperatures (degrees Celsius) for each grid point from BCM
maxT_OD_av rasters (http://climate.calcommons.org/lists/datasets).
maxT_JM_av
maxT_AJ_av
Hydrology
Annual climatic water deficit amounts for each grid point from BCM
cwd_anntot Extracted at grid point rasters with monthly evapotranspiration and water deficit values
(http://climate.calcommons.org/lists/datasets).
Land cover
riparian150p Subregional vegetation maps were merged together from western Riverside County
riparian500p (2005), western San Diego County (2014), southern (2013) and central/coastal
(2013) Orange County, Naval Air Station Miramar (2012–14), Marine Corps Base
riparian1kmp
Percentage of 150-m by 150-m Camp Pendleton (2003) and Naval Weapons Station Fallbrook (2010). The 2015
urban150p or 500-m by 500-m or 1-km Fire Resource Assessment Program Vegetation Map for California was used for
urban500p by 1-km areas areas in California without subregional mapping. Additional selected riparian
categories not captured by other vegetation maps were selected from Klausmeyer
urban1kmp and Howard (2016). Calculated percentage of merged riparian vegetation and urban
land use within 150-m, 500-m, and 1-km grid neighborhoods.
NDVI
NDVImean150 Mean value for 150-m by 150-m
Mean NDVI for 30-m grid cells in 150-m by 150-m or 500-m by 500-m neighborhoods
NDVImean500 or 500-m by 500-m areas
NDVImax150 Maximum for 150-m by 150-m Maximum NDVI for 30-m grid cells in 150-m by 150-m or 500-m by
NDVImax500 or 500-m by 500-m areas 500-m neighborhoods
NDVI25p500 Percentage value for 500-m by Percentage of 30-m grid cells with NDVI >0.25 or NDVI >0.40 in 500-m by
NDVI40p500 500-m area 500-m neighborhood10 Modeling Least Bell’s Vireo Habitat Suitability in Current and Historic Ranges in California
Mahalanobis D2 is the standardized difference between 6. Use the subset of best performing model partitions for
the multivariate mean for environmental variables calculated southern California to predict suitable habitat across
for the set of species observations and the values of these California. Qualitatively evaluate model predictions
variables at each grid point across the landscape. The more across the historic range using aerial photography and
similar the environmental conditions at each grid point in the historical and recent vireo observation records, typically
landscape are to species occurrences, the higher the habitat of lower spatial precision. Quantify environmental
similarity index (HSI) value for that point. The HSI ranges conditions in the vicinity of vireo observations in the
from 0 (least similar or unsuitable) to 1.0 (most similar or historic range.
suitable). Using principal components analysis, Mahalanobis
D2 can be partitioned into separate components representing 7. Select the best performing model partition for both
independent relationships between the species distribution southern California and California study areas. Use this
and environmental variables. Model partitions with smaller model partition to quantify potentially suitable habitat
eigenvalues represent environmental variables varying the across California.
least at species occurrences and can be associated with
limiting factors (Rotenberry and others, 2002, 2006; Knick
and others, 2013). Variables that vary widely are not as Model Selection and Evaluation
informative because they are not restrictive of the species
distribution. Partitioning environmental relationships and Model Construction
focusing on those that are most consistent where vireos We developed alternative models with various
occur improves modeling of limiting conditions in novel or combinations of environmental variables reflecting
dynamic environments. hypothesized Least Bell’s Vireo habitat relationships. We
Our approach to developing a habitat model for the developed and compared comprehensive exploratory models
historic range of Least Bell’s Vireo in California consisted of with full complements of different variables describing
the following steps: topography, climate seasonality, hydrology, and percent
1. Compile spatially distinct and precise digital riparian and urbanization at local to landscape scales.
observations for Least Bell’s Vireos in the current range We selected variables based on what is known about
in southern California to create model construction and Least Bell’s Vireo habitat requirements and our previous
evaluation datasets. experience modeling the vireo and other species. We selected
topographical variables thought to describe vireo habitat in
2. Develop a southern California 150-m scale grid and southern California, including flat floodplains, shallow slopes,
calculate environmental variables at each grid point in and lower elevations along the coast and inland valleys and
the center of a 150-m grid cell including measures of foothills. We hypothesized vireos cluster near stream and river
topography, climate, hydrology, vegetation, and NDVI. channels and calculated distance to water.
For each vireo observation, extract environmental We computed average seasonal climate conditions
variable values from the 150-m grid cell in which that may influence habitat suitability across sites. We
they occur. calculated precipitation and average minimum and maximum
3. Use Partitioned Mahalanobis D2 to develop alternative temperatures to reflect winter, pre-breeding, and breeding
models with different combinations of environmental conditions. Average winter and pre-breeding climates can
variables hypothesized to be important components vary substantially across sites and affect phenology and
of vireo habitat in southern California. Calculate HSI growth of vegetation during early spring when migrating
values for all model partitions from 0 (low habitat vireos return to choose breeding territories. In contrast, typical
suitability) to 1 (high suitability) for the model climate conditions during the breeding season’s incubation
evaluation datasets. and chick rearing phases may have the greatest influence
on habitat suitability. Finally, annual rainfall may be more
4. Evaluate model-partition predictions with the southern important than seasonal precipitation variables because
California evaluation datasets using median HSI it includes winter and pre-breeding season influences on
values and area under the curve (AUC) to identify vegetation phenology and growth and affects breeding season
the combinations of variables that best predict vireo conditions. It was anticipated that average annual minimum
occurrence. Select a set of best performing model and maximum temperature extremes would be less important
partitions for southern California. because migratory vireos are absent from California in winter
months when temperatures are coldest and have usually
5. Develop a 150-m scale environmental grid (as finished breeding by the time summer temperatures are
mentioned earlier) for all of California (clipped to highest. Cumulative water deficit is effective at describing
riparian vegetation buffered 500 m). plant distributions in arid lands (Dilts and others, 2015). We
hypothesized CWD could be an important habitat predictor for
vireo habitat in more arid portions of the range.Methods 11
The partitioned Mahalanobis D2 modeling technique the current range in southern California. We used the random
can accommodate correlated variables as it partitions out 2016, 2017, and 2018 evaluation datasets and the combined
relationships between variables into independent components presence-absence dataset of 3,530 vireo occurrences and
(Rotenberry and others, 2002). We typically selected one of 3,530 pseudo-absence points (table 1). For every model
two highly redundant variables describing the same aspect of partition, we calculated HSI predictions for vireo presence and
the environment to include in our universe of variables for pseudo-absence points ranging from Very High =0.75–1.00;
modeling (for example, median elevation for 150-m scale High =0.50–0.74; and Low to Moderate =0–0.49. Suitable
neighborhood compared with elevation extracted at a grid habitat is identified as HSI greater than or equal to 0.5 for
point, r =0.99). However, for two correlated variables that vireo locations and the modeling grid points. We calculated
reflect different aspects of habitat relationships (for example, AUC values from a Receiver Operating Curve to determine
elevation and minimum temperature), we kept both variables how well models distinguish between the combined presence
to include in our models and relied on the partitions to sort out points and the pseudo-absence points (Fielding and Bell,
important and independent environmental relationships. 1997). Area under the curve values of 0.7 indicate the model
We did not run all combinations of variables or create one partition does a good job discriminating presences from
model with all variables included. Instead, we started with a pseudo-absences, whereas AUC values greater than 0.9 show
set of comprehensive models to compare the effects of climate excellent separability. We selected a set of top performing
seasonality and land cover scale on model performance. calibration model partitions based on median HSI values for
These comprehensive models included topographic variables, the evaluation datasets and the AUC results. We selected a
climate variables for a particular season (winter, spring, subset of high performing models for further assessment in the
summer and no season), climatic water deficit, and local- and historic range.
landscape-scale land cover variables. We compared among
these comprehensive models to see which variables within the
various categories best predicted suitable habitat. We selected Model Evaluation in the Historic Range
a few of the better performing models and then tested whether Qualitative Evaluation
different NDVI variables improved performance. Finally, we
removed variables from these more comprehensive models to We utilized top performing southern California model
see if simpler models performed as well. partitions to predict Least Bell’s Vireo habitat suitability
We divided southern California into 10 sampling across the historic range in California. We calculated habitat
regions because of spatial unevenness in Least Bell’s Vireo suitability predictions for each grid point in the California
location data. Some areas, such as San Diego County, with riparian modeling grid. We visually evaluated each model
large concentrations of vireo observations, could introduce partitions map to see if suitable habitat was predicted in the
spatial bias into the model. We divided southern California historic range in areas known to previously support Least
into geographic units reflecting similar environmental Bell’s Vireos. We then closely assessed habitat suitability
conditions and used bootstrapping to resample from the predictions at historic observations and recent sightings of
model construction dataset (Knick and others, 2013). We recolonizing birds. We used aerial photography to determine
randomly selected 70 observations from each region for a total current conditions at each observation location, including level
of 700 observations selected from the 2,270 observations in of development and how well the selected riparian vegetation
the construction dataset. We used this subset of observations mapping appeared to reflect conditions on the ground. We
to create model partition output for a specific set of classified location accuracy for each observation based on
environmental variables. We repeated this process 1,000 times observation year, spatial resolution information, and location
to obtain different combinations of observations to construct descriptions in the dataset. We classified an observation as
the model with each iteration. We model-averaged the results extirpated if the location and surrounding area were developed
from sampling iterations to create an overall model with for urban or agricultural uses. We assigned an observation
partitions for that particular set of variables. as potentially extirpated if there were no observations since
1990 but the location remains largely undeveloped. For
locations where vireos have been observed since 1990, we
Quantitative Model Evaluation in the Current classified them as extant or potentially extant if the area
Range of Southern California was undeveloped. We selected one model partition as best
performing based on our qualitative assessment of model
The next step was to compare performance among these predictions in the historic range.
constructed model partitions in predicting suitable habitat in12 Modeling Least Bell’s Vireo Habitat Suitability in Current and Historic Ranges in California
Quantitative Evaluation and metapopulations in the historic range identified in the
draft recovery plan as critical to vireo recovery (U.S. Fish and
We quantitatively compared environmental conditions in
Wildlife Service, 1998).
the historic and current ranges and at vireo locations to better
understand vireo habitat relationships. We calculated means
and standard deviations (std) for all environmental variables at
Least Bell’s Vireo locations in the model construction dataset Results
in the current range and at modeling grid points throughout the
historic and current ranges. Using the selected best-performing Southern California and California
model, we calculated means and std for environmental
variables included in the model for suitable and unsuitable
Environmental Grids
habitat across the California modeling grid and for the vireo The southern California 150-m scale environmental
model construction dataset. We calculated a range in values grid consists of 3,794,874 grid points across all landcover
for the construction dataset using the mean plus or minus 1 std types. The modeling grid is reduced to 437,483 grid points
and mean plus or minus 2 std to represent 65 and 95 percent when clipped to selected riparian vegetation communities and
of vireo observations, respectively. Using the environmental buffered 500 m by other landcover types. This latter grid is
modeling grid, we selected an “observation area” surrounding used to display model predictions for southern California. The
each historic and recent vireo observation in the historic 150-m scale California modeling grid has 2,534,929 points
range. The observation area characterizes environmental and includes selected riparian vegetation communities
conditions at each vireo location and averages 150 grid buffered 500 m.
points in size (about 340 hectares [ha] or 840 acres) including
streams, rivers, and buffered areas nearest the observation. For
each observation area, we calculated means and std for the Southern California Habitat Modeling Results
environmental variables included in the selected model.
We created and evaluated 35 habitat models for Least
Bell’s Vireo in the current range in southern California. In
Using the Model to Assess Suitable Habitat appendix 2, table 2.1 displays model variables and evaluation
results for the 20 top performing models. These models
We used county and hydrologic unit code (HUC) 8 performed similarly in predicting suitable habitat in southern
boundary layers in ArcGIS to quantify the amount of suitable California. They have high AUC values (greater than 0.90)
Least Bell’s Vireo habitat predicted by the top performing and relatively high median HSI values for the random model
model in counties and watersheds in current and historic construction and evaluation datasets, although values for the
ranges across southern California. We determined how much 2016, 2017, and 2018 evaluation datasets vary among models.
suitable habitat is conserved by using the California Protected For all models, the best performing partition was partition 1, or
Areas Database (California Protected Areas Database, 2019). the full model, and included contributions from all variables.
We also compiled detection histories describing the general In these cases, lower model partitions poorly predicted habitat
prevalence or absence of recent (greater than or equal to 1990) suitability, indicating that most variables included in the model
and historic (less than 1990) Least Bell’s Vireo observations were not limiting habitat relationships in the current range.
in each watershed and presence versus lack of detections for Generally, these lower partitions, as reflected by eigenvector
each county. We also included Bell’s vireo observations in scores, were dominated by relationships between variables
California that were unassigned to a subspecies to expand our representing climate, topography, and urban land use. Higher
detection histories for HUC 8 watersheds. We did not evaluate partitions represented relationships between percent riparian
or quantify environmental conditions for these unassigned and other variables, particularly flat land and slope. Among
observations. We excluded observations of other Bell’s vireo the simpler models without climate and urbanization variables,
subspecies from our detection histories. We also calculated lower partitions included high eigenvector scores for riparian,
the approximate amount of suitable habitat for populations topography, and hydrology.You can also read