Choice op pension management fees and effects on pension wealth
←
→
Page content transcription
If your browser does not render page correctly, please read the page content below
n° 2020-02                                                      March 2020

               WORKING PAPERS

               Choice op pension management fees
               and effects on pension wealth

               Noelia BERNAL 1,2
               Javier OLIVERA 3,4,5

               1
                 Universidad del Pacífico (UP), Peru
               2
                 Netspar, University of Tilburg, Netherlands
               3
                 Luxembourg Institute of Socio-Economic Research (LISER), Luxembourg
               4
                 Pontificia Universidad Catolica del Peru, Peru
www.liser.lu   5
                 KU Leuven, Belgium
LISER Working Papers are intended to make research findings available and stimulate comments and discussion.
They have been approved for circulation but are to be considered preliminary. They have not been edited and have not
                                          been subject to any peer review.

       The views expressed in this paper are those of the author(s) and do not necessarily reflect views of LISER.
                           Errors and omissions are the sole responsibility of the author(s).
Choice of pension management fees and effects on
pension wealth*
Noelia Bernal and Javier Olivera†
January 2020
Abstract
To shed light on the effects of individual choice on pension wealth, we study a policy
change to the management fees of pension funds implemented by Peru’s government in
2013. The reform established a new balance fee as a default option; this fee is calculated as
a percentage of the pension balance. Each individual had the initial option of keeping the
previous management fee, a load factor fee calculated as a percentage of the individual’s
salary. We use administrative data to simulate pension balances based on the individual’s
choice of fee and the corresponding counterfactual. Our results indicate that the reform
has been potentially adverse to 63.1 percent of individuals, of whom 41.4 percent were
assigned to the default option and 21.7 percent voluntarily chose the load fee. These results
reflect both the potentially negative unintended effects of the policy and an alarming lack
of financial literacy among citizens. We also detect heterogeneity in the intensity of the
losses and gains due to the reform, which caused greater losses than gains. In particular,
younger and poorer individuals, as well as those automatically assigned to the balance fee,
experienced higher losses. Moreover, the new fee scheme is also associated with increasing
inequality between individuals’ pension wealth.
Key words: Pension savings, management fees, individual retirement accounts, pension
reform, inequality, Peru
JEL-classification: D31, G28, J14, J32.
* We are grateful to Nicolás Dominguéz, Daniel Castillo and Alfonso Rodríguez who contributed to the initial
stage of the research. We also would like to thank Sander Muns and the participants of presentations held in
Washington (LACEA Labor Network Meeting), Singapore, Paris, Lima and Leiden (Netspar) for their helpful
comments. William Fernández provided excellent research assistance. We are also grateful to the Superintendency
of Banking, Insurance and Pension Fund Managers for providing the administrative data. Declarations of interest:
none.
† Bernal: Universidad del Pacífico (UP) and Netspar; e-mail: n.bernall@up.edu.pe. Olivera (corresponding
author): Luxembourg Institute of Socio-Economic Research (LISER), Pontificia Universidad Catolica del Peru
(PUCP) and KU Leuven; e-mail: javier.olivera@liser.lu.
11 Introduction
Over time, proposals to transform old public pension systems into Individual Retirement Ac-
counts (IRAs) have fueled much debate among both policymakers and academics. Latin Amer-
ica is an interesting case because it has experience an important wave of pension reform start-
ing in 1981 with Chile and then moving to other countries (e.g., Peru 1992, Colombia 1993,
Mexico 1997). Studies have reached some agreement on the positive spillover effects of these
reforms, which include greater national savings, enhanced growth, and robust financial and an-
nuity markets (Kritzer et al. (2011), Aguila et al. (2014)). This stream of research provides little
knowledge of how management fees affect individual pension wealth. Indeed, the levels and
applications of these fees vary considerably across countries and therefore may have different
effects on the final value of pensions. Furthermore, high fees are a constant source of criticism
in countries with mandatory IRA systems. Hence, gaining a better understanding of their effects
is important.1
We use a 2013 change to the fee scheme of Peruvian IRAs to shed light on the potential long-
term effects on individual pension wealth. Before the reform, individuals paid a load factor fee,
which is calculated as a percentage of the monthly salary. The reform established a balance fee
calculated as a percentage of the pension balance. Individuals had about five months to choose
between the two fees. After this window, if individuals did nothing, they were assigned to the
new balance fee (default option). The fee scheme, either chosen or assigned to the individual,
is irreversible. Importantly, the balance fee is not applicable to the pension balance accrued
before the reform; it applies only to the balances after the reform and is compulsory to all
the new individuals enrolled since January 2013. Note that the balance fee scheme includes a
temporary load factor fee that (by regulation) will gradually decrease down to zero by 2023 and
a balance fee that will remain indefinitely.
Our analysis uses a sample of 64,588 individual administrative registers for those enrolled
in the Peruvian IRA system as of December 2016. This data comes from the Superintendencia
de Banca, Seguros y Administradoras Privadas de Fondos de Pensiones (known as SBS), a
public institution that monitors and regulates the private pension system. We simulate the final
value of the pension balance for each individual in our sample under certain assumptions and
apply a series of sensitivity checks for key parameters. We use this sample to capture the
heterogeneity of the population exposed to the policy change to management fees along with
those individuals who actively opted out of the new balance fee. Importantly, we simulate
and compare pension balances earned with the individual’s choice of fee and the hypothetical
balance in the corresponding counterfactual. Therefore, we are able to assess the losses or gains
in savings due to the choice of fee.
Other studies analyze the effects of fees in compulsory IRA systems on pension wealth, such
1 See Table A.1 in the appendix for a description of IRA fees for selected countries and Table A.2 for details on
the fee levels of Peruvian IRAs.
2as Whitehouse (2001), Alonso et al. (2014), Aguila et al. (2014) and Chávez-Bedoya (2017).
In particular, Alonso et al. (2014) analyse some additional features of the Peruvian policy re-
form, which included various regulatory changes and not only the change in management fees.
They use a representative agent model. However, they only compute the mechanical effect of
the change in fees on the specific example of a 40-year-old worker. Chávez-Bedoya (2017) dis-
cusses the theoretical implications of both the density of pension contributions and risk aversion
on the final level of individual pensions for different schemes of management fees. He illustrates
his predictions with parameters of the Peruvian IRA system. Our work is different because we
use observed and representative data of the individuals affected by the reform and exploit the
heterogeneity in that population to observe results for different groups.2 Indeed, accounting
for individual heterogeneity is important when studying pension reform, as the gaps between
winners and losers can be considerable (see for example Gallo et al. (2018)). Importantly, we
are also able to account for distributional concerns regarding the relationship between the indi-
vidual’s position in the income and pension wealth distribution and the potential gains or losses
from the fee change. Aguila et al. (2014) study the Mexican IRA system that, prior to 2008,
had three types of fees (load fee, balance fee and return rate fee), but then moved to only a load
fee. They find that before 2008, the management fees significantly reduced pension wealth and
increased claims for publicly subsidized minimum pensions. Dobronogov and Murthi (2005)
analyse pensions in Croatia, Hungary, Kazakhstan and Poland and find that management fees
(varying from 0.6 to 1.2 percent of assets) reduce the returns on an IRA by around 1 percent per
year.
The balance fee of the Peruvian reform can have important consequences on the value of
retirement wealth. Using data from a large Australian pension fund, Dobrescu et al. (2016) show
that default settings strongly influence wealth accumulation and that poorly designed default
options – particularly the irreversible ones – can severely affect retirement savings. Indeed,
the broader literature has already examined the role of default settings causing sub-optimal
retirement outcomes (e.g. Carroll et al. (2009), Goda and Flaherty (2013)).
Our results are in line with these findings, indicating that the policy reform is beneficial
only for 36.9 percent of the people but adversely affects the other 63.1 percent. This last figure
is composed of 41.4 percent of total individuals who were assigned to the balance fee, despite
it being disadvantageous for them, and 21.7 percent who voluntary made the disadvantageous
choice of choosing the load factor fee. This result therefore reveals both the negative unintended
effects of a policy design and an alarming lack of soundness in many individuals’ financial
decisions. Furthermore, we find an important relationship between an individual’s age and
their optimal fee structure. The load factor fee seems quite a good option for the majority of
young individuals (aged about 40 or below) because it does not reduce the pension wealth too
much, whereas a balance fee charged to younger individuals (and therefore over a longer period
2 Ouranalysis focuses on the individuals for whom the reform is salient, defined as those enrolled before 2013
who actively contribute.
3of capitalization) does. In contrast, the default fee may be better for older individuals as the
capitalization period is shorter and therefore the reduction of overall wealth over time will be
less dramatic. Unfortunately, the Government did not consider age when assigning the default
fee, nor did they allow any possibility of opting out.
Our analytical data set composed of individual administrative records does not allow us to
establish whether the individuals assigned to the balance fee were simply inactive about the fee
choice or believed that the balance fee best served their interests. Regardless, it is worrying that
most of them are worse off due to the reform. For those who opted for the load factor fee, is
also worrying that almost one quarter were “wrong” about staying with this scheme.
Financial literacy is a key determinant of good decisions about investments, including pen-
sion funds. For example, Banks et al. (2015) and Hastings and Mitchell (2020) find that better
financial knowledge would have helped individuals choose better annuities or accumulate more
wealth. Although our data set does not include direct measures of financial literacy, we capture
this feature by using a variable that measures how actively individuals manage their pension
fund portfolios. The results suggest that financial literacy influences the quality of decisions
made about pension fund fees. Unfortunately, in Peru, levels of financial literacy are quite low.
The country ranked 97th out of 142 countries in the S&P FinLit Survey conducted worldwide
in 2014 (see Klapper et al. (2015)). This important limitation was not taken into account in the
policy design.
Originally, the policy designed by the SBS was intended to apply the balance fee to all
individuals, removing the load fee entirely, but the Parliament amended the reform and allowed
the individuals choosing the load fee. However, given that the adopted fees are irreversible,
the policy has inadvertently established a trap: potential reductions in the balance fees (relative
to load fees) cannot be taken advantage of by the individuals who actively chose the load fee.
When we simulate pension wealth by assuming larger reductions in the balance fees over time,
the share of the reform’s losers increases and more individuals who chose the load fee become
losers.
We also detect large heterogeneity in the intensity of the losses and gains due to the reform.
The losses tend to be larger than the gains; the average size of the change in the final pension
balance for those who lose is -5.0 percent and 3.1 percent for those who gained. Furthermore,
those who chose the balance fee lost more than those who chose the load fee. Among the
individuals assigned to the balance fee, the average size of the change in the final pension
balance for those who lose is -7.0 percent and for those who gain, 0.9 percent. Among the
individuals who opted for the load fee, the average size of the change in the final pension
balance is -1.3 percent for those who lose, and 3.6 percent for those who gain. We also find
important differences in losses and gains across age group as well as income and retirement
wealth distribution. Younger and poorer individuals show higher losses.
After conducting several other robustness checks, we find that our main result stands: a
significant number of people are worse off due to the reform.
4The remainder of the paper is organized as follows: Section 2 gives an overview of the
institutional background and the pension management fees reform. Section 3 describes the data
and variables. Section 4 presents the methodology. Section 5 provides the main results and
Section 6 presents some robustness checks and further results. Section 7 concludes.
2 Background
2.1 The Private Pension System
The government introduced the IRA system in 1992 as the Private Pension System (SPP due to
its Spanish name). It launched the system following the pioneering experience of Chile in 1981,
although it did not dismantle the National Pension System (known as SNP) as Chile and other
Latin American countries did during their pension reforms. Thus, workers were free to enroll
in either the SPP or SNP.
Participation in either the SPP or the SNP is mandatory only for individuals who are for-
mally registered on a payroll; that is, employees in the formal sector. About 37 and 27 percent
of the total labor force were in the SPP and SNP, respectively, in 2015. However, many individ-
uals do not contribute regularly or do not contribute at all because of frequent transition between
the formal and informal sectors. The shares of individuals in the labor force who contributed
regularly to the SPP and SNP were about 17 and 10 percent, respectively, in 2015.
The AFP (Administradora Privada de Fondos de Pensiones in Spanish) manages the individ-
ual accounts of the SPP. There are currently four AFPs in the system: Prima, Integra, Profuturo
and Habitat.3 Workers are the sole contributors to the AFP at a rate of 10 percent of the their
monthly gross wage.4 Two additional charges are also paid by the worker. The first one is a
premium paid to insurance firms to cover disability and mortality risks, and the second one is a
management fee paid to the AFP. The employer deducts both the insurance and the management
fee from the monthly gross wage, but in the case of the insurance there is a cap applied to the
wage.
Peru has been part of a new wave of second-generation pension reforms (Kritzer et al.
(2011)) focused on closing coverage gaps and reducing administrative costs of IRA systems.
In this context, the government passed an important reform of the SPP in July 2012 (Law N°
29903) that went into effect the following year. The main goal of the reform was to increase
efficiency (through reductions in private costs) and to improve pension coverage and contribu-
tions. One important aspect of the reform was the charging of administrative fees. A new fee
based on each individual’s pension balance was established.
3 Other AFPs existed (Unión Vida, Horizonte) but opted out of the market over time.
4 The contribution rate has been different than 10 percent. In 1993-1995, it was 11 percent, which included a
solidarity charge and, from 1995-2005, the Government reduced the rate to 8 percent. Since 2005, the Government
has maintained the contribution rate at 10 percent.
5The 2012 reform also introduced two auction schemes with the primary objective of reduc-
ing administrative fees. One concerns the choice of which AFP will enroll all the new workers
for two years, and the other concerns the choice of which insurance firm that will provide the
disability and mortality coverage. Both schemes are a type of reverse auction (Kurach and
Kusmierczyk (2017)) where the firms bid to provide pension fund management or insurance
services to the clients. Because firms with the lowest prices would win the bid in this type of
auction, the government expected a reduction in the fees paid by the individuals. The reform
also strove to enhance efficiency by allowing the AFP to centralize operations (i.e. contributions
collection, provision of benefits, etc.) and to use new financial instruments to increase portfolio
diversification. While it was eventually removed or never implemented, the reform also estab-
lished mandatory enrollment for self-employed people aged 40 and younger and for individuals
working in small firms whose contributions would then be subsidized by the government.
2.2 Management fee reform
Figure 1 illustrates the evolution of the load factor fee from 2000 to 2018. The figure shows a
reduction from 2.39 percent in February 2000 to 1.58 percent in February 2018, although most
of this variation took place between 2005 and 2013. This reduction seems related to the entry of
new pension fund managers. Indeed, in August 2005 AFP Prima started operations and charged
a fee much lower than the market average (1.50 versus 2.11 percent, on average) that in turn
triggered price reductions in January 2006 by AFP Profuturo and AFP Unión Vida. However,
these reductions did not last long because in December 2008, AFP Prima increased its fee to
1.75 percent, with AFP Profuturo nine months later. In July 2013, AFP Habitat entered the
market with a fee of 1.47 percent, the lowest in the system. These fees have not varied since. 5
The government passed a broader reform on July 19, 2012, but the details were published
on November 8, 2012. Individuals could choose their preferred fee between January 2, 2013
and May 31, 2013, before the new scheme went into effect on June 1, 2013. More precisely, the
default option was the balance fee, so those individuals preferring to choose the load factor fee
had a window of five months to follow certain procedures. The only option for new individuals
enrolling in an AFP after February 1, 2013 was the balance fee.
To choose the load factor fee, individuals had to communicate their decision to the AFP
and sign some authorization forms. There was a period of approval of around four weeks
during which individuals were required to record the confirmation of their decision by phone.
Furthermore, the reform established a cooling-off period of six months after June 1, 2013 to
allow individuals to reverse their decision of staying with the load factor fee. By December
2013, 35 percent (1.92 million) of individuals were staying with the previous load factor fee,
while 65 percent had chosen the new balance fee.
5 See Table A.2 for details on the fee levels of AFP up to December 2016. These values did not change until
February 2018. Regarding the insurance premium, the cost increased from 1.23 percent in December 2013 to 1.36
percent in December 2017.
6Figure 1: Evolution of Fees in the Load Factor Fee Scheme
Notes: The figure shows monthly values (Feb 2000 to Feb 2018) of load factor fees extracted
from SBS’s official statistics. The mean corresponds to the simple average of fees.
It is worth noting that the balance fee scheme includes a temporary load factor fee that (by
regulation) will gradually decrease down to zero by 2023 and a balance fee that will remain
indefinitely.
Figure 2 shows the evolution of the two types of fees that are part of the balance fee scheme.
In February 2013, the average load factor fee was 1.51 percent, whereas in February 2018 it
was 0.63 percent; this is a significant reduction in a five-year period. There is some variance
among AFPs. For example, AFP Prima and AFP Habitat offered the lowest prices, 0.18 and
0.38 percent, respectively, whereas AFP Profuturo was the most expensive at 1.07 percent.
While the reform has reduced the load factor fee over the last five years, the balance fee has not
changed since June 2013 when its average value was 1.23 percent. One reason for this is that
the reform mandates an explicit minimal reduction in the load factor fee (until it reaches zero
in 2023) while it says nothing about the balance fee.6 The main assumption of the government
seems to be that the reverse auctions would lead – through more competition – to a reduction in
the balance fees. However, this has not occurred.7
6 According to specific rules generated by the reform, the temporary load factor fee included in the balance fee
scheme had to be reduced by 86.5 percent for the period from February 2013 to January 2015, 65.8 percent from
February 2015 to January 2017, 50.0 percent from February 2017 to January 2019, 31.5 percent from February
2019 to January 2021 and 13.5 percent from February 2021 to January 2023, until the load factor fee reaches zero
in February 2023.
7 Between 2012 and 2018, there were three auctions. Habitat won the first one in 2013 and held the monopoly
on the enrollment of new workers until May of 2015. The prices in the balance fee scheme were 0.47% for the
load factor fee and 1.25% for the balance fee. In the second auction, Habitat won again with prices of 0.38%
and 1.25%, respectively. In the third process, Prima won the bid (valid until May 2019) with prices of 0.18% and
1.25%, respectively. Pension funds seem to compete by reducing the transitory load factor fee of the balance fee
scheme but not the balance fee.
7Figure 2: Evolution of Fees in the Balance Fee Scheme
(a) Temporary Load Factor Fee
(b) Balance Fee
Notes: The figures show the monthly values (from February 2013 to February 2018) of the
temporary load factor and balance fees of the balance fee scheme extracted from SBS’s of-
ficial statistics. The mean corresponds to the simple average of the fees. By regulation, the
temporary load factor fee will be zero for all individuals from February 2023.
It is worth noting that the original reform proposed by the SBS intended to fully replace
the load fee with the balance fee for all individuals, but Parliament intervened and allowed the
individuals to choose the load fee. Given that the adopted fees are not reversible, the policy
has generated a trap: potential reductions in the balance fees (relative to the load fee scheme)
cannot be taken advantage of by the individuals who actively chose the load fee scheme.
3 Data
We use a sample of 2 percent of the total non-retired population from SBS’s individual admin-
istrative registers as of December 2016. The sample is random, stratified and representative of
the following strata: 5-year age group, sex and enrollment year. It is the only available data
set that includes information about each individual’s type of management fee, pension balance,
8income and some socio-economic variables.
The initial sample size is composed of 100,024 observations, which correspond to individ-
uals aged 21 to 64 who enrolled in the SPP before 2013. Individuals who enrolled in 2013 or
later have not been able to choose a preferred fee scheme and hence are not part of our sample
framing. After applying some selections related to the focus of our analysis, we obtain a sample
of 64,588 observations. To arrive at this number we drop 9,129 individuals with pension balance
of zero and 63 whose balances are missing. Many of these individuals have unregistered income
or their enrollment in the SPP occurred long time ago.8 If an individual became affiliated with
the SPP a long time ago and also have an empty balance, she might be an infrequent contributor
or not contribute at all. Given our interest in studying the prospective effects of the reform on
individuals for whom the reform is relevant, we restrict our sample to those who are current
contributors. We define these individuals as those whose last registered contribution occurred
at least in 2013 (after applying this definition, 14,546 individuals are dropped). Note that this
is a somewhat flexible criterion because in practice, we are considering individuals who made
at least one contribution in four years, between 2013 and 2016.9 Furthermore, we drop 11,656
individuals who have not registered incomes or last contribution date. Finally, 42 individuals
caught in the transition procedure for retirement are also dropped.
Given these selections, our final sample contains individuals with relatively higher incomes,
pension savings and probability of contributing. We are interested in this type of individuals
because the reform will be relevant for them, and we acknowledge that our analysis cannot be
extrapolated to the total population of the SPP (see Table A.3 in the appendix for more details).
The data contain demographic information on age, gender, employment condition and in-
come at the individual level. The data also include information on the pension account, such
as the enrollment date, AFP, last contribution date, pension balance, balance affected and unaf-
fected by the reform, type of chosen or allocated fee, type of pension fund, contribution density,
and information about recognition bonds. This bond is an amount of money, based on past
contributions, guaranteed by the government to those that were previously affiliated with the
national pension system.
There are four main types of pension funds. Fund type 1, which includes investments with
relatively low returns and volatility, is mandatory for individuals aged 60-65 unless the indi-
vidual chooses fund type 0 or 2. Fund type 2 includes investments with moderate growth and
volatility and combines both fixed-income instruments and equities. Fund type 3 is generally
composed of investments with higher returns and volatility such as equities. Fund type 0 is
designed to maintain capital, offers low returns and volatility and is intended for individuals
in the process of retirement after age 65.10 When an individual enrolls for the first time into
8 Ofall these cases, 81 percent have enrolled in 2006 or earlier.
9 77.2 percent of individuals in the final sample made their last pension contribution in 2016, 9.3 percent in
2015, 7.3 percent in 2014, and 6.2 percent in 2013.
10 Fund type 1 invests up to 100 percent in short-term fixed-income instruments and up to 10 percent in equities;
fund type 2 invests up to 75 percent in short-term fixed-income instruments and up to 45 percent in equities; and
9an AFP, the default pension fund is type 2; choosing another type of pension fund requires a
special administrative procedure. We use these pension fund defaults to compute a measure of
how active individuals are regarding their portfolio management. The variable Active portfolio
management takes the value of one if an individual under 60 has a pension fund type 1 or 3
or if an individual older than 60 has a pension fund other than type 1, and takes value zero
otherwise. This variable indicates that the individual has taken action to move away from the
default pension fund portfolio. We argue that this variable captures awareness about risk diver-
sification and may therefore be a proxy for financial literacy. We expect that more sophisticated
individual investors will be more likely to deviate from the defaults.
We use two additional and similar samples of SBS’s data from 2006 and 2013 to compute
the growth rates of labor income based on gender, income quintile and birth cohort (see Table
A.4 in the appendix for more details).
Table 1 shows the descriptive statistics of the variables in our final sample as of December
2016. The information is shown for all individuals and by type of fee scheme. We construct
quintiles of income, pension balance and contribution density. The quintiles are specific by
birth cohorts as of 2016 and grouped by five-year increments (21-25, 26-30...61-64) in order
to reduce life-cycle effects. The type of occupation, employee or self-employed, corresponds
to that recorded in the last contribution. The date of the last contribution indicates the last
time the individual was registered in an occupation where she contributed to a pension fund.
As pension contribution is compulsory only for formal sector employees, we cannot clearly
observe whether or not the individual was unemployed.
In this sample, 53 percent of individuals (34,237) chose the load factor fee, while 47 percent
(30,351) were assigned to the balance fee. This is interesting for our analysis because choosing
the load factor fee is an active decision; individuals had to inform the AFP and follow a specific
procedure. Despite this transaction cost, a significant portion of our population of interest seems
to have opted for it.
On average, individuals assigned to the balance fee are younger than those who chose the
load factor fee (38 versus 41 years old), more predominantly male (69 percent versus 61 per-
cent), have spent less time in the SPP (8.3 versus 10.4 years), and have lower pension balances
(S/.20,244 versus S/.50,316) and incomes (S/.1,872 versus S/.3,194, on average). The frequency
or density of contributions also differs significantly. Individuals assigned to the balance fee con-
tribute during, on average, 47 percent of the time they are enrolled, while individuals who chose
the load factor fee contribute 79 percent of the time.
A sort of revealed preference for risk can be inferred from the distribution of individuals
among the different fund types. The large majority of individuals, regardless of the fee scheme,
invest their funds in the fund type 2, the default and moderate-risk portfolio. However, within
those who opted for the load factor fee, the proportion of individuals who choose a riskier
fund type 3 is composed of investments up to 80 percent in equities and up to 70 percent in short-term fixed-income
instruments.
10Table 1: Mean Differences among Individuals by Actual Fee
Variable Dummy Overall Balance fee Load factor Mean diff
fee
(N=64,588) (N=30,351) (N=34,237)
Mean S.E. Mean S.E. Mean S.E Mean S.E. p-value
Male D 0.651 0.694 0.613 0.081 0.004 0.000
Age 39.663 9.810 38.401 9.874 40.782 9.615 -2.381 0.077 0.000
Balance not charged with fee (S/. ’000) 33.907 92.148 15.397 50.395 50.316 114.868 -34.919 0.685 0.000
Balance charged with fee (S/. ’000) 2.278 8.043 4.847 11.190 0.000 0.000
Total saving balance (S/. ’000) 36.185 93.801 20.244 57.973 50.316 114.868 -30.072 0.704 0.000
1st quintile D 0.200 0.357 0.061 0.296 0.003 0.000
2nd quintile D 0.200 0.240 0.165 0.075 0.003 0.000
3th quintile D 0.200 0.173 0.224 -0.051 0.003 0.000
4th quintile D 0.200 0.134 0.259 -0.125 0.003 0.000
5th quintile D 0.200 0.097 0.291 -0.195 0.003 0.000
Monthly labor income (S/.) 2,572.8 6,622.2 1,871.8 5,818.8 3,194.3 7,203.8 -1,322.4 51.296 0.000
1st quintile D 0.206 0.287 0.135 0.152 0.003 0.000
2nd quintile D 0.195 0.223 0.170 0.053 0.003 0.000
3th quintile D 0.199 0.198 0.200 -0.003 0.003 0.366
4th quintile D 0.201 0.169 0.229 -0.059 0.003 0.000
5th quintile D 0.199 0.123 0.266 -0.143 0.003 0.000
Contribution density 0.638 0.326 0.468 0.322 0.788 0.246 -0.320 0.002 0.000
1st quintile D 0.200 0.370 0.050 0.320 0.003 0.000
2nd quintile D 0.200 0.258 0.148 0.110 0.003 0.000
3th quintile D 0.200 0.166 0.230 -0.064 0.003 0.000
4th quintile D 0.200 0.113 0.277 -0.164 0.003 0.000
5th quintile D 0.200 0.093 0.295 -0.202 0.003 0.000
Self-employed D 0.028 0.031 0.025 0.006 0.001 0.000
Years enrolled in SPP 9.389 6.149 8.265 6.019 10.386 6.091 -2.121 0.048 0.000
AFP Integra D 0.398 0.387 0.408 -0.021 0.004 0.000
AFP Profuturo D 0.329 0.364 0.298 0.066 0.004 0.000
AFP Prima D 0.269 0.246 0.289 -0.044 0.003 0.000
AFP Habitat D 0.004 0.003 0.005 -0.001 0.000 0.007
Fund type 1 (secure) D 0.036 0.030 0.041 -0.012 0.001 0.000
Fund type 2 (moderate) D 0.892 0.923 0.865 0.059 0.002 0.000
Fund type 3 (risky) D 0.072 0.047 0.094 -0.047 0.002 0.000
Active portfolio management D 0.079 0.051 0.105 -0.053 0.002 0.000
Have recognition bond D 0.040 0.021 0.056 -0.035 0.001 0.000
Note: The table uses the analyzed sample of SBS administrative registers as of December 2016. The mean differences are computed using two-
sample t-tests by groups (balance and load factor fee schemes) with unequal variances. The means with finite variance of variables of income,
contribution density and pension balance have normal distribution. The test on the equality of proportions is used for dummy variables.
.
11portfolio (composed of up to 80 percent equities) is double the proportion observed within
those who were assigned to the balance fee (9.4 versus 4.7 percent), might mean that they are a
more financially sophisticated group. Furthermore, there are more individuals actively involved
in portfolio management (our proxy for financial literacy) within the group choosing the load
factor fee than in the group choosing the balance fee (10.5 versus 5.1 percent).
In summary, the individuals who decide to keep the load factor fee are slightly older, have
spent more time in the SPP, are more likely to be women, earn higher incomes, have more
pension savings, contribute more often, have slightly more tolerance of risk and are more active
in portfolio management than the group of individuals who choose the balance fee. Differences
by gender are reported in Table A.5 in the appendix.
4 Assessing the choice of fee
4.1 Charge ratios
We seek to evaluate the potential effect of the choice of fee scheme on the level of pension
wealth; that is, on the final balance accrued for retirement. An illustrative and easily imple-
mentable measure for this purpose is the so-called “charge ratio” (Whitehouse (2001), Tapia
and Yermo (2008), Murthi et al. (1999), Aguila et al. (2014)). The charge ratio indicates the
proportion of fees in the accumulated fund:
Sl, f ee
l
λ = 1 − l,no f ee (1)
S
Sm, f ee
m
λ = 1 − m,no f ee (2)
S
λ l and λ m are the charge ratios for the load and balance fees, respectively, computed at 65,
the age of retirement. The value of Sl, f ee is the balance an individual would obtain with her
pension contributions under the load factor fee, while Sl,no f ee is the balance she would obtain
if both contribution and fee were accumulated in the pension fund account. Similar definitions
apply for the funds accrued under the balance fee, defined as Sm, f ee and Sm,no f ee . The most
convenient fee scheme for an individual is the one with a lower charge ratio. Thus, if λ l < λ m ,
then the load factor fee would be the best option for the individual. The rationale behind the
charge ratio is that it can reveal which scheme allows an individual to obtain a higher final fund
relative to the invested amount.
Our strategy consists of, for each individual, comparing the charge ratios of both fees - that
of the fee actually chosen and that of the other fee if it had instead been selected. So, each
individual case serves as its own control.
124.2 Simulation
The computation of charge ratios requires the estimation of the individual’s future balance under
each fee scheme: Sl, f ee , Sl,no f ee , Sm, f ee , and Sm,no f ee . We denote d jt as a percentage deducted
from the individual’s income (wt ) including the pension contribution (ct ) to the savings account
and the management fee, a jt , with j = 1, 2, 3 indicating the type of fee. Under the load factor fee,
the unique charge is a1t , so that the income deduction is d1t = ct + a1t . The balance fee scheme
includes both a load factor fee, a2t , that will gradually decrease down to zero in 2023, and a
balance fee, a3t , that is levied as a proportion of the balance and will remain indefinitely. Thus,
under this scheme, the deduction is d2t = ct +a2t up to 2023 and d2t = ct afterwards. Individuals
make pension contributions with probability pt , and the savings balances earn returns rt . The
individuals also pay an insurance premium to private firms, but we do not include it in the
simulation. The accumulation of the savings balance follows a monthly (t) discrete process:
l, f ee
St+1 = St (1 + rt ) + pt+1 (d1t+1 − a1t+1 )wt+1 (3)
m, f ee
St+1 = S0 (1 + rt ) + Sta (1 + rt )(1 − a3t+1 ) + pt+1 (d2t+1 − a2t+1 )wt+1 (4)
Equations 3 and 4 describe the accumulation processes for individuals who choose the load
factor fee and those who choose the balance fee, respectively. In equation 4, the balance fee
(a3t ) applies only to the new savings accumulated after the reform (Sta ) and not to the previously
accrued balance (S0 ).
To compute the charge ratios for each fee scheme, we also use the counterfactual pension
balance assuming pension contributions and fees are invested in the individual balance. For this
purpose, we define the following accumulation processes:
l,no f ee
St+1 = St (1 + rt ) + pt+1 d1t+1 wt+1 (5)
m,no f ee
St+1 = S0 (1 + rt ) + Sta (1 + rt ) + pt+1 d2t+1 wt+1 (6)
The future balances (equations 3, 4, 5 and 6), and therefore the charge ratios, critically
depend on the combination of values set for the fees. The following example illustrates this
point. Assume individuals live for two periods; in the first they contribute and in the second
they retire. They do not have a previously accrued balance and their probability of contributing
is equal to one. Under the balance fee scheme, the final balances are Sm, f ee = cw(1 + r)(1 − a3 )
and Sm,no f ee = (c + a2 )w(1 + r). On the other hand, under the load factor fee scheme, the final
balances are Sl, f ee = cw(1 + r) and Sl,no f ee = (c + a1 )w(1 + r). Therefore, the computed charge
3)
ratios are λ l = 1 − (c+ac
and λ m = 1 − c(1−a
(c+a2 ) . We cannot easily distinguish which scheme
1)
offers a lower charge ratio - the best scheme for the individual - as the values of the charge ratios
13crucially depend on the values of the contribution rate and fees.
Interestingly, the difference between charge ratios (∆ml = 100 × (λ m − λ l )) can indicate the
degree of loss or gain in terms of the percentage change in the final savings balance due to the
choice of a fee scheme. The gains of an individual choosing the load factor fee are equal to ∆ml
if λ l < λ m and her losses are equal to ∆ml if λ l > λ m . In the case of an individual choosing the
balance fee, her gains are equal to−∆ml if λ l > λ m , and her losses are equal to −∆ml if λ l < λ m .
The four balance types are simulated for each individual from January 2017 until each in-
dividual reaches 65. In this exercise, we cannot use the fees already paid between the dates
of policy implementation (June 2013) and our sample (December 2016), but the effect on the
charge ratios should be rather small due to the short period.
The fees are assumed to be equal to their current levels (as of December 2016) for the
simulation period, except for the temporary load factor fees of the balance fee scheme, which
have to steadily decline to zero on February 2023.11 Labor income evolves at growth rates -
specific to gender, income quintile and birth cohort - that are estimated using SPP’s individual
data from years 2006 and 2013.
The probability of making pension contributions pt is proxied by the observed contribution
density, which is the number of months with contributions over the total number of months
enrolled in the SPP. The available densities of individuals’ contributions in the administrative
data begin in May 2006, as the records before this date are less reliable.
The investment return rate is a crucial determinant of retirement wealth. By regulation,
pension fund managers use the so called “share value”, which is the unit of measure of the
fund’s value. Share values are calculated and published daily by the SBS. The pension balance
of an individual in period t is the number of shares in the pension fund that the individual holds
at t multiplied by the share value of period t. Similarly to Chávez-Bedoya (2017), we assume
that the share values follow the stochastic process in a Geometric Brownian Motion (GBM),
that has both a deterministic and random Wiener component:
dV (t) = µV (t)dt + σV (t)dW (t) (7)
V (t) indicates the share value in period t (with V (0) = V0 ); W (t) is a Wiener process or
Brownian motion; µ denotes the average return and σ denotes the volatility. The first compo-
nent of equation 7 is used to model deterministic trends, while the second one is used to model
a set of unpredictable events occurring during this motion. To model this process, we use data
from AFP Integra’s pension fund from January 2001 to December 2017. We chose this pension
fund because it contains an important share of the market and has been part of the SPP since
11 The values are as follows: i) load factor fee: 1.55 percent for Integra, 1.60 for Prima, 1.69 for Profuturo and
1.47 for Habitat; ii) temporary load factor fee in the balance fee scheme: 1.23 percent for Integra, 1.19 for Prima,
1.46 for Profuturo and 0.38 for Habitat; iii) balance fee in the balance fee scheme: 1.20 percent for Integra, 1.25
for Prima, 1.20 for Profuturo and 1.25 for Habitat. See Table A.2 in the appendix for more details. In the section
on sensitivity checks, we consider alternative values for fees.
14the beginning of the system without any merge or acquisition. For the deterministic component,
we assume an average real annual rate of return of 5 percent. This assumption follows SBS
(2013) and is based on the fact that as an economy registers sustainable growth and its stock
market develops, the country’s risk and pension fund returns should reduce. The evidence from
OECD countries shows that real annualized rates of pension funds were lower than 5 percent
between 2002 and 2011. Furthermore, the annualized rate of returns of the Chilean private
pension system (which has been in place for more than 35 years) decreased from 14 percent
in the first 10 years of operation to 5 percent over the 30 years of operations. Volatility is set
at σ = 1.27 percent, which is the figure arising from the returns (excluding 2005-2011 due to
abnormal returns). We conduct 1,000 GBM simulations in order to obtain different paths for
the share values and, therefore, different paths for the rates of returns. We take the average of
all the simulations for the share values.
The first results for the computed values of charge ratios show large heterogeneity. For
example, the simulations reflect that, on average, the load factor fee is better for individuals
younger than 40 (at the moment of the policy implementation), while the balance fee is gen-
erally better for older individuals (see Table A.6 in the appendix). Clearly, many individuals
inadvertently chose the less advantageous fee scheme and for many others, the new default
scheme was not the best option. The next section will more carefully analyze individual choice
and its consequences.
5 Results
5.1 Who gains and who loses with the policy?
Table 2 summarizes our main results. The columns indicate whether each individual falls into
the balance fee (default) or deliberately chooses the load fee. Based on the comparison of
charge ratios arising from our simulations, the rows specify which fee scheme is better for the
individual.
We find that the policy reform is beneficial to only 36.9 percent of the individuals in our
sample, while it is adverse to 63.1 percent. On the one hand, 3,604 individuals benefit from the
balance fee and 20,239 benefit from the load factor fee. So, only a total of 23,843 out of 64,588
individuals (36.9 percent) made the right choice and chose the fee with the lower charge ratio at
the time the policy gave them the chance to do so. On the other hand, a total of 40,745 individu-
als (63.1 percent) actively chose the worse fee or were assigned to the default despite its disad-
vantages. For individuals assigned to the balance fee, 88 percent (=26,747/30,351) are currently
losing money in comparison to the balance they would have had under the load factor fee. Sim-
ilarly, among the individuals who chose the load factor fee, 41 percent (=13,998/34,237) made
the wrong decision. They would be better off under the default option. We can interpret the
causes of this overall negative result as both unintended policy effects and an lack of soundness
15in individual financial decisions.12
Table 2: Winners and Losers with the Balance and Load Factor Fees
Actual fee
Balance fee Load factor fee Total
(default option) (active choice)
Balance fee is better 3,604 13,998 17,602
Load factor fee is better 26,747 20,239 46,986
Total 30,351 34,237 64,588
Note: One fee scheme is better than the other one if it has a lower charge ratio. The columns under Actual fee
indicate the current fee of the individual.
As mentioned before, the original policy reform promoted by the government was amended
by the Parliament, which compromised the consistency of the policy. Originally, the govern-
ment intended to fully replace the load factor fee with a balance fee for all individuals and
expected a declining trend of fees driven by competition among pension funds. However, the
intervention of the Parliament, which allowed individuals to remain in the load fee scheme,
reduced the mass of contributors who could pay the balance fee and therefore might have lim-
ited the reduction of fees due to competition. Other important reasons for our results could be
passive choice and complexity (Beshears et al. (2008)). Recall that many individuals in our
sample did not make an active choice and accepted the default scheme (passive choice). This
acceptance might reflect a conscious decision, but is more likely to reflect procrastination or in-
ertia, because the marginal cost of procastinating was small (i.e. no paperwork or monetary cost
was required to subscribe to the new balance fee, but a great deal of paperwork was required
to remain in the load factor fee). Therefore, is not surprising that many individuals’ prefer-
ences revealed in our sample are inconsistent. On the other hand, the complexity of the reform
(i.e. a temporary load factor and balance fee embedded in the balance fee scheme) might also
have increased the proportion of individuals who simply accepted the default. This complexity
also might have added noise or biased choices because individuals may not have thoroughly
understood the options and deadlines, may have decided to avoid thinking about complicated
alternatives or may have even chosen a complicated alternative without estimating the future
impact. Finally, low financial literacy could also drive our results; one can imagine that the ef-
fects of passive choice and complexity might be even stronger for individuals who lack financial
knowledge. We are not able, unfortunately, to analyze inertia or complexity, but we are able to
explore financial literacy in our data.
To this end, we run a probit model to determine the likelihood of an individual choosing
the load fee. Table 3 displays the results. The regressions include regional (individual’s region
12 Table A.7 in the appendix shows important differences in the percentage of individuals making a right or
wrong choice across AFP. With 32.3 percent, Profuturo has the lowest share of persons making the right choice,
while this percentage is 37.1, 42.1 and 42.5 percent in Integra, Prima and Habitat, respectively.
16of residence) fixed effects in order to control for possible unobservables at the region level.
The table reports the marginal effects on the probability that the individual will choose the load
factor fee. The dependent variable equals one if the individual chooses the load factor fee and
zero otherwise. The only difference between the two model specifications displayed in Table
3 is that the first uses the pension fund type of the individual, while the second includes a
variable measuring whether the individual actively manages her pension fund portfolio, which
may capture financial literacy.
Table 3: Probability of Choosing the Load Factor Fee
Model 1 Model 2
Coef. S.E. Coef. S.E.
Male -0.1074*** (0.0046) -0.1075*** (0.0046)
Age 0.0026*** (0.0004) 0.0021*** (0.0004)
Contribution density 0.6206*** (0.0110) 0.6237*** (0.0110)
Pension balance - 2nd quintile 0.1520*** (0.0076) 0.1503*** (0.0076)
Pension balance - 3th quintile 0.1914*** (0.0088) 0.1885*** (0.0088)
Pension balance - 4th quintile 0.2096*** (0.0099) 0.2059*** (0.0099)
Pension balance - 5th quintile 0.2382*** (0.0114) 0.2334*** (0.0114)
Income - 2nd quintile 0.0100 (0.0070) 0.0101 (0.0070)
Income - 3th quintile 0.0362*** (0.0070) 0.0366*** (0.0070)
Income - 4th quintile 0.0496*** (0.0073) 0.0500*** (0.0073)
Income - 5th quintile 0.0637*** (0.0085) 0.0643*** (0.0085)
Self-employed 0.0557*** (0.0136) 0.0547*** (0.0136)
Years enrolled in SPP 0.0017*** (0.0006) 0.0021*** (0.0006)
AFP Profuturo -0.0134*** (0.0051) -0.0134*** (0.0051)
AFP Prima 0.0261*** (0.0055) 0.0260*** (0.0055)
AFP Habitat -0.0656* (0.0342) -0.0705** (0.0342)
Fund type 1 (low-risk) -0.0480*** (0.0136)
Fund type 3 (high-risk) 0.0197** (0.0088)
Active portfolio management 0.0230*** (0.0085)
pseudo R2 0.211 0.211
N 64,588 64,588
Note: The dependent variable takes value one if the individual chose the load factor fee and zero otherwise. The coefficients are
the marginal effects of probit regressions. All regressions include regional fixed effects. The reference category for the balance
and income quintiles is the first quintile, for self-employed is employee, for the fund administrators is AFP Integra, and for the
fund type is the fund type 2 (moderate). Robust standard errors are in parentheses. *pprobability of choosing the load factor fee. This choice is positively associated with the position
of the individual in the distributions of income and savings balance. So, income-rich or pension
balance-rich individuals are more likely to choose the load factor fee. The position within
the pension balance distribution has a more sizable effect than that of the income distribution.
For example, moving from the first to the fifth quintile of income increases the probability of
choosing the load factor fee by 6.4 percentage points, while this effect is 23.3 percentage points
for the same quintiles of the pension balance distribution. Moreover, being active in the risk
management of the one’s own pension fund is associated with an increase of 2.3 percentage in
the likelihood of choosing the load factor fee. This may indicate that individuals with more
financial literacy are more likely to choose the load factor fee, thus opting out of the default.13
5.2 The extent of gains and losses
Although we find that a large share of individuals lose money in their current fee schemes, we
also assess the intensity of these losses and whether some gains exist. As explained in Section
4.2, the difference in charge ratios (∆ml ) indicate the degree of gains or losses in terms of the
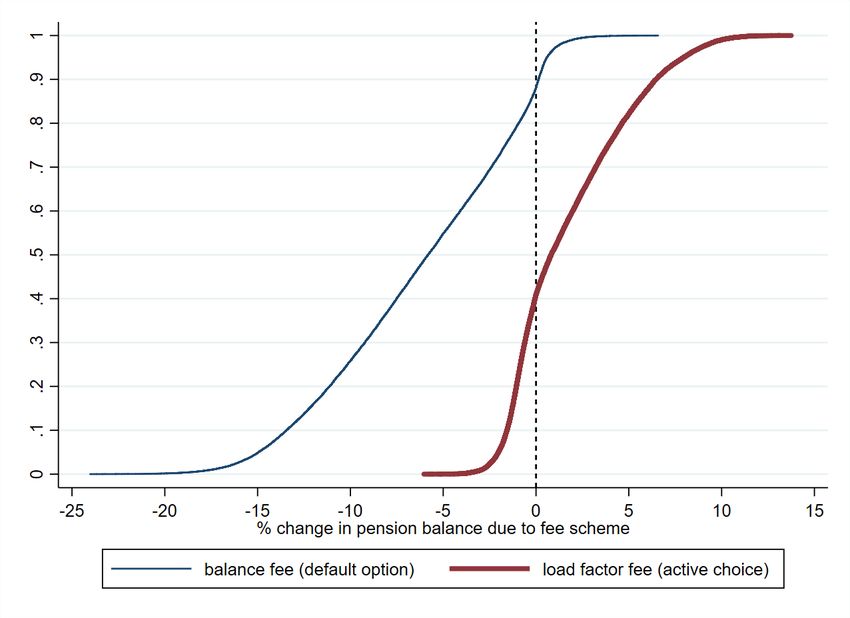
percentage change in the final pension balance. Figure 3 shows the cumulative distribution of
this variable by type of fee in order to illustrate the intensity of gains and losses. The thin blue
line shows the cumulative distribution for individuals assigned to the balance fee, and the thick
red line represents the cumulative distribution for the individuals who chose the load factor fee.
The figure shows that the intensity of the loss is very high for those who chose the balance
fee. On the contrary, gains are considerably lower. For example, 20.2 percent of these individu-
als will lose between 10 and 15 percent of their final pension balance, and about 4.1 percent will
lose more than 15 percent. Among the individuals assigned to the balance fee, the average size
of the change in pension balance is -7.0 percent for those who lose, 0.9 percent for those who
gain and -5.9 percent for all individuals. In contrast, as shown in Figure 3, the losses among the
individuals who opted for the load factor fee are less severe. On average, the size of the change
in the pension balance is -1.3 percent for those who lose, 3.6 percent for those who gain and 1.4
percent for all the individuals in this scheme.
13 It
is worth noting that, in model 1, having a low-risk fund (fund type 1) or a higher-risk fund (fund type 3) are
associated with a decrease of 4.8 percentage points and an increase of 2.0 percentage points, respectively, in the
probability of choosing the load factor fee. So, the individuals that are more willing to take risk are more likely to
choose the load factor fee.
18Figure 3: Cumulative Gains/Losses due to Fee Scheme
Losses and gains vary largely over age. As Table 4 shows, young individuals (those below 40
years old) with the default balance fee are the main losers of the reform. Choosing this scheme
means that these individuals pay more to the AFP itself, resulting in lower pension balances.
For example, all individuals in the 21-25 age group lose money, and their pension balances
are reduced 13.6 percent, while the 51-55 age group is less affected because only 34 percent
lose money and their balances are reduced by much less (1.4 percent). Table 4 also shows the
losses and gains for individuals who opted for the load factor fee. In this case, individuals above
45 years old lose more but the change in their pension balances ranges between -1.4 and -0.9
percent.
Tables A.8, A.9 and A.10 in the appendix provide additional results by quintiles of income,
density of contribution and pension balance. The main result is that independent of the quintile,
a significant proportion (around 86 percent) of individuals assigned to the balance fee are worse
off financially due to the reform. Their retirement savings have been reduced by around 7.0
percent.
19Table 4: Losses and Gains by Actual Fee and Age Group
Type of choice Measure 21-25 26-30 31-35 36-40 41-45 46-50 51-55 56-60 61-64 Total
Balance fee % individuals losing 100.0 100.0 100.0 100.0 95.8 78.5 42.5 23.2 19.6 88.1
(default option) % individuals gaining 0.0 0.0 0.0 0.0 4.2 21.5 57.5 76.8 80.4 11.9
avg % change in balance (for those losing) -13.9 -11.2 -8.4 -5.7 -3.4 -1.9 -1.4 -0.9 -0.3 -7.1
avg % change in balance (for those gaining) 0.0 0.0 0.0 0.0 0.3 0.7 0.8 0.9 0.5 0.8
avg % change in pension balance (for all) -13.9 -11.2 -8.4 -5.7 -3.3 -1.4 -0.1 0.5 0.4 -6.2
Load factor fee % individuals losing 0.0 0.0 0.0 0.4 57.3 100.0 100.0 100.0 100.0 40.9
20
(active choice) % individuals gaining 100.0 100.0 100.0 99.6 42.7 0.0 0.0 0.0 0.0 59.1
avg % change in balance (for those losing) 0.0 0.0 0.0 -0.2 -0.4 -1.2 -1.7 -1.6 -0.7 -1.1
avg % change in balance (for those gaining) 9.4 6.6 4.0 1.7 0.4 0.0 0.0 0.0 0.0 3.76
avg % change in pension balance (for all) 9.4 6.6 4.0 1.7 -0.1 -1.2 -1.7 -1.6 -0.7 1.7
Total % individuals losing 66.5 55.6 48.9 45.3 74.2 91.1 77.6 69.5 66.2 63.1
% individuals gaining 33.5 44.4 51.1 54.7 25.8 8.9 22.4 30.5 33.8 36.9
avg % change in balance (for those losing) -13.9 -11.2 -8.4 -5.7 -2.1 -1.4 -1.6 -1.5 -0.6 -5.1
avg % change in balance (for those gaining) 9.4 6.6 4.0 1.7 0.4 0.7 0.8 0.9 0.5 3.3
avg % change in pension balance (for all) -6.1 -3.3 -2.1 -1.6 -1.5 -1.2 -1.1 -0.7 -0.2 -2.05.3 Determinants of choosing well
In this section we analyze the main determinants of choosing the fee scheme that best serve
the interests of the individuals. Table 5 displays the results. The first set of results shows the
marginal effects of a probit model where the dependent variable equals one if the individual
has the fee scheme with the lower change ratio, and zero otherwise. Males are slightly less
likely to make a good choice. Being male reduces the likelihood of making a good decision
by 3.1 percentage points. With each additional year in an individual’s age, we see a reduction
of 0.5 percentage points in the likelihood that individual made a good choice. Although this
is a small effect for one extra year, we observe important differences between young and old
individuals. For example, the probability of choosing the right fee scheme is about 13.5 percent
higher for a 25-year-old than for a 55-year-old. Contribution density and self-employment,
along with the quintile in the pension balance distribution, are positively associated with the
likelihood of making a good choice, but the effect of the income position is less clear or less
precisely estimated. For example, moving from the first to the fifth quintile of the pension
balance distribution boosts the probability of making a good choice by 25.6 percentage points.
Furthermore, being active in portfolio management – our proxy for financial literacy – increases
the likelihood of making a good choice by 3.3 percentage points.
The second set of results in Table 5 shows the OLS estimates of the percentage change in the
pension balance (∆ml ). Age and contribution density are two of the most important variables
that determine the size of the gains and losses. For example, moving from the second to the
third quintile of the age distribution (from age 39 to 47) is associated with a percentage change
of 0.99 in the pension balance. Similarly, moving from the second to the third quintile of the
distribution of contribution density is associated with an increase of 0.84 percentage points in
the pension balance. Further, a higher position in the pension balance distribution, and being
self-employed, are also associated with larger gains. However, having spent more years enrolled
in the SPP is related with higher losses. Being active in portfolio management is associated with
gains of 0.18 percentage points. In summary, the policy reform seems to produce higher losses
for individuals who are younger, male and employees, and who have low pension balances,
contribute less often, have spent more years in the SPP and are less active in the management
of their pension funds.
21You can also read