WORKING PAPER FORSCHUNGSFÖRDERUNG - Evaluation of Lithium-Ion Battery Cell Value Chain - Hans ...
←
→
Page content transcription
If your browser does not render page correctly, please read the page content below
WORKING PAPER
FORSCHUNGSFÖRDERUNG
Number 168, January 2020

Evaluation of Lithium-Ion Battery
Cell Value Chain

Varvara Sharova, Paul Wolff, Benedikt Konersmann,
Ferdinand Ferstl, Robert Stanek and
Markus Hackmann
Authors

Ferdinand Ferstl is a Consultant and Li-ion cell expert at P3 automo-
tive, focusing on the raw materials and cost calculations.

Markus Hackmann is an Executive director at P3 automotive GmbH.

Benedikt Konersmann is a Consultant and Li-ion expert at P3 automo-
tive GmbH, specializing on all-solid-state technology and manufacturing
processes of Li-ion battery cells.

Dr. Varvara Sharova is a Consultant and Li-ion cell expert at P3 auto-
motive GmbH, specializing on cell chemistry as well as supplier and test
management.

Robert Stanek is a Global e-mobility advisor at P3 automotive GmbH.

Paul Wolff is a Consultant at P3 automotive GmbH with expertise in
manufacturing processes of Li-ion batteries and e-powertrain compo-
nents.

© 2020 by Hans-Böckler-Stiftung
Hans-Böckler-Straße 39, 40476 Düsseldorf, Germany
www.boeckler.de

„Evaluation of Lithium-Ion Battery Cell Value Chain“ by Varvara Sharova
et al. is licensed under
Creative Commons Attribution 4.0 (BY).
Provided that the author’s name is acknowledged, this license permits
the editing, reproduction and distribution of the material in any format or
medium for any purpose, including commercial use. The complete li-
cense text can be found here:
https://creativecommons.org/licenses/by/4.0/legalcode
The terms of the Creative Commons License apply to original material
only. The use of material from other sources, such as graphs, tables,
photographs and texts, may require further permission from the rights
holder.

ISSN 2509-2359
SHAROVA ET AL: EVALUATION OF LITHIUM-ION BATTERY CELL VALUE CHAIN | 3

Contents
Abstract .................................................................................................. 6
Introduction ............................................................................................ 7
Basics of Lithium-Ion Battery Cell ........................................................... 8
Lithium-Ion Value Chain Evaluation ...................................................... 10
    Raw Material.................................................................................... 10
    Material Production .......................................................................... 16
    Electrode Manufacturing .................................................................. 21
    Cell Manufacturing ........................................................................... 23
    Battery Cell Recycling ...................................................................... 28
Market Insights and Selection of Partners for Future Collaborations .... 30
Conclusion ........................................................................................... 36
References ........................................................................................... 37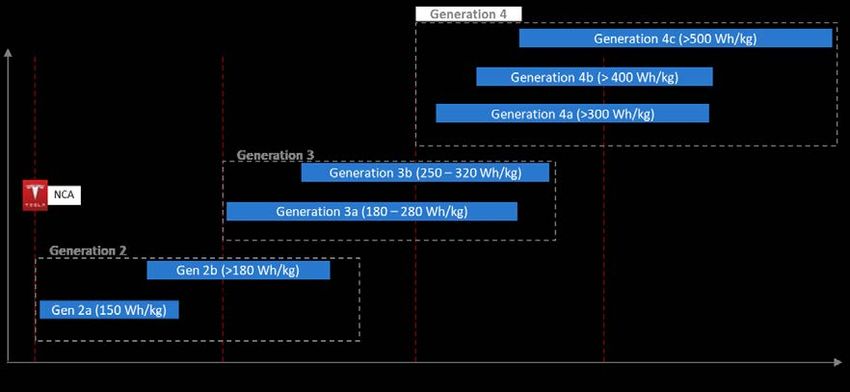
SHAROVA ET AL: EVALUATION OF LITHIUM-ION BATTERY CELL VALUE CHAIN | 4

Figures
Figure 1: Working principle of a Li-ion cell (upon discharge)................... 8
Figure 2: Overview of the Li-ion battery cell value chain stages............ 10
Figure 3: Overview of the materials availability for Li-ion cell
   production ........................................................................................ 11
Figure 4: Overview of NMC synthesis................................................... 18
Figure 5: Overview of the natural graphite synthesis ............................ 19
Figure 6: Overview of the synthetic graphite synthesis ......................... 20
Figure 8: LiB cell formats: cylindrical (left), pouch (middle),
   prismatic (right) ................................................................................ 24
Figure 9: Overview of the cell assembly steps using three cell
   formats ............................................................................................ 25
Figure 10: Overview of the formation and aging process steps ............ 26
Figure 11: Technology roadmap of Li-ion cell generations.................... 31
Figure 12: Example of an advanced cell technology cost
   breakdown – NMC622 pouch cell .................................................... 32
Figure 13: Required changes in the cell manufacturing process for
   the all-solid-state cell production ...................................................... 33
Figure 14: Overview of Li-ion cell market players (with a focus on
   Germany and France) ...................................................................... 34
Figure 15: Overview of the existing European consortia (extract) ......... 35
SHAROVA ET AL: EVALUATION OF LITHIUM-ION BATTERY CELL VALUE CHAIN | 5

Tables
Table 1: Top cobalt mining companies ................................................. 12
Table 2: Top cobalt refining companies ................................................ 12
Table 3: Top lithium mining companies ................................................ 13
Table 4: Top nickel mining companies.................................................. 13
Table 5: Top nickel refining companies ................................................ 14
Table 6: Top manganese mining companies ........................................ 14
Table 7: Top manganese refining companies ....................................... 15
Table 8: Top graphite mining companies .............................................. 15
Table 9: Top NMC manufacturers ........................................................ 17
Table 10: Top natural graphite manufacturers ...................................... 18
Table 11: Top synthetic graphite manufacturers ................................... 20
Figure 7: Overview of the electrode manufacturing process steps ........ 21
Table 12: Electrode production market participants and equipment
  manufacturers.................................................................................. 22
Table 13: Overview of the inactive materials suppliers (extract) ........... 23
Table 14: Overview of the cell assembly value chain participants
  and equipment manufacturers ......................................................... 27
Table 15: Recycling efficiency for various elements and selected
  methods for NMC and LFP chemistries ........................................... 28
SHAROVA ET AL: EVALUATION OF LITHIUM-ION BATTERY CELL VALUE CHAIN | 6

Abstract
Li-ion batteries (LiB) have been widely employed in the various applica-
tions, including power tools and consumer electronics. Due to the rising
awareness of climate change and the rising penalties for CO2 emissions,
electric vehicles with traction LiBs are considered an elegant solution. In
an electric vehicle, the battery comprises 30 to 40 percent of the total
cost and is considered one of the most complex components in terms of
technology.
    Modern Li-ion batteries are currently produced mostly by Asian manu-
facturers, who are also penetrating the European market. However,
prognosed demand for electric vehicles in Europe cannot be met just by
the existing production capacity. This gives the new European players
an opportunity to enter the market and establish local value chains.
    The Li-ion battery value chain consists of the six main stages, which
include extraction of raw materials, synthesis of active battery cell mate-
rials, manufacturing of electrodes and cells and, finally, recycling. The
stages related to the cell module and pack assembly are not covered
here as they are out of the scope of the current study. For each value
chain stage, we determined the main challenges and success factors
and emphasized the required competences. Furthermore, the main
players have been evaluated based on their production capacities and
experience. As followed from the evaluation, to allow uninterruptable
supply the upstream integration is beneficial. Furthermore, cooperation
with other players is essential to attain a competitive position in the mar-
ket. Based on that analysis, we propose a partner network with focus on
Germany/France for each stage of the LiB value chain.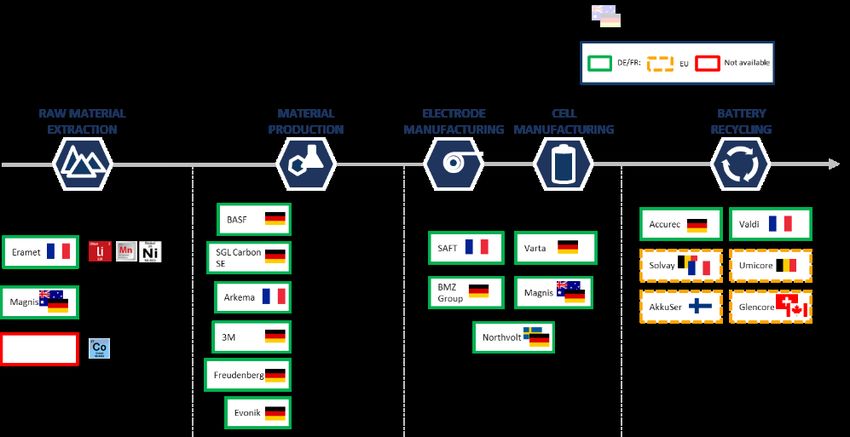
SHAROVA ET AL: EVALUATION OF LITHIUM-ION BATTERY CELL VALUE CHAIN | 7

Introduction
CO2 emission goals set by European Commission (Reducing CO2 emis-
sions from passenger cars, 2009) require an increasing electrification of
the automotive original equipment manufacturers’ (OEM) vehicle fleets.
Unlike internal combustion engine vehicles, the traction battery is the
key element in electric vehicles in terms of required know-how and value
added. From a technological and financial point of view the decisive fac-
tor is the performance of the Li-ion batteries (LiB), which are nowadays
mostly being manufactured by Korean, Chinese and Japanese manufac-
turers. The expected ramp-up volume for electric vehicles caused by the
demand for emission-free mobility will require LiB cell market growth of
several hundred GWh by 2025 – a volume that will give new manufac-
turers the opportunity to enter the market.
    To enter this, market European/German players will have to utilize ex-
isting expertise along the entire battery value chain to catch up the exist-
ing backlog to the market leaders from Asia. Therefore, it is necessary to
select the relevant network partners of the value chain in a field analysis
and evaluate them with respect to their expertise, know-how and experi-
ence.
    In this working paper all stages of the Li-ion cell value chain are de-
scribed consecutively – from the raw material extraction to the recycling
of cell components. The existing market players and the most important
competences are identified for every stage of the value chain. Based on
that, possible network partners in Europe (with focus on Germany/
France) are highlighted.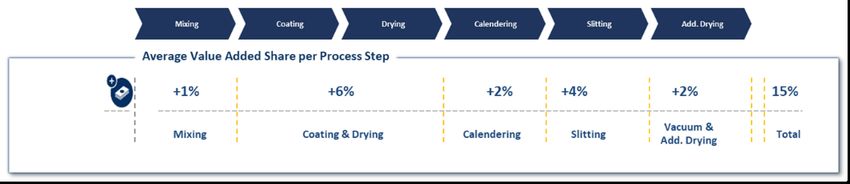
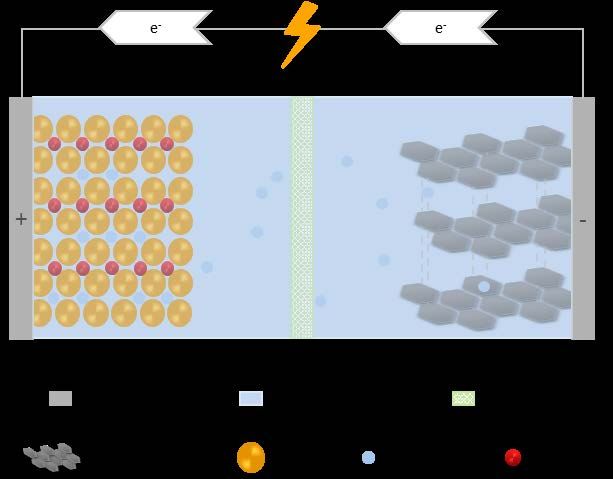
SHAROVA ET AL: EVALUATION OF LITHIUM-ION BATTERY CELL VALUE CHAIN | 8

Basics of Lithium-Ion Battery Cell
For a better understanding of the production steps of the Li-ion battery
cell, it is essential to get acquainted with its working principle and its
main components. Li-ion cell consists of two electrodes. The negative
(anode) is casted mostly on the copper foil, whereas the positive (cath-
ode) is casted on aluminum foil. A thin electron-insulating layer (aka
separator) soaked with the electrolyte (liquid ion-conducting media) sep-
arates the two electrodes. Upon charging the lithium ions, extracted from
the cathode, are shuttled through the separator/electrolyte and interca-
lated into the anode. At the same time, the electrons are flown in the
same direction through the external circuit. On discharge, as shown in
Figure 1, the opposite process takes place, providing the electrical pow-
er.

Figure 1: Working principle of a Li-ion cell (upon discharge)

Source: P3 own representation.
SHAROVA ET AL: EVALUATION OF LITHIUM-ION BATTERY CELL VALUE CHAIN | 9

As anode material graphite is mostly used, whereas lithium metal oxides
LiMO2 (i.e., LiNixMnyCozO2) are commonly employed as cathodes. Elec-
trolyte represents a mixture of organic solvents with a Li-conducting salt
dissolved in it. Finally, polymeric membranes or non-woven fabric mats
are the materials of choice for the separators. Li-ion cells are typically
available in three main formats, which will be in detail described in one
of the following chapters.
SHAROVA ET AL: EVALUATION OF LITHIUM-ION BATTERY CELL VALUE CHAIN | 10

Lithium-Ion Value Chain Evaluation
The Li-ion cell value chain represents a closed loop from the raw materi-
als extraction to the recycling of the cells. An overview of the value chain
is shown in Figure 2. As also marked in the figure, first four steps of the
value chain have the highest value added due to their complexity and
necessary know-how. The individual stages of the value chain will be
analyzed separately in the following. The value chain steps „cell module“
and „battery pack“ will not be discussed in the paper.

Figure 2: Overview of the Li-ion battery cell value chain stages

                                                   out of scope

Source: P3 own representation.

Raw Material
Incorporating a value add of approximately 80 percent from ore extrac-
tion to refined metal salts, raw material extraction stage plays a critical
role within the value chain of Li-ion battery cells. The key factor in this
stage is the access to the appropriate mines. Additional success factor
for the players in this stage includes the deep understanding of the ex-
traction processes of raw materials from mine ores. Ongoing research
on novel materials must be considered as well.
   One of the key challenges of raw material extraction is the availability
of ore deposits, which are also unevenly spread among the resources.
As illustrated in Figure 3, the main cathode precursors, namely, lithium,
high-grade nickel and cobalt may show a potential shortage. As the raw
material extraction is currently no core competence of automotive
OEMs, they strongly depend on mining and material companies, which
request high margins especially for the scarce materials. Furthermore,
SHAROVA ET AL: EVALUATION OF LITHIUM-ION BATTERY CELL VALUE CHAIN | 11 the construction of new mines (i.e., for lithium and cobalt) relates to long ramp-up times and complex licensing processes. Figure 3: Overview of the materials availability for Li-ion cell production Source: P3 own representation. Many raw materials are geographically concentrated in politically unsta- ble regions. For example, mining of cobalt is dominated by Democratic Republic of the Congo (DRC; >60 percent of the world’s mining), where the working conditions, including child labor, are not strictly controlled (Siddharth Kara, 2018). To ensure ethical supply of this material, high transparence of the whole value chain and its tracking are necessary. Cobalt is mostly extracted as a by-product from nickel (50 percent) and copper (44 percent) mining industries (Cobalt Institute). As men- tioned above, the largest cobalt producers are located in DRC as pre- sented in Table 1, whereas the refinement is dominated by Chinese companies, illustrated in Table 2. In 2016–2018, cobalt price increased by over 300 percent (Lithium and cobalt prices to remain under pressure as supply overtakes demand – report, 2019). This drastic price increase
SHAROVA ET AL: EVALUATION OF LITHIUM-ION BATTERY CELL VALUE CHAIN | 12

was related to the inadequate reaction of the market towards the grow-
ing demand of electric vehicles and mining companies seeking for a
profit from these geographically localized reserves. However, in 2019
cobalt prices have fallen due to the increasing number of mining suppli-
ers (Sanderson, 2019) and shift to the materials with low cobalt content.
Nonetheless, a new boost in cobalt prices due to mismatch of demand
and supply is not excluded (Why have Cobalt Prices crashed, 2019).

Table 1: Top cobalt mining companies

 Company name          Mining location      Mining capacity (t/a)     Market share
 Glencore             DRC, Australia                        42200              30 %
 China Molyb-
                      DRC                                   16800              12 %
 denum
 Jinchuan             DRC                                    8400              6%
 Norilsk Nickel       DRC, Russia                            7000              5%

Source: Distribution of cobalt production worldwide in 2016, by compa-
ny, 2016; Cobalt Statistics and Information; Cobalt Institute; Berman
et al., 2018.

Table 2: Top cobalt refining companies

                                                   Refining
 Company name          Refining location                              Market share
                                                 capacity (t/a)
 Huayou                      China                          17800              15 %
 Freeport Cobalt            Finland                         12900              10 %
 Jinchuan                    China                          12700              10 %

Source: Cobalt Institute; Here are the firms feeding China’s battery revo-
lution; Berman et al., 2018.

After development of large-scale lithium brine operations in South Amer-
ica (aka „lithium triangle“) in 1980’s (O’Brien et al., 2016), it has become
a predominant source of this metal, followed by Australian spodumene
production (The lithium-ion battery value chain. New Economy Opportu-
nities for Australia, 2018). Strong oligopolistic supply situation in the
market is especially pronounced for lithium extraction. As also shown in
Table 3, the four biggest mining companies control 77 percent of the lith-
SHAROVA ET AL: EVALUATION OF LITHIUM-ION BATTERY CELL VALUE CHAIN | 13
ium market. In lithium refinement, like for cobalt, China is constantly en-
hancing its capabilities (Azevedo et al., 2018).
Table 3: Top lithium mining companies
Mining
Company name Mining location Market share
capacity (t/a)
Albemarle Australia, Chile, U.S. 73000 31 %
SQM Chile 50000 21 %
Tianqi Australia 40000 17 %
FMC Argentina 19000 8%
Galaxy Resources Australia 15000 6%
Jiangxi Ganfeng Australia 11000 5%
Source: The lithium-ion battery value chain. New Economy Opportunities
for Australia, 2018; Berman et al., 2018.
Until now nickel market has been dominated by the established steel in-
dustry. However, due to the shift to Ni-rich cathode materials, the de-
mand for this metal is expected to grow drastically (Bernhart, 2019). This
is because only so called „1st class nickel“ is suitable for battery produc-
tion. Mining of this high purity material is economically reasonable from
the sulfidic ore deposits (Bohlsen, 2019), which comprise only 40 per-
cent of the total nickel reserves. Overall, nickel market is more frag-
mented, where mining and refining are often done by the same compa-
ny, as presented in Table 4 and Table 5.
Table 4: Top nickel mining companies.
Mining
Company name Mining location Market share
capacity (t/a)
Vale Brazil, Canada, etc. 248000 21 %
Norilsk Nickel Russia 201000 17 %
Glencore South Africa 106000 9%
DRC, Zambia,
Jinchuan Group 83000 7%
South Africa, China
Source: The lithium-ion battery value chain. New Economy Opportunities
for Australia, 2018; Berman et al., 2018.SHAROVA ET AL: EVALUATION OF LITHIUM-ION BATTERY CELL VALUE CHAIN | 14
Table 5: Top nickel refining companies
Refining
Company name Refining location Market share
capacity (t/a)
Vale Brazil, Canada, etc. 236000 21 %
Norilsk Nickel Russia 212000 19 %
Glencore Canada 138000 12 %
Source: The Li-ion Battery Value Chain. New Economy Opportunities for
Australia, 2018; Berman et al., 2018.
Manganese extraction is also dominated by the steel industry (approxi-
mately 90 percent), followed by the use for primary and rechargeable Li-
ion batteries (Boubou, 2019). Global reserves of manganese comprise
around 690 million tons, and are mostly located in South Africa, Australia
and India (European Commision Report on Raw Materials for Battery
Applications, 2018) as shown in Table 6. Manganese refinement in turns
is dominated by Ukrainian and Chinese companies, as show in Table 7.
Price of this material remains on a constantly low level. Furthermore, no
massive production bottleneck from other industries is expected. All
these leads to the conclusion that manganese does not belong to „criti-
cal“ materials for LiB production.
Table 6: Top manganese mining companies
Mining
Company name Mining location Market share
capacity (kt/a)
South Africa, Aus-
South32 5541 28 %
tralia
MOIL India 2700 13 %
Vale Brazil 1825 9%
ERG Kazakhstan 360 2%
Source: South32 2018 Financial Results, 2018; Vale Annual Reports;
ERG Manganese Ore Concentrate; Mazumdar, 2019.SHAROVA ET AL: EVALUATION OF LITHIUM-ION BATTERY CELL VALUE CHAIN | 15
Table 7: Top manganese refining companies
Refining
Company name Refining location Market share (%)
capacity (kt/a)
Hongxin Ukraine NA –
Hunan Dongfang Ukraine, China NA –
Ningxia China NA –
Source: Manganese – the third electric vehicle metal no one is talking
about, 2017; European Commision Report on Raw Materials for Battery
Applications, 2018.
Graphite being the state-of-the-art anode material can be divided into
natural and synthetic. Whereas natural graphite is extracted from ore,
synthetic one is produced from petroleum coke or tar pitch. China is the
global leader for the natural graphite supply with approximately 69 per-
cent market share, followed by India and Brazil (European Commision
Report on Raw Materials for Battery Applications, 2018) as Table 8
shows. Approximately 70 percent of the mined material accounts for
amorphous graphite, and only 30 percent for flake graphite, which is the
only one to be used as anode material in LiB (Benchmark Mineral Intelli-
gence – Graphite price assessment, 2018).
Table 8: Top graphite mining companies
Company name Mining
Mining location Market share
(extract) capacity (mt/a)
China Carbon China
780000 69 %
Graphite Group
Arunachal Pradesh India 150000 12 %
Extrativa Metalquim- Brazil
95000 8%
ica
SRG Graphite Canada 30000 3%
Source: The Li-ion Battery Value Chain. New Economy Opportunities for
Australia, 2018.SHAROVA ET AL: EVALUATION OF LITHIUM-ION BATTERY CELL VALUE CHAIN | 16
From the analysis of the raw material stage of the LiB value chain it can
be concluded that mining of certain critical materials is geographically
localized and oligopolized. Furthermore, a clear leadership of Chinese
companies can be observed in the refinement sector. Europe is using its
resources to small extent (European Commision Report on Raw Materi-
als for Battery Applications, 2018; Raw materials scoreboard European
innovation partnership on raw materials) and the dependency on import-
ed materials will increase in local battery factories. As the demand for
some resources is critical or is prognosed to become short, the Europe-
an companies must secure the value chains to enable the uninterrupta-
ble supply.
Material Production
Material production is strongly linked with the raw material sourcing. To
avoid possible shortage of the required sources due to a constantly in-
creasing worldwide demand on batteries, a trend towards the reduction
of critical or scarce materials can be observed in the Li-ion market.
Moreover, cell manufacturers increasingly consider upstream value
chain integration to secure the supply.
Market structure within this stage is very complex and not completely
transparent. Another challenge is the instability in the prices of the criti-
cal raw materials, which was already discussed in the previous chapter.
A rise of new players for „low-tech“-materials (like graphite) could be ob-
served in a market, thus, leading to a high level of competition. Moreo-
ver, development of next generation materials (e.g., required for all-
solid-state technology) might cause risks in view of their higher complex-
ity compared to state-of-the-art ones and/or the need for substitution of
active materials (i.e., from graphite to Li-metal) or inactive components
(i.e., from liquid to solid-state electrolyte).
Success factors for key players in this stage include upscaling with
constant material quality that is necessary for further cost reductions.
Furthermore, development of new synthesis routes with higher material
output and lower number of production steps is beneficial. Continuous
quality control of the materials and the used machinery are mandatory to
fulfill established specifications and ensure uniform cell performance.
Lithium nickel cobalt manganese oxide, also known as NMC has
been established as the state-of-the-art cathode material thanks to its
high operating potential vs lithium and high theoretical capacity. By in-
creasing the amount of Ni in the material (i.e., from NMC111 with equal
parts of Ni, Mn and Co to NMC622 with the ratio of Ni:Mn:Co of 6:2:2),SHAROVA ET AL: EVALUATION OF LITHIUM-ION BATTERY CELL VALUE CHAIN | 17
the capacity can be further elevated but at the expense of moderate cy-
cle life and safety compared to NMC111 (Noh et al., 2013). Table 10
presents an overview of the key players within the NMC production pro-
cess. As follows from Table 9, current key players in the market are the
cell manufacturers themselves as well as Asia-based companies. As cell
manufacturers possess know-how for cathode material synthesis, there
is a strong trend that shows an upstream integration of the cathode ma-
terial production within the value-chain to secure supply, utilize the cost
potentials and develop new technological USPs.
Table 9: Top NMC manufacturers
Manufacturing
Company name Market share
location
Internal (from cell manufacturers) – 14 %
Umicore Korea 12 %
Hunan ShanShan China 12 %
Xiamen Tungsten China 10 %
Nichia Japan 9%
L&F China 9%
Source: P3 analysis.
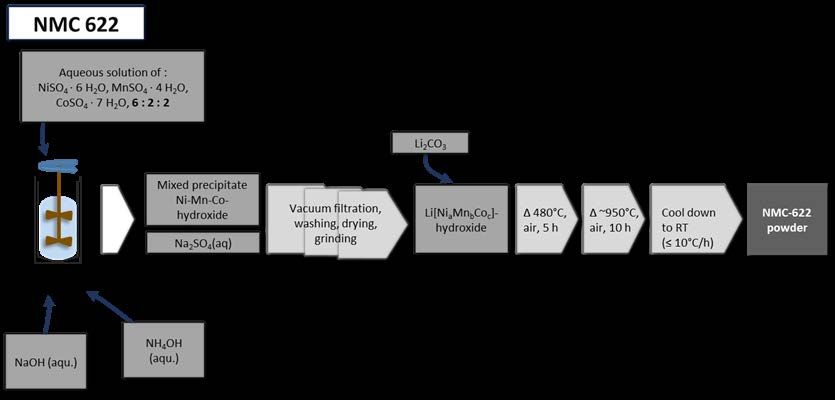
NMC622 is currently considered as a cathode material of choice, ena-
bling increase in the cell energy density and reduction of cobalt content
in comparison to its predecessor, NMC111. Figure 4 illustrates the pro-
duction process of this cathode material. As a first step aqueous solu-
tions of nickel, manganese and cobalt and different solvents are mixed
in a continuous stirred-tank reactor (CSTR). As a result, Ni-Mn-Co hy-
droxide precipitates from the solution. After certain vacuum filtration,
washing, drying, grinding, addition of lithium precursor (Li2CO3) and cal-
cination, the NMC622 powder, which can be further modified with re-
spect to the particle morphology, particle size and/or surface coating.
For other chemistries with even higher Ni concentrations, such as
NMC811 and lithium nickel cobalt aluminum oxide (NCA), LiOH·H2O is
used as a precursor instead of lithium carbonate, as it leads to enhanced
physical properties and improved material crystallinity (Fitch/Yakovleva,
2017).SHAROVA ET AL: EVALUATION OF LITHIUM-ION BATTERY CELL VALUE CHAIN | 18
Figure 4: Overview of NMC synthesis
Source: P3 own representation.
Graphite has been used as an anode material since more than 20 years
due to its low potential vs Li/Li+, high electronic conductivity and relative-
ly high specific capacity. A wide range of graphite materials including
natural, synthetic and composite ones is currently used as anode mate-
rials. Whereas natural graphite offers a cost advantage, the cell perfor-
mance can be improved with the synthetic graphite; a blend of two mate-
rials enables the balance of both characteristics (Verner, 2017).
Table 10 presents an overview of the key natural graphite manufac-
turers. As shown in the table, production of natural graphite is concen-
trated in Asia. China is dominating the market with approximately 49
percent share, thus controlling the significant part of the value chain.
Table 10: Top natural graphite manufacturers
Company name Manufacturing location Market share
BTR China 49 %
Mitsubishi Japan 16 %
Hitachi Japan 11 %
Nippon Carbon Japan 4%
POSCO Chemtech Korea 4%
Others – 16 %
Source: P3 analysis.SHAROVA ET AL: EVALUATION OF LITHIUM-ION BATTERY CELL VALUE CHAIN | 19 In Figure 5 the exemplary process of natural graphite manufacturing is depicted. First, raw material (flake graphite) is placed in an integrated classifier mill. The resulting spheronized graphite powder is leached with sulfuric acid and mixed with coal tar in a screw mixer. Then in an indi- rectly heated rotary kiln, the material is dried under N2-atmosphere at approximately 900 °C to 1200 °C for three hours. After a cooling down to room temperature (RT) the powder is ball-milled resulting in a coated spherical purified graphite (GSPG). Figure 5: Overview of the natural graphite synthesis Source: P3 own representation. Synthetic graphite is manufactured by thermal treatment of amorphous carbon (i.e., calcined petroleum coke or tar pitch) (Dante, 2016). Major synthetic graphite manufacturers are listed in Table 11. With a market share of approximately 56 percent among four different companies Ja- pan is competing with China for the dominancy in this sector.
SHAROVA ET AL: EVALUATION OF LITHIUM-ION BATTERY CELL VALUE CHAIN | 20

Table 11: Top synthetic graphite manufacturers

 Company name              Manufacturing location         Market share
 Shanshan                  China                                      38 %
 Hitachi                   Japan                                      31 %
 JFE                       Japan                                      11 %
 Mitsubishi                Japan                                       9%
 Showa Denko               Japan                                       5%
 Others                    –                                           6%

Source: P3 analysis.

Figure 6 shows the overview of the synthetic graphite production pro-
cess. In the first step a precursor (petroleum coke in this case) is ball-
milled. The grinded powder is mixed with coal tar in a screw mixer at 170
°C. Resulting material is dried in an indirectly heated rotary kiln for 24
hours. Afterwards the Acheson process (graphitization of the amorphous
material under temperatures up to 3000 °C) is run for three to five days,
enabling high purity of the outgoing material. After cooling down and an-
other grinding step, the synthetic graphite is obtained.

Figure 6: Overview of the synthetic graphite synthesis

Source: P3 own representation.
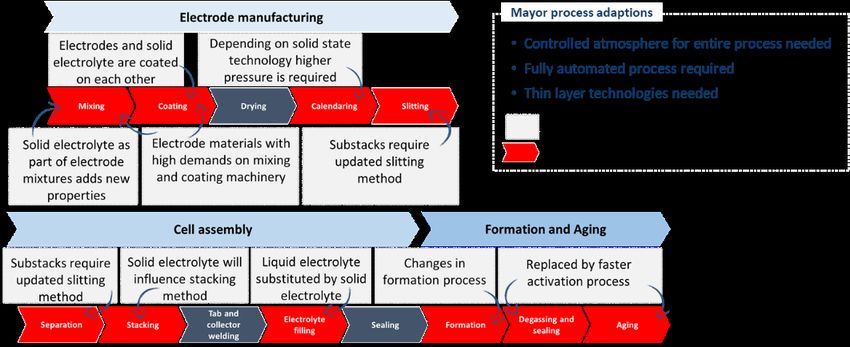
SHAROVA ET AL: EVALUATION OF LITHIUM-ION BATTERY CELL VALUE CHAIN | 21

As also noticed for the materials extraction, core competence in synthe-
sis of Li-ion cell active materials is concentrated in Asia. Whereas to
produce cathode material various cell suppliers use in-house compe-
tence, both natural and synthetic graphite materials are manufactured by
third parties. Despite the lower cost of the natural graphite, the growing
demand for this material can be effectively supported by the synthetic
one, also adding benefits in electrochemical performance.

Electrode Manufacturing
Electrode manufacturing process generally consists of six steps includ-
ing mixing of electrode active and inactive materials (forming a slurry),
coating of the slurry on the current collector, drying, calendaring, slitting
and an additional (vacuum) drying. The steps and related value-added
are displayed in Figure 7.

Figure 7: Overview of the electrode manufacturing process steps

Source: P3 own representation.

Among challenges in this stage one can mention in-line control of the
quality parameters as well as building and maintaining the atmospheric
environment. Increasing the process speed while ensuring a consistent
high quality is yet another challenge for many companies in this value
chain stage. To comply with the existing norms efficient reutilization and
recycling of the organic solvent used for the slurry preparation is neces-
sary. Furthermore, process changes due to upcoming new technologies
and materials like solid-state, solvent-free electrode processing or in
view of silicon anode material need to be considered. Due to rising de-
mand various cell manufacturers are opening new production sites close
to their potential customers. The equipment transfer and installation as
well as the localization of the new plants and staff qualification must be
carefully planned to enable uninterruptable production with the same
SHAROVA ET AL: EVALUATION OF LITHIUM-ION BATTERY CELL VALUE CHAIN | 22

quality. Nevertheless, each new manufacturing site requires an exten-
sive ramp-up phase with production and quality parameters slowly
reaching the required standards.
    To be successful in this stage players must force cost reduction to
ensure competitiveness. This can be achieved through the improvement
of all electrode manufacturing steps. However, the implementation of in-
novative technologies is tangled through fast production ramp-up and
cost pressure. Due to the rising demand for improved cell performance,
companies must orientate towards electrode optimization to reduce the
internal resistance and increase energy density of the battery cells. In
view of varying cell dimensions, the design of the equipment should ide-
ally allow a rapid switch between them. Table 12 lists several players
acting in this stage and the equipment manufacturers, supplying ma-
chines for the electrode production.

Table 12: Electrode production market participants and equipment
manufacturers

 Market participants (HQ)             Equipment manufacturers (HQ)
 Nichia (Japan)                       Hanwha (South Korea)
 Umicore (Belgium)                    Hibar (Canada)
 Mitsubishi Electric (Japan)          Eirich (Germany)
 Hitachi (Japan)                      Bürkle (Germany)
 Sumitomo (Japan)                     Kroenert (Germany)
 DOW (USA)                            Dürr Megtec (Germany)
 Pulead (China)                       Coatema (Germany)

Source: P3 analysis.

Besides active materials, described in the previous section, which supply
or host Li-ion during charge/discharge processes, various inactive com-
ponents are present in the electrode. To ensure good adhesion of the
slurry, a binder (usually a polymeric material), is used during electrode
preparation. Conductive agent (usually a carbonaceous material), in
turns, allows improvement in the electronic conductivity of the active ma-
terials, providing pathways for fast electron transfer. Finally, current col-
lector is a metal foil, on which the electrode slurry is casted, which al-
lows shuttling of electrons.
    Among the cell inactive components, separator and electrolyte play a
significant role in the overall cell performance. The former one enables
the transfer of Li-ions while preventing the physical contact of two elec-
SHAROVA ET AL: EVALUATION OF LITHIUM-ION BATTERY CELL VALUE CHAIN | 23
trodes to avoid short circuit; whereas the latter is the organic media
providing conductive pathways for Li-ion movement. The extract of the
inactive materials suppliers is presented in Table 13.
Table 13: Overview of the inactive materials suppliers (extract)
Other material suppliers
Electrolyte material Separator material
(binder, conductive addi-
suppliers suppliers
tive, tape, etc.)
3M SK Innovation Tesa
BASF AsahiKasei 3M
UBE Evonik DOW
Tinci Treofan Targray
Capchem Freudenberg Schlenk
Shanshan Sumitomo Sumitomo
Guotai-Huarong Toray Imerys
Panax Etec Celgard NEI
Source: P3 analysis.
To summarize, electrode manufacturing process is very complex, requir-
ing strict control of the production environment and the precise setting of
process parameters to allow homogeneous thickness of the electrode
sheets. Although prominent cell manufacturers establish electrode lines
in-house, various companies, dominated by Japan, are offering the
ready electrodes. Worth mentioning is that among established equip-
ment manufacturers, providing machinery for electrode production lines,
are several Germany-based players, offering energy saving solutions
and high-quality products.
Cell Manufacturing
Cell assembly, following the electrode manufacturing, is another com-
plex process, consisting of several steps. It requires a very strict control
of the production environment to avoid high moisture content in the fin-
ished cell. This is because traces of water can react with the electrolyte
components, leading to rapid performance decay of the finished cells.
Cell manufacturing capabilities are dominated by Asian companies
due to their valuable experience, also gained in the consumer electron-
ics and in the first automotive projects. Increasing the production speedSHAROVA ET AL: EVALUATION OF LITHIUM-ION BATTERY CELL VALUE CHAIN | 24
(and resulting cell output) without any losses in the cell quality is vitally
important. Furthermore, due to political and social requirements, players
should move towards sustainable energy sources for their production fa-
cilities.
Depending on the application three different formats for LiB are cur-
rently available. These include cylindrical, prismatic and pouch format
(button cells are excluded as they are mostly non-rechargeable), with
each having certain advantages and disadvantages. The formats are
schematically shown in Figure 8.
Figure 8: LiB cell formats: cylindrical (left), pouch (middle), prismatic
(right)
Source: Wiebelt et al., 2009.
Cylindrical Li-ion cells come in various standardized sizes and are based
on the well-known cells 18650 (the first two digits indicate the diameter
in mm, the following three digits define the length of the cell body in mm)
that first powered the consumer electronics in 1990’s and was later
adopted for automotive applications. Other commonly used formats in-
clude 20700 and 21700. One of the most famous use-cases in automo-
tive applications is Tesla/Panasonic with NCA chemistry. One of the
main advantages of the cylindrical cells is the highest energy density
among the three available formats but at expense of relatively low ener-
gy to volume ratio. Cylindrical cells allow flexible battery design due to
parallel connection of a high number of cells. On the other hand, the
packaging design is more complex compared to other formats and the
energy density on the pack level is the lowest among the three formats.
Although the mostly utilized NCA chemistry in this format shows disad-
vantages in terms of safety and lifespan, cylindrical format has reached
its technological maturity, enabling one of the lowest prices per kWh.SHAROVA ET AL: EVALUATION OF LITHIUM-ION BATTERY CELL VALUE CHAIN | 25
Prismatic cells are tailored specifically for automotive application. Ex-
emplary use-cases include various battery electric vehicles (BEVs) and
plug-in hybrid electric vehicles (PHEVs). Prismatic cells possess high
mechanical integrity and can be easily inserted into a battery pack. Also,
it is a safest cell format currently present in the market. However, its low
cell-level energy density compared to cylindrical format in combination
with costly housing is rather disadvantageous.
Just like prismatic, pouch cells are usually customized for the corre-
sponding use-case as no standard sizes exist. For example, the batter-
ies of Renault Zoe consist of pouch cells, manufactured by LG Chem.
Generally, pouch cells enable high energy density at the cell level, de-
pending on the selected chemistry. These cells are lightweight, flexible
and simple. As a result, a low-cost mass production can be achieved for
the pouch format. However, these cells are more sensitive to humidity
and elevated temperatures. Furthermore, cell swelling upon lifetime is of
high concern, leading in the worst case to the damage of the whole bat-
tery.
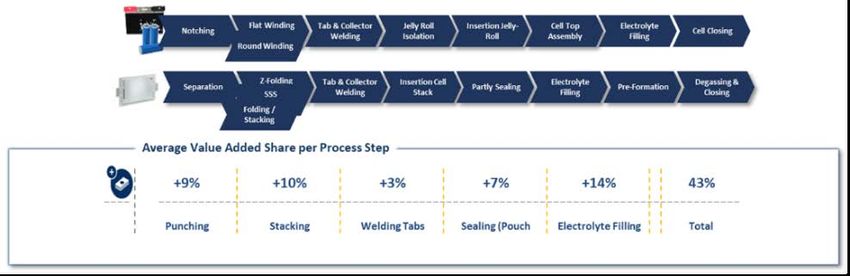
The differences in the design of the three formats is also reflected in
the manufacturing processes, as also shown in Figure 9. Cylindrical and
prismatic cells contain so-called „jelly roll“, the wound stack of anode
and cathode sheets with separator in between. Pouch cell, in turns, con-
sists of the stack of single electrodes, which are cut prior to the cell as-
sembly and are either stacked together with separator sheets in between
or inserted into the running separator „pockets“ during z-folding (Schrö-
der/Aydemir/Seliger, 2017).
Figure 9: Overview of the cell assembly steps using three cell formats
Source: P3 own representation.SHAROVA ET AL: EVALUATION OF LITHIUM-ION BATTERY CELL VALUE CHAIN | 26
Insertion of the jelly roll in the cell is generally more complicated as care
needs to be taken to prevent the jelly roll damage. In case of pouch cell,
the stack is placed into the pre-shaped half of pouch foil, covered by an-
other half and sealed from three sides. In the next step the cell is filled in
with the electrolyte, sealed and transported into the formation facility.
Term „formation“ refers to initial cycling of the cell using relatively
small currents combined with aging at elevated temperatures to enable
the formation of passivation film on the graphite anode surface and gas
generation, which is then released either through the pressure valve for
hard-case cells or through the additional gas pocket of the pouch cell.
Formation of the cells is conducted by the cell manufacturer in-house,
which is related to additional costs and requires special facilities. Gener-
ally, formation protocols are based on the intensive preliminary testing
and remain confidential. The formation process can last up to three-four
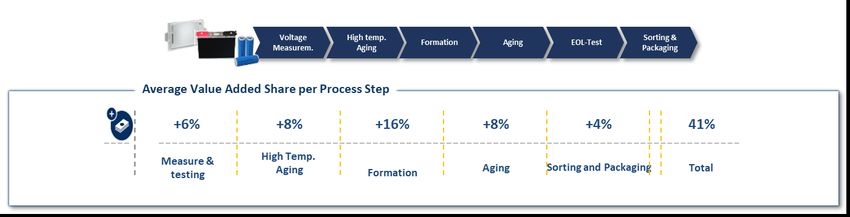
weeks and during this time, as also shown in Figure 10, several electri-
cal measurements are conducted to sort out the cells with inadequate
quality.
Figure 10: Overview of the formation and aging process steps
Source: P3 own representation.
Table 14 summarizes the top cell manufacturers and machinery provid-
ers for cell assembly and formation/aging. Due to strategical cooperation
with Tesla Panasonic with its cylindrical cells has gained a strong posi-
tion in the world market. Most of the top players have either already built
the production plants in Europe to decrease the logistics costs or have
announced to do so.SHAROVA ET AL: EVALUATION OF LITHIUM-ION BATTERY CELL VALUE CHAIN | 27
Table 14: Overview of the cell assembly value chain participants and
equipment manufacturers
Equipment Manufac-
Market Participants Equipment Manufac-
turers for formation
(HQ) turers for cell assembly
and aging
LG Chem (South Korea) Hibar Maccor
Panasonic (Japan) Manz Manz
SK Innovation (South Trumpf Bitrode
Korea)
Samsung SDI (South Ko- NAT Digatron
rea)
BYD (China) ATS ATS
CALB (China Harro Höfliger PEC
CATL (China) Jonas & Redmann Chroma
Source: P3 analysis.
As for the equipment manufacturers, despite the leading role of Asian
players European manufacturers are also able to contribute to the mar-
ket due to their geographically preferable production facilities (Schlick
et al., 2011). One of the biggest challenges is related to the focus of
equipment manufacturers on some specific process step(s) with only a
few offering the complete assembly line. However, due to continuous
improvement of the current technology, introduction of new solutions and
close cooperation with Tier I and Tier II suppliers, this challenge could
be overcome (Meiser et al., 2014).
To conclude, cell manufacturing process requires careful set of pa-
rameters and control of the production environment. Each cell format,
currently available in the market of rechargeable batteries, has its bene-
fits and limitations, which need to be considered for the pack design.
Despite strong position of Panasonic with cylindrical cells for automotive
application, pouch and prismatic cells are expected to be preferred in the
future. Asian machinery providers are still overtaking the European ones
due to the long-lasting relationships with Asian cell manufacturers and
experience collected in the consumer electronics sector.SHAROVA ET AL: EVALUATION OF LITHIUM-ION BATTERY CELL VALUE CHAIN | 28
Battery Cell Recycling
Battery cell recycling is gaining increasing attention and focus of numer-
ous research studies due to the disputes on Li-ion environmental sus-
tainability. Up-to-date no standardized process to recover raw materials
from batteries in a good cost-benefit ratio exists. Hydrometallurgical and
pyrometallurgical processes are two dominant recycling methods cur-
rently utilized. Whereas pyrometallurgical process enables direct winning
of metals and high productivity, hydrometallurgical route is a high-
selective, high-efficient with low emissions of gasses. Among the limita-
tions of pyrometallurgical route one can name the intensive use of ener-
gy and required control of emissions. The main disadvantages of hy-
drometallurgical recycling include the use of chemicals and high water
and the necessity of waste water treatment (Friedrich et al., 2017). The
two processes are often combined, which is, for example, implemented
by Umicore Recycling (Elwert et al., 2015). Table 15 compares the recy-
cling efficiencies of various elements from NMC and LFP cells using
both methods.
Table 15: Recycling efficiency for various elements and selected
methods for NMC and LFP chemistries
Combination of py-
rometallurgical and Purely hydromet- Purely hydromet-
Material hydrometallurgical allurgical process allurgical process
processes (NMC only) (LFP only)
(NMC and LFP)
Lithium 57 % 94 % 81 %
Nickel 95 % 97 % NA
Manganese 0% ~100 % NA
Cobalt 94 % ~100 % NA
Iron 0% NA 0%
Phosphate 0% NA 0%
Natural graphite 0% 0% 0%
Source: P3 analysis.
As follows from the table, only several metallic components of the cell
can be efficiently recycled, resulting in total recycling rate of 50 % (Gup-
ta, 2019). This is a relatively low rate when compared, for instance, with
lead-acid battery, which is mostly used for engine start-stop, and whoseSHAROVA ET AL: EVALUATION OF LITHIUM-ION BATTERY CELL VALUE CHAIN | 29 recycling rate in Europe and USA exceeds 95 percent (International Lead Association, 2014). In conclusion, with the growing energy density of the cells the safety requirements during the recycling process also increase. Additionally, there is a strong need in regulation of a long-range transport of used or defect cells. On the other hand, integrating the recycling processes into future production set-ups as a closed loop is the key for a consistent ma- terial supply and cost optimization (i.e., 80 percent of lead-acid batteries consist of recycled components (The Advanced Lead-Acid Battery, 2017). To facilitate this, the implementation of recycling standards is es- sential. Such standardized recycling route must be available for different chemistries, must be cost effective and sustainable. Thus, further re- search on novel and optimization of the existing recycling methods is mandatory. This effort might be advantageous especially for European recycling companies as the industrialized service could be offered also to Asian competitors.
SHAROVA ET AL: EVALUATION OF LITHIUM-ION BATTERY CELL VALUE CHAIN | 30

Market Insights and Selection of
Partners for Future Collaborations
Current Li-ion cells possess energy densities up to 250 Wh/kg (on cell
level), with a prototype cell from CATL exceeding 300 Wh/kg (Xinhua,
2019). However, due to growing demand on longer driving ranges, fur-
ther increase in energy density is desired. Various research bodies but
also R&D departments at both cell manufacturing companies and OEMs
are concentrating their efforts on improvement of the presently employed
materials and the development of the novel ones. Technology roadmap
of current and upcoming Li-ion cell generations is shown in Figure 11.
Today’s state-of-the-art technology includes NMC622 as cathode com-
bined with graphite anode. Gradual energy density increase is prog-
nosed for the upcoming generations. Up to generation 3, the focus of
improvement will be on cathode material and electrolyte composition.
Starting with generation 4a in ca. 2025 (all-)solid-state batteries are an-
nounced by several cell manufacturers and automotive OEMs. However,
until now no test results on large-format cell- or pack-level are available
for this technology. Major challenges like fast charging capability and
wide operation temperature window remain unsolved. Generation 4b
might focus on Li-sulfur batteries, allowing significant increase in energy
density and low environmental impact and potentially low costs due to
abundancy of sulfur. However, the high uncertainty for technological
breakthrough with this chemistry is related to the unsolved problems, in-
cluding fast decay due to „polysulfide shuttle“, large volume expansion
during charge/discharge cycling and poor electronic conductivity of sul-
fur.
SHAROVA ET AL: EVALUATION OF LITHIUM-ION BATTERY CELL VALUE CHAIN | 31

Figure 11: Technology roadmap of Li-ion cell generations

Source: P3 own representation.

Figure 12 illustrates an exemplary cost breakdown of an average
NMC622 pouch cell design. As follows from the diagram, the highest
proportion of costs accounts for production, followed by the active mate-
rials. One way to decrease these costs is to transfer the production clos-
er to the possible in this case European customers, as, for example, LG
Chem, Samsung SDI and CATL did. First learning curve effects and
gradual production improvements enable ongoing cost reductions in la-
bor, energy, available space, etc. According to P3 evaluation, such
transfer could decrease lead times by approximately six weeks and re-
duce the logistics costs by around 25 percent.
SHAROVA ET AL: EVALUATION OF LITHIUM-ION BATTERY CELL VALUE CHAIN | 32

Figure 12: Example of an advanced cell technology cost breakdown –
NMC622 pouch cell

Source: P3 own representation.

Advancements in Li-ion cell production give an insight into cell costs and
development paths. The Li-ion production costs can be reduced with
various optimizations in machinery (i.e., increasing production speed)
and process design. Novel production technologies could improve cell
quality and contribute to the implementation of next generation materials
(generation 3 and 4 in Figure 11). These new materials will have a major
impact on costs of Li-ion batteries. Moreover, further price reduction with
state-of-the-art cell technology is expected within the next years.
    Manufacturing processes of the next generation cells will differ from
state-of-the-art processes. For a long-term European battery manufac-
turing next generation technologies should be assessed and researched.
Nonetheless, a market entry must happen before next generation tech-
nologies can be realized. Otherwise key learnings for production ramp-
up and large-scale battery production will be missed.
    All-solid-state belongs to the probable next generation technologies,
as also stated above. Due to the substitution of liquid electrolyte with a
solid-state one, several changes will be required in the production con-
cept. An extract of the changes is summarized in Figure 13. As shown in
the graph, almost every production step will require some changes and
introduction of new advanced machinery for thin layers processing. Time
reduction is also expected in the formation and aging process due to
SHAROVA ET AL: EVALUATION OF LITHIUM-ION BATTERY CELL VALUE CHAIN | 33 elimination of electrolyte filling step (Zarem et al., 2014; Schnell et al., 2018). Figure 13: Required changes in the cell manufacturing process for the all-solid-state cell production Source: P3 own representation. After initial analysis of the challenges and success factors in every stage of value chain and short technology benchmarking, P3 evaluated the Eu- ropean companies (with focus on Germany and France), whose activi- ties are related to Li-ion battery cell production/recycling. The overview of the selected companies is shown in Figure 14.
SHAROVA ET AL: EVALUATION OF LITHIUM-ION BATTERY CELL VALUE CHAIN | 34

Figure 14: Overview of Li-ion cell market players (with a focus on
Germany and France)

Source: P3 own representation.

According to P3 evaluation, these companies possess necessary know-
how and have gained solid experience in the specific stages of the value
chain. It can also be noted that there was no local supplier for cobalt
found. For this German and French companies would need to establish
cooperation with Scandinavian mining companies, such as Lead Edging
Materials, Outotec and Terrafame. As for electrode and cell manufactur-
ing, four companies have been identified, which either already have pro-
duction facilities, like VARTA and Saft, or have announced the construc-
tion of GWh factories in the following years, like BMZ Group and
Northvolt (in cooperation with VW). One the recycling side, two well-
established companies, Accurec and Valdi, with annual capacities of
7000 and 20000 t, respectively, have strong ambitions for expansion of
the business in Europe.
   To achieve the high level of competitiveness with the Asian players,
the formation of consortia is crucial. These consortia generally have ei-
ther scientific or industrial focus and include several partners with expe-
rience along the value chain. The extract of the existing consortia is de-
picted in Figure 15.
SHAROVA ET AL: EVALUATION OF LITHIUM-ION BATTERY CELL VALUE CHAIN | 35

Figure 15: Overview of the existing European consortia (extract)

Source: P3 own representation.

As follows from this figure, the main goal of the presented consortia is to
offer novel materials, ensure the non-interruptive supply of raw materials
and establish the mass production of battery cells. It is worth mentioning
that several consortia are targeting Germany as a suitable location for
new manufacturing sites. This is, on one hand, related to the short
transportation paths to the German OEMs, and on the other hand, due
to a strong financial support from the government and engagement of
the companies towards environmentally friendly solutions.
SHAROVA ET AL: EVALUATION OF LITHIUM-ION BATTERY CELL VALUE CHAIN | 36

Conclusion
The analysis of the Li-ion battery cell value chain has shown that the
market is strongly dominated by the Asian players. According to P3 CO2
compliance evaluation, the total battery market would grow up to 1200
GWh by 2025 with dominance of CATL in China and LG Chem in the
remaining global market. The current study showed that the upstream in-
tegration of cell manufacturers in the raw material extraction and active
material synthesis is important to enable a secure supply. Furthermore,
the use of scarce materials must be further limited, and the use of haz-
ardous materials must be strictly controlled. Cell manufacturing process
requires fast production ramp-up aiming for low scrap rate and high
quality at once. As for recycling, increase in the recycling rate and new
CO2-neutral methods will enhance the position of the European players,
allowing them to offer such service to the leading cell manufacturers.
For the successful European entry in the cell manufacturing process
several factors need to be evaluated. These from P3 point of view in-
clude:
• Approach to the market and enhancement of competition towards the
    existing players;
• secured raw materials supply in Europe at a reasonable price;
• further development of the education program to qualify the required
    competences;
• resolution of the environmental concerns with respect to the produc-
    tion of battery;
• determination of the main influence factors for the EU legislation to
    accelerate the development of new technologies.

Despite the dominance of Asian suppliers, the expected market demand
leaves enough market chances for upcoming European cell projects.
According to P3 evaluation, approximately ten gigafactories (à 18 GWh)
will be necessary to close the currently expected gap of 180 GWh for the
European market. Germany (and Europe in general) has excellent mar-
ket access, a solid value chain and a highly talented workforce, which
will put it in a favorable position to enter the Li-ion cell production land-
scape. The race to catch up will take at least five to eight years and cost
~10 billion euro. This time is scarce, but it is not too late yet.
SHAROVA ET AL: EVALUATION OF LITHIUM-ION BATTERY CELL VALUE CHAIN | 37 References ALABC The Advanced Lead-Acid Battery (2017): The Greatest Unknown Recycling Story. Azevedo, M. et al. (2018): Lithium and Cobalt - a tale of two commodities. Available at: www.mckinsey.com/~media/mckinsey/ industries/metals and mining/our insights/lithium and cobalt a tale of two commodities/lithium-and-cobalt-a-tale-of-two-commodities.ashx. Benchmark Mineral Intelligence - Graphite price assessment (2018): Available at: www.benchmarkminerals.com/category/graphite/. Berman, K. et al. (2018): BMO Capital Markets: The Lithium Ion Battery and the EV Market: The Science Behind What You Can’t See. Available at: www.fullertreacymoney.com/system/data/files/PDFs/ 2018/February/22nd/BMO_Lithium_Ion_Battery_EV_Mkt_(20_Feb_2 018).pdf. Bernhart, W. (2019) Electromobilty: Key Raw Material Nickel is in short supply. Available at: www.rolandberger.com/en/Point-of- View/Electromobility-Key-raw-material-nickel-is-in-short-supply.html. Bohlsen, M. (2019): Top 5 Nickel Producers And Other Smaller Producers To Consider, Seeking Alpha. Available at: https://seekingalpha.com/article/4246690-top-5-nickel-producers- smaller-producers-consider. Boubou, W. (2019): Manganese: No Longer Just an Input on Steel, Technology Metals Edition Insight. Available at: www.theassay.com/ technology-metals-edition-insight/manganese-no-longer-just-an-input- on-steel/. Cobalt Institute (no date): Available at: www.cobaltinstitute.org/ ores-containing-cobalt.html (Accessed: 20 August 2019). Cobalt Statistics and Information (no date): Available at: www.usgs.gov/centers/nmic/cobalt-statistics-and-information. (Accessed: 10 December 2019) Dante, R. C. (2016): 7 - Carbon materials, in Dante, R. C. B. T.-H. of F. M. and their A. (ed.). Boston: Woodhead Publishing, pp. 93–103. doi: https://doi.org/10.1016/B978-0-08-100619-1.00007-9. Distribution of cobalt production worldwide in 2016, by company (2016): Available at: www.statista.com/statistics/692848/distribution-of-global- cobalt-production-by-producer/.
SHAROVA ET AL: EVALUATION OF LITHIUM-ION BATTERY CELL VALUE CHAIN | 38

Elwert, T. et al. (2015): Current Developments and Challenges in the
   Recycling of Key Components of (Hybrid) Electric Vehicles,
   Recycling. doi: https://doi.org/10.3390/recycling1010025.
ERG Manganese Ore Concentrate (no date): Available at:
   www.eurasianresources.lu/en/pages/divisions-products/manganese-
   ore-concentrate (Accessed: 10 December 2019).
European Commision Report on Raw Materials for Battery Applications
   (2018): Brussels. Available at: https://ec.europa.eu/transport/
   sites/transport/files/3rd-mobility-pack/swd20180245.pdf.
Fitch, B. and Yakovleva, M. (2017): Study of the Effect of Lithium
   Precursor Choice on Performance of Nickel-Rich NMC, Meeting
   Abstracts , MA2017-02(4), p. 324. Available at:
   http://ma.ecsdl.org/content/MA2017-02/4/324.abstract.
Friedrich, B., Träger, T. and Peters, L. (2017): Lithium-Ion Battery
   Recycling and Recent IME Activities, in AABC Europe. Available at:
   http://cii-resource.com/cet/AABE-03-17/Presentations/BATO/
   Friedrich_Bernd.pdf.
Gupta, U. (2019): Innovation boosts lithium-ion battery recycling rate to
   over 80%. Available at: www.pv-magazine.com/2019/03/25/
   innovation-boosts-lithium-ion-battery-recycling-rate-to-over-80/.
Here are the firms feeding China’s battery revolution (no date): Available
   at: www.mining.com/web/firms-feeding-chinas-battery-revolution/
   (Accessed: 9 September 2019).
International Lead Association (2014): Lead Recycling. Available at:
   www.ila-lead.org/UserFiles/File/ILA9927 FS_Recycling_V06.pdf.
Lithium and cobalt prices to remain under pressure as supply overtakes
   demand – report (2019): Available at: www.mining.com/lithium-and-
   cobalt-prices-to-remain-under-pressure-as-supply-overtakes-demand-
   report/.
Manganese – the third electric vehicle metal no one is talking about
   (2017): Available at: www.mining.com/web/manganese-the-third-
   electric-vehicle-metal-no-one-is-talking-about-it-heres-how-to-take-
   advantage/.
Mazumdar, R. (2019): MOIL Limited reports 9% increase in turnover.
   Available at: https://economictimes.indiatimes.com/industry/indl-
   goods/svs/steel/moil-limited-reports-9-increase-in-turnover/
   articleshow/68692031.cms.
You can also read