Hoinga: A supernova remnant discovered in the SRG/eROSITA All-Sky Survey eRASS1
←
→
Page content transcription
If your browser does not render page correctly, please read the page content below
Astronomy & Astrophysics manuscript no. main                                                                                          ©ESO 2021
                                               March 1, 2021

                                                    Hoinga: A supernova remnant discovered in the SRG/eROSITA
                                                                      All-Sky Survey eRASS1
                                                     W. Becker1, 2? , N. Hurley-Walker3 , Ch. Weinberger1 , L. Nicastro4 , M. G. F. Mayer1 , A. Merloni1 , J. Sanders1

                                                     1
                                                         Max-Planck-Institut für extraterrestrische Physik, Giessenbachstraße, 85748 Garching, Germany
                                                     2
                                                         Max-Planck-Institut für Radioastronomie, Auf dem Hügel 69, 53121 Bonn, Germany
                                                     3
                                                         International Centre for Radio Astronomy Research, Curtin University, Bentley WA 6102, Australia
arXiv:2102.13449v1 [astro-ph.HE] 26 Feb 2021

                                                     4
                                                         INAF – Osservatorio di Astrofisica e Scienza dello Spazio di Bologna, Via Piero Gobetti 93/3, I-40129 Bologna, Italy

                                                     Received 17.12.2020; accepted 12.02.2021

                                                                                                                  ABSTRACT

                                                     Supernova remnants (SNRs) are observable for about (6 − 15) × 104 years before they fade into the Galactic interstellar medium. With
                                                     a Galactic supernova rate of approximately two per century, we can expect to have of the order of 1200 SNRs in our Galaxy. However,
                                                     only about 300 of them are known to date, with the majority having been discovered in Galactic plane radio surveys. Given that
                                                     these SNRs represent the brightest tail of the distribution and are mostly located close to the plane, they are not representative of the
                                                     complete sample. The launch of the Russian-German observatory SRG/eROSITA in July 2019 brought a promising new opportunity
                                                     to explore the universe. Here we report findings from the search for new SNRs in the eROSITA all-sky survey data which led to
                                                     the detection of one of the largest SNRs discovered at wavelengths other than the radio: G249.5+24.5. This source is located at a
                                                     relatively high Galactic latitude, where SNRs are not usually expected to be found. The remnant, ‘Hoinga’, has a diameter of about
                                                     4◦.4’ and shows a circular shaped morphology with diffuse X-ray emission filling almost the entire remnant. Spectral analysis of the
                                                     remnant emission reveals that an APEC spectrum from collisionally ionised diffuse gas and a plane-parallel shock plasma model with
                                                     non-equilibrium ionisation are both able to provide an adequate description of the data, suggesting a gas temperature of the order of
                                                     kT = 0.1+0.02                                                     +0.7
                                                               −0.02 keV and an absorbing column density of NH = 3.6−0.6 × 10 cm . Various X-ray point sources are found to be located
                                                                                                                               20   −2

                                                     within the remnant boundary but none seem to be associated with the remnant itself. Subsequent searches for a radio counterpart
                                                     of the Hoinga remnant identified its radio emission in archival data from the Continuum HI Parkes All-Sky Survey (CHIPASS) and
                                                     the 408-MHz ‘Haslam’ all-sky survey. The radio spectral index α = −0.69 ± 0.08 obtained from these data definitely confirms the
                                                     SNR nature of Hoinga. We also analysed INTEGRAL SPI data for fingerprints of 44 Ti emission, which is an ideal candidate with
                                                     which to study nucleosynthesis imprinting in young SNRs. Although no 44 Ti emission from Hoinga was detected, we were able to set
                                                     a 3σ upper flux limit of 9.2 × 10⁻⁵ ph cm−2 s−1 . From its size and X-ray and radio spectral properties we conclude that Hoinga is a
                                                     middle-aged Vela-like SNR located at a distance of about twice that of the Vela SNR, i.e. at ∼ 500 pc.
                                                     Key words. Stars: supernovae: general – Stars: supernovae: individual: G249.5+24.5 – Hoinga ISM: supernova remnants

                                               1. Introduction                                                             Kramer 2008), though no SN event has been directly observed in
                                                                                                                           our Galaxy in the past 400 years. Indeed, in the past two millen-
                                               A long series of observations have taught astronomers that there            nia, only seven Galactic SN are the subject of historical records:
                                               are many different types of stars. Findings in atomic and nu-               SN 185 (RCW 86), SN 386 (G11.2–0.3), SN 1006, SN 1054
                                               clear physics have made it possible to understand the develop-              (Crab), SN 1181 (3C58), SN 1572 (Tycho), and SN 1604 (Ke-
                                               ment of these stars over the past few decades. According to this,           pler); see also Stephenson (2017) and references therein. How-
                                               the fate of a star at the end of its thermonuclear evolution essen-         ever, there are additional promising candidates discussed in the
                                               tially depends on only one parameter: the mass of a star decides            literature, such as for example CAS A (Green & Stephenson
                                               whether its death is gentle or violent. More massive stars with M           2017) and Vela-Jr(Aschenbach 1998).
                                               ≥ 8M end their lives with a supernova (SN) explosion, which is
                                               not only often associated with the formation of other exotic star
                                               types such as neutron stars (NSs) or black holes, but also rep-                 Certainly, visible-band extinction of the SN emission and its
                                               resents a new beginning of stellar evolution by enrichment and              distance to earth plays a crucial role when it comes to recog-
                                               decompression of the surrounding interstellar medium. A promi-              nising a SN with the naked eye. A prominent example of this
                                               nent example for this is the Solar System itself which shows im-            effect is demonstrated by the missing reports of the CAS A SN
                                               prints in metal abundance of a past SN which took place 4.567               event which is believed to have taken place about 300 years ago.
                                               Gyr ago (Gritschneder et al. 2012).                                         No widespread reports of CAS A exist in the literature of the
                                                    Supernovae are considered to be rare events which happen               17th century (cf. Hartmann et al. 1997). A more recent exam-
                                               in our Milky Way on average every 30 − 50 years (e.g. Keane &               ple of an unrecognised SN is that of the youngest SN known in
                                                                                                                           our Galaxy, G1.9+0.3, which was completely missed by optical
                                                ?
                                                    E-mail: web@mpe.mpg.de                                                 observatories about 100 years ago (Reynolds et al. 2008).
                                                                                                                                                                      Article number, page 1 of 12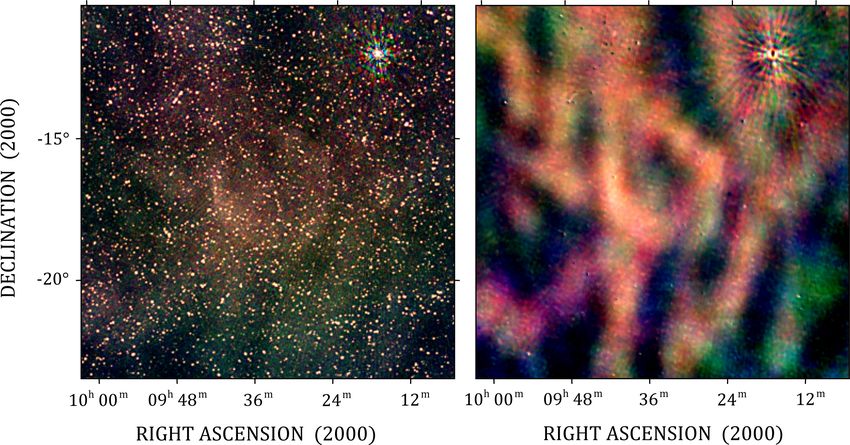
A&A proofs: manuscript no. main

     In contrast to SNe which are only observable on a timescale     explore its radio emission properties. §4 presents our exploration
of months to years, their remnants (SNRs) are detectable over a      of spectrometer data from INTEGRAL in order to search for
large range of the electromagnetic bands for more than 60 000 to     possible 44 Ti decay radiation associated with the remnant. In §5
150 000 years. However, today only about 300 SNRe are known          we summarise and discuss our results.
(cf. Green 2019), most of which were discovered in Galactic
plane radio surveys. Assuming that the radio lifetime of a SNR
bright enough to be detected with current radio telescopes is at     2. X-ray observations and data analysis
least about 60 kyr (Frail et al. 1994), there is a discrepancy by    2.1. Hoinga in the eROSITA All-Sky Survey
a factor of between four and six between the observed and ex-
pected number of SNRs. Even if one takes into account the fact       The German-built X-ray telescope eROSITA (extended Rönt-
that very massive stars may form a black hole without a lumi-        gen Survey Imaging Telescope Array) is one of two instruments
nous SN (e.g. Kochanek et al. 2008; Adams et al. 2017) there         on the Russian-German observatory SRG (Spectrum Röntgen-
is still a significant mismatch between the expected and known       Gamma; Sunyaev et al., 2020). eROSITA consists of seven
number of SNRs. The discrepancy is possibly explained by the         aligned X-ray telescopes (TM1−TM7), each nested with 54
fact that the radio sample of SNRs is not complete. Reasons that     gold-coated mirror shells which have a focal length of 1600 mm.
may prevent a radio bright remnant from being detected in radio      All telescopes observe the same sky-region simultaneously in the
surveys are various:                                                 0.2–8 keV band-pass though each focuses the collected X-rays
                                                                     on its own pn-CCD camera (Meidinger et al. 2014). The latter
 – A SN shock wave may expand within the hot phase of the            is an improved version of the pn-CCD camera aboard XMM-
   ISM and reach a very large diameter until it has swept up suf-    Newton (Strüder et al. 2001). eROSITA has a spectral resolution
   ficient mass from the low-density gas to form a radio shell.      of ∼ 70 eV at 1 keV and a temporal resolution of 50 ms. Its
   Density inhomogeneities in such a large volume will cause         field of view (FOV) is 1◦ . The on-axis effective area of all seven
   distortions in the shell and can make the identification as a     telescopes combined is slightly higher than that of the XMM-
   SNR rather difficult, in particular in the presence of confus-    Newton pn + MOS cameras in the key 0.5-2.0 keV band-pass.
   ing unrelated emission from other nearby sources in the same      In pointing mode (on axis) the angular resolution of eROSITA is
   region of the sky.                                                1800 (HEW) whereas in survey mode it is 2600 (FOV averaged).
 – A SN shock wave may expand in a very dense medium, mak-           Source location accuracy is of the order of 400. 5 (1σ). The sec-
   ing the SNR lifetime rather short, because material is quickly    ond instrument onboard SRG is the Russian X-ray concentrator
   swept up and decelerated. Such an environment is likely to        Mikhail Pavlinsky ART-XC (Astronomical Röntgen Telescope
   be relevant for example for massive star members of OB-           – X-ray Concentrator) (Pavlinsky et al. 2018), which is sensitive
   associations that are surrounded by dense molecular clouds        in the hard X-ray band from 4 up to 30 keV, making it comple-
   and warm gas. Even during their short lifetime, such events       mentary to the eROSITA soft band.
   are difficult to identify within the strong thermal radio emis-       The SRG was launched into an L2 orbit on July 13, 2019,
   sion from those regions.                                          with a Russian Proton-M launch vehicle. After a three-month
 – There is a strong bias towards bright resolved objects in ob-     calibration and science verification phase it started its first all-
   servations towards the inner Galaxy.                              sky survey on December 13, 2019. With a scan rate of 0.025
 – Low-surface-brightness SNRs are easily missed in radio sur-       deg/s, a spacecraft revolution duration of 4 h and a central FOV
   veys if they are below the sensitivity limits of the surveys or   passage time of about 40 s (Predehl et al. 2020a), each survey
   if they are confused with other objects in the same area.         takes 6 months to complete. eROSITA is supposed to take eight
 – Old SNRs which are in the phase of dissolving into the ISM        all-sky surveys over a time period of 4 years.
   may have incomplete radio shells that may then prevent these          The X-ray data we report here were taken during the first
   sources from being identified as SNRs.                            eROSITA all-sky survey eRASS1, completed on June 12, 2020.
 – SNRs located away from the Galactic plane are easily missed       As the main science driver of the SGR mission is to explore the
   in radio surveys, as this area is where these events are typi-    nature of dark energy, its orbit was chosen so that the Ecliptic
   cally targeted.                                                   poles get the deepest exposure, leading to an exposure of the
                                                                     Galactic plane which is of the order of ∼ 200 − 300 seconds per
     Given these selection effects in radio surveys and the de-      survey.
tection of unknown SNRs in previous X-ray surveys (e.g. Pf-              First results of eRASS1, including a fascinating, detail-rich,
effermann & Aschenbach 1996; Busser et al. 1996; Asaoka &            three-energy-band colour-coded image of the 0.3-8.0 keV X-ray
Aschenbach 1994; Asaoka et al. 1996; Egger et al. 1996; Fol-         sky, were recently released. The survey represents the deepest
gheraiter et al. 1996), as well as the detection of more than 70     view of the whole X-ray sky today and led to the discovery of
highly significant SNR candidates in our analysis of the ROSAT       the large-scale symmetric hot-gas structures in the Milky Way
All-Sky-Survey data, it was deemed worthy to start searching for     halo, called ‘eROSITA Bubbles’ (Predehl et al. 2020b), among
undiscovered SNRs in the first eROSITA All-Sky Survey RASS1          many other exciting results.
(Predehl et al. 2020a).                                                  Searching this survey map for unknown extended sources
     In this paper we report the discovery of the SNR                revealed the existence of a new SNR at Galactic coordinates
G249.5+24.5 in the eROSITA data. With a diameter of about            l = 249◦.5 and b = 24◦.5, labelled G249.5+24.5 which we dub
4◦.4 it is among the largest SNRs discovered at wavelengths other    Hoingaa . Figure 1 depicts a colour-coded image of the relevant
than the radio. The structure of the paper is as follows: eROSITA    sky region which shows Hoinga with its neighbours the Antlia
and ROSAT observations of the remnant along with the data            Loop and the Vela SNR.
analysis are described in §2. In §3 we describe the analysis of          The data we use in our analysis were processed by the eSASS
archival radio data taken from the Continuum HI Parkes All-Sky       (eROSITA Standard Analysis Software) pipeline and have the
Survey (CHIPASS) and the 408 MHz all-sky continuum survey            a
                                                                       In honor of the first author’s hometown Bad Hönningen am Rhein:
in order to search for a radio counterpart to the remnant and to     Hoinga was its medieval name.

Article number, page 2 of 12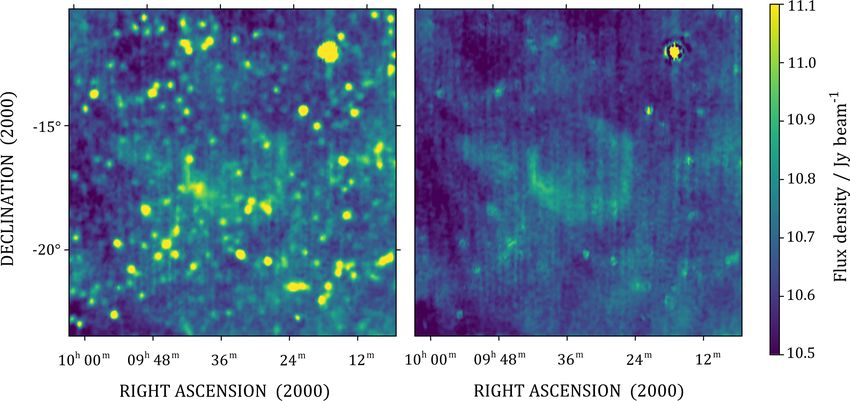
W.Becker, et al.: Hoinga - A SNR discovered in eRASS1
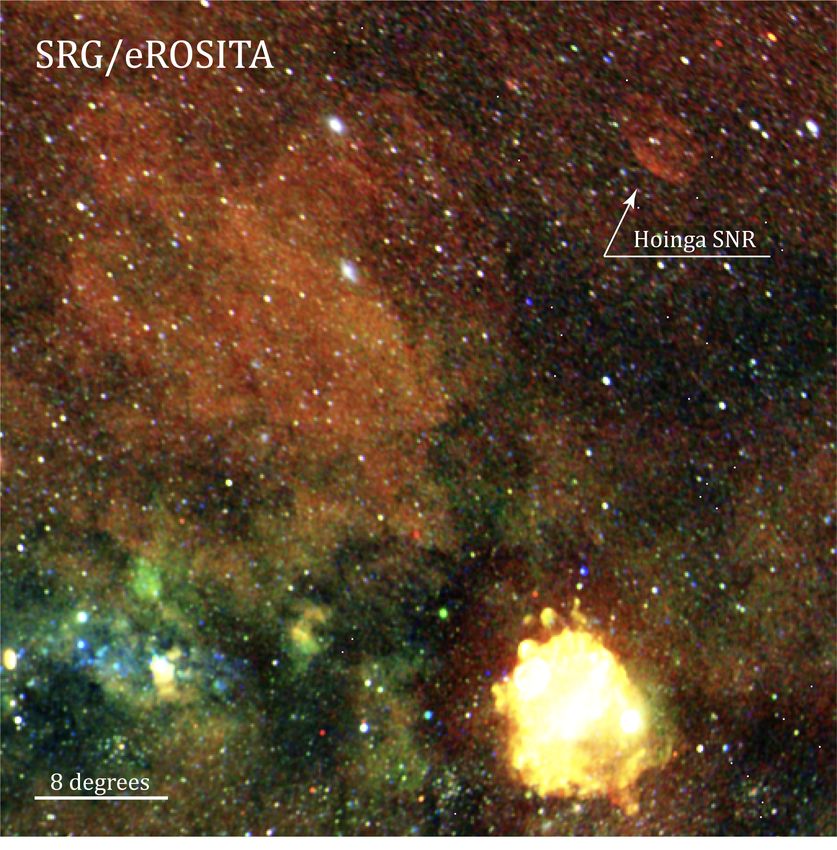
Fig. 2. Hoinga SNR as seen in the eROSITA all-sky survey eRASS1.
Fig. 1. Cutout of the SRG/eROSITA all-sky survey image from eRASS1 Photons to produce this 7◦.5 × 7◦.5 image were colour coded according to
data. The image shows, among many other sources, the extended X- their energy (red for energies 0.2–0.7 keV, green for 0.7–1.2 keV, blue
ray emission from the 24◦ diameter large Antlia Loop in its upper left for 1.2–2.4 keV). An adaptive kernel smoothing algorithm was applied
quadrant and the emission from the Vela SNR in its lower right. The to the images in each energy band.
emission from the Hoinga SNR in the upper right quadrant of the image
is indicated. The image is an Aitoff projection of photons that have been
colour-coded according to their energy (red for energies 0.3–0.6 keV, 0.2–0.7 keV band, leaving the remnant undetected in eRASS1
green for 0.6–1 keV, blue for 1–2.3 keV). The image was smoothed with above 0.7 keV. The shape of Hoinga appears largely circular ex-
a 100 FWHM Gaussian filter and is publicly available on the internet. cept for the remnant’s west side for which no emission is de-
tected by eROSITA. The morphological structure of the remnant
is clearly centre-filled without a distinct shell-brightening struc-
processing number #946. For the data analysis we used eSASS
ture. However, its soft X-ray emission slightly brightens towards
version 201009 (released on October 9th, 2020)b . Within the
the southern direction with a knot-like structure (cf. also Fig.
eSASS pipeline, X-ray data of the eRASS sky are divided into
3). We will explore this region in more detail when additional
4700 partly overlapping sky tiles of 3◦.6 × 3◦.6 each. These are
eROSITA data become available. To determine the geometrical
numbered using six digits, three for RA and three for Dec, rep-
centre of the remnant we fitted an annulus to the outer bound-
resenting the sky tile centre position in degrees. The major-
ary of its X-ray emission. In right ascension and declination the
ity of Hoinga’s emission falls into the eRASS1 sky tiles num-
remnant centre is then found to be at RA = 09:31:53.47, Dec =
bered 142108, 146108, and 143105 whereas the six surrounding
−17:01:36.7 (J2000), which according to the eROSITA naming
sky tiles (145111, 142111, 139111, 139108, 146105, 140105)
convention assigns it the catalogue name 1eRASS J093153.47–
needed to be included for complete coverage of the remnant.
170136.7.
Hoinga was observed in eRASS1 between 15 and 22 May, 2020,
in a total of 29 telescope passages, resulting in an unvignetted
averaged exposure time of approximately 240 s. 2.2. Hoinga in the ROSAT All-Sky Survey
Figure 2 shows an RGB image of the remnant which has
been colour coded according to the energy of the detected pho- After the discovery of Hoinga in eRASS1 data we went back
tons. To produce the image, we first created images for the three to the archival ROSAT all-sky survey (RASS) to check whether
energy bands 0.2–0.7 keV, 0.7–1.2 keV, and 1.2–2.4 keV, respec- the remnant was detected. The ROSAT RASS was performed
tively. The spatial binning in these images was set to 2600 which between June 1990 and August 1991, almost exactly 30 years
reflects eROSITA’s FOV averaged angular resolution in survey before eRASS1. The ROSAT PSPC (position-sensitive propor-
mode. Data from all seven telescopes were used as we did not tional counter), which was in the focal plane during the survey,
notice a significant impact of the light leak in TM5 and TM7. was sensitive in the 0.1-2.4 keV energy range (Pfeffermann et al.
In order to enhance the visibility of Hoinga’s diffuse emission 2003). The angular resolution in the survey was 4500 . RASS data
in these images whilst leaving point sources unsmoothed to the are divided into 1378 partly overlapping sky tiles, each cover-
greatest possible extent we applied the adaptive kernel smooth- ing 6◦.4 × 6◦.4 of the sky. Hoinga is located in the RASS data with
ing algorithm of Ebeling et al. (2006) with a Gaussian kernel of the sequence numbers 932025, 932026. It was observed between
4.5σ. November 11-18, 1990. After applying the standard ROSAT
The image analysis clearly reveals that Hoinga’s X-ray emis- data processing using the Extended Scientific Analysis Software
sion is very soft. The majority of its emission is detected in the EXSAS (Zimmermann et al. 1994), we created images from the
photons in the 0.1–0.7 keV, 0.7–1.2 keV, and 1.2–2.4 keV en-
b
cf. https://erosita.mpe.mpg.de/ ergy bands. While there is no emission seen in the medium and
Article number, page 3 of 12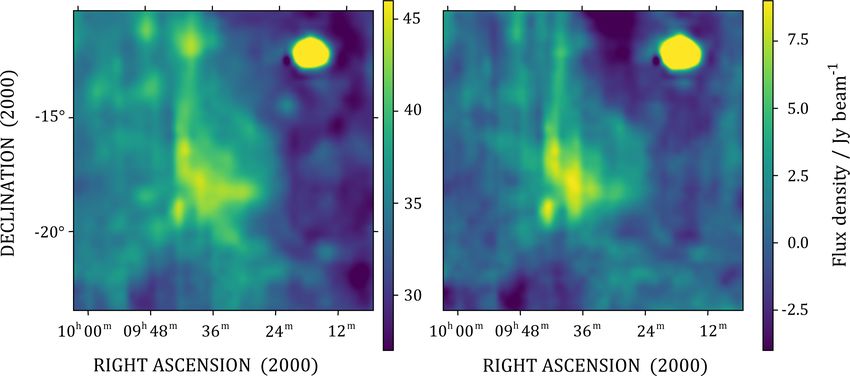
A&A proofs: manuscript no. main

                                                                            Table 1. X-ray sources detected within the Hoinga SNR in eROSITA
                                                                            eRASS1 and ROSAT RASS data. The detection significance of the
                                                                            listed sources is ≥ 5σ. The position uncertainty of eROSITA point
                                                                            sources is 400. 5 (1σ confidence).  is the Modified Julian Date
                                                                            of the observation in eRASS1 and RASS, respectively. The numbering
                                                                            for the centrally located sources #1 − #3 is reported in the lower-right
                                                                            inset of Figure 3.

                                                                                 Source       RA (J2000)           Dec (J2000)    Obs. Time
                                                                                                h:m:s                d:m:s        < MJD >
                                                                                                     eROSITA eRASS1
                                                                                    1        09:33:41.096 -17:09:18.932          58987.40282
                                                                                    2        09:33:18.088 -17:14:41.741          58987.31946
                                                                                    3        09:34:30.071 -17:21:21.224          58987.65274
                                                                                    4        09:37:57.489 -17:10:14.453          58988.23630
                                                                                    5        09:27:29.469 -18:06:20.653          58986.48550
                                                                                    6        09:27:50.522 -16:40:01.672          58985.98614
                                                                                    7        09:36:25.814 -18:21:05.829          58988.40257
                                                                                    8        09:28:45.469 -15:24:10.805          58985.73667
                                                                                    9        09:28:38.097 -15:21:08.361          58985.73682
                                                                                    10       09:40:02.199 -17:09:55.614          58988.65310
                                                                                    11       09:26:58.572 -16:30:06.584          58985.73626
                                                                                                       ROSAT RASS
Fig. 3. The Hoinga SNR as seen in the ROSAT all-sky survey. Pho-
tons to produce this image have been selected from within the 0.1–0.7
                                                                                    1        09:33:41.421 -17:08:59.602          48210.59365
keV energy band. A Gaussian smoothing filter with x,y-σ = 3 image                   2        09:33:18.151 -17:14:39.386          48210.52687
pixel was applied in order to enhance the visibility of the diffuse emis-           3        09:34:30.177 -17:21:17.739          48210.86065
sion. The gray scale colors are distributed so that white corresponds to            4        09:37:57.671 -17:10:07.991          48211.72799
a pixel intensity value of 0.09 and black to 0.45 cts/pixel. The image is           7        09:36:26.231 -18:21:05.791          48211.82793
vignetting and deadtime corrected though no exposure correction was                 10       09:40:02.494 -17:09:58.469          48212.26215
applied. The inset in the lower right corner shows a 400 × 400 zoom to              11       09:26:58.256 -16:30:01.930          48208.55845
the region of the X-ray sources located slightly to east of the remnant’s
geometrical centre.

hard bands, the soft-band image clearly shows a hint of circu-                  For the eROSITA sources #2, #3, #5, #6 we found a convinc-
lar shaped soft X-ray emission. As in the eROSITA data, its soft            ing positional match to a radio counterpart in the NVSS cat-
X-ray emission is brighter toward the south. Figure 3 shows the             aloguec . For all sources, we find a close overlap with optical
RASS soft-band image of the relevant sky region. The effective              sources from the Gaia DR2 catalogued . From the proper motion
survey exposure in the image varies from about 480 s at the east-           and parallax information for the potential counterparts, it seems
ern side of the remnant to about 474 s near to its central region           likely that sources #1, #2, #3, #5, and #6 are of extragalactic na-
and 380 s at its western side. ROSAT’s scan direction imprint               ture. In contrast, sources #4, #7, #8, #9, #10, and #11 appear to be
in that sky region is clearly visible in the image by the slightly          likely of Galactic origin, in agreement with their brighter optical
inhomogeneous exposure, from approximately the southwestern                 appearance.
to the northeastern direction.                                                  Assuming the identification of the eROSITA source #1 with
                                                                            an extragalactic optical source is correct, it seems more likely
                                                                            to us that the computed ROSAT RASS position of this faint X-
2.3. X-ray point sources within the Hoinga SNR
                                                                            ray source has a larger uncertainty than the 1300 found on average
In order to identify a possible compact remnant associated                  (68% confidence) for ROSAT RASS sources (Voges et al. 1999).
with Hoinga we applied a source detection to the ROSAT and                  Assuming a real offset for source #1 would imply a proper mo-
eROSITA survey data. The point sources detected in both sur-                tion of ∼ 2000 /30 years, which seems unlikely to us as we did not
veys along with their properties are summarised in Table 1. The             find a nearby bright star as optical counterpart. Indeed, of the 11
eROSITA 68% position uncertainty for point sources detected in              X-ray sources detected within the Hoinga SNR, none have an op-
the all-sky survey eRASS1 is 400. 5; for the ROSAT survey it is             tical counterpart fainter than the twentieth magnitude in the Gaia
1300 (Voges et al. 1999). In Figures 2 and 3, three point sources           G-band. Similarly, in the infrared band where the fainter object
can be seen slightly to the east of the remnant geometrical cen-            is found, H ' 16 and W2 (4.6µm) ' 14 in 2MASS and WISE
tre, though rather centred with respect to the diffuse X-ray emis-          catalogues, respectively. We therefore conclude that all 11 X-ray
sion. While the positions of sources #2 and #3 remain unchanged             sources are either foreground or background objects which are
within the errors in ROSAT and eROSITA data, source #1 is                   not associated with Hoinga.
found to have an offset towards the southeast of almost 2000 . For
the purpose of a further source identification, we correlated the
eROSITA positions with various radio and optical catalogues,
for example NVSS (Condon et al. 1998) and Gaia DR2 (Gaia                    c
                                                                                https://www.cv.nrao.edu/nvss
                                                                            d
Collaboration et al. 2018).                                                     https://gea.esac.esa.int/archive

Article number, page 4 of 12
W.Becker, et al.: Hoinga - A SNR discovered in eRASS1

2.4. Spectral analysis
In order to properly correct the source spectrum and energy flux
for contributions from the instrument- and sky-background, we
analysed a sky field of about 8◦ × 8◦ centred on the remnant.
Hoinga’s energy spectrum was extracted from the eROSITA
eRASS1 data by selecting all events recorded within an ellip-
tical region of semi-minor and major axis of 2◦.0 and 2◦.35, re-
spectively. The elliptical region was centred at the position RA
= 9:32:57.30, Dec = −16:51:41.00 and tilted by 14◦.5. SAOIm-
age ds9 (Joye & Mandel 2003) was used for the definition of
the event-selection regions. The background spectrum was ex-
tracted from a surrounding elliptical ring for which we chose the
axes so that it did not include events from the remnant itself. The
ring had a difference between its inner and outer region of 0◦.3.
Events from unrelated X-ray sources located within the source
or background regions were excluded from the spectral analysis.
    In total, the extracted spectra included 43910 and 28930
counts from the source and background regions, respectively,
resulting in about 15000 net events. To model Hoinga’s X-ray
spectrum, we used only events from the telescope units TM1,
2, 3, 4, and 6. Events from the two telescopes TM5 and TM7
were excluded from the spectral analysis as both units suffer
light leaks related to the sun–satellite angle, making their soft-
response calibration quite uncertain at that early stage of the
mission. Model spectra were simultaneously fitted to Hoinga’s
source and background spectra. We used Xspec 12.10.1f (Dor-
man et al. 2003) and applied the C-statistics to the fits in
which we modelled the source and background spectra indepen-
                                                                      Fig. 4. Energy spectrum of the Hoinga SNR as observed with the
dently. Of the fitted model spectra, the APEC spectrum from           eROSITA TM1, 2, 3, 4, and 6 telescope and detector units and simulta-
collisionally ionised diffuse gas (Foster et al. 2012) and the        neously fitted to an absorbed APEC spectral model (upper panel). The
PSHOCK model (Plane-parallel SHOCK plasma model with                  spectra have been binned for visual clarity and plotting purposes. The
non-equilibrium ionisation) (Borkowski et al. 2001) were found        signal-to-noise ratio in each bin is 15σ. The folded best-fit APEC spec-
to provide fits of equal goodness and with similar spectral pa-       tral model is plotted as a solid black line. Fit residuals are shown in the
rameters to the observed spectrum. We used the abundance table        lower panel.
and the TBabs absorption model from Wilms et al. (2000). For
the meaning of the fitted spectral parameters, we refer the reader
to the Xspec manuale and references therein.
    Figure 4 depicts the best-fit APEC model. The model spec-
trum folded through the detector response is shown with a
black solid line. Table 2 lists the best-fit spectral parameters of
both models. Due to the preliminary calibration status of the
eROSITA instruments at the time of writing, we refrain from giv-
ing absolute energy fluxes as obtained from the best-fit models.
The contour plot shown in Figure 5 gives the parameter depen-
dence of the temperature versus the column absorption for the
APEC model.

3. Radio observations and data analysis
3.1. The Murchison Widefield Array
The Murchison Widefield Array (MWA; Tingay et al. 2013;
Wayth et al. 2018) is a low-frequency radio telescope operat-
ing in Western Australia, and is a precursor to the low-frequency
component of the Square Kilometre Array. The GaLactic and
Extragalactic All-sky MWA (GLEAM; Wayth et al. 2015) sur-
vey observed the whole sky south of declination (Dec) +30◦
from 2013 to 2015 between 72 and 231 MHz. A major data
release covering 24 402 square degrees of extragalactic sky           Fig. 5. Contour plot showing the relative parameter dependence of the
was published by Hurley-Walker et al. (2017), while individual        fitted spectral parameters kT (temperature) vs. NH (column absorption)
studies have published smaller regions such as the Magellanic         for the APEC model fit to the energy spectrum of Hoinga. The three
                                                                      contours represent the 1σ, 2σ, and 3σ confidence levels for two param-
e                                                                     eters of interest. The small red dot marks the best-fit position.
    https://heasarc.gsfc.nasa.gov/xanadu/xspec/XspecManual.pdf

                                                                                                                  Article number, page 5 of 12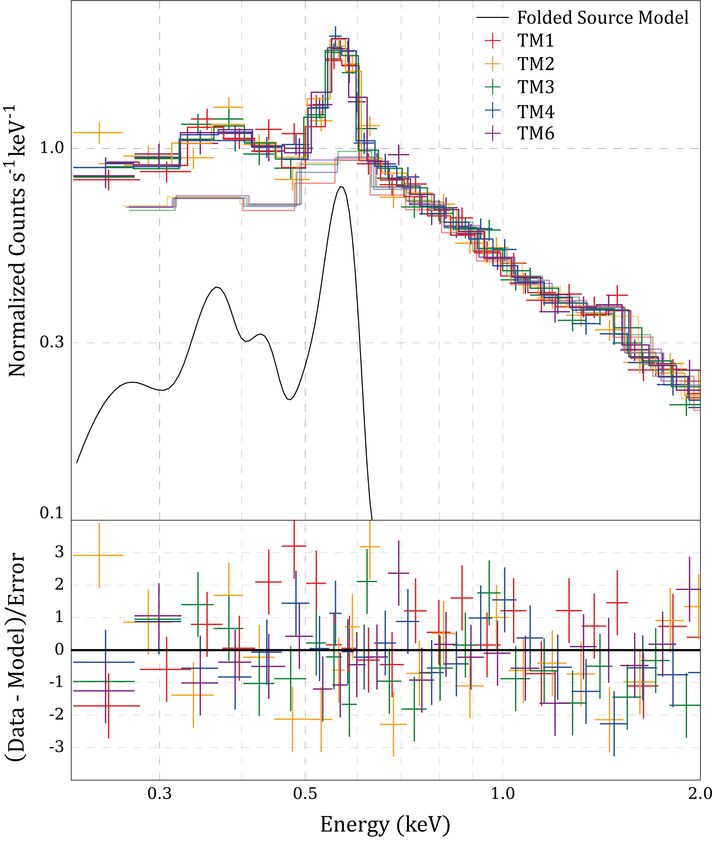
A&A proofs: manuscript no. main

Fig. 6. ∼ 10◦ × 10◦ of the region surrounding Hoinga as seen by GLEAM at 103-134 MHz (R), 139-170 MHz (G), and 170-200 MHz (B). The
left panel shows the image from the data release of Hurley-Walker et al. (2017), and the right panel shows the region after reprocessing to subtract
sources and highlight large-scale structure (see Section 3.1). Hoinga is visible as an ellipse in the centre of the image; steep-spectrum Galactic
cirrus becomes a strong contaminant at these low frequencies and is visible as large-scale filaments around the remnant. The bright source in the
northwest is Hydra A.

Table 2. Best-fit parameters from the fit of APEC and PSHOCK models        each observation, we performed the following steps, in each case
to the spectrum of Hoinga. Errors represent the 68% confidence range.      attenuating the brightness of modelled sources using the MWA
                                                                           primary beam model of Sokolowski et al. (2017):
             Parameter             APEC              PSHOCK
                                                                                – Download the data from the All-Sky Virtual Observatoryg in
                  20
          NH (10 cm )   −2
                                  3.6+0.7
                                     −0.6             3.6+0.6
                                                         −1.0                     standard measurement set format, averaged to 40 kHz and 2 s
             kT (keV)           0.111+0.004
                                     −0.004       0.108+0.012
                                                       −0.008
                                                                                  frequency and time resolution;
                                                                                – calculate a first-pass amplitude and phase calibration for
          τ (1011 s cm−3 )           ...             > 1.1a
                                                                                  each antenna using a sky model comprised of the bright
          Normalization          0.17+0.03
                                     −0.03           0.13+0.06
                                                         −0.06
                                                                                  nearby source Hydra A and the GLEAM catalogue, via the
                                                                                  software calibrate, an implementation of the MitchCal al-
         C Statistic / d.o.f.   7625.1/7347      7625.1/7346
                                                                                  gorithm (Offringa et al. 2016);
                                                                                – apply the derived calibration solutions;
Notes. (a) The ionisation timescale τ is only weakly constrained by the
fitted spectrum, which is why we only give a 95% lower limit.                   – use the peel software to remove Hydra A from the visibili-
                                                                                  ties, with a solution interval of 4 s;
                                                                                – directly subtract the GLEAM sources from the visibilities
Clouds (For et al. 2018) and parts of the Galactic plane (Hurley-                 using subtrmodel;
Walker et al. 2019c). An important feature of this radio survey is              – use the widefield radio imaging package WSClean (Offringa
its sensitivity to large-scale (1◦ −15◦ ) features, which has enabled             et al. 2014) to image the data using natural weighting and
studies of SNRs and Hii regions across a wide range of sizes and                  multi-scale multi-frequency synthesis over the full 30.72-
the full range of frequencies, independent of resolution biases                   MHz band down to a threshold of three times the local image
(see e.g. Hindson et al. 2016; Su et al. 2018; Hurley-Walker et al.               noise, and then clean the data down to the local image noise
2019a).                                                                           in regions found to contain brightness.
     Hoinga is visible in the public GLEAM imagesf but is con-
taminated by the presence of hundreds of radio sources, the ma-                The ionosphere was found to be in a relatively quies-
jority of which are likely unrelated radio galaxies (left panel            cent state, with minor (≈arcsec) position shifts imparted to
of Fig. 6). To accurately measure the radio flux density of                the radio sources; the images were corrected using fits_warp
Hoinga, we reprocessed 13 two-minute observations spanning                 (Hurley-Walker & Hancock 2018). For each 30.72-MHz band,
103-231 MHz from a drift scan centred at Dec −13◦ taken on                 the primary-beam-corrected images were then mosaicked using
2014-03-04, with three or four observations in each 30.72-MHz              swarp (Bertin et al. 2002). The resulting image is shown in the
band, yielding integration times of ≈ 10 minutes per band. For             right panel of Fig. 6. Hoinga is visible as a pair of arcs of width
f                                                                           g
    http://gleam-vo.icrar.org/gleam_postage/q/form                               https://asvo.mwatelescope.org/

Article number, page 6 of 12
W.Becker, et al.: Hoinga - A SNR discovered in eRASS1
≈ 1◦ , 5◦ apart from one another. The local diffuse Galactic syn- Table 3. Integrated flux densities of Hoinga measured from the radio
chrotron is also visible as a fainter series of filaments with a data described in Section 3. Measurements were made on images where
contaminating sources and background had been removed using the
similar colour (i.e. spectral index). software poly_flux.
We used the software poly_flux (Hurley-Walker et al.
2019b) to measure the total flux densities of Hoinga in each Survey Frequency / Resolution / Flux density /
band, estimating and subtracting a mean background level. As MHz 0
Jy
the selection of the boundaries of the SNR is somewhat sub- GLEAM 118 7.8 × 6.6 115 ± 23
jective, we used the tool ten times and recorded the average re- GLEAM 154 6.0 × 5.0 100 ± 20
sult. The results are shown in Table 3. The uncertainties are es- GLEAM 185 5.0 × 4.2 90 ± 18
timated at 20 %, dominated by the difficulty in selecting the true GLEAM 215 4.2 × 3.6 80 ± 16
bounds of the SNR and calculating the true background level of Haslam 408 51 60 ± 10
the Galactic cirrus. CHIPASS 1400 14.4 19.7 ± 1.0
SPASS 2300 8.9 15.2 ± 0.3
3.2. Haslam
The all-sky 408-MHz ‘Haslam’ survey was performed with the 3.4. S-PASS
Green Bank and Parkes Radio telescopes and remains the lowest-
frequency total-power measurement of the full sky (Haslam et al. The S-Band Polarization All Sky Survey (SPASS ; Carretti et al.
1982). The Hoinga SNR is visible in the Haslam images (Fig. 7) 2019) is a survey of polarized radio emission over the southern
but the scanning pattern of Parkes is visible as a series of verti- sky at Dec < −1◦ using the Parkes radio telescope at 2.3 GHz.
cal lines of varying brightness throughout the image. As this is Unlike for CHIPASS (Section 3.3) there is no independent cat-
a total power measurement, the largest scale Galactic cirrus fea- alogue of extragalactic radio sources at 2.3 GHz. Meyers et al.
tures are much brighter than Hoinga, leading to a large increase (2017) derived a catalogue of radio sources from a version of the
in brightness between the east and west parts of the image. The S-PASS images where the large-scale emission had been filtered
images are also invisibly contaminated by the same radio sources out, with slightly worse resolution (10.75)
0 than the published
resolved in the GLEAM data (Section 3.1). To mitigate these is- images (8.9). This catalogue is not as sensitive as and is more
0
sues, we used the following steps: confused than NVSS yielding a source density equal to 3 % that
of NVSS.
– model and subtract the GLEAM extragalactic catalogue for We therefore use NVSS to create the local model of sources
this region, extrapolating the source spectra to 408 MHz, ei- to subtract. To obtain spectral indices for each source, we use
ther via their spectral index α as measured by GLEAM or for the catalogue produced by de Gasperin et al. (2018); for sources
the fainter sources, by an assumed value of −0.75; without a listed spectral index, we use the median local value of
– determine the average brightness profile over the lower por- α = −0.75. Subtracting this model from the S-PASS data results
tion of the image (south of Hoinga) as a function of right in the right-hand panel of Fig. 9. Running poly_flux repeatedly
ascension, and subtract this profile from the full image. we find more consistent results than for CHIPASS; the uncer-
tainty is most likely dominated by the less clean source subtrac-
This resulted in the right-hand panel of Fig. 7, where the tion. The residual RMS after source subtraction in a given beam
artefacts and contaminating sources have largely been removed. is ≈ 20 mJy beam−1 ; Hoinga subtends 256 SPASS beams; the
Similarly to the GLEAM data, we ran poly_flux and found that error is therefore estimated as 0.32 Jy.
the uncertainty on the final results was dominated by the diffi- As S-PASS is a polarisation survey, we can also examine the
culty in subtracting the background, which still has large scan Stokes Q and U images of the region, which indicate the degree
artefacts. We therefore conservatively estimate the error at 20 %. of linear polarisation at angles of ±90◦ and ±45◦ , respectively.
We also attempted to use the ‘de-striped’ ‘de-sourced’ ver- Figure 9 shows that the brightest parts of the shell (left and right
sion of the Haslam image produced by Remazeilles et al. (2015), ‘limbs’) show clear linear polarisation, which is what would be
but Hoinga was invisible in this version, possibly because it has expected from a middle-aged SNR shell with a large shock com-
similar angular scale to the scanning artefacts, and so was re- pression ratio. These also correspond to flatter parts of the SNR
moved by the clean-up algorithms employed. shell, perhaps indicating a local increase in gas density.
3.3. CHIPASS
4. Constraints on 44 Ti emission from INTEGRAL
The continuum map of the HI Parkes All-Sky Survey (CHIPASS;
Calabretta et al. 2014) maps the radio sky at 1.4 GHz south of Explosive nucleosynthesis in SNe is considered the main driver
Dec +25◦ . We downloaded the datah , and cropped and regridded of Galactic, chemical evolution. Its imprints can be readily in-
it to match the MWA mosaics (left panel of Fig. 8). We selected vestigated by observing the γ-rays emitted in the decay from
sources within 15◦ of Hoinga from the NRAO VLA Sky Sur- freshly synthesized, radioactive nuclei. With a half-life of 58.9
vey (NVSS; Condon et al. 1998), convolved them to match the years, the abundantly produced 44 Ti is an ideal candidate with
CHIPASS resolution, and produced an output FITS image in the which to study nucleosynthesis imprinting in young SNRs.
same sky frame as the regridded CHIPASS data. We subtracted In core collapse supernovae (ccSN) 44 Ti is mainly produced
the NVSS model from the CHIPASS image, producing the right during the α-rich freeze-out (Woosley et al. 1973) deep in the
panel of Fig. 8. We used poly_flux to measure the flux density central region, where the nucleosynthesis yields are strongly de-
of Hoinga, shown in Table 3. The errors are dominated by the pendent on the thermodynamic conditions (Magkotsios et al.
selection of the region for subtraction, and after repeated mea- 2010; Hermansen et al. 2020). While models of ccSN fail to ro-
surements, we estimate this at about 5 %, which is 1 Jy. bustly produce explosions in a wide stellar mass range so far,
it appears safe to assume that asymmetries are required to drive
h
https://www.atnf.csiro.au/people/mcalabre/CHIPASS/index.html successful explosions. Depending on the applied, simplified ex-
Article number, page 7 of 12A&A proofs: manuscript no. main
Fig. 7. 100 deg2 of the region surrounding the Hoinga SNR as seen at 408 MHz by the survey by Haslam et al. (1982), after conversion from K
to Jy beam−1 . The left panel shows the original image, and the right panel shows the image after source-subtraction and backgrounding, discussed
in Section 3.2. Hoinga is visible as an ellipse in the centre of the image, while Galactic cirrus and scan line artefacts from the Parkes observing
strategy dominate the surroundings. The bright source in the northwest is Hydra A, and subtraction of this source has not been performed.
Fig. 8. 100 deg2 of the region surrounding Hoinga as seen at 1.4 GHz by CHIPASS, after conversion from K to Jy beam−1 . The left panel shows the
original image, and the right panel shows the image after source subtraction, discussed in Section 3.3. Hoinga is clearly visible as a crescent-moon
in the centre of the image, while Galactic cirrus and residuals around poorly subtracted diffuse sources are visible in the surroundings. The bright
source in the northwest is Hydra A. Faint scan lines are visible from the Parkes observing strategy.
plosion scheme, the predicted 44 Ti ejecta yield can vary in the masses range between 10−6 and 10−5 M (Maeda et al. 2010;
range 10−5 − 10−4 M , depending also on the initial mass of the Seitenzahl et al. 2013; Fink et al. 2014). However, in the double-
exploding star (Timmes et al. 1996; Wanajo et al. 2018; Limongi detonation scenario, ejecta masses of 10−3 − 10−2 M are possi-
& Chieffi 2018). ble (Fink et al. 2010; Woosley & Kasen 2011; Moll & Woosley
In contrast, thermonuclear SNe (type Ia) show a larger diver- 2013), where some exotic models even predict 44 Ti masses of up
sity in the predicted 44 Ti ejecta masses. Multiple scenarios lead- to 0.1 M (Perets et al. 2010; Waldman et al. 2011).
ing to the disruption of a white dwarf star are considered viable, Evidence for the production of 44 Ti can be obtained by mea-
as the progenitors of these explosions have not yet been unam- suring the decay radiation in the decay chain of 44 Ti → 44 Sc →
44
biguously identified. For the standard model, involving a cen- Ca. The dominant decay lines are emitted at 68 and 78 keV
trally ignited Chandrasekhar-mass white dwarf star, 44 Ti ejecta during the 44 Ti decay with a half life of 58.9 years (Ahmad et al.
Article number, page 8 of 12W.Becker, et al.: Hoinga - A SNR discovered in eRASS1
Fig. 9. 100 deg2 of the region surrounding Hoinga as seen at 2.3 GHz by SPASS. The top-left panel shows the Stokes I image, and the top-right
panel shows the image after source subtraction, discussed in Section 3.4. Hoinga is clearly visible as a filled ellipse in the centre of the image,
while Galactic cirrus and residuals around poorly subtracted diffuse sources are visible in the surroundings. The bottom left and bottom right
panels show the Stokes Q and U images, respectively.
2006) and at 1157 keV in the subsequent 44 Sc decay with a half given by
life of 4 hours (Audi et al. 2003). Photons are emitted with a !α
(E − E0 )2
!
probability (branching ratio) of 93.0 %, 96.4 %, and 99.9 % per F0 E
decay, respectively (Chen et al. 2011) LS (E; E0 , F0 , σ) = √ · exp + A0 · , (1)
2πσ 2σ2 EC
Here, the spectrometer SPI (Vedrenne et al. 2003) on
INTEGRAL (Winkler et al. 2003) is used to search for the where F0 is the measured line flux, E0 is the energy of the
decay radiation in both subsequent decay steps in the Hoinga Doppler-shifted line centroid, and σ is the line width. As we ex-
SNR. We use the spimodfit analysis tool (Strong et al. 2005; pect a low signal-to-noise ratio for the decay lines, we search
Halloin 2009) to extract the spectrum in the relevant energy for a combined signal in all lines simultaneously, that is we as-
ranges 50–100 keV and 1100–1200 keV from the raw SPI sume that the branching ratio corrected fluxes, Doppler shifts,
data. The spectrum is extracted assuming an extended source and broadening are identical in all lines. Due to the presence of
of emission modelled by a circular region of 2◦.2 radius with a complex of strong background lines between 50 and 65 keV
a constant surface brightness. A detailed description of SPI induced by germanium, we excluded the 68 keV line in the anal-
analysis and robust background modelling can be found in Diehl ysis.
et al. (2018); Siegert et al. (2019); Weinberger et al. (2020). We find no significant flux excess in the vicinity of the 78
or 1157 keV line or in the combined line analysis. As the broad-
The extracted spectrum is modelled with a general contin- ening of the 78 or 1157 keV lines is related to the expansion
uum and a variable number of Gaussian-shaped decay lines velocity of the 44 Ti-containing ejecta and determines the size of
Article number, page 9 of 12A&A proofs: manuscript no. main
the selected background region, we deduce a 3σ upper flux limit
of 9.2 × 10⁻⁵ ph cm−2 s−1 by assuming an expansion velocity of
4000 km s−1 (Nagataki et al. 1998; Diehl et al. 2015). This ex-
pansion velocity translates into a line broadening of ≈ 2 keV
FWHM at 78 keV and ≈ 20 keV FWHM at 1157 keV, respec-
tively.
5. Summary and Discussion
Using data from the first SRG/eROSITA observatory all-sky sur-
vey we discovered one of the largest SNRs in the sky. Despite
95 % of SNR discoveries being made at radio wavelengths, and
its clear existence in multiple radio surveys, we conclude that
Hoinga was missed by previous searches for several reasons.
Firstly, its location at high Galactic latitudes; most radio searches
have focused on low latitudes, where the density of SNRs is ex-
pected to be highest. Another reason for not noticing it in pre-
vious X-ray and radio surveys is its total flux density. Although
it is large, its surface brightness is relatively low. As it has very
little fine-scale structure, it also does not appear at all in most in-
terferometric maps. In single-dish radio images, it is visibly con-
taminated by about 100 extragalactic radio sources, with many
more below the sensitivity and confusion limits, meaning that Fig. 10. Radio SED of the total flux density of Hoinga as measured by
its diffuse radio emission remained uncovered. Hoinga is nearly the surveys discussed in Section 3. Black points show the data from
the largest SNR ever detected at radio wavelengths, subtending Table 3; the blue line shows a least-squares weighted fit to the data,
≈ 2750 × 2650 , and comparable in size to the largest detected yielding S 1GHz = 26.85 ± 0.03 Jy and α = −0.69 ± 0.08 for S ν ∝ να .
object, G 65.3+5.7: it was therefore outside the bounds of what
was expected and was therefore not visually detected. Finally,
its similar angular scale and structure to the diffuse Galactic syn- This avenue is therefore unpromising, but because the cover-
chrotron makes it less obvious than smaller and brighter sources. age of pulsar surveys is denser at low Galactic latitude, a pulsar
The clear shell structure, particularly evident in Figs. 1 and 8, could have been missed by existing observations, and follow-
indicates it is likely to be a classic shell-type SNR that is not cen- up observations within the SNR shell may yet reveal a counter-
trally powered, and its highly circular nature indicates that it is part. Assuming a distance of ∼ 500 pc, a remnant NS with a
expanding into a region of relatively uniform density. Figure 10 transversal speed of the order of 1000 km s−1 would have by
shows the radio flux densities plotted as a function of frequency, now reached the SN shell if the explosion happened ∼ 17000
with a fitted spectral index of α = −0.69 ± 0.08, for S ν ∝ να . years ago. This speed is not unrealistic, albeit at the far side of
This radio spectral energy distribution indicates that non-thermal the velocity distribution (see e.g. Cordes et al. (1993); Chatterjee
synchrotron emission dominates the radio spectrum, again con- et al. (2005); Becker (2009)). We will investigate this possibility
sistent with a shell-type SNR. in future work.
A distance to the SNR would enable transformation of In the absence of a measured distance, we can use the mor-
our measurements into physical properties. Dubner & Giacani phological and brightness properties of the SNR to infer lim-
(2015) discuss the challenge of estimating the distance of radio- its on the physical characteristics. Studies of the Magellanic
detected SNRs; a method that does not rely on additional ob- Clouds and other Local Group galaxies show that SNR 1.4-
servations is to search for nearby neutron stars that appear as GHz luminosities typically have values in the range 5 × 10¹⁴ <
pulsars and may have formed at the same time as the SNR, and L1.4GHz < 1017 W Hz−1 (e.g. Case & Bhattacharya 1998). As-
−1
using their dispersion measure in combination with electron den- suming that Hoinga is more luminous than 5 × 10¹⁴ q W Hz , we
L1.4GHz
sity models of the Galaxy to determine their distance. can obtain a limit on its distance from Earth by 4πS 1.4GHz
, i.e.
We used the Australia Telescope National Facility pulsar cat- D > 450 pc. Additionally, radio SNRs do not typically have di-
alogue v1.59 (Manchester et al. 2005)i to search for known ra- ameters greater than 100 pc (Badenes et al. 2010). If we assume
dio pulsars within 20◦ of Hoinga’s geometrical centre, but found that Hoinga has a diameter < 100 pc, by geometry its distance
none with attributes that would indicate a clear association. From from Earth must be D < 1.2 kpc. This also gives rise to a lumi-
the group of pulsars located in the region of interest we excluded nosity limit of L1.4GHz < 1.3 × 10¹⁶ W Hz−1 , which puts Hoinga
possible matches on the basis of: on the lower end of the SNR luminosity distribution. We note
that other high-latitude SNRs have also been found to have un-
– period P < 10 ms, indicating a recycled origin; usually low brightness compared to those at low latitudes; see
– characteristic ages ( 2PṖ ) > 45 Myr, which would be extremely e.g. G181.1+9.5 (Kothes et al. 2017) and G 0.1−9.7 (Hurley-
inconsistent with a SNR age of < 0.5 Myr; Walker et al. 2019a).
– measured proper motion inconsistent with having a common If we compare the remnant with other nearby SNRs such as
centre of origin; the Vela SNR, which is also known to have an extent of 8◦.8 and
– measured dispersion measure inconsistent with a nearby lo- a thermal X-ray spectrum with gas temperatures in the range
cation. of 0.2–0.7 keV, a simple scaling law puts Hoinga at twice the
distance of the Vela SNR, which is about 500 pc. The column
i
atnf.csiro.au/research/pulsar/psrcat/ absorption through the Galaxy into the direction of Hoinga is
Article number, page 10 of 12W.Becker, et al.: Hoinga - A SNR discovered in eRASS1
6×1020 cm−2 (Dickey & Lockman 1990). The values found from on Astrophysics at the Ludwig-Maximilians University, IMPRS.
our X-ray spectral fits are of the order of NH = 3.6+0.7 20
−0.6 ×10 cm
−2 This work has made use of data from the European Space Agency (ESA)
mission Gaia (https://www.cosmos.esa.int/gaia), processed by the Gaia
which gives another indication for Hoinga being a nearby SNR. Data Processing and Analysis Consortium (DPAC, https://www.cosmos.
If we assume that the column density derived in Section 2.4 esa.int/web/gaia/dpac/consortium). Funding for the DPAC has been pro-
is representative along the entire line of sight, we can derive a vided by national institutions, in particular the institutions participating in the
range of local ISM densities by dividing by the distance limits. Gaia Multilateral Agreement.
The following 3rd-party software was used in this work: aoflagger and cot-
For a column density of NH = 6 × 1020 cm−2 , and distances of ter (Offringa et al. 2015); WSClean (Offringa et al. 2014; Offringa & Smirnov
0.45–1.2 kpc, the resulting local density nH = 0.42–0.16 cm−3 . 2017); Aegean (Hancock et al. 2018); miriad (Sault et al. 1995); TopCat
Inputting these into the SNR evolutionary model calculator pro- (Taylor 2005) NumPy v1.11.3 (Dubois et al. 1996; Harris et al. 2020); As-
vided by Leahy & Williams (2017), with otherwise standard troPy v2.0.6 (Astropy Collaboration et al. 2013); SciPy v0.17.0 (Oliphant 2007),
Matplotlib v1.5.3 (Hunter 2007). The manuscript was prepared on the web-
model and input values, we calculate the range of possible ages based LATEX editor, Overleaf.
as 21–150 kyr. However, the morphology of the SNR suggests a
much lower age, and therefore we suggest the SNR is likely to
be at the closer, younger, and higher nH ends of the allowable
ranges. References
Taking into account the fact that no pulsar has been asso- Adams, S. M., Kochanek, C. S., Gerke, J. R., Stanek, K. Z., & Dai, X. 2017,
ciated with the object so far, it is highly possible that Hoinga MNRAS, 468, 4968
is the remnant of a type Ia SN. This would also be consistent Ahmad, I., Greene, J. P., Moore, E. F., et al. 2006, Physical Review C, 74
Asaoka, I. & Aschenbach, B. 1994, A&A, 284, 573
with the high latitude of the SNR, as the massive star progeni- Asaoka, I., Egger, R., & Aschenbach, B. 1996, in Röntgenstrahlung from the
tors of core-collapse SNe are expected to be more concentrated Universe, ed. H. U. Zimmermann, J. Trümper, & H. Yorke, 233–234
in the Galactic plane (Taylor et al. 1993; Cordes & Lazio 2002; Aschenbach, B. 1998, Nature, 396, 141
Faucher-Giguere & Kaspi 2006). Astropy Collaboration, Robitaille, T. P., Tollerud, E. J., et al. 2013, A&A, 558,
A33
eROSITA will perform a total of eight all-sky surveys. With Audi, G., Bersillon, O., Blachot, J., & Wapstra, A. H. 2003, Nuclear Physics A,
further surveys completed, more data from the Hoinga remnant 729, 3
will become available in the next few years. This will allow us Badenes, C., Maoz, D., & Draine, B. T. 2010, MNRAS, 407, 1301
to study the remnants fine structure and spectral properties in Becker, W. 2009, in Astrophysics and Space Science Library, ed. W. Becker, Vol.
357, 91
more detail, hopefully allowing us to further constrain its dis- Bertin, E., Mellier, Y., Radovich, M., et al. 2002, in Astronomical Society of the
tance, age, chemical composition, and SN type. The findings of Pacific Conference Series, Vol. 281, Astronomical Data Analysis Software
Hoinga represent a highlight of the beginning of a wider program and Systems XI, ed. D. A. Bohlender, D. Durand, & T. H. Handley, 228
setup by the authors WB and NHW as part of an eROSITA- Borkowski, K. J., Lyerly, W. J., & Reynolds, S. P. 2001, ApJ, 548, 820
Busser, J.-U., Egger, R., & Aschenbach, B. 1996, in Röntgenstrahlung from the
Australian-based joint-venture collaboration defined to explore Universe, ed. H. U. Zimmermann, J. Trümper, & H. Yorke, 239–240
the X-ray-radio-sky in order to uncover further exciting surprises Calabretta, M. R., Staveley-Smith, L., & Barnes, D. G. 2014, PASA, 31, e007
in the SNR sphere. Carretti, E., Haverkorn, M., Staveley-Smith, L., et al. 2019, MNRAS, 489, 2330
Case, G. L. & Bhattacharya, D. 1998, ApJ, 504, 761
Acknowledgements. We thank Bernd Aschenbach and Nicholas Pingel for fruit- Chatterjee, S., Vlemmings, W. H. T., Brisken, W. F., et al. 2005, ApJ, 630, L61
ful discussions and the anonymous referee for valuable comments. Chen, J., Singh, B., & Cameron, J. A. 2011, Nuclear Data Sheets, 112, 2357
eROSITA is the primary instrument aboard SRG, a joint Russian-German sci- Condon, J. J., Cotton, W. D., Greisen, E. W., et al. 1998, AJ, 115, 1693
ence mission supported by the Russian Space Agency (Roskosmos), in the in- Cordes, J. M. & Lazio, T. J. W. 2002 [astro-ph/0207156v3]
terests of the Russian Academy of Sciences represented by its Space Research Cordes, J. M., Romani, R. W., & Lundgren, S. C. 1993, Nature, 362, 133
Institute (IKI), and the Deutsches Zentrum für Luft- und Raumfahrt (DLR). The de Gasperin, F., Intema, H. T., & Frail, D. A. 2018, MNRAS, 474, 5008
SRG spacecraft was built by Lavochkin Association (NPOL) and its subcon- Dickey, J. M. & Lockman, F. J. 1990, ARA&A, 28, 215
tractors, and is operated by NPOL with support from IKI and the Max Planck Diehl, R., Siegert, T., Greiner, J., et al. 2018, Astronomy & Astrophysics, 611,
Institute for Extraterrestrial Physics (MPE). The development and construction A12
of the eROSITA X-ray instrument was led by MPE, with contributions from the Diehl, R., Siegert, T., Hillebrandt, W., et al. 2015, A&A, 574, A72
Dr. Karl Remeis Observatory Bamberg & ECAP (FAU Erlangen-Nürnberg), the Dorman, B., Arnaud, K. A., & Gordon, C. A. 2003, in AAS/High Energy Astro-
University of Hamburg Observatory, the Leibniz Institute for Astrophysics Pots- physics Division, Vol. 7, AAS/High Energy Astrophysics Division #7, 22.10
dam (AIP), and the Institute for Astronomy and Astrophysics of the University of Dubner, G. & Giacani, E. 2015, A&A Rev., 23, 3
Tübingen, with the support of DLR and the Max Planck Society. The Argelander Dubois, P. F., Hinsen, K., & Hugunin, J. 1996, Comput. Phys. Commun., 10, 262
Institute for Astronomy of the University of Bonn and the Ludwig Maximilians Ebeling, H., White, D. A., & Rangarajan, F. V. N. 2006, MNRAS, 368, 65
Universität Munich also participated in the science preparation for eROSITA. Egger, R., Greiner, J., & Aschenbach, B. 1996, in Röntgenstrahlung from the
The eROSITA data shown here were processed using the eSASS/NRTA soft- Universe, ed. H. U. Zimmermann, J. Trümper, & H. Yorke, 247–248
ware system developed by the German eROSITA consortium. Faucher-Giguere, C.-A. & Kaspi, V. M. 2006, The Astrophysical Journal, 643,
NHW is supported by an Australian Research Council Future Fellowship (project 332
number FT190100231) funded by the Australian Government. This scientific Fink, M., Kromer, M., Seitenzahl, I. R., et al. 2014, MNRAS, 438, 1762
work makes use of the Murchison Radio-astronomy Observatory, operated by Fink, M., Röpke, F. K., Hillebrandt, W., et al. 2010, A&A, 514, A53
CSIRO. We acknowledge the Wajarri Yamatji people as the traditional owners of Folgheraiter, E. L., Watson, M. G., & Warwick, R. S. 1996, in Röntgenstrahlung
the Observatory site. Support for the operation of the MWA is provided by the from the Universe, ed. H. U. Zimmermann, J. Trümper, & H. Yorke, 253–254
Australian Government (NCRIS), under a contract to Curtin University adminis- For, B. Q., Staveley-Smith, L., Hurley-Walker, N., et al. 2018, MNRAS, 480,
tered by Astronomy Australia Limited. Establishment of the Murchison Radio- 2743
astronomy Observatory and the Pawsey Supercomputing Centre are initiatives Foster, A. R., Ji, L., Smith, R. K., & Brickhouse, N. S. 2012, ApJ, 756, 128
of the Australian Government, with support from the Government of Western Frail, D. A., Goss, W. M., & Whiteoak, J. B. Z. 1994, ApJ, 437, 781
Australia and the Science and Industry Endowment Fund. We acknowledge the Gaia Collaboration, Brown, A. G. A., Vallenari, A., et al. 2018, A&A, 616, A1
Pawsey Supercomputing Centre which is supported by the Western Australian Green, D. A. 2019, Journal of Astrophysics and Astronomy, 40, 36
and Australian Governments. Access to Pawsey Data Storage Services is gov- Green, D. A. & Stephenson, F. R. 2017, Possible and Suggested Historical Su-
erned by a Data Storage and Management Policy (DSMP). ASVO has received pernovae in the Galaxy, ed. A. W. Alsabti & P. Murdin, 179
funding from the Australian Commonwealth Government through the National Gritschneder, M., Lin, D. N. C., Murray, S. D., Yin, Q. Z., & Gong, M. N. 2012,
eResearch Collaboration Tools and Resources (NeCTAR) Project, the Australian ApJ, 745, 22
National Data Service (ANDS), and the National Collaborative Research Infras- Halloin, H. 2009, |spimodfit| Explanatory Guide and Users Manual, version 2.9
tructure Strategy. This research has made use of NASA’s Astrophysics Data Sys- edn., Max Planck Institut für extraterrestrische Physik, Giessenbachstraße 1,
tem Bibliographic Services. 85748 Garching, Germany
MGFM acknowledges support by the International Max-Planck Research School Hancock, P. J., Trott, C. M., & Hurley-Walker, N. 2018, PASA, 35, e011
Article number, page 11 of 12You can also read