Is our life good enough? - WORKING PAPER Measuring territorial quality of life to support a future for all places and bring Europe closer to its ...
←
→
Page content transcription
If your browser does not render page correctly, please read the page content below
WORKING PAPER

Is our life
good enough?
Measuring territorial quality of life to support a future
for all places and bring Europe closer to its citizens

Working paper // Is our life good enough?

KEY POLICY MESSAGES
                                                                  sonal and community flourishing, using new environ-
                                                                  mental indicators to monitor the health and resilience of
▪ Good life enablers for the people living in a
                                                                  ecosystems in urban and rural areas.
  place matter
    Measuring good life enablers – good shelter, health,         ▪ We get what we measure
    education, mobility, digital infrastructure, work and         Measuring TQoL is not just a venture for experts and
    consumption opportunities, and social and cultural            policymakers. Because ‘we get what we measure’,
    activities – is the first task for policymakers to improve    policymakers need to ask citizens what they want in
    Territorial Quality of Life (TQoL) in all places.             life, to validate the use of TQoL indicators. Measurement
                                                                  of TQoL will be implemented by engaging citizens in the
▪ Personal flourishing can be measured
                                                                  design process. This is called a ‘citizen-centric’
    Life is a matter of maintaining good health, flourishing      approach and has been suggested by pilot experiences
    and fulfilling our aspirations. Measuring citizens’ life      from TQoL measurement living labs in different regions
    maintenance and flourishing by means of objective and         of Europe.
    subjective indicators and integrating a citizen-centric
    approach is the second important task for policymakers.      ▪ Quality of life needs to be integrated in
                                                                   territorial planning practice at different
▪ Community flourishing is important for                           geographical levels and in various policy
  measuring quality of life                                        domains
    In the process of measuring TQoL it is important to           As TQoL is linked to personal, socio-economic and
    include the sense of belonging and how trustful citizens      ecological spheres, it should be included in all policies,
    are of others and institutions. Community flourishing is      including sector policies (e.g. transport, environment
    a key domain of the TQoL concept, supporting an inclu-        and agriculture) addressing different domains. Policy
    sive future for all places.                                   coordination and coherence can be achieved by inte-
▪ Ecological flourishing is key for improving                     grating the measurement of TQoL in territorial planning
  quality of life                                                 practice at different spatial levels – national, regional
                                                                  and local – using quality-of-life targets and indicators
    Keeping our life in harmony with nature is key for a
                                                                  to monitor policy implementation and outcomes in a
    sustainable future for all places, and this requires the
                                                                  certain territory.
    measurement of ‘ecological’ flourishing alongside per-

2        ESPON // espon.eu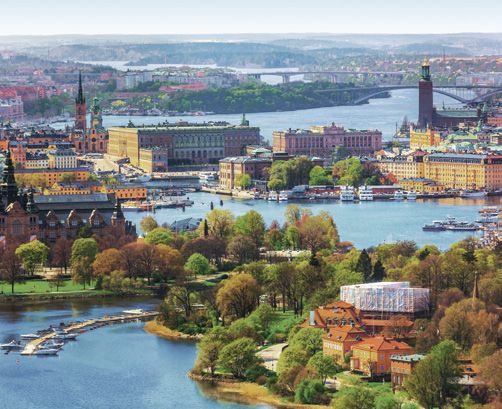
Working paper // Is our life good enough?

1.
Introduction and policy context
Over the past few years, discussions have taken place on       at global and local levels. As a result, the pandemic may
how to measure quality of life (QoL) and how quality-of-life   fundamentally change the way we gather together and
indicators can complement economic and social indica-          share space, and shift the way that cities are organised
tors to measure territorial development. Indeed, measur-       and planned to be more resilient. As mentioned in the
ing progress only by means of gross domestic product           territorial agenda 2030, Europe faces major economic,
(GDP) or income indicators is not enough to address all        social and environmental challenges, but it also has great
things that matter in the lives of citizens. Enhancing QoL     potential to improve living conditions in all places and for
is a key objective for policymakers at different scales, and   all people. This crisis offers the opportunity to improve our
it has become more relevant in the policy agenda along         relationship with nature and to achieve the European
with increasing demands for the participation of citizens in   Green Deal goals of climate neutrality and environmental
the political process.                                         protection. The 2021 work plan of the Committee of the
                                                               Regions (Commission for the Environment, Climate
At European level, several policy documents include ref-
                                                               Change and Energy) notes that local and regional policy-
erences to QoL: cohesion reports, the urban agenda for
                                                               makers’ top priority is to ensure that ‘environmental and
the European Union (EU) and the Territorial Agenda 2030
                                                               climate action are our greatest ally … in the formulation of
are some examples. QoL is mentioned in the 7th Cohesion
                                                               sustainable recovery strategies and … by taking into
Report in relation to social progress, urban ecosystems
                                                               account the geographical and social characteristics of
and green infrastructure, and good governance. The
                                                               each territory’, leaving no people and no region behind.
urban agenda for the EU seeks to improve QoL in urban
                                                               Indeed, the current crisis emphasises the importance of
areas using an integrated and coordinated approach.
                                                               ensuring a higher resilience of territories to crisis situa-
QoL is also mentioned in the territorial agenda as one of
                                                               tions – in terms of health and social and economic factors
the fields in which action is needed to increase citizens’
                                                               – and the need for ‘a better link between health and
well-being: ‘All public policies … should go beyond eco-
                                                               environment’.
nomic performance, living standards and purely material
aspects to include access to quality public services, free-    This working paper makes an important contribution by
dom of movement, and healthy, resilient and high-quality       providing a methodology to assess QoL through a place-
architecture and built environments. They also have a          based and citizen-centric approach based on the results
territorial dimension ranging from disparities between         of the ESPON applied research project ‘QoL – Quality of
neighbourhoods such as social exclusion and urban pov-         life measurements and methodology’, recent literature
erty, to disparities between regions and countries.’           review and taking into account the current European pol-
                                                               icy processes, in particular the priorities of the Slovenian
Overall, QoL in Europe varies significantly between
                                                               Presidency of the Council of the European Union. It
regions, and regional differences within European coun-
                                                               addresses the concept of territorial quality of life (TQoL),
tries can be more significant than the differences meas-
                                                               developed by ESPON, and explains how to apply it to any
ured between countries.
                                                               ‘place’; depending on the geographical scale of the anal-
Until now, level of income and standard of living have         ysis, this could be a single house or building, a neighbour-
been used to assess our personal success and QoL.              hood, a city, or a wider area (county, region, nation or the
However, with increasing evidence and awareness of cli-        whole European territory). This approach also suggests a
mate change and societal challenges, the equation linking      participatory process to ensure that the quality-of-life
growth, prosperity and QoL has been revised, to reduce         measurement is legitimated by the people, reflecting their
inequalities and harmful impacts on the environment.           life needs and expectations. This working paper is
Now, because of the COVID-19 outbreak, we are all fac-         intended to inform and inspire policymakers and stake-
ing new, important challenges that affect our QoL. The         holders in relation to how to operationalise and integrate
potential changes to our way of life are manifold, as this     QoL into policy processes at different levels.
crisis has spared no territory and has had uneven impacts

                                                                                                    ESPON // espon.eu         3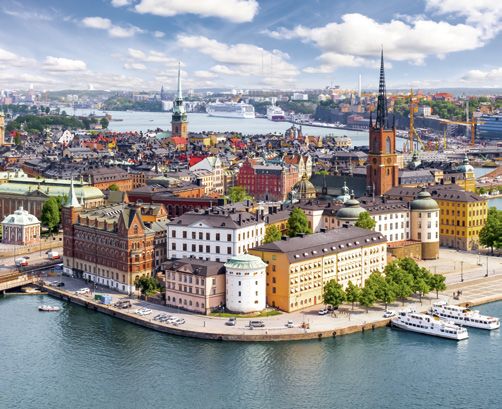
Working paper // Is our life good enough?
2.
What is territorial quality of life and how should it
be measured?
2.1 To operationalise this concept, ESPON developed a
Is the concept universal and applicable TQoL conceptual map including three dimensions: good
life enablers, life survival (‘maintenance’) and life flourish-
to different territorial scales? What are
ing. These dimensions cover three spheres – personal,
the common measurement domains? socio-economic and ecological – providing a matrix of
TQoL is ‘the capability of living beings to survive and QoL measurement domains and sub-domains (Figure 1).
flourish in a place, thanks to the economic, social and Finally, the three vertical dimensions of the measurement
ecological conditions that support life in that place’ scheme can be grouped into two pillars: the QoL enablers
(ESPON 2021). (the first dimension) and the QoL outcomes (the other two
dimensions).
Figure 1
ESPON TQoL conceptual map
Good life enablers Life maintenance Life flourishing
Personal enablers
Housing & Personal health
health & safety
basic utilities Self-esteem
flourishing
indicators
Personal
Personal
Enablers of good
Personal
Healthcare shelter, education,
sphere
health Personal safety
Self-actualisation
Education indicators
Transport
Economic & societal health
Inclusive Interpersonal
Socio-economic enablers
Community flourishing
Digital connectivity economy trust (social
Enablers of indicators belonging)
good mobility,
Socio- Work connectivity, work
economic
and consumption
sphere Consumption choices, social and
cultural life Healthy Institutional
Public spaces society trust (good
indicators governance)
Cultural assets
Green Healthy
Ecosystems
Ecological
Ecological
environment
Ecological
flourishing
infrastructure
enablers
Ecological Enablers of good
health
indicators services and
sphere life in green
biodiversity
Protected environments Climate change wealth
areas indicators
QoL ENABLERS PILLAR QoL OUTCOMES PILLAR
Source: ESPON 2021
4 ESPON // espon.eu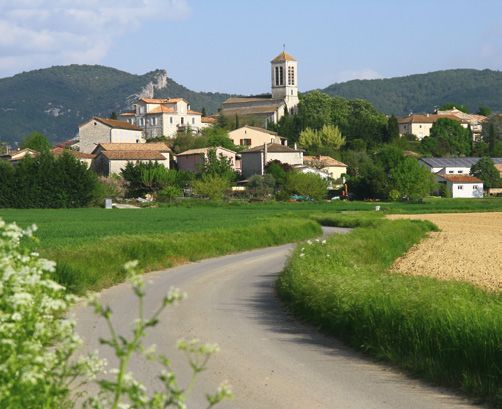
Working paper // Is our life good enough?

In the first pillar, the personal sphere QoL enablers          Scientific validity is the first criterion to apply in the selec-
include good shelter, education and health, measured           tion of indicators. At the same time this process needs to
using indicators of availability, accessibility and afforda-   be validated through a participatory process that engages
bility of housing, basic utilities, education and health       policymakers, stakeholders and citizens to create owner-
services in the territory. The socio-economic sphere QoL       ship. This comprehensive approach can ensure both sci-
enablers include good mobility, digital connectivity, work     entific relevance and legitimacy of the chosen indicators,
and consumption opportunities, and social and cultural         enhancing the acceptance of TQoL measurement and
activities in the territory. Finally, the ecological sphere    easing its implementation and use in different policies.
enablers of good life include the availability and mainte-
nance of green environments (e.g. urban parks and pro-
tected natural areas).                                         2.2
                                                               How does the concept and measure-
In the second pillar, QoL outcomes are measured by
means of objectives and subjective indicators and include
                                                               ment of QoL differ at national, regional
aspects that are good for life maintenance (a healthy          and local levels? What are the possible
personal life, an inclusive economy, and a healthy society     common indicators?
and environment) and life flourishing aspects (the fulfil-     To visualise the conceptual framework described above,
ment of personal aspirations, community flourishing and        data to measure the different domains and sub-domains
ecological flourishing).                                       of TQoL across Europe at regional level (Nomenclature of
The conceptual map for measuring TQoL can be used              Territorial Units for Statistics, level 3) were selected and
across different territorial levels, with the selection of     gathered. The selection of TQoL indicators at European
indicators based on the data available in each context.        level (NUTS 3), including the reasoning for selection and
Furthermore, the selection of indicators representing          the limitations of each indicator, is shown in Annex 1.
each domain and sub-domain should be supported by              A system for coding QoL indicators was used to identify
robust reasoning and statistical evidence of their relation-   available data, and an ESPON TQoL dashboard tool was
ship with the QoL aspect to be measured. The use of            developed to gather the selected indicators and produce
proxy indicators should be avoided when these are only         composite QoL indices. A detailed explanation of the
poorly related.                                                methodology used is provided in the following box.

METHODOLOGY
TQoL measurement
The ESPON methodology for measuring QoL at regional            The TQoL dashboard tool allows the weight of each indi-
level (TQoL dashboard methodology) encompasses five            cator within the domains and sub-domains to be amended,
steps:                                                         for instance after consultation with groups of experts,
                                                               stakeholders or citizens.
Step 1: selection of QoL indicators. The indicators should
be complementary to the Eurostat, Organisation for Eco-        Step 4: indicator testing and validation. To test and vali-
nomic Co-operation and Development and United Nations          date the indicators, a sensitivity analysis is performed with
datasets measuring progress towards the Sustainable            alternative weights, a comparison is carried out with com-
Development Goals (SDGs); be able to capture the effects       posite indices and other synthetic indicators of well-being
of regional policy interventions; and have a high political    (Directorate-General for Regional and Urban Policy EU
and communication value. It is important to ensure coher-      social progress index, Hannel QoL index, life expectancy
ence with current policies and ongoing work on this topic.     at birth and GDP per capita), and an assessment is car-
                                                               ried out with the ESPON QoL Advisory Group. Finally,
Step 2: data harmonisation. Data harmonisation is car-
                                                               insights from case studies, suggesting potential changes
ried out to render the variables comparable. Highly
                                                               to the TQoL overall framework, are taken into account.
skewed distributions are transformed (logarithmic and
power transformations). Indicators are normalised in a         Step 5: indicator analysis and visualisation. This step is
range (0–1).                                                   carried out in an iterative loop with steps 3 and 4. Analysis
                                                               and visualisation lead to a new round of validation and
Step 3: weighting QoL indicators. Weighting currently
                                                               then to a new round of mapping and analysis until the
occurs through the hierarchical organisation of indicators
                                                               results are sufficiently robust.
in three dimensions, nine domains and 22 sub-domains.

                                                                                                      ESPON // espon.eu         5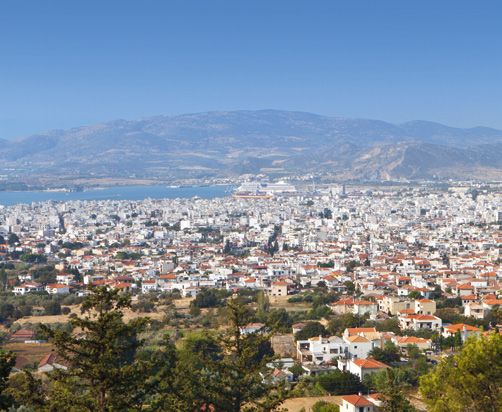
Working paper // Is our life good enough?

The TQoL dashboard tool is provided as a simple applica-      Ardèche, France; and Volos, Greece (all regional level,
tion (in Excel), illustrating the methodology used. This      NUTS 3). The tool has the flexibility to use different indi-
allows policymakers and other users to explore the rela-      cators and different weighting criteria to compute com-
tionship between structural conditions of EU regions          posite indices, depending on the nature of the QoL priori-
(NUTS 3 regions) and different aspects of QoL. It covers      ties in the different territorial contexts. The tool can also
the ESPON space (the EU, Iceland, Liechtenstein,              be used to compare QoL indicators at different territorial
Norway, Switzerland and the United Kingdom) and               scales – European, national, regional and local – depend-
Western Balkans (Albania, Montenegro, North Macedonia         ing on the availability of relevant data. Finally, the dash-
and Serbia). The tool enables a comparison between one        board can also be applied to a single territorial context to
region and other regions in Europe in a given year, includ-   measure and monitor trends in QoL over time in a given
ing regional typologies, such as urban-rural. Three exam-     region, city, rural or urban area.
ples are presented below for Stockholm, Sweden;

6       ESPON // espon.eu
ndex
                                                                                                                              Working paper // Is our life good enough?

                                                                       Malta             Liechtenstein

           Benchmarking of the TQoL index in Stockholm, Sweden (urban region)
x,                                                                     Canarias (ES)     Guadeloupe (FR)

                                                                       Guyane (FR)       Martinique (FR)

                                                                       Mayotte (FR)      Reunion (FR)

           Territorial Quality of Life Index,                          Acores (PT)
                                                                                                    Comparative position 16 out of 1442
                                                                                         Madeira (PT)

           the region in the European context

           Good life enablers                                  Life maintenance                                          Life flourishing

           Personal enablers                                   Personal health and safety                                Personal flourishing

           Housing & basic utilities                           Personal health                                           Self-esteem

           Healthcare                                          Personal safety                                           Self-actualization

           Education
ON, 2020                                                                                    500 km

                                                                            Regional level: NUTS 3 (2016)
           Socio-economic enablers                                Economic     and   societal health
                                                                               Source: ESPON QoL, 2020
                                                                                                                         Community flourishing
                                       Origin of data: Eurostat, ESPON, EU-SPI, Eurobarometer, EEA, 2020
                                                                   UMS RIATE for administrative boundaries
           Transport                                           Inclusive economy                                         Interpersonal trust (societal belonging)

           Digital connectivity                                Healthy society                                           Institutional trust (good governance)

           Work opportunities

           Consumption opportunities

           Cultural assets

           Ecological enablers                                 Ecological health                                         Ecological flourishing

           Green infrastructure                                Healthy environment                                       Ecosystems services and biodiversity wealth

           Protected areas                                     Climate change

           In the European context, Stockholm has an outstanding TQoL (16th out of 1 442 NUTS 3 regions). This region shows
           very good performance in accessibility to basic services, in particular with regard to access to housing and education,
           good conditions for digital services, and a high availability of cultural and commercial services and retail opportunities.
           In addition, Stockholm is in a good position in relation to other European regions in terms of economic and societal
           health and ecological flourishing, with higher standards for green infrastructure.

                                                                                                                                              ESPON // espon.eu        7
of Life Index
od Life Enablers Index, Canarias (ES) Guadeloupe (FR)
ndex
g Index
Working paper // Is our life good enough?
Guyane (FR) Martinique (FR)
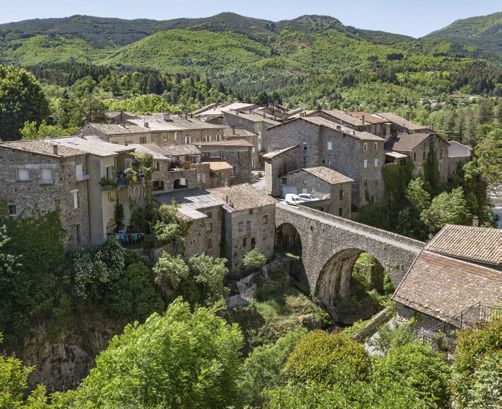
Benchmarking of the TQoL index in Ardèche, France (rural region)
Mayotte (FR) Reunion (FR)
Acores (PT) Madeira (PT)
Territorial Quality of Life Index, Comparative position 250 out of 1442
the region in the European context
Good life enablers Life maintenance Life flourishing
© ESPON, 2020 500 km
Regional level: NUTS 3 (2016)
Source: ESPON QoL, 2020
Personal enablers Personal health
Origin of data: Eurostat,and safety
ESPON, EU-SPI, Eurobarometer, EEA, 2020Personal flourishing
UMS RIATE for administrative boundaries
Housing & basic utilities Personal health Self-esteem
Healthcare Personal safety Self-actualization
Education
Socio-economic enablers Economic and societal health Community flourishing
Transport Inclusive economy Interpersonal trust (societal belonging)
Digital connectivity Healthy society Institutional trust (good governance)
Work opportunities
Consumption opportunities
Cultural assets
Ecological enablers Ecological health Ecological flourishing
Green infrastructure Healthy environment Ecosystems services and biodiversity wealth
Protected areas Climate change
Ardèche is a region in the south-east of France. It shows an outstanding TQoL in the European context (250th among
1 442 NUTS 3 regions). This is because of its good performance in the environmental domain and with regard to per-
sonal health and safety aspects (low murder rate, low number of traffic deaths). In addition, it has good accessibility to
basic services (health, education, housing, transport and jobs) and good digital connectivity. It also performs well in the
key socio-economic domain of employment.
8 ESPON // espon.euWorking paper // Is our life good enough?
Mayotte (FR) Reunion (FR)
Benchmarking of the TQoL index in Volos, Greece (intermediate region)
Acores (PT) Madeira (PT)
500 km
Territorial Quality of Life Index,
Regional level: NUTS 3 (2016)
Comparative position 566 out of 1442
theOrigin
region in the European context
Source: ESPON QoL, 2020
of data: Eurostat, ESPON, EU-SPI, Eurobarometer, EEA, 2020
UMS RIATE for administrative boundaries
Good life enablers Life maintenance Life flourishing
Personal enablers Personal health and safety Personal flourishing
Housing & basic utilities Personal health Self-esteem
Healthcare Personal safety Self-actualization
Education
Socio-economic enablers Economic and societal health Community flourishing
Transport Inclusive economy Interpersonal trust (societal belonging)
Digital connectivity Healthy society Institutional trust (good governance)
Work opportunities
Consumption opportunities
Cultural assets
Ecological enablers Ecological health Ecological flourishing
Green infrastructure Healthy environment Ecosystems services and biodiversity wealth
Protected areas Climate change
In the European context, Volos has a good TQoL (566th among 1 442 NUTS 3 regions), which is above the European
average. Volos is less prominent in terms of economic performance and aspects related to social vulnerability, such as
the number of people at risk of poverty. It has also faced unemployment challenges, but performs well in the areas of
service provision (healthcare and education), societal networks and interpersonal trust, ecological health and land-
scape. In addition, natural and cultural patrimonies are very prominent.
ESPON // espon.eu 9Working paper // Is our life good enough?
2.3 In general, capital regions and large cities, such as Paris
What does quality of life in Europe and Brussels, perform better, but, in addition, Warsaw and
Krakow perform better than most urban areas in Poland,
look like? Lisbon and Porto, Prague, Bratislava, Vilnius and Zagreb.
What patterns emerge in the various
dimensions of quality of life? In addition to the composite map, separate maps (Maps
2–4) illustrate the European picture for each QoL dimen-
How does my region perform in the
sion: good life enablers, life maintenance and life flourish-
European and national contexts? ing, respectively. Several peripheral regions and southern
Map 1 shows the territorial dimension of QoL in Europe regions perform well in the environmental domains (e.g.
(aggregate TQoL composite index) at regional level. This ecological flourishing and green infrastructure) and in
combines QoL enablers (conditions that exist in the terri- subjective aspects of life maintenance and life flourishing
tory and that improve QoL), QoL maintenance (as experi- (e.g. interpersonal trust and self-esteem). However, the
enced by citizens, in relation to a healthy personal life, good performance in these sub-domains does not fully
healthy economy and healthy environment) and life flour- compensate for the lower performance related to
ishing indicators (as experienced by citizens in relation to socio-economic conditions. Some rural and intermediate
the fulfilment of personal aspirations, community flourish- regions have good overall performance driven by the
ing and ecological flourishing) in one composite index. environmental domains; these include the Ardèche region
(south of Lyon) and Cantabria (in northern Spain).
The map shows a high QoL in the Nordic countries, in
particular in Norway, Sweden and Iceland, but also in The maps should be interpreted with caution. Indeed,
Finland and Denmark. Regions located in countries these European maps at regional level (NUTS 3 regions)
along the ‘blue banana’ perform well too, especially were affected by the limited range and, in some cases,
regions in south-western Germany, Switzerland, western inconsistent quality of statistical data available for the first
parts of Austria, the Netherlands and the United Kingdom. pilot application. In particular, the limited availability of
Overall, the results reflect, to some extent, a centre-pe- environmental indicators and subjective indicators linked
riphery pattern, mostly driven by the economic indicators to TQoL aspects of life maintenance and life flourishing
related to health, education and the labour market in the means that additional caution is required when interpretat-
European regions. ing trends at European level. However, the maps are very
valuable in demonstrating the application of the concep-
Interestingly, a relatively high QoL has been identified in tual framework and in highlighting the consequences of
several regions in the Mediterranean: the Basque data gaps, and therefore can contribute to stimulating data
Country, Cantabria, Catalonia, Madrid and parts of collection improvements to make QoL comparisons more
Castilla León in Spain; eastern Macedonia and Epirus in reliable. Moreover, the application of the dashboard tool at
north-eastern and north-western Greece, respectively; local level in Barcelona, Wales and Vienna does not have
Malta and Cyprus; Liguria, Friuli and Trentino in the this limitation, as a wide range of detailed data at local
northernmost coastal regions of Italy; Slovenia; and the level were available and included in the tool.
Rhone Valley, French Alps and Occitanie region in
south-eastern France.
10 ESPON // espon.euWorking paper // Is our life good enough?
Map 1
Quality of life in Europe at regional level (NUTS 3)
Malta Liechtenstein
Territorial Quality of Life Index
Composed by the Good Life Enablers Index, Canarias (ES) Guadeloupe (FR)
the Life Maintenance Index
and the Life Flourishing Index
0.60 - 0.69
Guyane (FR) Martinique (FR)
0.57 - 0.59
0.54 - 0.56
0.50 - 0.53
Mayotte (FR) Reunion (FR)
0.44 - 0.49
0.25 - 0.43
no data
Acores (PT) Madeira (PT)
© ESPON, 2020 500 km
Regional level: NUTS 3 (2016)
Source: ESPON QoL, 2020
Origin of data: Eurostat, ESPON, EU-SPI, Eurobarometer, EEA, 2020
UMS RIATE for administrative boundaries
Map 2
Life enablers index (territorial conditions facilitating QoL) in Europe
at regional level (NUTS 3)
The QoL enablers dimension reflects the pattern of differences
Malta Liechtenstein
in the accessibility versus remoteness of regions. Sparsely
populated areas, inner peripheries and areas with low accessi-
Good Life Enablers Index bility, mainly located in Spain, Italy, Romania, Bulgaria, some
Composed by the Personal, Canarias (ES) Guadeloupe (FR)
Social and Ecological QoL Enablers
Indexes
areas of Greece, France and Poland, seem to perform worse in
0.65 - 0.78
the European context.
Guyane (FR) Martinique (FR)
0.59 - 0.64
0.53 - 0.58 Overall, QoL enablers favour urban and central regions over
0.48 - 0.52
Mayotte (FR) Reunion (FR)
peripheral rural and sparsely populated areas. Observed pat-
0.41 - 0.47
0.28 - 0.40 terns related to this dimension are related to different territorial
no data
Acores (PT) Madeira (PT)
conditions of European regions, such as job opportunities.
Therefore, European countries show a large diversity of situa-
tions, with some regions performing well and others lagging
behind.
© ESPON, 2020 500 km
Regional level: NUTS 3 (2016)
Source: ESPON QoL, 2020
Origin of data: Eurostat, ESPON, EU-SPI, Eurobarometer, EEA, 2020
UMS RIATE for administrative boundaries
ESPON // espon.eu 11Working paper // Is our life good enough?
Map 3
Life maintenance index (healthy personal life, healthy economy and healthy environment)
in Europe at regional level (NUTS 3)
European regions show a large diversity of situations and differ-
Malta Liechtenstein
ences in the life maintenance dimension. The top regions on this
dimension are mainly located in southern Germany, Switzerland
Life Maintenance Index and Austria, as well as in southern England (United Kingdom),
Composed by the Personal Health and Safety Index, Canarias (ES) Guadeloupe (FR)
the Economic and Societal Health Index
and the Ecological Health Index
Norway, Sweden (Svealand, Småland and Scania) and Finland.
0.73 - 0.86
0.66 - 0.72
Guyane (FR) Martinique (FR) Low levels of personal health and safety have been identified in
0.57 - 0.65 eastern Europe and the Western Balkan countries, which are
0.47 - 0.56
Mayotte (FR) Reunion (FR)
driven by low life expectancy and high death rates as a result of
0.33 - 0.46
0.09 - 0.32 traffic accidents and homicides. Economic health is low in cen-
no data
Acores (PT) Madeira (PT)
tral and eastern European countries, in particular in Romania
and Bulgaria, and in the Mediterranean (Spain, Italy and
Greece), indicating challenges related to unemployment, gender
pay gaps and social aspects (high poverty rates, high rates of
early school leavers and poor educational attainment).
Finally, indicators related to environmental health seem to be
driven by the air quality and the impact of climate change, with
© ESPON, 2020 500 km major challenges in regions in the Netherlands, the United
Regional level: NUTS 3 (2016)
Source: ESPON QoL, 2020
Origin of data: Eurostat, ESPON, EU-SPI, Eurobarometer, EEA, 2020
Kingdom, France, Spain, Portugal, northern Italy and in dis-
UMS RIATE for administrative boundaries
persed regions in central and eastern Europe.
Map 4
Life flourishing index (fulfilment of personal aspirations, community flourishing and
ecological flourishing) in Europe at regional level (NUTS 3)
Overall, Mediterranean and Nordic countries, as well as Poland,
Malta Liechtenstein
the United Kingdom, Ireland and Switzerland, perform well with
regard to life flourishing. Low personal flourishing patterns are
Life Flourishing Index seen in Belgium, north-west France and parts of Italy, and widely
Composed by the Personal Flourishing Index,
across central and eastern European countries (except Poland).
Canarias (ES) Guadeloupe (FR)
the Community Flourishing Index
and the Ecological Flourishing Index
0.63 - 0.81
Guyane (FR) Martinique (FR) Low personal flourishing patterns are driven by low self-esteem
0.55 - 0.62
0.50 - 0.54 (represented by high suicide rates and low levels of tolerance
0.46 - 0.49
Mayotte (FR) Reunion (FR)
towards people with disabilities), observed mainly in Romania,
0.40 - 0.45
0.23 - 0.39 Hungary, Slovakia, Czech Republic and the Western Balkans,
no data
Acores (PT) Madeira (PT)
but also in the Baltic countries, Finland and Austria.
Community flourishing is related to interpersonal trust, which is
generally higher in Mediterranean countries but is also high in
Poland and the Nordic countries, and trust in the institutions and
quality of government, which is low in most central and eastern
European countries and most Mediterranean countries.
Low ecological flourishing patterns are located mostly in France,
© ESPON, 2020 500 km
Regional level: NUTS 3 (2016) Italy and the United Kingdom and also in parts of north-west
Source: ESPON QoL, 2020
Origin of data: Eurostat, ESPON, EU-SPI, Eurobarometer, EEA, 2020
UMS RIATE for administrative boundaries Germany, described based on the value given to ecosystems.
Overall, this dimension must be interpreted with caution because
of low data availability.
12 ESPON // espon.euWorking paper // Is our life good enough?
2.4 ensure the freedom of expression and enable citizens’
How can citizens and public empowerment with regard to policy decisions affecting
QoL. To promote the widespread and validated applica-
participation be considered in tion of QoL measurement, efforts are needed to scale up
selecting indicators and in the local experiences, building a European milieu for QoL
definition of QoL for a certain policy innovation, for instance by the creation of a network
territory? of TQoL living labs to implement the approach across
European regions and cities.2
Applying the TQoL measurement methodology requires a
place-based and citizen-centric approach. This means The living lab concept (originally created for the business
engaging citizens,1 experts and policymakers in co-decid- milieu) can also be applied to policy innovation. In
ing what aspects of, why and how QoL should be meas- essence, this is equivalent to seeing the measurement of
ured to enable good life. The approach is ‘citizen-centric’ TQoL as a product, service or application that the public
if a participatory process is used to engage citizens in the sector (relevant authorities and statistical agencies) deliv-
selection of indicators relevant to the place where they ers in cooperation with the private sector, the third sector
live. With this approach, a set of QoL indicators aims to and citizens directly (e.g. engaging randomly selected
reflect, at different territorial levels (EU, national, regional panels in co-design and evaluation). The value created
and local), a shared idea of QoL. However, the selection by TQoL living labs will be broader than the value for
of indicators to measure QoL is not straightforward as it money considered in the business milieu, for instance the
should reflect the values and priorities of those – institu- ‘territorial sustainability value’ includes all forms of value
tions, researchers, private businesses, civil society that determine the health and well-being of a population,
organisations and citizens – involved in the process. In not only in the short term but also in the long term.
this context, the involvement of civil society is relevant to
3.
Reflections on COVID-19 and its impact on
quality of life in Europe and its regions
The COVID-19 outbreak has brought into sharp focus sectors is now seen as vital to build a safer and better life
that life is a matter of survival and does not just consist of for all in the coming months and years. Second, the crisis
growth and flourishing. Since March 2020, the essential has drawn public and political attention to the need to
foundations of people’s QoL have been shaken by the improve and ensure good QoL at territorial level and
pandemic. Although it is still too early to draw definitive highlighted which domains are relevant to ensuring
conclusions about the impact of the pandemic on QoL, greater resilience of neighbourhoods and territories in a
two main conclusions can be drawn. First, the pandemic health, social or economic crisis. This information can be
has impacted all aspects of QoL to a significant degree. used in the future to establish a dashboard of factors rel-
The primary QoL pillar ‘good life’ has proved to be very evant to tackling pandemic crises or other territorial
relevant to tackling the crisis: quality of housing, accessi- shocks (e.g. the consequences of climate change).
bility to public services (especially health services and
Based on the case studies outlined in Section 5, the fol-
digital connectivity) and the availability of green infra-
lowing aspects are noted as the most relevant for mini-
structure have been key aspects in ensuring that QoL is
mising the impact of the COVID-19 pandemic on TQoL.
maintained during the lockdowns implemented in
response to the pandemic. Moreover, investment in these
1
The term ‘citizen’ in this context is defined as ‘an inhabitant of a particular place’. This can be in reference to a village, town, city,
region, country or whole continent (e.g. Europe), depending on the territorial context.
2
A living lab is a systemic approach in which all stakeholders in a product, service or application participate directly in the develop-
ment process (Bergvall-Kåreborn et al. 2009).
ESPON // espon.eu 13Working paper // Is our life good enough?
The need for better coordination in cross- reducing carbon emissions; support is also being pro-
border regions vided for the Welsh government’s commitment to fund
Luxembourg: The countries in the Greater Region have transport improvements for pedestrians and cyclists.
introduced very different national and regional measures Resources should also be transferred so that Wales’ nat-
that have not been coordinated with their respective ural habitats can be restored, with green corridors linking
neighbouring countries. For people living in territories areas of the country and more investment in the new
close to the border, the measures have resulted in huge national forest being planted.
restrictions on their mobility and also their cross-border
freedom of movement, which has had negative impacts
New opportunities and threats related to
on their TQoL. As neighbouring countries and regions
teleworking and digitalisation for different
have taken very different approaches to adaption to new
types of territories need policy attention
developments during the pandemic, existing rules fre-
Italy inner areas: Many facets of social life, such as work-
quently change, which is confusing for people who under-
ing, studying, shopping and general interactions, have
take daily or frequent cross-border activities. The need for
been taking place online during the lockdowns. This has
better coordination in cross-border regions has been
had some positive effects, including a reduction in the
addressed at political level in order to implement consist-
number of people commuting at rush hours and the
ent procedures across several sectors: access to health-
over-crowding of public transport, reducing traffic conges-
care, education, mobility and transport.
tion. However, these potential benefits require public
Nova Gorica - Gorizia: The COVID-19 pandemic has administrations and private companies to reorganise the
created a burden on the cooperation between the two management of their operations. First, teleworking creates
public administrations, interfering with the joint planning new disparities, with significant differences between those
of the metropolitan area. A demand for a dialogue at who are able to work online and those who carry out activ-
national level to harmonise decisions on the cross-border ities where their presence and physical contact with other
area has been requested by these cities. people remain essential. The latter are more restricted in
where they can work. Moreover, inner areas lag behind in
the development of digital infrastructure, which causes
Integration of quality of life in recovery plans
problems such as low coverage, poor access and low
and as a policy objective for territorial
quality of services, affecting people and businesses set-
development
tled in those areas and preventing new settlements from
Wales: In the debate about the future direction of the
being developed. In addition, personal, psychological and
post-COVID-19 recovery, the Future Generation
social implications related to the shift to teleworking and
Commissioner called for ‘visionary ideas and transforma-
the quantity and quality of time devoted to work and to
tive investment’ in the recovery plan, which should include
personal and family life need to be analysed.
‘a new definition of prosperity, based on well-being, and a
fairer, greener way of living’. Among the recommenda- In any event, this ‘new normal’ situation widens the range
tions is a multi-million pound stimulus package to support of spatial choices for living, settling, producing and con-
the decarbonisation of Wales’ housing stock – putting suming for many. This may create new opportunities for
money into new low-carbon affordable housing and polycentric development, reversing the trend of popula-
launching a national retrofitting programme to improve tion decline in inner areas because of the arrival of new
energy efficiency in existing homes – arguing that the inhabitants, for instance young families. Therefore, it is
benefits for people’s health, the environment, jobs and important to identify the needs and expectations of cur-
Wales’ housing stock would outweigh the estimated rent and potential new inhabitants (such as access to
costs. In addition, investments to improve digital connec- different public services), which may change significantly
tivity are being promoted, as thousands remain working owing to digitalisation.
from home, taking pressure off transport networks and
14 ESPON // espon.euWorking paper // Is our life good enough?
4.
Five lessons learned from 10 case studies and
examples of good practice in Wales, Barcelona
and Vienna
In total, 10 case studies across Europe were carried out, Luxembourg is a highly integrated cross-border region
taking into account different territorial contexts and cover- with a long history of cooperation and intense commuting,
ing a variety of regions: Vienna, Barcelona and Catalonia, whereas Nova Gorica and Gorizia are twin cities between
Helsinki-Uusima, north-eastern Iceland, Luxembourg, Italy and Slovenia. Several case studies include regions
Nova Gorica and Gorizia, Wales, the Netherlands, Latvia undergoing industrial decline (Catalonia and Wales) and
and the inner areas of Italy of Lazio and Monti Reatini. coastal regions (Wales, Barcelona and Helsinki).
The selection includes two large capital cities (Vienna
The case studies addressed current practices in integrat-
and Helsinki), regions with urbanised and rural areas
ing QoL measurements in national, regional and local
(Catalonia and Wales), a remote region with a low popu-
territorial development strategies, and tested the TQoL
lation density (north-eastern Iceland) and remote areas
measurement methodology developed. The main lessons
(inner areas of Lazio and Monti Reatini). Two case studies
learned from the case studies and some examples of
highlight a cross-border context, although in different
good practice are presented below.
settings: Luxembourg, and Nova Gorica and Gorizia.
10 CASE STUDIES
Five lessons learned
1. There is not a ‘one size fits all’ approach nor a TQoL including more sub-domains and fewer data on local
concept that can be applied in all territorial contexts and regional levels (Iceland and Luxembourg).
and at all geographical levels.
▪ At urban and metropolitan levels, approaches
2. The ESPON conceptual map on TQoL is a very useful could more easily benefit from involving citizens in
guide for measuring QoL and it can easily be adapted the definition of QoL, applying the concept to a
to different territorial contexts and geographical levels. functional urban region (as in Vienna).
3. The citizen-centric approach is perceived as useful by ▪ Sparsely populated regions are a very special
the stakeholders interviewed in all case studies, but is case as a result of market mechanisms leading to
difficult to apply in practice. reduced service provision in some sectors. QoL in
such a territorial context needs to capture differ-
4. The territorial scale makes a difference for both the
ences that affect large parts of the territory, although
concept and the practical measurement of QoL:
only for a reduced number of people (as in Iceland).
▪ At European and national levels, the main focus is
▪ The analysis of QoL in a cross-border context is very
comparing and benchmarking QoL across countries
difficult, as different policies, stakeholders and
and regions. By doing so, it is useful to apply meth-
national statistical and governance settings are
ods available at international level, such as the
involved. The ESPON conceptual map on TQoL can
social progress indicators. However, this approach
be particularly helpful in this context, providing a basis
is less advantageous for policy monitoring, as the
for a shared definition of QoL in cross-border areas.
information available is often not detailed enough to
analyse the impact of policy actions. 5. The integration of QoL in territorial policies is closely
related to the governance context and processes in
▪ At national and regional levels, different approaches
which QoL is defined and monitored. Different levels
to policy monitoring are used. Often there is a strong
of commitment can be observed. In three case studies
focus on welfare and public service provision (as in
– Wales, Finland and Barcelona – there are legal pro-
Wales and Helsinki). Trade-offs between regional
visions to implement QoL measurement as a basis for
and thematic differentiation are mainly in favour of
policy making.
ESPON // espon.eu 15Working paper // Is our life good enough?
CASE STUDIES: EXAMPLES OF GOOD PRACTICES
Wales has the most comprehensive policy concept, implemented through
legislation, institutional arrangements and a reporting system
QoL covers the full range of public services and many In Wales, the Well-being of Future Generations (Wales)
policy fields, including land-use planning and place mak- Act 2015 put in place a requirement on the Welsh govern-
ing, transport, housing, decarbonisation, skills for the ment ‘to establish national indicators and milestones to
future, adverse childhood experiences, and health and help assess progress towards achieving the seven
wellness. The concept is introduced through comprehen- well-being goals, and report on them annually’. The set of
sive legislation, QoL-specific institutional arrangements indicators was developed in 2015 (‘The Wales we want’),
and the setting up and operationalisation of a measure- with a national consultation on ‘How do you measure a
ment and reporting system. Wales’ scheme is particularly nation’s progress?’. Many of Wales’ indicators are
rich in legal and institutional provisions related to QoL expected to ‘help tell a story of progress in Wales against
(e.g. establishing a Future Generations Commissioner for more than one of the United Nations Sustainable Devel-
Wales and a public services board for each local authority opment Goals’. This is carried out through the publication
area with a collective duty). There is a high degree of of annual well-being reports.
acceptance of the concept as a policy instrument and
multi-actor commitment.
Barcelona is the richest in terms of measurement frameworks and a data haven
The case study of Barcelona is the richest in terms of indicators related to QoL. Data are generated through
measurement frameworks such as reports, dashboards official sources, surveys (including internet surveys) and
and data availability. The Open Data Barcelona portal the use of big data. From this wealth of information, sev-
includes more than 450 datasets that are regularly eral dashboards (e.g. performance tables per neighbor-
updated and available in different formats that can be hood by key indicators, the Barcelona Social Observatory
downloaded. There is a very large data stock available and the BCN 0-17 Observatory, which monitor the life-
and most of it is available at neighborhood level. This is styles of children and young people) publish indicators
the basis for a large number of initiatives that produce and reports on a regular basis.
Vienna is the only case study with a dedicated QoL survey concept
Since 1995, a survey TQoL has been implemented in context (residential area). The results reflect the ‘image’ of
Vienna. The sample size is large (more than 8 000 people) the respective locality among the residents.
and the survey is representative at the level of neighbour-
The results of the surveys are used to support planning
hoods and social groups. The definition of QoL was devel-
(e.g. of parking zones) and policy making. Elements of
oped for the first survey but has been expanded, but
the extensive data gathered by the surveys are used in
always with the aim of enabling comparisons to be made
specific policy contexts (e.g. smart city strategy and gen-
over time. QoL is measured using a set of questions in
der equality monitoring). The ownership of the data lies
different domains, such as education, housing, mobility or
with the municipality and the data are publicly available
what the city has to offer. Each of the surveys (repeated
after a certain period of time.
approximately every 5 years) focuses on a specific sphere,
such as ‘work and the reconciliation of work and family life’ Overall, the unique data stock generated since 1995, the
in 2013. The overall aim is to gain information on the inter- focus on subjective data, the strong territorial approach
viewees’ individual and subjective assessments of a num- and the use of the data for planning purposes can be con-
ber of domains, mostly using a scale ranging from 1 to 5. sidered good practice. However, no comparative data are
Interviewees are asked about their individual satisfaction generated for the surroundings of Vienna; therefore, the
with different areas of their life and are also asked to pro- information is confined to the administrative borders and
vide a subjective assessment of the situation in the given does not cover the functional urban area.
16 ESPON // espon.euWorking paper // Is our life good enough?
5.
Guidance and recommendations for
policymakers and practitioners
Taking into account the TQoL model, the analysis of QoL most of the current practices. This would require an
at European, regional and local levels and the results of effort of further harmonisation and extension of the
the case studies, several recommendations emerged to surveys already implemented by Eurostat and national
support policymakers and citizens in measuring and statistical offices in Europe.
improving QoL in their territories:
▪ A citizen-centric approach needs to be implemented
▪ Member States, as well as regional and local author- in a systematic way. In particular, it is recommended
ities, should (a) learn from and capitalise on the expe- that (a) citizens are involved in the definition of what
riences and good practices of others when measuring TQoL means for them; and (b) citizens are involved in
and monitoring QoL in their territories; and (b) integrate TQoL measurement co-design activities (not just in
TQoL measurement in territorial development plans (as data collection), as this can help to improve the rele-
in Wales), ensuring a good fit between planning objec- vance of the indicators and the reporting of results.
tives and the indicators used to measure QoL.
▪ A TQoL accounting practice should be developed (this
▪ TQoL should be incorporated systematically into policy can be based on the application of the outcome-based
evaluation to monitor the impact of EU and national accountability approach3) as a new pilot action to imple-
funding on QoL inequalities at regional level, including ment the Territorial Agenda 2030, supporting the crea-
(a) potential negative impacts of austerity policies on tion of TQoL measurement labs in Europe. A TQoL
good life enablers (e.g. healthcare, education, trans- measurement lab is a policy innovation milieu where
port, digital connectivity and housing); and (b) potential experts from competent institutions (statistical agencies;
positive impacts of investments for facilitating economic universities; departments of national, regional and local
recovery on QoL outcomes. governments; business associations; and NGOs) work
together with citizens and stakeholders to define QoL
▪ QoL aspects should be included in the post-2020
priorities, test indicators, and monitor and evaluate QoL
cohesion policy. In this respect, the TQoL measure-
improvements. This concept is presented in Figure 2.
ment could help to establish a new baseline, linking the
cohesion policy with the United Nations SDGs. In par- ▪ TQoL accounting should be implemented by means of
ticular, regional and local governments need a shorter a European platform that can support the measure-
list of relevant indicators – instead of the existing 231 ment of TQoL and the implementation of a citizen-cen-
SDG indicators – and the ESPON TQoL framework can tric approach across different territories in Europe. The
be applied to narrow down such a list to a more opera- platform should host a network of living labs. The
tional set of indicators. ESPON programme could play a leading role in
launching pilot experiences and facilitating the network
▪ A better balance between subjective and objective
development.
indicators should be achieved while measuring QoL.
Indeed, subjective indicators are under-represented in
3
Outcome-based accountability introduces outcome indicators for measuring the QoL of the whole population living in or visiting a
territory. The measurement refers to the whole population, from the citizens’ everyday lives perspective, not only that of the users
of a certain service or facility.
ESPON // espon.eu 17Working paper // Is our life good enough?
Figure 2
Territorial quality-of-life accounting practice
Territorial QoL Accounting Managers
WHY AND TO WHAT EXTENT
TERRITORIAL QUALITY OF
LIFE WILL BE IMPROVED
Expected quality of life impacts (for
all born and unborn living beings)
HOW WE CAN MEASURE
Policymakers
Data Experts
WHAT WE WANT ACHIEVEMENTS AND
TERRITORIAL QUALITY OF LIFE
TO ACHIEVE WITH A IMPACTS
MEASUREMENT LABS
POLICY PROGRAMME (participatory application of TQoL Quality of life outcomes
Policy Goals Dashboard and LC clustering tools) (choice of indicators,
weightings and data
collection and delivery)
WHO SHOULD BE
ENGAGED AND HOW
Transparent processes of
stakeholders and citizen panels
selection and engagement
Citizens & Stakeholders
18 ESPON // espon.euWorking paper // Is our life good enough?
References
Bergvall-Kåreborn, B., Ihlström Eriksson, C., Ståhlbröst, A., & Svensson, J. 2009. A Milieu for Innovation - Defining Living
Lab. Presented at the 2nd ISPIM Innovation Symposium, New York City, New York, United States, December 6–9.
Council of the European Union (2019a), Towards an ever more sustainable Union by 2030, Brussels.
Council of the European Union (2019b), Council conclusions, The economy of wellbeing, Brussels.
European Commission (2020) – Communication from the Commission to the European Parliament, the Council, the
Economic and Social Committee and the Committee of the Regions, Commission Work Programme 2021, A Union of
vitality in a world of fragility, Brussels.
European Commission (2020), Report on Quality of Life in European Cities, 2020, Publications Office of the European
Union, Luxembourg (https://ec.europa.eu/regional_policy/sources/docgener/work/qol2020/quality_life_european_
cities_en.pdf).
European Union (2020), ‘Territorial Agenda 2030 – A future for all places’ (https://www.territorialagenda.eu/home.html).
ESPON (2012), ‘ATTREG – Attractiveness of European regions and cities for residents and visitors’ (https://www.espon.
eu/programme/projects/espon-2013/applied-research/attreg-attractiveness-european-regions-and-cities).
ESPON (2021), ‘ESPON QoL – Quality of life measurements and methodology’ (https://www.espon.eu/programme/
projects/espon-2020/applied-research/quality-of-life)
Fratesi, U. and Rodríguez-Pose, A. (2016), ‘The crisis and regional employment in Europe: What role for sheltered
economies?’, Cambridge Journal of Regions, Economy and Society, 9(1): 33–57.
Friedman, Mark (2009) - Trying Hard Is Not Good Enough, PARSE Publishing, Santa Fe, USA
Hanell, T. (2018), ‘Regional quality of life in the EU: Comprehending the European space beyond GDP through the
capability approach’, PhD thesis, Aalto University, School of Engineering, Department of Built Environment, Helsinki.
OECD (2019), ‘The economy of well-being: Creating opportunities for people’s well-being and economic growth’, SDD
Working Paper No 102, Paris.
OECD (2020a), A Territorial Approach to the Sustainable Development Goals: Synthesis report, OECD Urban Policy
Reviews, OECD Publishing, Paris.
OECD (2020b), Innovative Citizen Participation and New Democratic Institutions: Catching the deliberative wave,
OECD Publishing, Paris.
Radermacher, W. J. (2020), Official Statistics 4.0: Facts for people in the 21st century, Springer, New York
Rodríguez-Pose, A. (2018), ‘The revenge of the places that don’t matter (and what to do about it)’, Cambridge Journal
of Regions, Economy and Society, 11(1): 189–209.
Rosling, H. and Rosling, O. (2018), Factfulness: Ten reasons we’re wrong about the world – and why things are better
than you think, Sceptre, UK.
ESPON // espon.eu 19Annex 1
20
Working paper // Is our life good enough?
Indicators selected to fill the territorial quality-of-life framework
ESPON // espon.eu
at European level (NUTS 3)
Note: the indicators should be aligned with policy goals and consider the policy context in the region or territory.
Sub- Selected indicators based Rationale of indicator Limitations of selected indicators and
Dim. Dom. What should indicators describe in this sub-domain?
dom. on data availability choice improvements
WHAT: Sanitation conditions It aims to represent household The indicators used focus on the
Housing and basic utilities (b11)
▪ indicators of the availability and affordability (market prices and (percentage uncollected conditions regarding the quantity of services available because of
social housing) of houses and housing space sewage and percentage sewage system data availability. More information is
sewage treatment) needed in relation to quality perception
▪ indicators of the quality of the housing stock and built and satisfaction with household
environment (e.g. with respect to planning standards) Households lacking adequate It aims to represent the lack of conditions (sanitation, heating and
▪ indicators of availability and affordability (prices and taxes) of heating basic utilities (heating) cooling systems, isolation and housing
energy, water supply and sewage, and waste collection and affordability).
Household overcrowding It aims to represent living
treatment services.
conditions (overcrowding)
WHY: The availability and affordability of good housing and basic
utilities is a pre-requisite for choosing to settle/live in a place. Burdensome cost of housing It aims to represent the
affordability of housing
WHAT: Availability of hospital beds It aims to represent the The indicators used focus on the
▪ indicators of the availability, accessibility and affordability (prices availability of basic health quantity of services available because of
Personal sphere
QoL enablers
and taxes) of health infrastructure and services services such as hospital data availability. More information is
beds. needed in relation to quality perception
▪ indicators measuring the quality of the infrastructure and
Health (b12)
or satisfaction with health services
services. Accessibility of health services It aims to represent the accessibility.
WHY: The availability or accessibility of hospitals and other (pharmacies, doctors and availability of health services
healthcare facilities in a reasonable time threshold is a basic need hospitals) using as a proxy the
for life. percentage of the area
cathegorised as ‘highly
accessible’ to pharmacies,
hospitals and doctors.
WHAT: Accessibility of education It aims to represent the The indicators used focus on the
▪ indicators of the availability, accessibility and affordability (prices (primary and secondary accessibility of education quantity of services available because of
Education (b13)
and taxes) of education infrastructure and services schools) using as a proxy the data availability. More information is
percentage of the area needed in relation to quality perception
▪ indicators measuring the quality of the infrastructure and cathegorised as ‘highly or satisfaction with the accessibility
services. accessible’ to primary or (commuting time, transport mode, etc.),
WHY: The availability or accessibility of primary, secondary and secondary schools. availability and affordability (such as
high schools in a reasonable time threshold is a basic need for budget assigned to education) of
households with children to settle/live in a place. educational centres.You can also read