A Machine Learning Approach to Estimating YouTube Performance on the iOS Platform Based on the Analysis of Encrypted Network Traffic - Petra Rebernjak
←
→
Page content transcription
If your browser does not render page correctly, please read the page content below
UNIVERSITY OF ZAGREB
  FACULTY OF ELECTRICAL ENGINEERING AND
                COMPUTING

          MASTER THESIS no. 1747

A Machine Learning Approach to
Estimating YouTube Performance
on the iOS Platform Based on the
 Analysis of Encrypted Network
                Traffic
              Petra Rebernjak

             Zagreb, June 2018.
I would like to thank my
thesis advisor, Associate Professor Lea Skorin-Kapov, PhD for her help and guidance
throughout the course of my academic studies. I would also like to extend my thanks to
Research Assistant Irena Oršolić and Postdoctoral Researcher Mirko Sužnjević, PhD
for their continuous availability and assistance.
   I’m thankful to Ericsson Nikola Tesla d.d. and Faculty of Electrical Engineering
and Computing, University of Zagreb for their resources and support.
   I owe special thanks to my colleagues who have become my friends, Illona and
Ivan, for all the talks and fun we had that made my experience substantially more
enjoyable.
   Finally, I must express my profound gratitude to my mum Ruža, to the rest of my
family and to my dearest Ivan for their constant love, unfailing support and never-
ending encouragement. Thank you.

                                                                                   iii
C ONTENTS

1. Introduction                                                                       1
   1.1. Motivation . . . . . . . . . . . . . . . . . . . . . . . . . . . . . . . .    1
   1.2. Challenges in modelling and monitoring of video induced QoE . . . .           2
        1.2.1. Related work . . . . . . . . . . . . . . . . . . . . . . . . . .       2
        1.2.2. Contributions . . . . . . . . . . . . . . . . . . . . . . . . . .      4
   1.3. Thesis structure . . . . . . . . . . . . . . . . . . . . . . . . . . . . .    5

2. Methodology                                                                        6
   2.1. YouQ system . . . . . . . . . . . . . . . . . . . . . . . . . . . . . .       6
   2.2. Laboratory setup . . . . . . . . . . . . . . . . . . . . . . . . . . . .      8
   2.3. YouQ application on iOS platform . . . . . . . . . . . . . . . . . . .       10
   2.4. Behaviour of the YouTube service in YouQ implementation for iOS -
        problems and explanations . . . . . . . . . . . . . . . . . . . . . . .      11
   2.5. Adjusted measurement methodology on iOS platform . . . . . . . . .           14

3. Collected YouTube dataset                                                         18
   3.1. Ground truth . . . . . . . . . . . . . . . . . . . . . . . . . . . . . . .   18
   3.2. Network feature extraction . . . . . . . . . . . . . . . . . . . . . . .     19
   3.3. Improvements in feature extraction . . . . . . . . . . . . . . . . . . .     22
   3.4. Collected dataset . . . . . . . . . . . . . . . . . . . . . . . . . . . .    27

4. Development of QoE estimation models based on machine learning                    34
   4.1. Overview . . . . . . . . . . . . . . . . . . . . . . . . . . . . . . . .     34
        4.1.1. OneR . . . . . . . . . . . . . . . . . . . . . . . . . . . . . .      35
        4.1.2. LogitBoost . . . . . . . . . . . . . . . . . . . . . . . . . . .      35
        4.1.3. Random Forest . . . . . . . . . . . . . . . . . . . . . . . . .       36
   4.2. Machine learning process . . . . . . . . . . . . . . . . . . . . . . . .     36
   4.3. Models trained on complete dataset . . . . . . . . . . . . . . . . . .       37

                                                                                     iv
4.4. Models trained on class-balanced dataset . . . . . . . . . . . . . . . .   42

5. Results                                                                         48

6. Conclusion                                                                      52

List of Figures                                                                    54

List of Tables                                                                     56

Bibliography                                                                       58

                                                                                    v
1. Introduction
1.1. Motivation
Today’s world would not be imaginable without the Internet since more than half of
the world’s population uses it [5]. According to Cisco’s 2016 VNI [2], total Internet
traffic has experienced dramatic growth in the past two decades, and will reach 3.3
ZB per year by 2021. By the same year, more than 63% of total IP traffic will be
generated from wireless and mobile devices. Regarding this thesis, the most significant
estimate of growth concerns IP video traffic. Cisco’s report states that every second, a
million minutes of video content will cross the network, thus comprising the 82% of
all consumer Internet traffic by 2021. Furthermore, in the next four years, consumer
Video-on- Demand (VoD) traffic will nearly double.
Consequently, content delivery techniques must advance. Firstly, preserving the
user’s privacy while connected to the Internet is of utmost importance. Hence, Over
The Top (OTT) service providers evolved to using HTTP over Transport Layer Secu-
rity (TLS), commonly known as Secure HTTP or HTTPS, which encrypts transmitted
content and makes eavesdropping significantly harder to perform. Secondly, video de-
livery must be scalable and seamless to the end user. The need for optimized video
delivery to every device encouraged the tech community to develop different adaptive
bitrate standards. Adaptive video delivery enables the client to dynamically request a
quality of the video stream based on detected network conditions, buffer status, and/or
device capabilities. This approach eludes interruptions in video playback, hence en-
suring better user’s experience. According to [3], HTTP Live Streaming (HLS) and
Dynamic Adaptive Streaming over HTTP standardized by MPEG (MPEG-DASH) are
by far the most popular adaptive bitrate solutions adopted by OTT video services.
Enhancements mentioned above inflict serious challenges for Internet Service
Providers (ISPs) when estimating end user perceived Quality of Experience (QoE).
Many application-level Key Performance Indicators (KPIs) affect the QoE of adaptive
video streaming services (e.g., initial delay, stalling events and its duration, video’s
1resolution). However, the widespread use of encryption makes it impossible for ISPs
to gain insight into the content passing through their network by obtaining information
stored in HTTP headers, ultimately leaving them in the dark, unable to detect origins
of QoE degradations. To unveil complex statistical relations between network- and
application-level data, machine learning based techniques have been extensively used
by researchers, and are showing promising results.
YouTube has been deemed one of the most popular OTT video services and is the
primary focus of this thesis. YouTube delivers its content via Google’s CDN and relies
on complex server selection strategies to push content as close as possible to end users
[1]. It adopts previously mentioned MPEG-DASH, i.e., video quality is automatically
adapted based on client-side measurement.
1.2. Challenges in modelling and monitoring of video
induced QoE
1.2.1. Related work
Internet Service Providers must actively monitor the QoE of customers to satisfy their
expectations by utilizing the resources optimally. There are many factors that influence
QoE of HTTP adaptive streaming, such as video bitrate, quality level, buffer underruns,
stalling duration. An overall survey of QoE modelling is given in [24], while a com-
prehensive survey on adaptive video streaming QoE is provided in [35]. In the case of
YouTube, it is of utmost importance to understand the behaviour of YouTube adaption
algorithm to define suitable QoE models. Authors in [13] characterized the YouTube
service from the viewpoint of traffic generation in the server’s application layer, which
is very valuable for predicting the video quality perceived by end-users. Hossfeld et
al. [22] study the impact of the amplitude and frequency of representation switches on
the user experience. Authors in [39] derived different models to better understand the
functioning of YouTube. They generated network traffic, investigated how the traffic
is consumed at the client side, and analyzed the operation of YouTube from an end-
user perspective, presenting a model for the quality perceived by them. Mondal et al.
[26] adopted a focused approach to understand the internals of YouTube’s bitrate and
quality adaptation algorithm. They further propose an analytical model which enables
prediction of data consumption for an initial playback video quality when it is possible
to estimate the network conditions a priori.
2Authors in [16] combined passive traffic analysis techniques to detect stalling
events in YouTube video streams, with a QoE model to map stallings into a Mean
Opinion Score (MOS) reflecting the end-user experience. However, their approach re-
lies on the Deep Packet Inspection (DPI) which is no longer possible since the adoption
of HTTPS.
Currently, monitoring solutions deployed solely on client devices provide a reliable
and accurate view of application layer KPIs which can further be mapped to user per-
ceived QoE. Wamser et al. [38] developed YoMoApp, an Android application that pas-
sively monitors KPIs of YouTube adaptive video streaming on end-user smartphones.
They monitor playback events and buffer level of YouTube player as those KPIs have
a high correlation with actual QoE of mobile users. To prove that correlation, they
performed a subjective QoE testing of the tool.
Monitoring solutions deployed on client devices are not always feasible in terms
of deployment, nor do they provide global views. ISPs rely primarily on passive traf-
fic monitoring solutions deployed solely within their network to obtain insight into
degradations perceived by end users and identify root causes of potential problems.
Prometheus [11] uses passive measurements on a mobile network to estimate the QoE
of two applications, Video on Demand and VoIP. For the video QoE only Buffering
Ratio is considered as a QoE indicator, while the system is evaluated only on unen-
crypted traffic using binary classification to detect buffering issues with 84% accuracy.
Casas et al. [17] addressed the problem of QoE monitoring, assessment and predic-
tion in cellular networks, relying on in-smartphone QoS passive traffic measurements
and QoE crowdsourced feedback. They state that proposed prediction features and
model can correctly forecast the individual, per-user overall experience and service
acceptability of popular apps in 91% and 98% of the monitored sessions. Authors in
[21] developed a framework for analyzing video quality. Their approach is based on a
man-in-the-middle proxy for storing the decrypted video bitstream, active probing and
traffic shaping. They plan to use the collected data to calculate video QoE values using
a model such as ITU-T Rec. P.1203. Their framework is just a starting point for more
automated video quality estimation and further analysis of encrypted video streams.
Pan et al. [30] proposed a machine learning based bitrate estimation (MBE) ap-
proach to effectively estimate the bitrates of HTTPS YouTube video streaming. They
show that MBE could rely exclusively on readily available IP packet level measure-
ment to obtain the bitrate information of encrypted video streaming, the most critical
information for video QoE assessment. Dimopoulos et al. [18] developed predictive
models for detecting different levels of QoE degradation that is caused by three key
3influence factors, i.e. stalling, the average video quality and the quality variations.
One of the main findings of this paper is that the changes in size and inter-arrival times
of video segments are among the most important indicators of quality impairments.
The models are evaluated on the production network of a large scale mobile operator,
and show that despite encryption their methodology is able to accurately detect QoE
problems with 76%-92% accuracy.
Tsilimantos et al. [37] introduced traffic profiling to extract application-layer char-
acteristics, such as state of the play-back buffer and the video encoding rate, from
on-going video streams at the network or link layer. Since their estimators only use
IP-layer information, this approach does not need to be modified for different transport
protocols, i.e. TCP/TLS and QUIC.
1.2.2. Contributions
This work aims to contribute to the ongoing open research efforts in exploring tech-
niques for estimating QoE from encrypted network traffic, with a specific focus on
YouTube as one of the most popular video delivery services available today.
Authors in [28, 31, 29] have developed a system called YouQ. The idea behind the
YouQ system is to diagnose QoE-related performance degradation using exclusively
network-based measurements and analysis of encrypted traffic, and to enable data col-
lection, processing and machine learning model building under a variety of conditions.
It is important for the entire process to be automated, so as to simplify the model
building when YouTube deploys changes in its adaptation logic.
To complement the existing research, the ongoing work has addressed scenarios
such as including cases when YouTube is accessed via the YouTube IFrame API on
both Android [28, 31] and iOS devices (primary focus of this thesis), cases when
YouTube is accessed via the YouTube Android API (in which case QUIC was ob-
served as an underlying transport protocol) [32], cases when delivery is over a mobile
network, and cases involving various types of end user interactions (e.g., browsing
videos, seeking forward/backward, etc.) [14]. Moreover, the Recommendation ITU-T
P.1203 (formerly P.NATS) was published in Nov. 2016, which provides a standardized
model for calculating QoE for streamed media from application-level data [23]. In
[32], the model’s applicability was analysed in the scope of the YouQ methodology
and the inclusion of such a model in the YouQ system was considered.
Authors in [25] found that OTT service adaptation and traffic characteristics differ
between Android and iOS devices. Due to the fast evolution of video delivery tech-
4niques, the results of that study are now considered outdated. Thus, the goal of this
thesis is to mirror the YouQ system onto the iOS platform, improving necessary as-
pects of the system along the way. Based on a collected dataset comprised of network-
and application -level data of YouTube videos played on the iOS device, the YouTube
adaption algorithm is analyzed and results of the machine learning models that map
network-level data to QoE of the end user are shown and discussed in detail.
1.3. Thesis structure
The thesis is structured as follows. Chapter 2 describes the previously developed
YouQ system, expansion of its ecosystem with YouQ application developed for iOS
devices, and all encountered problems along with its solutions. The collected dataset
of YouTube videos played on the iOS device is described in Chapter 3, including fur-
ther the process of feature extraction, and the idea behind the QoE model used as a
ground truth in the machine learning process. Chapter 4 introduces the machine learn-
ing process, shortly describes each model used, and presents the results of models
trained and tested on the collected dataset. Furthermore, models are rebuilt and dis-
cussed for the class-balanced dataset. A summary of all results is given in Chapter 5
and the selection of the best machine learning model in the scope of this problem is
justified. Finally, Chapter 6 concludes the thesis.
This thesis is the result of the joint collaboration project QoMoVid (QoE Mon-
itoring Solutions for Mobile OTT Video Streaming) conducted between the Faculty
of Electrical Engineering and Computing (FER), University of Zagreb, and Ericsson
Nikola Tesla d.d.
52. Methodology
This chapter describes the previously developed YouQ ecosystem and the enhance-
ments made in the scope of this thesis. The main focus was to develop a system
that is able to play YouTube videos and monitor application-layer KPIs, capture net-
work traffic, and process collected data to provide input upon which machine learning
algorithms can be trained and evaluated. Components of the previously developed
YouQ system are briefly described in Section 2.1. The employed laboratory setup is
introduced in Section 2.2. The newly developed YouQ application for iOS devices is
described in Section 2.3. The YouQ iOS application is used to conduct extensive ex-
periments to characterize the behaviour of YouTube’s adaptation algorithm on the iOS
platform, collect the sufficiently large dataset, and subsequently build a machine learn-
ing model for QoE classification. Furthermore, problems encountered while running
experiments on the iOS platform are described in Section 2.4 along with the proposed
solution in Section 2.5.
2.1. YouQ system
The main idea of the YouQ system is to automate the process of conducting measure-
ments and developing machine learning-based models for estimating QoE based on the
analysis of YouTube’s encrypted network traffic [29]. Data is generated by monitor-
ing and analyzing application-layer KPIs on mobile client devices, and corresponding
traffic traces collected in the network, i.e., during playtime of YouTube videos.
The YouQ system consists of the YouQ Android application and the YouQ server.
The YouQ application (running on a smartphone) monitors application level data that
is used to calculate various QoE-related KPIs, such as initial delay, the number of
stalling events, stalling duration, the percentage of playback time spent on the certain
quality level, etc. The application enables the user (test administrator) to specify sev-
eral experiment parameters: number of videos to be played, duration of the videos, a
minimal number of times videos have been viewed, and minimal available playback
6quality of the videos. Video IDs are queried from the YouQ server’s database based on
the user-defined experiment parameters. The database is populated with over 2 million
YouTube video IDs and corresponding metadata describing each video clip. Returned
video IDs are organized into a playlist and played in the fullscreen landscape mode on
the mobile device (initially, Android device). During the experiment, the application
level data retrieved by using the YouTube IFrame API is collected and organized into
three log files: event, buffer, and URL. The content of log files is described in Table
2.1. Additionally, every record in the log files is timestamped and holds a reference to
the corresponding video.
Table 2.1: Description of application level data collected with the YouQ application.
Log Description
Event log Player state: “Cued”, “Buffering”, “Playing”, “Paused”, “Ended”;
Quality level switch: “tiny” (144p), “small” (240p), “medium” (360p),
“large” (480p), “hd720”, “hd1080”
Buffer log Amount of video buffered in every second of watch time
URL log URLs from all HTTP requests towards YouTube servers
While running experiments on an Android smartphone, the corresponding network
trace is captured and later filtered leaving only a subset of useful TCP fields, such as
epoch time, the length of the TCP packet, TCP flags, etc. In previous work [29], tests
were conducted in a laboratory network with a smartphone connecting to the Internet
via a WiFi connection. Further details on the lab setup (used previously and also in the
scope of this work) are given in the following section.
The YouQ server is comprised of the following components:
• a database server used for video ID querying,
• an application for populating the database with YouTube video IDs and corre-
sponding metadata,
• an FTP server for collected data storage and processing,
• scripts for collected data processing,
• YouQ Web application for displaying experiment results, and
• an application for extracting network traffic features.
At the end of the experiment and based on the user’s action, the application discards
or transfers log files to the FTP server for further processing. The user is responsible
7for transferring the captured network traffic to the FTP server alongside the corre-
sponding log files. Data processing scripts produce two files for each video played in
the experiment. Firstly, application-layer data collected with the YouQ applications is
summarized to a JSON file with the following information: total experiment duration,
accumulated duration of videos, duration of the initial delay, information about stalling
events, overhead time, and information about the time spent at each quality level. Sec-
ondly, filtered network-level data of the video is extracted from captured network trace
based on timestamps in log files.
Generated files are then used by the application that extracts relevant traffic features
from network-level data and labels it with a QoE class based on the application-level
KPIs from the JSON file. Traffic features are further described in Section 3.2, and the
QoE model used for determination of video’s QoE class is described in Section 3.1.
2.2. Laboratory setup
The laboratory testbed used for conducting experiments is depicted in Figure 2.1.
Figure 2.1: Laboratory setup for testing on the iOS platform.
YouTube traffic between the client device (initially Android, and later iOS device)
and YouTube content servers is transmitted over an IEEE 802.11n wireless network
and then routed through a PC running IMUNES, a general purpose IP network emula-
tion/simulation tool enabling a test administrator to set up different bandwidth lim-
8itations and schedule bandwidth changes. Traffic is further sent through Albedo’s
Net.Shark device where it is replicated and sent to a PC designated for network traf-
fic capturing. The PC running IMUNES also has an OS layer, accessed by the YouQ
client application to run a bandwidth scheduling script according to defined experi-
ments. The router runs on 2.4 Ghz frequency with more than 20 Mbit downlink. A
more detailed description of laboratory components is described below.
iOS device
To conduct experiments, an iPhone 6s running iOS 10 operating system was used. It
has 4.7-inch (diagonal) widescreen display and 1334-by-750-pixel resolution at 326
ppi. A list of supported video formats is as follows: H.264 video up to 4K, 30 frames
per second, High Profile level 4.2 with AAC-LC audio up to 160 Kbps, 48kHz, stereo
audio or Dolby Audio up to 1008 Kbps, 48kHz, stereo or multichannel audio, in .m4v,
.mp4, and .mov file formats; MPEG-4 video up to 2.5 Mbps, 640 by 480 pixels, 30
frames per second, Simple Profile with AAC-LC audio up to 160 Kbps per channel,
48kHz, stereo audio or Dolby Audio up to 1008 Kbps, 48kHz, stereo or multichannel
audio, in .m4v, .mp4, and .mov file formats; Motion JPEG (M-JPEG) up to 35 Mbps,
1280 by 720 pixels, 30 frames per second, audio in ulaw, PCM stereo audio in .avi file
format.
IMUNES
The Integrated Multiprotocol Network Emulator/Simulator (IMUNES) 1 is a fast, func-
tional network simulator that runs on the FreeBSD operating system. It was created by
a team of researchers and educators at the University of Zagreb. In this project it was
used to setup static or dynamic bandwidth envelopes.
Net.Shark
Net.Shark2 is a device used for aggregating and mirroring network traffic. In this
network architecture it is placed between the PC with the IMUNES application and
the router. All network traffic that passes through this network segment is aggregated
and replicated to the PC designated for network traffic capturing.
1
http://imunes.net
2
http://www.albedotelecom.com/pages/fieldtools/src/netshark.php
9Wireshark
Wireshark 3 is a popular network-capturing tool and packet analyzer. It is used for net-
work troubleshooting, analysis, software and communications protocol development,
and education. In this project it was used to analyse the traffic and find out which
protocols are used for the transmission of packets in case of YouTube browser and
application.
2.3. YouQ application on iOS platform
The YouTube API [10] offers developers the ability to add YouTube functionality to
sites and apps. The YouQ application on Android uses the IFrame API in order to em-
bed a YouTube video player in the application and control the player using JavaScript.
Another version of the YouQ application uses the YouTube Android Player API in or-
der to embed the native player. Since previous research has shown that behaviour of
YouTube varies across different platforms, there is a need to develop an iOS version of
the YouQ application. The YouTube player can be embedded into the iOS application
solely by using the IFrame API, similar to the first version of the YouQ application on
Android device.
The youtube-ios-player-helper 4 is an open source library provided by
YouTube developers that helps embed the YouTube IFrame player into the iOS appli-
5
cation. The library creates a UIWebView and a bridge between the application’s
Objective-C/Swift code and the YouTube player’s JavaScript code, thereby allowing
the iOS application to control the YouTube player. YouQ iOS application is developed
using youtube-ios-player-helper, Xcode [40] version 8.3, and Apple Swift
version 3.1 [36].
The functionality of the YouQ iOS application is to conduct automated experiments
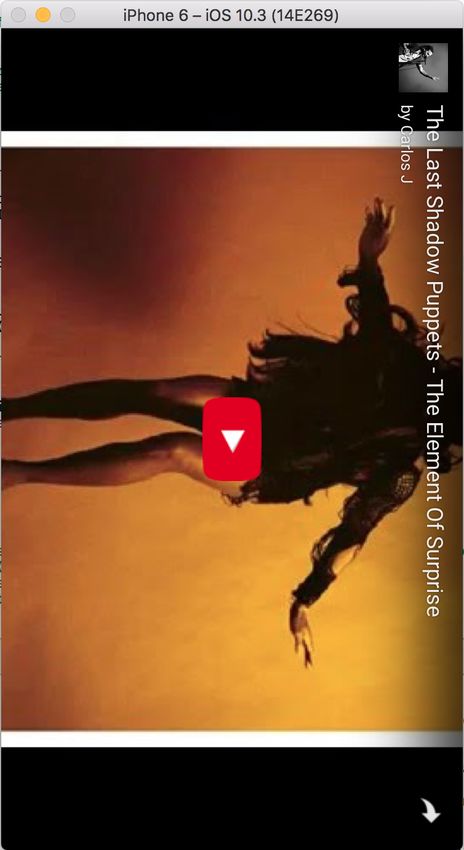
by playing various YouTube videos defined by user’s parameters. Screen layouts of the
YouQ application are shown in Figure 2.2. After the application is launched, the user
must specify experiment parameters. The only mandatory parameter is the number of
videos to be played in the experiment. Optionally, the user can specify the duration
of the videos to be played, minimal number of views and the available video quality.
Once the “Start” button is pressed, the YouTube video player is shown in landscape
3
https://www.wireshark.org/
4
https://developers.google.com/youtube/v3/guides/ios_youtube_
helper
5
https://developer.apple.com/documentation/uikit/uiwebview
10mode. The user starts the experiment by pressing the “Play” button as part of the
YouTube player. At the end of the experiment, i.e., when all videos are done playing,
the summary of the experiment is shown along with two buttons enabling the user to
upload the results to the server or discard them altogether.
After the experiment has ended, the actions outlined in the previous section are
executed. The YouQ application on the iOS platform performs the same actions as the
YouQ application on the Android platform, using the YouQ server as-is, with some
improvements described later in the work. Therefore, the main functionalities that
needed to be implemented as part of the iOS application are listed below:
• fetching YouTube video identifiers from the YouQ database using the REST
service,
• logging application-level KPIs during the experiment organised in three log
files: event, buffer, and url,
• connecting the application to the FTP server for experiment results upload.
Once the experiments were started, irregularities in YouTube’s video delivery be-
haviour were observed. During the experiments, we observed that YouTube forced a
fixed video quality level in all bandwidth scenarios. Hence, no adaptation in the video
delivery was observed while running the experiments with the newly developed iOS
application. This behavior is described in greater detail in Section 2.4.
2.4. Behaviour of the YouTube service in YouQ imple-
mentation for iOS - problems and explanations
As introduced in Section 1.1, adaptive bitrate streaming has become the primary video
delivery paradigm. The adaptive change of video bitrate/resolution can significantly
improve the end user experience by avoiding interruptions in playback when client’s
network conditions cannot support the currently played quality level of the video. Main
protocols for this type of delivery are HLS and MPEG-DASH [3]. Each protocol uses
different methods and formats. Hence a device must support each protocol to receive
the content from each server.
HLS is a technology introduced and maintained by Apple. It mainly targets mobile
devices based on iOS such as iPhone, iPad or AppleTV, as well as at OS X desktop
computers. When the video is encoded to HLS, multiple files are created for different
bandwidths and different resolutions. The files are encoded using the MPEG-2 Trans-
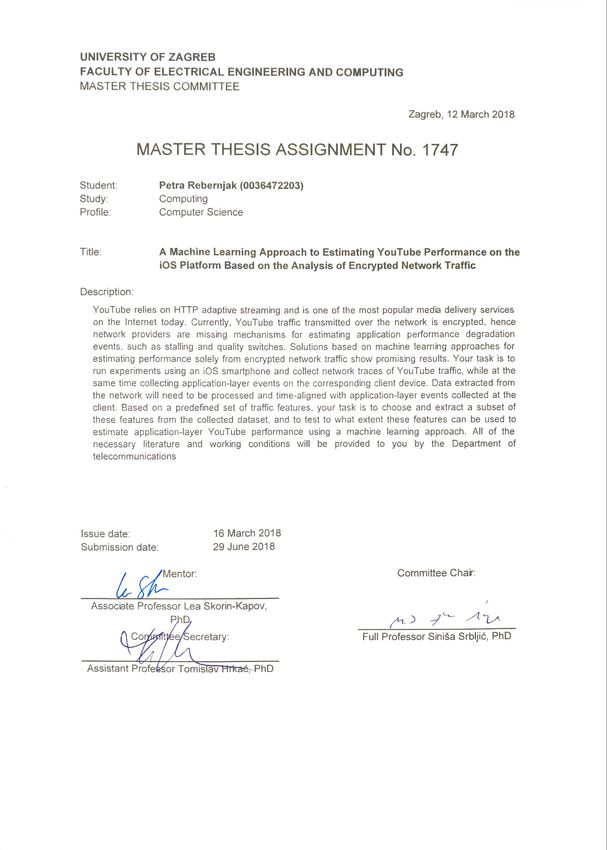
11(a) Launch screen of the YouQ (b) Main screen of the YouQ app
app for iOS platform. that enables the definition of ex-
periment parameters.
(c) YouTube player in landscape (d) Screen showing the experi-
mode. ment summary.
Figure 2.2: Screen layouts of the YouQ application developed for iOS devices.
12port Stream codec. The streams are mapped to the client in real time using a .M3u8
index file based on screen size and available bandwidth [4].
MPEG-DASH has an advantage of being a company independent, open and inter-
national standard, which has broad support from the industry. The multimedia content
is fragmented and stored on the server in the form of chunks and encoded at different
bitrates. The corresponding Media Presentation Description (MPD) describes chunk
information (timing, available bitrates, URL addresses, etc.) [6]. Unlike HLS, MPEG-
DASH is codec-independent.
YouTube uses MPEG-DASH in HTML5 as their core streaming technology [9].
However, MPEG-DASH playback was not supported on the iOS devices until re-
cently, although Apple still forces content providers to use HLS on iOS devices. In
more detail, to enable playback on iOS devices, the content needs to be multiplexed
into MPEG-2 Transport Stream, which is required by HLS. In contrast, to allow native
HTML5 playback with MPEG-DASH, the content needs to be multiplexed into the
fragmented MP4 format, or fMP4. This made HLS MPEG-DASH incompatible until
WWDC16 where Apple announced the inclusion of byte-range addressing for frag-
mented MP4 files, allowing content to be played in HLS without the need to multiplex
it into the traditional MPEG-2 Transport Stream [8].
Still, when running experiments on different bandwidth levels using the developed
YouQ application for iOS devices, we observed that the YouTube client algorithm
does not invoke quality adaptation. For example, we limited bandwidth to 0.25 Mbps
before or in the middle of the experiment to observe if the player degrades the quality
of the playback to avoid stalling. However, both at the beginning and in the middle
of the experiment, the playback stalls until the buffer is sufficiently filled with the
default quality level, thus indicating a progressive download type of transmission. It
was further observed that the default quality level depends on the player’s parameter
playsinline. If the parameter is not set (videos play fullscreen in an HTML5
player on iOS), the default playback quality level is “medium”. Otherwise, if the
parameter is set (videos play inline in an HTML5 player on iOS), the default playback
quality level is “hd720”. Although the interpretation of this behavior is unclear, it is
assumed that the player’s default playback quality level is dependent on the screen
size. Moreover, it is important to note that at the time of measurements, YouTube used
TCP/TLS as a transport protocol.
In order to isolate the problem from all external factors, such as using
the youtube-ios-player-helper library, or using UIWebView rather than
13WKWebView 6 , another simple iOS application was implemented. This iOS appli-
cation plays hardcoded YouTube videos using manually embedded YouTube IFrame
player into the UIWebView. Please note that youtube-ios-player-helper
was not used in the development of this application. In order to monitor the player’s
state and quality switches, a bridge between Javascript and UIWebView is created,
thus enabling UIWebView to access Javascript’s console.log() output. This
process was repeated for WKWebView. However, the same outcome was observed
when running experiments on different bandwidth levels using both versions of the
newly developed iOS application. To conclude, youtube-ios-player-helper
and UIView are not causing the above mentioned problem.
This leaves the problem related to lack of support for adaptive streaming to the
YouTube IFrame player. The YouTube IFrame player is considerably outdated, hence
it is possible that the newly announced compatibility between HLS and MPEG-DASH
does not apply here. Finally, we conclude that at the time of this writing, it is
not possible to analyse YouTube’s adaptation algorithm on iOS devices by using the
YouTube IFrame player. Section 2.5 describes an alternate approach in the collection
of YouTube videos played on the iOS device.
2.5. Adjusted measurement methodology on iOS plat-
form
Due to the encountered problems described in Section 2.4, other approaches need to be
explored to analyze the YouTube’s behaviour on the iOS platform. Obviously, IFrame
API, as a core part of the newly developed YouQ iOS application, cannot be used to
conduct experiments and analyze the YouTube’s behaviour.
The latest feature YouTube introduced is “Stats for Nerds” which enables users to
see information about content currently being played. Available information is video
ID, playback state, CDN, audio and video iTag and format, video quality level, dimen-
sions, the buffer state, available bandwidth, and frame drop. Basically, application-
level KPIs monitored via IFrame API are covered within “Stats for Nerds”. Moreover,
this option uncovers YouTube’s actual behaviour. Figure 2.3 shows YouTube player’s
screen with “Stats for Nerds” option enabled.
6
https://developer.apple.com/documentation/webkit/wkwebview
14Figure 2.3: “Stats for Nerds” data when that option is enabled in YouTube player.
Since “Stats for Nerds” can be copied to the clipboard with a simple click, the idea
was to run a background task that does that periodically while the native YouTube ap-
plication is playing on the iOS device. However, this approach is again at the time not
possible on the iOS platform. Due to the privacy constraints, the application running
in the background cannot access the main screen of the active application. In other
words, it is not possible to automatically log application-layer data using the “Stats for
Nerds” option enabled in the native YouTube application on the iOS device.
A few more approaches were tried and failed due to the high restriction of the iOS
platform. Still, to fulfil the goal of this thesis, a dataset of YouTube videos needs to be
collected. Although it is not completely in compliance with the YouQ system, a man-
ual monitoring, logging, and upload of application-level data provided with “Stats for
Nerds” option enabled is necessary to analyse YouTube’s adaptive algorithm behaviour
on the iOS platform.
The modified laboratory setup, shown in Figure 2.4, introduces yet another PC
connected to the iOS device intended to record the experiments played on the iOS de-
vice. Once the experiment is over, a movie of the experiment is processed by manually
logging changes that occurred in the player, based on the “Stats for Nerds” data. For
each event, a timestamp is calculated relative to the experiment start time by adding
the movie playback time. Consequently, an event log file similar to the one generated
by the YouQ applications is created and ready to use by the rest of the YouQ system.
However, a user should manually upload that log file to YouQ server.
15Figure 2.4: Modified laboratory setup for testing on the iOS platform.
Although such a manual approach in data collection has a lot of disadvantages, at
the time of this writing this was concluded to be the best available option for obtaining
the required dataset. Because of the lack of automation, which makes it extremely
time-consuming to record and manually process the experiments, the size of the col-
lected data is relatively small. Moreover, manually created log files are prone to human
imprecision and errors, mostly regarding the relative time. Both movie recording and
“Stats for Nerds” display the time in seconds, impairing the precision in relative time.
However, monitoring of the application-level data directly from the native YouTube
application by using the information provided through the “Stats for Nerds” option re-
flects the ground truth data regarding the YouTube adaptation algorithm behaviour on
both network and application level.
Figure 2.5 depicts the detailed actions a user should make when collecting the data
on the iOS platform.
16Figure 2.5: Actions required to record the experiment on the iOS platform. 17
3. Collected YouTube dataset

Based on the application and network-level data collected for each video, videos are
prepared as an input to the machine learning model. Section 3.1 justifies how the true
QoE class is calculated based on the application-level data. Network features needed
for prediction of QoE class and their calculation is described in Section 3.2. A list of
the network features is expanded and explained in Section 3.3. Finally, the collected
dataset and its characteristics are described in Section 3.4.

3.1.     Ground truth
A widely accepted definition of QoE defines it as being "the degree of delight or an-
noyance of the user of an application or service. It results from the fulfillment of his
or her expectations with respect to the utility and/or enjoyment of the application or
service in the light of the user’s personality and current state. In the context of com-
munication services, QoE is influenced by service, content, device, application, and
context of use" [24].
   Previous studies have shown that key influence factors on the QoE for HTTP adap-
tive streaming are information about stalling events, overhead time and time spent on
each quality level [35, 16, 22]. Information necessary for building a QoE model for
the YouQ system is collected on the application-level.
   The proposed model that is used in the scope of this thesis is extensively described
in [28]. Based on collected application-level data (i.e. video duration, experiment
duration, initial delay, stalling statistics, overhead time, percentage of duration spent
on each quality level) videos are labeled with “high”, “medium" or“low" level of QoE.
An instance of a video streaming session is evaluated by two functions to check if
it belongs to the “high” or “low” QoE class. If it belongs to neither, it is classified
as the “medium” QoE class. When at least 90% of video was played in qualities
“large” or better, and there was no stalling events or there was one stalling event shorter
than 3s, video is labeled as “high”. “Low” quality is checked based on percentage of

                                                                                        18
playback spent on low quality (“small” and lower), stalling events count, overhead
ratio (overhead time and duration ratio) and average stalling duration. The label of
each video is used as a ground truth in the machine learning models.
The used QoE model was built prior to the newly published ITU-T standard for
estimating QoE of adaptive streaming [23, 33]. Incorporating the standard into the
YouQ system would be a significant improvement of the system and is the objective of
future work.
3.2. Network feature extraction
The authors in [27] reviewed many significant works that rely on the use of statistical
traffic characteristics for IP traffic classification. Based on the wide list of network
characteristics, captured network traces are filtered to contain only a relevant subset of
network fields using the tshark command. The statistics for the following fields are
calculated for creation of network traffic features:
• packet length
• size of transferred data
• packet count
• interarrival time
• throughput
• TCP flags
A list of all calculated network features, defined in [29], can be found in Table 3.1.
Table 3.1: Network traffic features used in the prediction of the QoE class.
Feature name Description
packetSize Total size of transferred data during the
transmission of a given video [bytes]
averagePacketSize Average packet size during the transmis-
sion of a given video [bytes]
minPacketSize Minimal packet size (> 0) [bytes]
maxPacketSize Maximal packet size [bytes]
packetCount Number of packets during the transmis-
sion of a given video
19Table 3.1 Network traffic features used in the prediction of the QoE class (continued).
Feature name Description
averageNumOfPacketsThroughTime Average number of packets per 5s inter-
val
minimalNumOfPacketsThroughTime Minimal number of packets (> 0) per 5s
interval
maximalNumOfPacketsThroughTime Minimal number of packets per 5s inter-
val
packetsThroughTimeMedian Median of number of packets per 5s in-
terval
packetsThroughTimeVariance Variance of number of packets per 5s in-
terval
packetsThroughTimeStdDev Standard deviation of number of packets
per 5s interval
averageSizeThroughTime Average size of transferred data per 5s
interval [bytes]
minimalSizeThroughTime Minimal size of transferred data (> 0) per
5s interval [bytes]
maximalSizeThroughTime Maximal size of transferred data per 5s
interval [bytes]
sizeThroughTimeMedian Median of size of transferred data per 5s
interval [bytes]
sizeThroughTimeVariance Variance of size of transferred data per
5s interval [bytes]
sizeThroughTimeStdDev Standard deviation of size of transferred
data per 5s interval [bytes]
averageInterarrivalTime Average interarrival time between pack-
ets during the transmission of a given
video [s]
minimalInterarrivalTime Minimal interarrival time between pack-
ets (> 0) during the transmission of a
given video [s]
maximalInterarrivalTime Maximal interarrival time between pack-
ets during the transmission of a given
video [s]
averageInterarrivalTimeThroughTime Average interarrival time per 5s interval
[s]
20Table 3.1 Network traffic features used in the prediction of the QoE class (continued).
Feature name Description
minimalInterarrivalTimeThroughTime Minimal interarrival time (> 0) per 5s in-
terval [s]
maximalInterarrivalTimeThroughTime Maximal interarrival time per 5s interval
[s]
interarrivalTimeThroughTimeMedian Median of interarrival time per 5s inter-
val [s]
interarrivalTimeThroughTimeVariance Variance of interarrival time per 5s inter-
val [s]
interarrivalTimeThroughTimeStdDev Standard deviation of interarrival time
per 5s interval [s]
averageThroughput Average throughput during the transmis-
sion of a given video [Mbps]
effectiveThroughput Average of average throughput values
calculated per 5s intervals, including
only those intervals where throughput
per interval was higher than 0.7 Mbps
[Mbps]
minThroughputThroughTime Minimal throughput per 5s interval
[Mbps]
maxThroughputThroughTime Maximal throughput per 5s interval
[Mbps]
throughputMedian Median of throughput per 5s interval
[Mbps]
throughputVariance Variance of throughput per 5s interval
[Mbps]
throughputStdDev Standard deviation of throughput per 5s
interval [Mbps]
initialThroughput2 Throughput in first 2 seconds [Mbps]
initialThroughput3 Throughput in first 3 seconds [Mbps]
initialThroughput5 Throughput in first 5 seconds [Mbps]
initialThroughput10 Throughput in first 10 seconds [Mbps]
dupack Number of duplicate acknowledgements
retransmission Number of retransmissions
ackLostSegment Number of packets that acknowledge
lost segment
21Table 3.1 Network traffic features used in the prediction of the QoE class (continued).
Feature name Description
push Number of packets with TCP flag push
set
reset Number of packets with TCP flag reset
set
dupackOverAll Ratio of duplicate acknowledgements
retransmissionOverAll Retransmission ratio
ackLostSegmentOverAll Ratio of packets that acknowledge lost
segment
pushOverAll Ratio of packets with TCP flag push set
resetOverAll Ratio of packets with TCP flag reset set
numberOfServers Number of contacted servers
numberOfFlows Number of TCP flows established
3.3. Improvements in feature extraction
To improve the YouQ methodology by incorporating new knowledge about YouTube’s
delivery mechanisms, YouTube’s behaviour is further examined. YouTube video
chunks are analysed and inclusion of new network traffic features based on chunk
sizes is considered.
YouTube uses DASH to deliver video content more efficiently. According to the
DASH standard, videos are split on the server into multiple chunks, each one corre-
sponding to a few seconds of playback time. The client application first obtains the
MPD (Media Presentation Description) file, which describes the manifest of the avail-
able content, its alternatives, locations and other characteristics. Upon receiving that
file, the client learns about content availability, media types, resolutions, bandwidth
requirements, etc. After that, instead of requesting the entire video, the client sends
HTTP requests to fetch next media chunks. The client measures network conditions
based on the last received chunk, and requests the next chunk in a certain quality level
according to measured conditions.
Recently published studies addressing a machine-learning based approach to
YouTube KPI estimation from encrypted traffic have recognized that video chunk size
22(inferred from TCP sequence or acknowledgement numbers) is a key predictive feature
[30, 18]. The aim is thus to incorporate the extraction of this information in the YouQ
system and use it to enhance existing ML models. Ideally, chunk-size-based features
can make the model more expressive in terms of stalling and quality switch detection,
thus further improving the ML models.
Figure 3.1 shows chunk sizes parsed from the application level compared to the
chunk sizes parsed from the network level. Application level chunks are obtained
from the url log file which stores all HTTP requests from the YouTube player towards
YouTube servers. It should be noted that this analysis is performed on the Android
client because a url log file cannot be generated for the iOS platform. As stated, the
player sends one HTTP request for each media chunk. The request contains the range
information from which the chunk size is immediately deducted. On the other hand,
as stated in [30], a video chunk can be recognised from the network trace solely by
following the stream of packets with the same client’s SEQ number or same server’s
ACK number. Each time a client requests a new chunk, its SEQ number increases due
to the fact that the request is sent in the TCP payload. That is the only event that in-
creases the client’s SEQ number. The client’s ACK numbers between two consecutive
requests carries the information about the chunk size that is just sent.
The size of the requested chunks on the application level is depicted in light grey
color. Black color bars refer to requested chunks parsed from the network trace.
Medium grey color denotes that the chunks from both levels overlap. It can be ob-
served that network level chunks fit almost perfectly with the application level chunks.
Therefore, it is shown that approach described in [30], stating that video chunks can be
easily detected solely from the network trace, is indeed valid. However, some network-
level chunks don’t have its corresponding application-level chunks, and reverse. The
cause of such situation is yet unclear. It is possible that such mismatches are caused
by the derivation of network-level chunk sizes from the client side, rather than looking
at what truly arrived from the media server. As part of the future work, network-level
chunk sizes can be derived from server’s ACK number and compared to the existing
implementation.
Figure 3.2 shows network level chunk sizes and quality switches parsed from the
event file. Quality switches are drawn as they occurred in the player. Chunks are drawn
as they were requested by the player (and cued in the buffer rather than immediately
played). That being said, chunks that correspond to different quality than the one the
video is currently played at, are requested prior to the drawn quality switch event.
Several quality switches occurred in this video session. It can be observed that right
23Figure 3.1: Comparison of chunk sizes between application and network level data. The medium grey depicts cases when the application and network
chunk sizes overlap. For the purpose of this figure, ten YouTube videos contained in the playlist were played in the experiment.
24before each quality switch (regardless of whether it relates to an increase or decrease
in quality level), the chunk size decreases in order to fill the player’s buffer with new
quality material as soon as possible. Multiple experiments playing one YouTube video
in different variable bandwidth scenarios were conducted to verify this observation.
The result of each experiment was similar to the one depicted in Figure 3.2. Therefore,
as [30] and [18] state, chunk size can be a significant feature in detection of quality
switches, thus making the machine learning model more expressive and accurate.
Thus, chunk-related network features are added to the existing list of features (refer
to Table 3.1) and described in Table 3.2. Please note that the extraction of these features
is applicable in the context of TLS traffic, but not in the case of YouTube delivery over
the QUIC protocol.
Table 3.2: Expansion of network traffic features used in the prediction of the QoE class.
Feature name Description
averageChunkSize Average chunk size during the transmis-
sion of a given video [bytes]
minimalChunkSize Minimal chunk size (> 0) during the
transmission of a given video [bytes]
maximalChunkSize Maximal chunk size during the transmis-
sion of a given video [bytes]
chunkSizeStdDev Standard deviation of chunk size during
the transmission of a given video [bytes]
averageTimeBetweenChunks Average time between chunks during the
transmission of a given video [s]
minimalTimeBetweenChunks Minimal time between chunks (> 0) dur-
ing the transmission of a given video [s]
maximalTimeBetweenChunks Maximal time between chunks during
the transmission of a given video [s]
timeBetweenChunksStdDev Standard deviation of time between
chunks during the transmission of a
given video [s]
25Figure 3.2: Chunk sizes relative to quality switches in time, parsed from the network level. For the purpose of this figure, one YouTube video was played
in variable bandwidth scenario.
263.4. Collected dataset
All measurements were conducted in a WiFi network in June 2017. Native YouTube
application on iOS device used TCP/TLS protocol for transport.
Videos played in all conducted experiments are shown in Table 3.3. All selected
videos are available in each resolution from 144p to 1080p, are approximately 3 min-
utes long, and vary in popularity and type. For each experiment, videos were contained
in the playlist in order defined in Table 3.3.
Table 3.3: Videos played in experiments.
No. of video Video ID Description Duration [s]
1 cbqMPj69r7I Sports 173
2 hr_dwM-hLXY Sports 174
3 Wrc1c8g2FPk Music video 175
4 XmPTyrHwYhE Gaming 186
5 4bX7j-cUOhA Science & Technology 176
6 v1ipm0vEY6A Sports 176
7 taA9fsCEU3s Auto & vehicles 171
8 lAAgk-ZXBDo Music video 176
9 smMd-TkPkHs Music video 186
10 zxiqncOkZ7M Tutorial 187
Authors in [34] study the impact of different bandwidth fluctuation patterns on Web
QoE and state that the QoE in networking scenarios depends not only on high speed
and low latency connections, but also on the stability and variability of the available
bandwidth. Bandwidth fluctuation patterns evaluated in the study considered a pro-
gressive outage/disconnection and a subsequent recovery, a fast bandwidth changing
environment, and a high/low bandwidth profile with fast short-scale variations.
Thus, a list of different bandwidth envelopes used in experiments is depicted in
3.4. Experiment scenarios 1-25 were conducted with static bandwidth availability to
analyze the bandwidth levels on which YouTube forces certain quality levels. Exper-
iment scenarios 26-33 were run using bandwidth fluctuations, where each bandwidth
scenario was circularly repeated. For example, bandwidth envelope for experiment
26 is defined as follows: bandwidth availability starts at 1Mbps, and then changes to
5Mbps after 60s. After another 60s, the bandwidth availability is set back to 1Mbps
and so on. This loop is run during the whole duration of the video playlist.
27Table 3.4: Experiment scenarios.
No. of experiment Scenario [Mbps]
1 0.25
2 0.5
3 0.75
4 1
5 1.25
6 1.5
7 1.75
8 2
9 2.25
10 2.5
11 2.75
12 3
13 3.25
14 3.5
15 3.75
16 4
17 4.25
18 4.5
19 4.75
20 5
21 5.25
22 5.5
23 5.75
24 6
25 unlimited
60s
26 1 !5
120s
27 1 !5
60s
28 0.5 ! 3
120s
29 0.5 !3
45s
30 0.85 ! 0.75
60s 120s
31 0.5 ! 1 !3
60s 120s
32 3 !1 ! 0.5
28Table 3.4 Experiment scenarios (continued).
No. of experiment Scenario [Mbps]
60s 120s
33 0.5 ! 10 ! 0.5
Figure 3.3 shows the effect of bandwidth availability on quality level, i.e., at what
bandwidth levels the YouTube adaptation algorithm forces certain quality levels. The
percentage of duration spent on each quality level is calculated for every static band-
width scenario. With 25 static bandwidth scenarios and 10 videos played for each
scenario, these results are based on the analysis of 250 videos. It can be observed that
video quality level is strongly dependent on the available bandwidth. An interesting
observation based on our measurements was that the client on the iOS platform never
requested a quality level greater than 720p, despite the fact that videos were offered in
1080p resolution. This may be due to the fact that the videos were played on a mo-
bile device and YouTube assumes that quality level hd720p is good enough to achieve
satisfactory QoE on a small screen. iOS devices with bigger screen (e.g., iPad) would
probably request videos in greater quality level than 720p.
Figure 3.3: Effect of bandwidth on played quality level.
Figure 3.4a shows the number of videos that at some point played at certain quality
level, while Figure 3.4b shows the distribution of percentage of video duration played
at a certain quality level. With 33 bandwidth scenarios and 10 videos played for each
scenario, these results are based on the analysis of 330 videos. It can be observed
that most of the videos were played in 720p quality level, while more than 95% of the
videos never played in 144p quality.
29(a) Number of videos that played in certain quality (b) CDF of quality levels.
level.
Figure 3.4: Quality level statistics.
Figure 3.6 show insights about stalling statistics that occur in experiments. Figure
3.5 depicts the number of stalling events that occurred in each experiment. It is in-
teresting to note that most stalling events occurred on the bandwidth level on which
YouTube adaption algorithm starts forcing higher quality level (refer to Figure 3.3).
Moreover, most stalling events occur when the bandwidth envelope is defined dynam-
ically, specifically when switching to higher quality level. When switching to higher
quality level, YouTube presumably discards all of the video content buffered in a lower
quality, and starts downloading and playing the higher quality immediately. Figures
3.6a and 3.6b depict that in 85% of videos stalling events never occurred. When stalling
event did occur, 90% of the them lasted for 6s or less.
Figure 3.5: Number of stalling events per experiment.
Overhead time, defined as accumulated initial delay and buffering time, is shown
in Figure 3.7. Overhead time was shorter than 10s in 85% of the cases.
The percentage of instances labelled with each of the defined QoE classes per ex-
30(a) Number of videos per certain stalling event (b) CDF of number of stallings.
count.
Figure 3.6: Stalling statistics.
periment is shown in Figure 3.8. As expected based on the aforementioned statistics,
199 videos were labeled as “high”, 71 videos were labeled as “medium”, and 59 videos
were labeled as “low”.
Figures 3.9-3.11 present some interesting visuals about the relationship between
network traffic features and QoE class. Specifically, Figure 3.9 shows obvious dif-
ferences in distribution of the interarrivalTimeThroughTimeMedian per QoE class.
The interarrivalTimeThroughTimeMedian feature for the class “high” is concentrated
around very small values, contrary to the overlapping values for classes “low” and
“medium”. The cumulative distribution of the averageInterarrivalTimeThroughTime
feature between different classes is widely different. For example, 90% of the values
are less than 0.010s for the class “high”, less than 0.015s for the class “medium”, and
less than 0.025s for the class “low”.
When some features are plotted in 2D space, an interesting insight into the class
distribution can be shown. It is clear in Figure 3.11 that effectiveThroughput and min-
imalInterarrivalTimeThroughTime features can somewhat separate the classes. When
adding more dimensions into the feature space, i.e., combining more network traffic
features, higher distinction between classes is expected.
31Figure 3.7: Overhead time statistics.
Figure 3.8: Percentage of instances in each class, per experiment.
32Figure 3.9: Distribution of inter-arrival time Figure 3.10: CDF of interarival time through
through time. time.
Figure 3.11: 2D visualisation of the correlation between effective throughput and minimal
packet interarrival time.
334. Development of QoE estimation
models based on machine learning
Machine learning is an approach of learning by the example. Dataset prepared as
described in previous chapters is an input to the machine learning models. Machine
learning approach is used for user-perceived QoE prediction solely based on the net-
work level data, i.e., network traffic features. Section 4.1 introduces the machine learn-
ing terms relevant for this thesis. The process itself is described in Section 4.2 with a
big emphasis on the mistake people often do, hence jeopardizing the presented results.
Performance of each trained model is debated in Sections 4.3 and 4.4.
4.1. Overview
Machine learning is programming computers to optimize a performance criterion using
example data or past experience [12]. Machine learning tasks can be divided into
two major categories: supervised and unsupervised learning. The difference is in the
existence of the known label in input instances. Every input instance is labelled with
the true value in the supervised problems. Thus, the task is to optimize the training
error defined as the average number/value of wrongly predicted instances. Input of the
unsupervised problems is not labelled. Oftentimes, instances are clustered based on
the defined similarity measure.
Since network-level data is labelled with QoE class calculated from the application
level, the problem dealt within this thesis is of supervised nature. Moreover, it is a
classification task since the label is discrete, rather than continuous in which case we
are referring to regression.
A vast number of machine learning models were invented in last decades. No
ultimate model exists that can be applied to any kind of problem. Based on the appli-
cation, one model can have a better performance than the other. Thus, it is necessary
to understand the problem and its scope before trying different models.
34You can also read