Investor Presentation - Third Quarter 2018 - Scotiabank Global Site
←
→
Page content transcription
If your browser does not render page correctly, please read the page content below

Investor Presentation
Third Quarter 2018

CAUTION REGARDING FORWARD-LOOKING STATEMENTS
Our public communications often include oral or written forward-looking statements. Our         increasing cyber security risks which may include theft of assets, unauthorized access to
public communications often include oral or written forward-looking statements.                 sensitive information or operational disruption; anti-money laundering; consolidation in
Statements of this type are included in this document, and may be included in other             the financial services sector in Canada and globally; competition, both from new entrants
filings with Canadian securities regulators or the U.S. Securities and Exchange                 and established competitors; judicial and regulatory proceedings; natural disasters,
Commission, or in other communications. All such statements are made pursuant to the            including, but not limited to, earthquakes and hurricanes, and disruptions to public
“safe harbor” provisions of the U.S. Private Securities Litigation Reform Act of 1995 and       infrastructure, such as transportation, communication, power or water supply; the
any applicable Canadian securities legislation. Forward-looking statements may include,         possible impact of international conflicts and other developments, including terrorist
but are not limited to, statements made in this document, the Management’s Discussion           activities and war; the effects of disease or illness on local, national or international
and Analysis in the Bank’s 2017 Annual Report under the headings “Outlook” and in               economies; and the Bank’s anticipation of and success in managing the risks implied by
other statements regarding the Bank’s objectives, strategies to achieve those objectives,       the foregoing. A substantial amount of the Bank’s business involves making loans or
the regulatory environment in which the Bank operates, anticipated financial results            otherwise committing resources to specific companies, industries or countries.
(including those in the area of risk management), and the outlook for the Bank’s                Unforeseen events affecting such borrowers, industries or countries could have a
businesses and for the Canadian, U.S. and global economies. Such statements are                 material adverse effect on the Bank’s financial results, businesses, financial condition or
typically identified by words or phrases such as “believe,” “expect,” “anticipate,” “intent,”   liquidity. These and other factors may cause the Bank’s actual performance to differ
“estimate,” “plan,” “may increase,” “may fluctuate,” and similar expressions of future or       materially from that contemplated by forward-looking statements. For more information,
conditional verbs, such as “will,” “may,” “should,” “would” and “could.”                        see the “Risk Management” section of the Bank’s 2017 Annual Report.
By their very nature, forward-looking statements involve numerous assumptions,                  Material economic assumptions underlying the forward-looking statements contained in
inherent risks and uncertainties, both general and specific, and the risk that predictions      this document are set out in the 2017 Annual Report under the headings “Outlook”, as
and other forward looking statements will not prove to be accurate. Do not unduly rely on       updated by quarterly reports. The “Outlook” sections are based on the Bank’s views and
forward-looking statements, as a number of important factors, many of which are                 the actual outcome is uncertain. Readers should consider the above-noted factors when
beyond the Bank’s control and the effects of which can be difficult to predict, could           reviewing these sections. The preceding list of factors is not exhaustive of all possible
cause actual results to differ materially from the estimates and intentions expressed in        risk factors and other factors could also adversely affect the Bank’s results. When
such forward-looking statements. These factors include, but are not limited to: the             relying on forward-looking statements to make decisions with respect to the Bank and its
economic and financial conditions in Canada and globally; fluctuations in interest rates        securities, investors and others should carefully consider the preceding factors, other
and currency values; liquidity and funding; significant market volatility and interruptions;    uncertainties and potential events. The forward-looking statements contained in this
the failure of third parties to comply with their obligations to the Bank and its affiliates;   document are presented for the purpose of assisting the holders of the Bank’s securities
changes in monetary policy; legislative and regulatory developments in Canada and               and financial analysts in understanding the Bank’s financial position and results of
elsewhere, including changes to, and interpretations of tax laws and risk-based capital         operations as at and for the periods ended on the dates presented, as well as the Bank’s
guidelines and reporting instructions and liquidity regulatory guidance; changes to the         financial performance objectives, vision and strategic goals, and may not be appropriate
Bank’s credit ratings; operational (including technology) and infrastructure risks;             for other purposes. Except as required by law, the Bank does not undertake to update
reputational risks; the risk that the Bank’s risk management models may not take into           any forward-looking statements, whether written or oral, that may be made from time to
account all relevant factors; the accuracy and completeness of information the Bank             time by or on its behalf.
receives on customers and counterparties; the timely development and introduction of
                                                                                                Additional information relating to the Bank, including the Bank’s Annual Information
new products and services; the Bank’s ability to expand existing distribution channels
                                                                                                Form, can be located on the SEDAR website at www.sedar.com and on the EDGAR
and to develop and realize revenues from new distribution channels; the Bank’s ability to
                                                                                                section of the SEC’s website at www.sec.gov.
complete and integrate acquisitions and its other growth strategies; critical accounting
estimates and the effects of changes in accounting policies and methods used by the
Bank as described in the Bank’s annual financial statements (See “Controls and
Accounting Policies – Critical accounting estimates” in the Bank’s 2017 Annual Report)
and updated by quarterly reports; global capital markets activity; the Bank’s ability to
attract and retain key executives; reliance on third parties to provide components of the
Bank’s business infrastructure; unexpected changes in consumer spending and saving
habits; technological developments; fraud by internal or external parties, including the
use of new technologies in unprecedented ways to defraud the Bank or its customers;

                                                                                                                                                                                              2
TABLE OF CONTENTS
Scotiabank Overview                                 4
  • Canada’s International Bank                     5
  • Well Diversified and Profitable Businesses      6
  • Track Record of Earnings & Dividend Growth      7
  • Why Invest In Scotiabank                        8
  • Strong Capital Generation and Position          9
  • Key Strategic Priorities                       10
  • Digital Transformation Strategy                11
  • Medium-Term Financial Objectives               12
  • Investor Day Summary                           13
Business Line and Financial Overview               14
  • Q3/18 Financial Overview                       15
  • Canadian Banking Overview                      16
  • International Banking Overview                 23
  • Global Banking and Markets Overview            27
  • Credit Performance by Business Lines           29
Treasury and Funding                               30
Appendices
  • Appendix 1: Bail-in and TLAC                   37
  • Appendix 2: Canadian Housing Market            48
  • Appendix 3: Canada & International Economies   57
  • Appendix 4: Covered Bonds                      65
  • Appendix 5: Corporate Social Responsibility    69
Contact Information                                71

                                                        3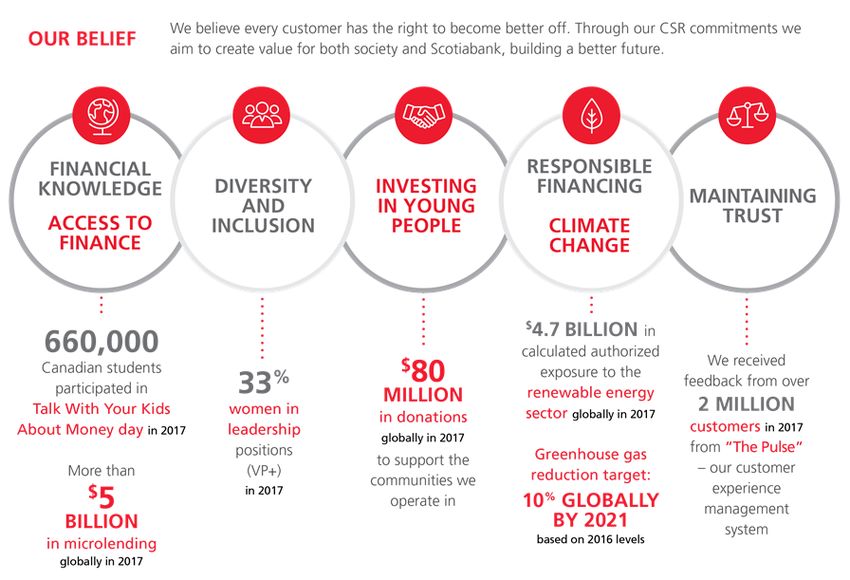
Scotiabank Overview
CANADA’S INTERNATIONAL BANK
         High quality and well-balanced business operating within a clearly defined global footprint

         History
         Established on East Coast of                                        In U.S. and Caribbean                                           Representative offices in                                 Began expanding Caribbean
         Canada in 1832                                                      125+ years                                                      Asia and Latin America                                    presence into Central and
                                                                                                                                             since 1960s                                               South America in 1990s.

         Strong presence in attractive markets                                              Currently the largest bank in the                                              Q3 20181                                              Scotiabank
                                                                                            Caribbean region. Focused on the
                                                                                            Pacific Alliance countries of Mexico,                                         Net Income                                                   $2.3B
                                                                                            Peru, Chile and Colombia                                                      ROE                                                          14.5%
                                                                                                                                                                          Productivity Ratio                                           51.8%
                                                                                                                                                                          CET1 Risk Weighted Assets                                    $411B
                                                                                                                                                                                                            2
                                                                                                                                                                          CET 1 Capital Ratio                                          11.4%
                                                                                                                                                                          Total Assets                                                 $947B
                                                                                                                                                                          Market Capitalization                                         $95B
                                                                                                                                                                          # of Employees                                              >96,000

                                                                                                                                      Scotiabank credit ratings3
                                                                                                                                                                                Moody’s                  S&P                   Fitch              DBRS
                                                                                                                                       Legacy Senior Debt                          Aa2                     A+                   AA-                AA
                                                                                                                                                     Senior Debt                    A2                     A-                   AA-              AA (low)
                                                                                                                                                           Outlook               Stable                 Stable                Stable              Stable
                                                                                                                                              Covered Bonds                        Aaa               Not Rated                  AAA               AAA
1   Adjusted for acquisition –related costs including the Day 1 PCL on acquired performing loans, integration and amortization costs related to current acquisitions, and amortization of intangibles related to current and past acquisitions
2   Basel III “all-in” basis
3   A securities rating is not a recommendation to buy, sell or hold securities and may be subject to revisions or withdrawals at any time. “Legacy Senior Debt” includes: (a) senior debt issued prior to
    September 23, 2018; and (b) senior debt issued on or after September 23, 2018 which is excluded from the bank recapitalization "bail-in" regime. “Senior Debt” is subject to conversion under the                                                       5
    bank recapitalization "bail-in" regime
WELL DIVERSIFIED AND PROFITABLE BUSINESSES1
Diversified by products, customers and geographies, creating stability and lowering risk
50%
Canadian Banking
59%
Canada
Pacific Alliance5
represents ~70%
BUSINESS LINE of International GEOGRAPHIC
EARNINGS2,3 Banking earnings SEGMENT
AVERAGE ASSETS4
$2.3B
$919B
31%
International
19% Banking 17%
Other International
Global Banking
and Markets
13%
11% U.S.
Pacific
Alliance5
1 Excludes Other segment and Corporate Adjustments
2 Three months ended July 31, 2018
3 Adjusted for acquisition –related costs including the Day 1 PCL on acquired performing loans, integration and amortization costs related to current acquisitions, and amortization of
intangibles related to current and past acquisitions
4 Quarter end as at July 31, 2018
5 Pacific Alliance includes Mexico, Peru, Chile and Colombia 6TRACK RECORD OF EARNINGS & DIVIDEND GROWTH
Stable and predictable earnings with steady increases in dividends
EARNINGS PER SHARE (C$)1 TOTAL SHAREHOLDER RETURN2
16.5%
+9% 14.8% 15.2%
CAGR $6.49 12.8% 13.8%
11.9%
$5.10 10.4% 10.9%
8.9%
$3.05
3.0%
08 09 10 11 12 13 14 15 16 17 18 1 Year 5 Year 10 Years 20 Years 30 Years
YTD
BNS Big-5 Peers (Ex. BNS)
DIVIDEND PER SHARE (C$)
$3.05
$2.43
+11%
CAGR
$0.37
97 98 99 00 01 02 03 04 05 06 07 08 09 10 11 12 13 14 15 16 17 18
YTD
1 Reflects adoption of IFRS in Fiscal 2011
2 As of July 31, 2018
7WHY INVEST IN SCOTIABANK?
Attractive untapped potential across our businesses and geographies, while supported by
strong Canadian risk culture
• ~80% of earnings from high quality and stable retail,
DIVERSIFIED BY BUSINESS commercial and wealth management businesses
AND GEOGRAPHY PROVIDING
SUSTAINABLE AND GROWING EARNINGS
• Attractive growth opportunities across all of our businesses
• Announced recent acquisitions that strengthen our business
• Strong Canadian risk culture and industry leading capital levels
STRENGTHENING THE CORE • Attractive dividend yield and consistent record of dividend increases
WITH CAPABILITIES TO
PLAY OFFENSE AND DEFENSE • Leveraging traditional and non-traditional data
• Building stronger capabilities for AML and reputational risk
• Focused on growing the Bank’s key markets of Mexico, Peru,
UNIQUE AND ATTRACTIVE Chile and Colombia, with a population of roughly 230 million
BUSINESS IN THE • Average age of 29, growing middle class and large portion of the
KEY PACIFIC ALLIANCE MARKETS young population is underbanked
• Higher GDP growth forecast compared to Canada and the U.S.
CLEAR DIGITAL STRATEGY LEVERAGED • Aligned and integrated Digital Banking Network with digital
ACROSS OUR FIVE KEY MARKETS TO factories in Canada, Mexico, Peru, Chile and Colombia
IMPROVE CUSTOMER EXPERIENCE AND • Driver of internal innovation and our clear digital targets
PRODUCTIVITY
• Attracting new talent and leadership on a global basis
8STRONG CAPITAL POSITION
Capital levels are significantly higher than the minimum regulatory requirements
CET1 RATIO
+47 bps -108 bps
12.0% +26 bps
-29 bps +3 bps 11.4%
Q2/18 Net Issuance of Impact of Internal Capital RWA Growth Other Q3/18
Capital Acquisitions Generation (ex. FX) Including FX
STRONG CAPITAL LEVELS
14.8% 14.9% 14.6% 15.3% 14.5%
1.8% 1.8%
2.2% 1.9% 1.7%
1.6% 1.5%
1.3% 1.5% 1.4%
11.3% 11.5% 11.2% 12.0% 11.4%
Q3/17 Q4/17 Q1/18 Q2/18 Q3/18
CET1 Tier 1 Tier 2
9KEY STRATEGIC PRIORITIES
Clear and established strategic agenda to deliver value to shareholders
10DIGITAL TRANSFORMATION STRATEGY & PROCESS
Digital is an enabler of the all-bank strategy and will improve our productivity ratio
DIGITAL RETAIL SALES DIGITAL ADOPTION
% %
F2016 11 F2016 26
GOAL GOAL
15 + 900 + 900
F2017 bps > 50% F2017 29 bps > 70%
1
F2018 20 F2018
1
35
IN-BRANCH FINANCIAL TRANSACTIONS CUSTOMER EXPERIENCE
%
F2016 26
The Pulse full GOAL
GOAL Focus on key
600 rollout MARKET
F2017 22 - journeys
bps < 10% and early wins LEADER
F2018
1
20
F2016 F2017 F2018
ON TRACK TO IMPROVE ALL-BANK PRODUCTIVITY RATIO TOMEDIUM-TERM FINANCIAL OBJECTIVES
Achievable objectives driven by strong operations across our footprint
2018 YTD RESULTS1
METRIC OBJECTIVES
(YTD/YTD)
ALL BANK
EPS Growth 7%+ +9.2%
ROE 14%+ 15.2%
Operating Leverage Positive 4.7%
Capital Strong Levels 11.4%
OTHER FINANCIAL
OBJECTIVES
Dividend Payout Ratio 40-50% 47.1%
CANADIAN BANKING
Net Income Growth 7%+ +8.4%
Productivity RatioINVESTOR DAY SUMMARY
A lot of heavy lifting completed and focused on key areas going forward
Structural
Customer Strengthen Cost Growth
Focus the Core Digital Levers
Transformation
Deeper customer Solid progress Untapped potential
relationships, focusing on smart automation across our business
on growing primary and AI while focusing and better leveraging
customers, and Playing “offense” on killer basics One year ahead of plan our scale and
NPS and improving the (investing in data and and will support footprint
customer experience analytics) and “defense” productivity gains
(protecting our
reputation, investing in
AML and cyber security)
13Business Line and
Financial Overview
14Q3 2018 FINANCIAL PERFORMANCE
Strong adjusted results with strong operating leverage and productivity gains
$MM, except EPS Q3/18 Y/Y Q/Q YEAR-OVER-YEAR HIGHLIGHTS
Reported
Net Income $1,939 (8%) (11%) • Reported Net Income down 8%, or up
Diluted EPS $1.55 (7%) (9%) 7%3 adjusted
Revenue $7,181 +4% +2% • Revenue up 4%
Expenses $3,770 +3% +1%
o Net interest income up 7% from strong volume
Productivity Ratio 52.5% (80bps) (30bps) growth in both Canadian and International Banking
Core Banking Margin 2.46% - (1bp) o Non interest income up 1%
PCL Ratio1, 2 69bps +24bps +27bps
o Lower real estate, securities gains, and sale of
PCL Ratio on Impaired Loans1, 2 41bps (4bps) (5bps) HollisWealth
Adjusted3
• Expenses up 2%3
Net Income $2,259 +7% +3%
o Higher investments in technology, regulatory
Diluted EPS $1.76 +5% +3%
initiatives, impact of acquisitions and taxes
Expenses $3,721 +2% -
o Partly offset by the sale of HollisWealth, lower
Productivity Ratio 51.8% (120bps) (70bps) share-based payment expenses, advertising and
PCL Ratio1, 2 40bps (5bps) (2bps) business development costs
DIVIDENDS PER COMMON SHARE o YTD productivity ratio improved 240bps3
+0.03 +0.03 +0.03 • Positive YTD operating leverage of
4.7%3
0.82 0.82
• Improved PCL ratio1, 2 on impaired
0.76 0.79 0.79
loans
Q3/17 Q4/17 Q1/18 Q2/18 Q3/18
Announced Dividend Increase
1 2018 amounts are based on IFRS 9. Prior period amounts were based on IAS 39
2 Provision for credit losses on certain assets – loans, acceptances and off-balance sheet exposures
3 Adjusted for Acquisition-related costs, including Day 1 PCL impact on acquired performing loans, integration and amortization costs related to current acquisitions, and amortization
of intangibles related to current and past acquisitions 15CANADIAN BANKING OVERVIEW
A leader in personal & commercial banking, wealth and insurance in Canada
• Full suite of financial advice and banking solutions to retail, small business
BUSINESS OVERVIEW and commercial customers
• Investment, pension and insurance advice and solutions
• Customer focus: Deliver a leading customer experience and deepen
relationships with customers across our businesses and channels
• Structural cost transformation: Reduce structural costs to build the capacity to
invest in our businesses and technology to drive shareholder return
• Digital transformation: Leverage digital as the foundation of all our activities to
2018 PRIORITIES improve our operations, enhance the client experience and drive digital sales
• Business mix alignment: Optimize our business mix by growing higher margin
assets, building core deposits and earning higher fee income
• Leadership: Grow and diversify talent and engage employees through a
performance-focused culture
• Solid Loan Growth: Expect solid loan growth across retail mortgages,
auto lending, commercial loans, credit cards and deposits
• Margins: Stable to slightly increasing margins
• Provisions for Credit Losses (PCL): Higher PCLs driven by change
STRATEGIC OUTLOOK in business mix, but risk adjusted margin should remain stable
• Productivity: Improving productivity will continue to be an area of focus
• Strategic Priorities: Deepen primary relationships and strengthen
customer experience, optimize business mix, focus on cost initiatives
and drive digital transformation
16CANADIAN BANKING
Strong loan growth, margin expansion, positive operating leverage and improved credit
1
FINANCIAL PERFORMANCE AND METRICS ($MM) YEAR-OVER-YEAR HIGHLIGHTS
Q3/18 Y/Y Q/Q • Reported Net Income up 8% or up 9%4
Reported adjusted
Revenue $3,373 +3% +4% o Lower real estate gains impacted growth by 3%
Expenses $1,661 +2% +1%
o Asset and deposit growth, margin expansion
PCLs $181 (19%) (12%)
o Lower provision for credit losses
Net Income $1,130 +8% +11%
Productivity Ratio 49.2% (80bps) (160bps)
• Revenue up 3%
o Net interest income up 8%
Net Interest Margin 2.46% +5bps +3bps
o Lower real estate gains impacted growth by 2%
PCL Ratio2, 3 0.21% (7bps) (4bps)
PCL Ratio on Impaired Loans2, 3 0.21% (7bps) (4bps)
• Loan growth of 6%
o Residential mortgages up 5%; credit cards up 6%
Adjusted4
Expenses $1,646 +1% +1% o Business loans up 14%
Net Income $1,141 +9% +12% • NIM up 5 bps
Productivity Ratio 48.8% (100bps) (180bps) o Rising rate environment and improved business mix
1,4
• Expenses up 1%4
ADJUSTED NET INCOME ($MM) AND NIM (%) o Higher investments in technology and regulatory
2.46%
2.41% 2.41% 2.43% initiatives, Jarislowsky acquisition
2.41%
o YTD productivity ratio improved 120 bps4
• Positive YTD operating leverage of 2.4%4
1,141
• PCL ratio on impaired loans improved
1,050 1,072 1,107 1,022 2, 3
by 7 bps due to lower PCLs in retail
Q3/17 Q4/17 Q1/18 Q2/18 Q3/18
1 Attributableto equity holders of the Bank
2 2018 amounts are based on IFRS 9. Prior period amounts were based on IAS 39
3 Provision for credit losses on certain assets – loans, acceptances and off-balance sheet exposures
17
4 Adjusted for Acquisition-related costs, including integration and amortization costs related to current acquisitions, and amortization of intangibles related to current and past acquisiti onsCANADIAN BANKING: REVENUE AND LOAN MIX
Strong retail and growing commercial and wealth
58% 61%
Residential
Retail
Mortgage
AVERAGE LOAN
REVENUE MIX1 MIX1
$3.4B $337B
2%
Credit Cards
24%
Wealth 16% 21%
18% Business and Personal
Commercial Government Loans Loan
1 For the three months ended July 31, 2018
18CANADIAN BANKING: RETAIL EXPOSURES
Retail loan portfolio ~92% secured: 79% real estate and 13% automotive
• Residential mortgage portfolio is well-managed 79%
Real Estate
o 45% insured, and the remaining 55% uninsured has a LTV of 53%1 Secured Lending
• Credit card portfolio is approximately $7.1 billion,
reflecting ~3% of domestic retail loan book or 1.4% of
the Bank’s total loan book
o Organic growth strategy that is focused on payments and deepening
customer relationships
DOMESTIC
o ~80% of growth is from existing customers (penetration rate mid-30s RETAIL LOAN
versus peers in the low-40s) BOOK
o Strong risk management culture with specialized credit card teams, $284.4B
customer analytics and collections focus
• Auto loan book is approximately $36 billion
o Market leader and portfolio is structurally different than peers with 7 OEM
relationships (3 exclusive)
o Prime Auto and Leases (~91%)
o Lending terms have been declining with contractual terms averaging 72
months but effective terms are 48 months
5% 13%
Unsecured Automotive
3%
Credit Cards
1 LTV calculated based on the total outstanding balance secured by the property. Property values indexed using Teranet HPI data.
19CANADIAN BANKING: RESIDENTIAL MORTGAGES
High quality and well managed portfolio
o Residential mortgage portfolio of $212 billion, of which 45% is insured, and an LTV of 53% on the uninsured book1
o Scotiabank has 3 distinct distribution channels; Broker (~55%), Branch (~25%), and Mobile Salesforce (~20%)
o All adjudicated under the same standards
o Mortgage business model is originate to hold
o New originations2 average LTV of 63% in Q3/18
o Majority is freehold properties; condominiums represent approximately 13% of the portfolio
o The mortgage portfolio is well managed and has good diversification across Canada with approximately half of the portfolio
anchored in Ontario
CANADIAN MORTGAGE PORTFOLIO: $212B (SPOT BALANCES AS AT Q3/18, $B)
$106.0
$11.9
Freehold - $185B Condos - $27B
45%
Insured
Total
Portfolio:
$94.1 $212 billion
$38.3
$30.9
$8.9
$3.7
$15.9
$29.4 $27.2 $1.7 $11.5 $9.5
$14.2 $11.3
$0.2
$8.8 $0.7 55%
Uninsured
Ontario BC & Territories Alberta Quebec Atlantic Manitoba &
Provinces Saskatchewan
% of
50% 18% 15% 8% 5% 4%
portfolio
1 LTV calculated based on the total outstanding balance secured by the property. Property values indexed using Teranet HPI data.
2 New originations defined as newly originated uninsured residential mortgages and have equity lines of credit, which include mortgages for purchases, 20
refinances with a request for additional funds and transfer from other financial institutions.Q3 2018 CANADIAN RESIDENTIAL MORTGAGES
Credit fundamentals remain strong
NEW ORIGINATIONS UNINSURED LTV DISTRIBUTION
Q3/17 Q2/18 Q3/18
Canada
Total Originations ($B) 15.3 8.9 11.9
GVA
Uninsured LTV 64% 63% 63%
60%
GTA GTA
62% Total Originations ($B) 4.9 2.8 3.6
BC &
Territories Uninsured LTV 62% 62% 62%
61% GVA
Atlantic
Prairies 68% Provinces Total Originations ($B) 2.1 1.2 1.4
ON QC
63% 65% 69% Uninsured LTV 62% 59% 60%
FICO® DISTRIBUTION – CANADIAN UNINSURED PORTFOLIO
Average FICO® Score
Canada 787
56%
GTA
GVA
789
790
• 788
FICO is a registered trademark of Fair Isaac Corporation
21TANGERINE OVERVIEW
Canada’s #1 Digital Bank and the official and exclusive Bank to the Toronto Raptors.
#1 ~96% ~97% ~91% Higher Client Growth from Cross-buy
Industry Leading NPS Digital Onboarding Digital Transactions Digital Sales ~50% Clients Own Multiple Products
KEY STRATEGIC FOCUS:
Primary Clients = Stickier Relationships
Simplicity # Primary Clients +23% Y/Y
• Simple market-leading products that appeal to value-conscious
Canadians Strong Client Advocacy
50% New Clients via Referrals
• Deliver a seamless Client Experience through digital innovations
• Great rates, simple products, and no unfair fees Strategy offers superior growth opportunities:
Velocity • Tangerine & Scotiabank’s partnership: We continuously
• Enhanced self-service options, adding speed & agility benefit from each other’s knowledge, systems, &
expertise
• Nimble modern platform supporting rapid development cycles
• A low cost, scalable, digital approach • Everyday Banking product suite offers diversified NIAT
profile in the face of intensified competition and low
Partnerships rates
• Accelerating momentum through the Toronto Raptors • Strong growth in new client and Primary Banking
customers
• Deepening client relationships by introducing SCENE Loyalty
• Partnership with Scotiabank continues to deepen • Focus on multi-product client relationships
• Tangerine Investments among fastest growing index
funds
Modern Platform Speed & Agility Client-Driven Innovation Unique ‘Orange’ Culture Award Winning Approach
• Line of Credit pilot currently underway.
• 93% of Tangerine’s clients are linked to competitors: Big
Scalable: Rapid Deployments: Incubator: 5 (ex- Scotiabank) and Credit Unions
Team Tangerine: Consistently Recognized:
Nimble, low cost systems Agile best practices enable Identify, explore, and pilot new Our unique culture and J.D. Power Customer Satisfaction
provide a holistic client view. quick & efficient new product & technologies and solutions to lean team are an essential seven years in a row, IPSOS.
feature delivery. meet evolving Client needs. part of how we deliver. #1 Bank, Reputation Institute.
22INTERNATIONAL BANKING OVERVIEW
Well established and diversified franchise in select, higher growth regions outside of Canada
• Operate primarily in Latin America, the Caribbean and Central America with a full range
BUSINESS OVERVIEW of personal and commercial financial services, as well as wealth products and solutions,
to over 15 million customers
• Customer focus: Taking customer experience to the next level by leveraging our
Customer Pulse program and implementing a new Employee Pulse program to gather
valuable feedback on how to better serve our customers
• Leadership: Continue to strengthen our teams across our business lines and functions
• Structural cost transformation: Continue to make progress on our cost reduction
2018 PRIORITIES programs, while focusing on developing new capabilities across the Bank
• Digital transformation: Scale-up our digital banking units across the four Pacific
Alliance countries (and Canada), continue driving digital sales on priority products, and
accelerating digital adoption and transaction migration
• Business mix alignment: Strategically grow in key areas, including core deposits, to
improve profitability and reduce funding costs
• Pacific Alliance: Good momentum and continue to leverage diversified footprint
• Growth and Margins: Expect low double digit growth in the Pacific Alliance while
optimizing operations in the Caribbean and Central America, with stable margins and
credit quality
STRATEGIC OUTLOOK
• Expense Management: Expense management and delivering positive operating
leverage remains a key priority, along with strategic investments that will help
deliver a stronger customer experience
• Growth Strategy: Focused on organic growth, but will consider acquisition
opportunities in our existing footprint
23INTERNATIONAL BANKING
Another record quarter driven by strong performance in the Pacific Alliance
1, 2 2
FINANCIAL PERFORMANCE AND METRICS ($MM) YEAR-OVER-YEAR HIGHLIGHTS
Q3/18 Y/Y Q/Q
Reported • Reported Net Income down 16%, or up
Revenue $2,853 +9% +4% 15%6 adjusted
Expenses $1,510 +7% +6%
o Strong asset and deposit growth in Pacific Alliance
PCLs $771 +142% +128%
Net Income $519 (16%) (24%) o Positive operating leverage and lower taxes
Productivity Ratio 52.9% (160bps) +40bps • Revenues up 9%
Net Interest Margin 4.70% (7bps) (4bps)
o Pacific Alliance up 15%
PCL Ratio 2.58% +142bps +136bps
PCL Ratio on Impaired Loans3, 4 1.33% +17bps (5bps) • Loans up 10%
Adjusted6 o Pacific Alliance loans up 14%
Expenses $1,476 +6% +4%
PCLs $367 +15% +8%
• NIM down 7 bps
Net Income $715 +15% +3% o Business mix changes and lower loan rates in
Productivity Ratio 51.7% (240bps) (40bps) Colombia
PCL Ratio3, 4 1.23% +7bps +1bp • Expenses up 6%6
1,6
ADJUSTED NET INCOME ($MM) AND NIM5 (%) o Business volume growth, inflation and higher
4.77% 4.67% 4.74% 4.70% technology costs
4.66%
o YTD productivity ratio improved 170 bps6
623 613 675 683 715 • Positive YTD operating leverage of 3.4%6
• PCL ratio3, 4, 6 on impaired loans up 17 bps
Q3/17 Q4/17 Q1/18 Q2/18 Q3/18
1
o Mainly impacted by credit mark benefits in the prior
Attributable to equity holders of the Bank
2 Y/Y and Q/Q growth rates (%) are on a constant dollars basis, while metrics and change in bps are on a reported basis year
3 2018 amounts are based on IFRS 9. Prior period amounts were based on IAS 39
4 Provision for credit losses on certain assets – loans, acceptances and off-balance sheet exposures
5 Net Interest Margin is on a reported basis
24
6 Adjusted for Acquisition-related costs, including Day 1 PCL impact on acquired performing loans, integration and amortization costs related to current acquisitions, and amortization
of intangibles related to current and past acquisitionsINTERNATIONAL BANKING: REVENUE AND LOAN MIX
Focused on Latin America, with good contribution from the Caribbean and Central America
68%
Latin America
52%
Business and
Government
Loans
AVERAGE LOAN
REVENUE MIX1, 2
MIX1, 2
$2.8B
$122B
6%
Credit Cards
26%
27% Residential
Mortgages
Caribbean &
5% Central America 16%
Asia Personal Loans
1 For the three months ended July 31, 2018
2 On a constant dollar basis
25PACIFIC ALLIANCE OVERVIEW
Attractive growth opportunity for the Bank
• With roughly 230 million people, an average age of 29, growing middle-class, a large portion
of the population that is underbanked, and a stable banking environment
35% 37%
Mexico Peru
• Mexico
o 5th largest bank1 in Mexico; strong positions in mortgages and auto
o Business confidence is strong with a robust domestic economy
o Strong and diversified manufacturing industry EARNINGS BY
COUNTRY2
• Peru
o 3rd largest bank1 in Peru
o Strong franchise, building great momentum
o Universal bank with strong presence across all segments 5% 23%
Colombia Chile
• Chile
o 3rd largest private bank1 in Chile 25%
o Most developed country in Latin America 33% Peru
o A leader in corporate lending and capital markets Mexico
• Colombia AVERAGE
o Growing presence with acquisition of Colpatria and Citibank operations ASSETS BY
o Strong macroeconomic fundamentals and performance, with GDP COUNTRY3
per capita doubling over the last decade
o Very strong in retail and credit cards
30%
1 Interms of loans
2 For the nine months ended July 31 2018 12% Chile
3 For the three months ended July 31, 2018
Colombia
26GLOBAL BANKING AND MARKETS OVERVIEW
Wholesale banking and capital markets products to corporate, government and institutional clients
BUSINESS OVERVIEW
• Full service platform in Canada and Mexico. Niche focus in the U.S., Central and
South America, Asia, Australia and select markets in Europe
• Enhance Customer Focus: Improving the end-to-end customer experience to
seamlessly offer our full capabilities, thereby deepening and strengthening our
relationships, while leveraging our global footprint to better serve our multi-
regional customers
• Leaders in our Primary Markets: Invest in people, process and technology,
2018 PRIORITIES enhance our capabilities in our primary markets of Canada and the Pacific
Alliance. Expand our investment banking and capital markets expertise to
increase our relevance and deepen our customer relationships in these markets
• Optimize Effectiveness: Control costs and invest in the right areas to drive
shareholder value, while optimizing our of capital and funding. Invest in
technology to enhance the customer experience, improve our data and analytics
capabilities, and increase operational effectiveness
• Higher Revenues: Expect higher revenues from focus clients, Global
Transaction Banking, Corporate Banking and Investment Banking
• Expense Management: Cost savings and loan losses are expected
STRATEGIC OUTLOOK to moderate toward historic levels
• Global Outlook: Building franchise as a leading wholesale bank in Canada and
the Pacific Alliance, while maintaining a relevant presence in other regions to
support its multi-regional customers
27GLOBAL BANKING AND MARKETS
Good net interest income growth and improvement in credit quality
1
FINANCIAL PERFORMANCE AND METRICS ($MM) YEAR-OVER-YEAR HIGHLIGHTS
Q3/18 Y/Y Q/Q
Revenue $1,110 (1%) (4%)
• Reported Net Income in line with prior
year
Expenses $543 +2% (4%)
o Higher NII, corporate banking and investment
PCLs ($10) N/A N/A banking results and lower PCLs
Net Income $441 - (1%) o Lower income from global equities and lower fixed
income, as well as higher expenses
Productivity Ratio 48.9% +150bps -
Net Interest Margin 1.82% +6bps +2bps • Loans up 1%
PCL Ratio2, 3 (0.05%) (16bps) - • Expenses up 2%
PCL Ratio on Impaired Loans2, 3 (0.06%) (17bps) (8bps) o Higher regulatory costs and technology investments
o Productivity ratio was 48.9% compared to 47.4% last
year
• PCL ratio2, 3 improved by 16 bps
1 4
NET INCOME AND TRADING INCOME ($MM)
o Reversal of provisions on impaired loans in the US
441 454 447
391 441 o Higher provision on one account last year
372 382
411 331
216
Q3/17 Q4/17 Q1/18 Q2/18 Q3/18
1 Attributable to equity holders of the Bank
2 2018 amounts are based on IFRS 9. Prior period amounts were based on IAS 39
3 Provision for credit losses on certain assets – loans, acceptances and off-balance sheet exposures
4 Trading income on an all-bank basis and TEB 28PCL RATIOS
Stable all-bank PCL ratios on impaired loans
IAS 39 IFRS 9
Q3/17 Q4/17 Q1/18 Q2/18 Q3/18
(As a % of PCLs on PCLs on PCLs on Total Total
PCLs on Total Total
Average Net Loans & Impaired Impaired Impaired PCLs PCLs
Acceptance)
Impaired Loans PCLs PCLs
Loans Loans Loans (rep) (adj)
Canadian Banking
Retail 0.31 0.30 0.29 0.28 0.28 0.28 0.25 0.24 0.24
Commercial 0.09 0.07 0.11 0.08 0.09 0.09 (0.04) 0.06 0.06
Total 0.28 0.27 0.27 0.25 0.25 0.25 0.21 0.21 0.21
Total – Excluding Credit Mark
0.29 0.28 N/A N/A N/A N/A N/A N/A N/A
Benefits
International Banking
Retail 2.08 2.00 2.28 2.39 2.26 2.16 2.36 4.69 2.25
Commercial 0.31 0.32 0.28 0.201 0.55 0.341 0.38 0.66 0.311
Total 1.16 1.14 1.252 1.261, 2 1.382 1.221, 2 1.33 2.583 1.234
Total – Excluding Credit Mark
1.27 1.34 N/A N/A N/A N/A N/A N/A N/A
Benefits
Global Banking and Markets 0.11 0.04 (0.01) (0.04) 0.02 (0.05) (0.06) (0.05) (0.05)
All Bank 0.45 0.42 0.43 0.42 0.46 0.42 0.41 0.69 0.40
1 Excludes provision for credit losses on debt securities and deposit with banks
2 Not comparable to prior periods, which were net of acquisition benefits
3 On an reported basis; includes impact of Day 1 PCLs from acquisitions 29
4 On an adjusted basis; adjusted for Day 1 PCLs from acquisitionsTreasury and Funding
FUNDING STRATEGY
Managing the Bank’s reliance on wholesale funding and diversifying funding sources

• Build customer deposits in all of our key markets

• Continue to manage wholesale funding (WSF) and focus on longer term funding
  o Endeavouring to fund asset growth through deposits

• Achieve appropriate balance between cost and stability of funding
  o Maintain pricing relative to peers

• Diversify funding by type, currency, program, tenor and markets

• Pre-fund at least one quarter ahead, market permitting

• Centralized funding strategy and associated risk management

                                                                                     31
DEPOSIT OVERVIEW
Stable trend in personal & business and government deposits
PERSONAL DEPOSITS PERSONAL DEPOSITS
(SPOT, CANADIAN DOLLAR EQUIVALENT, $B)
$211 • Important for both relationship purposes
$199 $201 and regulatory value
$198
$195 $196
$202 $200
$204 • 4.2% CAGR over the last 3 years
$199
$186
$193
$190
3Y CAGR – 4.2%
BUSINESS & GOVERNMENT DEPOSITS1 BUSINESS & GOVERNMENT
(SPOT, CANADIAN DOLLAR EQUIVALENT, $B)
$172 $170
$179
• Leveraging relationships to increase
$161 share of deposits
$156 $156 $174
$169 $168
$126 $149 $155 • 12.6% CAGR over the last 3 years
$139
3Y CAGR – 12.6%
• Focusing on operational, regulatory
friendly deposits
1 Calculated as Bus& Gov’t deposits less Wholesale Funding, adjusted for Sub Debt
32WHOLESALE FUNDING UTILIZATION
Managing reliance on wholesale funding and growing deposits
WSF/TOTAL ASSETS REDUCING RELIANCE ON
WHOLESALE FUNDING
• Targeting to be in line with peers
25.9%
o Reduced reliance on wholesale funding over the last two
25.2% 25.1% years
24.5% 24.6%
23.8% 23.7% 23.8%
24.2% o Sustained focus on deposits as an alternate to wholesale
funding
Q3/16 Q4/16 Q1/17 Q2/17 Q3/17 Q4/17 Q1/18 Q2/18 Q3/18
MONEY MARKET WSF/TOTAL WSF FOCUS ON TERM FUNDING
• Steady reduction in reliance on money
market funding
41.4%
39.9%
38.7% 38.3%
37.7% 37.5% 37.4% 36.8%
35.6%
Q3/16 Q4/16 Q1/17 Q2/17 Q3/17 Q4/17 Q1/18 Q2/18 Q3/18
33LIQUIDITY METRICS
Well funded Bank with strong liquidity
• Liquidity Coverage Ratio (LCR)
o Consistently strong and steady performance
o Net Stable Funding Ratio (NSFR) implementation date is January 2020
132%
128%
127% 127%
126%
125% 125% 125% 125%
Q3/16 Q4/16 Q1/17 Q2/17 Q3/17 Q4/17 Q1/18 Q2/18 Q3/18
• High Quality Liquid Assets (HQLA)
o Efficiently managing LCR and optimizing HQLA
$145
$136 $140 $138
$132
$125 $128 $127
$123
Q3/16 Q4/16 Q1/17 Q2/17 Q3/17 Q4/17 Q1/18 Q2/18 Q3/18
34WHOLESALE FUNDING COMPOSITION
Wholesale funding diversity by instrument and maturity1,6,7
38%
Medium Term Notes
& Deposit Notes
MATURITY TABLE (EX-SUB DEBT)
(CANADIAN DOLLAR EQUIVALENT, $B)
2%
Asset-Backed $25
Securities
12%
Covered Bonds
$5
$1
$22
$21
Asset-Backed $3 $18 $18
$6
Commercial Paper3
$229B $1 $2
3% $2 $7
$15
9%
Mortgage
$4
Securitization4 $20
$16 $16
2%
Deposits from Banks2
3%
$14
$11 $11
Subordinated Debt5
31%
Bearer Deposit Notes, < 1 Year 2 Years 3 Years 4 Years 5 Years 5 Years
Commercial Paper & >
Certificate of Deposits
Senior Debt ABS Covered Bonds
1 Wholesale funding sources exclude repo transactions and bankers acceptances, which are disclosed in the contractual maturities table i n the MD&A of the Interim Consolidated Financial Statements.
Amounts are based on remaining term to maturity.
2 Only includes commercial bank deposits raised by Group Treasury.
3 Wholesale funding sources also exclude asset-backed commercial paper (ABCP) issued by certain ABCP conduits that are not consolidated for financial reporting purposes.
4 Represents residential mortgages funded through Canadian Federal Government agency sponsored programs. Funding accessed through such pro grams does not impact the funding capacity of the Bank
in its own name.
5 Although subordinated debentures are a component of regulatory capital, they are included in this table in accordance with EDTF recommended disclosures.
6 As per Wholesale Funding Sources Table in MD&A. As of Q3/18
35
7 Wholesale funding sources may not add to 100% due to roundingDIVERSIFIED WHOLESALE FUNDING PROGRAMS
Flexible and well balanced programs
• SHORT-TERM FUNDING
o USD 25 billion Bank CP program
o USD 3 billion Subsidiary CP program
o CD Programs (Yankee/USD, EUR, GBP, AUD, HKD)
• TERM FUNDING & CAPITAL
o CAD 15 billion debt & equity shelf (senior debt, subordinated debt, preferred shares, common shares)
o CAD 6 billion Principal at Risk (PAR) Note shelf
o CAD 15 billion START ABS program (indirect auto loans)
o CAD 7 billion Halifax ABS shelf (unsecured lines of credit)
o CAD 5 billion Trillium ABS shelf (credit cards)
o CAD 36 billion global registered covered bond program (uninsured Canadian mortgages)
o Canada Mortgage Bonds and Mortgage Back Securities
o USD 20 billion debt & equity shelf (senior debt, subordinated debt, preferred shares, common shares)
o USD 20 billion EMTN shelf
o USD 5 billion Singapore MTN program
o AUD 4 billion Australian MTN program
36Appendix 1 Bail-in and TLAC
Overview of Canadian Bail-in Regulations

• Effective September 23, 2018

• Bail-in framework provides CDIC, Canada’s resolution authority, the statutory power to
  convert certain eligible debt of non-viable DSIBs into common equity to recapitalize a bank

• Supplements existing NVCC framework and other resolution tools
  o CDIC has a number of tools available including bail-in and restructuring the bank
  o The tools appropriate for the situation will be used with a goal to returning the bank to viability

• Applies to six Canadian DSIBs

                                                                                                          38
Bail-in
• A statutory conversion power that allows for the permanent conversion of eligible shares
and liabilities of a non-viable bank into common shares, incremental to OSFI’s conversion
of NVCC
• Bail-in conversion would occur in the context of an open bank; the bank remains open and
operating and continuing to provide critical services to its customers
• CDIC has flexibility to determine:
o Quantum of conversion – the portion of bail-in debt to be converted into common shares
o Timing of conversion – if it will take place immediately or over a period of time
o Process for converting – if conversion will take place in one or more steps
• CDIC must adhere to certain parameters
o Adequate recapitalization
o Order of conversion
o Equally ranking instruments
o Relative creditor hierarchy
39Scope of Bail-in Debt
• Scope emphasizes operational feasibility, credibility and preserving access to liquidity in
stress
• What’s in scope:
o Issued, originated or renegotiated after September 23, 2018
o Long term (original term >400 days)
o Tradeable and transferrable
o Unsecured
• What’s not in scope:
o Deposits
o Most structured notes
o Secured liabilities
o Covered bonds
o Derivatives
• Legacy (non-NVCC) capital instruments are not in scope for Bail-in but would be subject to
other resolution tools to ensure that senior bail-in debt holders are better off than holders
of legacy capital instruments
40Bail-in Outcomes
• Bank stays open and operating
• DSIB is recapitalized with limited or no taxpayer support and able to re-access markets
• Recoveries are consistent with relative hierarchy of claims (shared losses)
o Significant dilution of original common shareholders through conversion of NVCC and Bail-in debt
o New common shares issued to NVCC and Bail-in debt holders according to their relative rankings
• No creditor worse off
41How Will Bail-in Work?
Resolution
Bail-in conversion
Business Heightened Point of non- Resolution Stabilization /
CDIC exits
as usual risk viability weekend restructuring
• Good • Financial difficulties • OSFI declares • CDIC takes • 1-week to 1- • 1 to 5-year
financial the DSIB non- control / year timeframe timeframe
health viable ownership of
• DSIB may the DSIB
implement recovery • Common • Voting rights
plan actions under • Minister of shares resulting are resumed
OSFI oversight Finance, at the • OSFI triggers from NVCC and
request of CDIC, NVCC BID conversion
recommends the conversion are issued • “No creditor
• CDIC may monitor Federal Cabinet (voting rights worse off”
and undertake to issue orders suspended) determination
necessary authorizing • Management and payment
preparatory CDIC to assume and Board of of
activities temporary DSIB • Execution of compensation
control or replaced if restructuring
necessary plan
• DSIB may ownership of the
experience declining DSIB and to
market confidence, execute a Bail-in • Liquidity
credit rating conversion support if
downgrades and necessary
funding / capital
raising challenges
42Compensation Regime
• No creditor worse off: creditors and shareholders are compensated where they have been
made worse off than they would have been in a liquidation
• Persons who hold the following claims at the time of entry into resolution are entitled to
compensation:
o Shares of the institution
o Subordinated debt vested in CDIC at the time of entry into resolution
o NVCC subordinated debt subsequently converted into common shares pursuant to contractual terms
o Liabilities subsequently converted into common shares pursuant to Bail-in power
o Any liability of the institution if the institution was wound-up at the end of the resolution process
o Any liability of the institution that was assumed by a CDIC-owned work-out company or bridge bank which was
subsequently liquidated or wound-up
• Compensation = liquidation value – resolution value
• Right to compensation is not transferrable
43Resolution Tools
• CDIC has a number of tools to assist or resolve a failing DSIB
o Liquidation of the bank and reimbursement of insured deposits
o Bank is placed under temporary CDIC control to complete its sale to a willing buyer (forced sale) via one of two
approaches:
o All shares are transferred to CDIC and it becomes the sole shareholder to facilitate the sale; or
o CDIC is appointed receiver to sell all or some of the assets and liabilities to the buyer
o Under both approaches, critical banking operations are maintained
o Bank is placed under temporary CDIC control and CDIC transfers certain functions to a bridge bank which is temporarily
owned by CDIC
o Meant to bridge the gap from when an institution fails and when a buyer or private-sector solution can be found
o Critical banking operations are maintained
o Bail-in regime
44TLAC Requirements and Eligibility
Two concurrent minimum TLAC
compliance requirements by Q1/22
21.5% minimum risk-based TLAC ratio
&
6.75% minimum TLAC leverage ratio
TLAC eligibility
Tier 1 and 2 regulatory capital
as per CAR guideline
+
Bail-in debt
Eligibility criteria for bail-in debt to qualify as TLAC
• Subject to permanent conversion into common shares in whole or in part pursuant to CDIC Act
• Directly issued by Canadian parent operating company
• Not secured or covered by a guarantee of the issuer or related party
• Perpetual or have remaining term >365 days
• No acceleration rights outside of bankruptcy, insolvency, wind-up, liquidation or failure to make
principal or interest payments for 30 business days or more
• Callable without OSFI prior approval if, following the transaction, the minimum TLAC requirement
is satisfied
By Q1/22, Scotiabank will exceed the minimum TLAC requirement (plus Domestic Stability Buffer
requirement) based on maintaining current capital levels and refinancing upcoming senior maturities
45NVCC vs. Bail-in
• NVCC are regulatory capital instruments other than common shares that are converted to
CET1 at non-viability
• Authorities would trigger NVCC only where there was a high level of confidence that the
conversion plus additional measures would restore the viability of the FI
• NVCC improves regulatory capital quality, not quantity
o Conversion of NVCC increases CET1 but not total capital – a gap that Bail-in addresses
• NVCC is a prerequisite to Bail-in
46Enhanced Disclosures
• Bail-in debt will be subject to robust disclosure requirements to promote transparency,
legal certainty and market discipline
• Contractual terms must include a clause whereby investors expressly submit to the
Canadian Bail-in regime notwithstanding any foreign law to the contrary
• Disclosures regarding Bail-in power are required in offering documents
• DSIBs are not permitted to advertise or otherwise promote Bail-in debt, including in its
name, to a purchaser in Canada as a deposit
• Failure to meet these requirements would not exempt an issuance from being eligible for
Bail-in
47Appendix 2 Canadian Housing Market
CANADIAN HOUSEHOLD DEBT
 High headline levels supported by strong underlying metrics
• Household debt has been increasing since the mid-1980s
  o Lower interest rates, demographics (including immigration), financial innovation and shift in consumer attitude/behaviour
  o Debt increase has largely been driven by mortgage debt (represents ~71% of total household credit)

• Household debt to disposable income is only one metric to analyze
  o The household-debt-to-income ratio awkwardly mixes a balance sheet measure “debt” with an income statement measure
    “disposable income”. Borrowers are not generally expected to pay off their debts with one year’s income

• Other considerations regarding consumer indebtedness and consumer resilience to shocks:
  o Housing affordability – Mortgage debt-service ratios are in line with historical averages at the national level
      o   Interest and principal mortgage debt payments steady at 6–7% of disposable income since 2008
      o   Consumers prudently taking advantage of low rates to repay more principal
  o Net worth – Net asset levels (assets less debt) are at an all-time high of more than 8 times disposable income
      o   About half of these assets are financial (not real estate)
      o   Asset growth has outpaced debt growth
  o Interest rate shocks – Despite expectations for higher rates, there are mitigating factors
      o   Canadians have substantial equity in their homes (71% including HELOCs)
      o   The majority of mortgage holders are locked in at fixed rates, with the 5-year term the most popular
      o   Mortgage regulations, including the recent B-20 changes, require that borrowers must qualify for all types of mortgage
          credit using a “stress test” interest rate, which for uninsured mortgages is the higher of the contract rate plus 200 basis
          points or the Bank of Canada 5 Year Benchmark rate, to provide a buffer against rising interest rates impacting affordability
      o   Variable rate mortgage holders have the option to switch into fixed rates
  o Unemployment rate – A key driver of delinquencies and losses that determines borrowers’ ability to pay debt
      o   Levels are expected to remain fairly stable over the next 2–3 years at historically low rates

                                                                                                                                          49
CANADIAN HOUSEHOLD CREDIT GROWTH MODERATING
Public policy changes are having their intended effects
• Total household credit growing 4.7% in nominal terms year-to-date, vs 2008 peak of 12% y/y
• Consumer loans excluding mortgages (cards, HELOCs, unsecured lines, auto loans, etc.)
are growing 4.7% year-to-date, vs 11% in late-2007
• Mortgage credit growing 4.7% year-to-date, vs 2008 peak of 13%
HOUSEHOLD CREDIT GROWTH CONSUMER LOAN GROWTH RESIDENTIAL MORTGAGE GROWTH
20 20 20
%, 3-month moving average %, 3-month moving average %, 3-month moving average
18 18
16 15 y/y % 16
y/y % change
14 change 14 y/y %
m/m %
change
12 change, 10 12
SA
10 10
8 5 8
6 6
4 0 4 m/m %
m/m % change,
2 change, SA 2 SA
0 -5 0
90 92 94 96 98 00 02 04 06 08 10 12 14 16 18 90 92 94 96 98 00 02 04 06 08 10 12 14 16 18 90 92 94 96 98 00 02 04 06 08 10 12 14 16 18
Sources: Scotiabank Economics, Bank of Canada. Sources: Scotiabank Economics, Bank of Canada. Sources: Scotiabank Economics, Bank of Canada.
50HOUSEHOLD DEBT: CANADA vs U.S.
Canadian households balance sheets compare favourably to those of their southern neighours
• In comparable terms, Canadian debt-to-income ratio is now 5 ppts below where it peaked
in the U.S.
o In the last 7 years, increases in Canadian debt-to-income ratio have slowed vs 2002–10
o Calculated on the same terms, Canada’s debt-to-income is currently 162% vs 134% in the U.S.
• Canadian debt-to-assets ratio remains below U.S.
o U.S. households have incentive to pursue higher asset leverage in light of mortgage interest deductibility
o Debt is a stock concept, to be financed over one’s lifetime. Income is a flow concept measuring
one single year’s earnings. Debt should be compared to lifetime or permanent income, or assets
• Ratio of total household debt to GDP remains lower in Canada than U.S.
o Calculated on a comparable basis, the ratio of household credit market debt is 98.1% in Canada vs.102.5% in the U.S.
Household Credit Market Total Household Liabilities Household Credit–Market
Debt to Disposable Income As % of Total Assets Debt to GDP
180 30 130
household credit liabilities 167.9 household debt
% of GDP
as % of disposable income as % of assets
120
160 US with
162.2 unincorporated
110 102.5
25 US business debt Original 102.3
140 Canada
100
134.3 98.1
120 90
20 Canada*
80
100 18.7 Original 75.7
Canada 70 US
Adjusted Canadian* 16.7
80 Official Canadian 15
60
Official US
60 50
90 92 94 96 98 00 02 04 06 08 10 12 14 16 18 90 92 94 96 98 00 02 04 06 08 10 12 14 16 18
10
* Adjusted for US concepts and definitions. 90 92 94 96 98 00 02 04 06 08 10 12 14 16 18 * Adjusted for US concepts and definitions.
Sources: Scotiabank Economics, BEA, Federal Sources: Scotiabank Economics, BEA, Federal
Sources: Scotiabank Economics, Statistics Reserve Board, Statistics Canada.
Reserve Board, Statistics Canada.
Canada, Federal Reserve Board.
51CANADIAN MORTGAGE MARKET
Less than half of households have a mortgage or a HELOC More than 50% of Households Do Not
Have a Mortgage or HELOC
• Mortgage holders
45 % of households, 2017
40
o Less than 50% of Canadian households have exposure to a mortgage 35 10.6 with HELOC
and/or a HELOC
30
o Negligible number of negative equity mortgages in Canada
25 3.4
o 91% of all homeowners have equity ratios of 25% or higher. Significant price
20
decreases required to reach a negative equity position
15 30.7 32.0
o High share of equity: average equity ratio is 74% (excluding HELOCs)
22.8
10
o Approximately half of first-time home buyers in Canada are able to source
their down payments from their personal savings 5
0
Owned dwelling Owned dwelling Rented
• 2014–17 data show 79% of buyers from that period have w/ mortgage w/o mortgage
Sources: Scotiabank Economics,
25% or more equity Mortgage Professionals Canada.
o Partly reflects speed of rising house prices, but also stepped-up down High Percentage of Equity
payment requirements and tightened mortgage rules
(real estate equity as % of real estate assets)
80
% Official (excludes HELOCs)
• 2014–17 data indicate only 42% of first-time home buyers 75
had less than 20% down 70 Cda estimate
including HELOCs
65
US estimate
with NFPs
60
excluding
• Efforts to cool the housing market are working, which 55
HELOCs
implies moderating price appreciation 50
45
Official FRB with NFPs
(includes HELOCs)
40
35
90 92 94 96 98 00 02 04 06 08 10 12 14 16
Sources: Scotiabank Economics, OSFI, FCAC,
Statistics Canada, Federal Reserve Board.
52CANADIAN HOUSING FUNDAMENTALS REMAIN SOUND
Solid indicators on several dimensions
INTERNATIONAL IMMIGRATION TOTAL DEBT-SERVICE RATIO
16
2018
% OF DISPOSABLE INCOME
NUMBER OF IMMIGRANTS
Target = 310K 15
290
TO CANADA, 000S
14 1990–2017
240 13 average
12
190
11
140 10
90 95 00 05 10 15 90 92 94 96 98 00 02 04 06 08 10 12 14 16 18
Sources: Scotiabank Economics, Statistics Canada. Sources: Scotiabank Economics, Statistics Canada. Data through 2018Q1.
RESIDENTIAL UNIT SALES TO NEW LISTINGS RATIO RESIDENTIAL MORTGAGES ARREARS
% OF MORTGAGES IN ARREARS
1.0 6
5
3 MONTHS OR MORE
0.8
Sellers’ Market
4
0.6
RATIO
U.S.
Balanced Market 3
0.4
2
Buyers’ Market
0.2 1 Canada
0.0 0
90 92 94 96 98 00 02 04 06 08 10 12 14 16 18 90 92 94 96 98 00 02 04 06 08 10 12 14 16 18
Sources: Scotiabank Economics, CREA MLS. Data through July 2018. Sources: Scotiabank Economics, CBA, MBA. Data through 2018Q1 (US) and March 2018
(Canada).
53HOUSEHOLDS CAN SUSTAIN HIGHER RATES
Real interest rates are still negative and will turn only mildly positive in 2019
• Scotiabank Economics expects the Bank of Canada to • Average mortgage borrowers have only just begun
raise its target overnight rate an additional 100 bps by renewing their loans at higher interest rates.
end-2019.
Further Rate Hikes 5-yr Mortgage Rates
Ahead from BoC & Fed 50
Resetting Higher
9 5-yr difference, basis points
%
8 0
7 Fed Funds -50
Target Rate
6
(Upper Limit)
-100
5
4 forecast -150
3
BoC -200
2 Overnight
Target Rate -250
1
0 -300
93 98 03 08 13 18 10 11 12 13 14 15 16 17 18
Sources: Scotiabank Economics, Haver Analytics. Sources: Scotiabank Economics, CMHC.
54You can also read