Debt Investor Discussion Pack - For the full year ended 30 June 2019 - CommBank

Page created by Jeanette Gilbert
 
CONTINUE READING
Debt Investor Discussion Pack - For the full year ended 30 June 2019 - CommBank
Debt Investor
Discussion Pack
For the full year ended 30 June 2019
Debt Investor Discussion Pack - For the full year ended 30 June 2019 - CommBank
Becoming a simpler, better bank

       Disciplined                 Responding                     Delivering
        execution                  to challenges             strong core outcomes

► Customer focus              ► Customer remediation      ► Home loans +4%

► Appropriate risk appetite   ► Lower interest rates      ► Transaction deposits +9%

► Balance sheet settings      ► Softer housing market     ► Deposit funding 69%

► Risk-adjusted returns       ► Business simplification   ► Strong capital position

                                                                                       2
Debt Investor Discussion Pack - For the full year ended 30 June 2019 - CommBank
1 Economic Overview
“ Against a volatile global backdrop, the Australian
    economy has slowed, but remains resilient
                                                  ”
Debt Investor Discussion Pack - For the full year ended 30 June 2019 - CommBank
Key economic indicators (June FY)
                             GDP %                                                           Underlying CPI %                              Unemployment Rate %
              GDP                               Nominal GDP
                                                                                                                                    5.9     5.7
                                          5.9                                                                                                      5.5
             2.9                                       5.6                                                                                                5.1     5.0     4.8
2.8                                                                                                                 2.1     2.1
                          2.5 2.6               4.7          4.9 4.7                                  1.8
      2.3                                                                                    1.7             1.6
                   2.1
                                                                                     1.4
                                    2.4

2016 2017 2018 2019 2020 2021       2016 2017 2018 2019 2020 2021                   2016 2017 2018 2019 2020 2021                   2016    2017   2018   2019   2020    2021

                          Cash Rate %                                                  Total Credit Growth %                           Housing Credit Growth %
                                                                                                                            4½-6½
      1.75                                                                     6.2
                                                                                                                    3½-5½           6.7                                  4½-6½
                   1.50     1.50                                                           5.4                                              6.6
                                                                                                                                                                 3½-5½
                                                                                                     4.4                                           5.6
                                     1.25
                                                                                                              3.3
                                                0.75     0.75                                                                                              3.5

      2016     2017         2018    2019        2020     2021                 2016         2017     2018     2019   2020     2021   2016    2017   2018   2019   2020    2021

Credit Growth                       = 12 months to June
GDP, Unemployment & CPI             = Financial year average           = forecast
                                                                                                 Source: ABS, RBA                                                                4
Cash Rate                           = As at June
Debt Investor Discussion Pack - For the full year ended 30 June 2019 - CommBank
Key economic indicators (June FY)
                                                                           2014            2015   2016       2017        2018         2019         2020      2021

  World                    GDP                                              3.6            3.5    3.3        3.8          3.6             3.3       3.6       3.6

  Australia                Credit Growth % – Total                          5.0            5.9    6.2        5.4          4.4             3.3     3½-5½      4½-6½

                           Credit Growth % – Housing                        6.4            7.3    6.7        6.6          5.6             3.5     3½-5½      4½-6½
                           Credit Growth % – Business                       3.4            4.5    6.6        4.2          3.2             4.0      4-6       4½-6½
                           Credit Growth % – Other Personal                 0.6            0.8    -0.6       -1.0         -1.3            -3.5   -2½ to -½   -2 to 0
                           GDP %                                            2.6            2.3    2.8        2.3          2.9             2.1       2.5       2.6
                           CPI %                                            2.7            1.7    1.4        1.7          1.9             1.6       2.1       2.1
                           Unemployment rate %                              5.8            6.2    5.9        5.7          5.5             5.1       5.0       4.8
                           Cash Rate %                                     2.50            2.00   1.75       1.50        1.50         1.25         0.75       0.75

  New Zealand              Credit Growth % – Total                          4.4            5.9    7.7        6.5          5.4             5.4      4-6        3-5

                           Credit Growth % – Housing                        5.3            5.4    8.8        7.7          5.9             6.2      4-6        3-5
                           Credit Growth % – Business                       2.8            6.0    7.2        6.2          5.7             5.3      4-6        4-6
                           Credit Growth % – Agriculture                    3.4            7.4    6.0        2.6          2.8             3.1      2-4        2-4
                           GDP %                                            2.7            4.0    3.6        3.4          3.2             2.5       2.8       2.5
                           CPI %                                            1.5            0.6    0.3        1.4          1.5             1.7       1.6       1.6
                           Unemployment rate %                              5.6            5.4    5.2        5.0          4.5             4.2       4.4       4.3
                           Overnight Cash Rate %                           3.25            3.25   2.25       1.75        1.75         1.50         1.00       1.00

Credit Growth             = 12 months to June        World GDP   = Calendar Year Average
GDP, Unemployment & CPI   = Financial year average               = forecast                        Source: ABS, RBA, IMF, StatsNZ, RBNZ
Cash Rate                 = As at June                                                                                                                                 5
Debt Investor Discussion Pack - For the full year ended 30 June 2019 - CommBank
Global growth risks remain elevated
              The global economy has                                            …as trade war risks                                   …and policy uncertainty remains
                     slowed…                                                       escalate…                                                     elevated

 Index                   Global PMI1                                                New Export Orders2                        Index
                                                                                                                                             Global Policy Uncertainty3
    60                                                            65                                                                  (higher readings indicate greater uncertainty)

                                                                                   US                                          300
                       Services               Expansion           60
    56                                                                                                          Expansion
                                                                              (ISM survey)
                                                                  55                                                           200
    52
                                                                  50
                   Manufacturing                                                                                               100
    48                                       Contraction          45                          China            Contraction
                                                                                          (Caixin survey)
    44                                                            40                                                             0
     Jun 11     Jun 13       Jun 15      Jun 17       Jun 19       Jun 14     Jun 15    Jun 16   Jun 17     Jun 18   Jun 19      Jun 99     Jun 03   Jun 07    Jun 11   Jun 15   Jun 19

              But leading indicators are                                    Chinese policy stimulus is                                  Commodity prices have some
                    bottoming out                                                  underway                                                     support

 %            Global Leading Indicator4                           CNY          Special Debt Issuance5                          Index        CBA Commodity Price Index6
6                        (% change)                               $bn               (by local government)                      480
                                                                  2500
5
                                                                  2000                                                         380
4
                                                                  1500                                                         280
3
                                                                  1000
2                                                                                                                              180
                                                                   500
1                                                                      0                                                        80
Jun 11        Jun 13        Jun 15       Jun 17        Jun 19                2016        2017        2018        2019            Jun 00 Jun 03 Jun 06 Jun 09 Jun 12 Jun 15 Jun 18 Jun 21

1. Source: IHS Markit. 2. Source: Bloomberg. 3. Source: PolicyUncertainty.com. 4. Source: Goldman Sachs. 5. Source: CEIC China’s Ministry of Finance. 6. Source: CBA.                      6
Debt Investor Discussion Pack - For the full year ended 30 June 2019 - CommBank
Australia – the economy has slowed
           GDP growth has dipped below                         Progress in reducing unemployment                                   Inflation rates remain
                      trend                                                 has stalled                                                      low

 %
                      GDP Growth1                                           Unemployment Rate1                           %
                                                                                                                                            CPI Growth1
                                                              %

  6                                                            6                                                         6

  4                                                            4                                                         4

  2                                                            2                                                         2

  0                                                            0                                                         0
  Jun 07                    Jun 13                  Jun 19     Jun 07                   Jun 13                 Jun 19    Jun 07                Jun 13              Jun 19

      Consumer spending is soft in the face of                       Residential construction has                                           The drought
       weak incomes and falling house prices                                   peaked                                                        continues
 %           CBA Household Indicators2                       ‘000s        Dwelling Construction1                        %          Agricultural Production1
10                 (annual % change)                                             (rolling annual total)                                (annual % change)
                                           Spending          240                                                         45
 6                                   (ex cash withdrawals)   220                Dwelling                                 35
                                                             200             commencements                               25
 2                                                           180                                                         15
 -2                                          Income          160                                                          5
                                             Wealth          140                                                         -5
 -6
                                                             120                              Building approvals        -15
-10                                                          100                                                        -25
  Jun 16         Jun 17           Jun 18        Jun 19         Jun 86   Jun 93     Jun 00   Jun 07   Jun 14   Jun 21      Jun 03   Jun 07      Jun 11     Jun 15   Jun 19
1. Source: ABS   2. Source: CBA                                                                                                                                             7
Debt Investor Discussion Pack - For the full year ended 30 June 2019 - CommBank
Australia – some positives
 The major economic imbalances continue                                  Population growth remains strong,                               Policy stimulus is coming via interest
               to narrow                                                        supporting demand                                                rate cuts and tax cuts

 %
                      Key balances1,2                               %                     Population1                                             Impact on disposable income3
              (rolling annual total, % of GDP)                                        (annual % change)
                                                                   2.5
 4             Budget Balance           Current account
                                                                   2.0
                                                                                               Long run                                     Tax cuts in 2019/20
                                                                   1.5                         average
 0

                                                                   1.0                                                                                  A 25bpt
 -4                                                                                                                                                     rate cut
                                                                   0.5

 -8                                                                0.0                                                                        $bn                  0   2      4     6   8
  Jun 98           Jun 05            Jun 12            Jun 19            1973/74
                                                                          Jun 79     1985/86
                                                                                     Jun 89        1997/98
                                                                                                  Jun 99   Jun2009/10
                                                                                                               09     Jun 19

                     The LNG boom                                               The infrastructure boom                                       The boost from Asian incomes
                       continues                                                         rolls on                                                       continues
Index            Mining Output by Sector1                          %                Infrastructure Spending1                            %           Asian income growth proxy4
                                                                                          (annual % change)
195
                   Iron ore                                        60                                                                   8
                                                                                                                        Stimulus
                                         Oil and gas                               Economic Infrastructure GFCE     associated with
155                                                                40                                                financial crisis
                                                                                   Social Infrastructure GFCE
                                                                                                                                        4
                              Coal                                 20
115                                                                                                                                     0
                                               Other                0

 75                                                                -20                                                                  -4
  Jun 13            Jun 15            Jun 17              Jun 19         1990      1995    2000      2005    2010      2015              Jun 00     Jun 04    Jun 08       Jun 12   Jun 16
1. Source: ABS. 2. Source: Dept of Finance. 3. CBA. 4. Source: ABS/ CBA.                                                                                                                     8
Debt Investor Discussion Pack - For the full year ended 30 June 2019 - CommBank
New Zealand
       Dairy prices have remained relatively                         NZ’s terms of trade expected to remain                              Inflation is likely to range between 1-2%
              steady since late 2016                                           near record highs                                                     over next few years
            Global dairy trade auction results1                       Index                    NZ Terms of Trade2                        %                    NZ CPI inflation3
                            (USD/tonne)
                                                                      1500                                                                6
6,000                                                                                                                                                                                             (f)
                                    Whole Milk Powder                                                                                     5                                    Annual %
5,000                                                                 1300                                                                4
4,000                                                                                                                                     3
                                                                      1100
                                                                                                                                          2
3,000
                                                                                                                                          1
                                                                       900
2,000             GDT overall                                                                                                             0
                                                                                Source: Statistics NZ
1,000                                                                  700                                                               -1                             quarterly change
       2008 2009 2010 2011 2012 2013 2014 2015 2016 2017 2018 2019           57 62 67 72 77 82 87 92 97 02 07 12 17                          2000     2004       2008       2012      2016       2020

 Expect RBNZ to cut OCR to 1% by the end                              Home lending growth steadied in 2018                               House prices down in Auckland, flat in
                 of 2019                                                   after decelerating in 2017                                    Christchurch, growing in other regions
                        OCR Forecasts4                                           NZ household lending growth5                                           NZ median house price6
   %       (ASB forecast and implied market pricing)                 %                                                                   $ 000's
                                                                                                 (annual % change)                                       (3 month moving average)
 4.0                                                                 20                                                                  1000
                                                                                                                                          900                                Auckland
 3.2                                                                 15
                                                                                                                                          800
                                                                     10                           Mortgage lending
                                  OCR implied by current                                                                                  700                                       Wellington
 2.4                                 market pricing                   5                                                                   600
                                                                                                                                                                                    NZ
                                                                      0                                                                   500
 1.6                                                                                                                                      400
                                                                      -5
                                                                                                             Consumer Credit              300                            Canterbury/Westland
 0.8                                                                 -10                                                                  200
   Jun 13 Jun 14 Jun 15 Jun 16 Jun 17 Jun 18 Jun 19 Jun 20             Jun 04       Jun 07          Jun 10    Jun 13   Jun 16   Jun 19        Jun 05 Jun 07 Jun 09 Jun 11 Jun 13 Jun 15 Jun 17 Jun 19

1. Source: GlobalDairyTrade. 2. Source: Stats NZ. 3. Source: Stats NZ/ASB. 4. Source: ASB. 5. Source: RNBZ/ASB. 6. Source: REINZ.                                                                       9
Debt Investor Discussion Pack - For the full year ended 30 June 2019 - CommBank
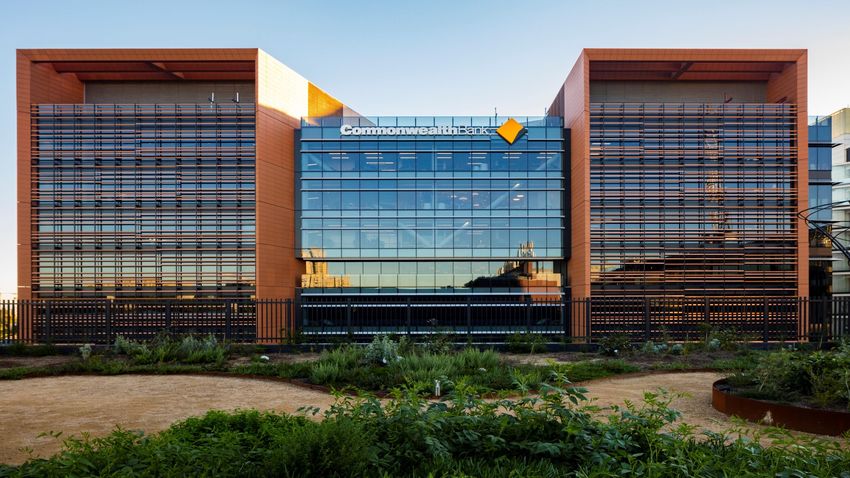
2 Results Summary

Commonwealth Bank, South Eveleigh building, NSW     Commonwealth Bank of Australia | ACN 123 123 124 | 7 August 2019   10
FY19 – result overview1
   Financial                                                                                       Balance Sheet, Capital & Funding

  Statutory NPAT2 ($m)                            8,571                     (8.1%)                Capital – CET12,4(Int’l)                                16.2%                     70 bpts

  Cash NPAT3 ($m)                                 8,492                     (4.7%)                Capital – CET12 (APRA)                                  10.7%                     60 bpts

  ROE3 % (cash)                                    12.5                   (110)bpts               Total assets ($bn)                                         977                     0.1%

                                                                                                  Total liabilities ($bn)                                    907                       Flat
  EPS3 cents (cash)                                 481                       (29c)
                                                                                                  Average FUA3 ($bn)                                         163                     6.0%
  DPS2      $                                      4.31                        Flat
                                                                                                  Deposit funding                                            69%                     1.0%
  Cost-to-income3 (%)                              46.2                    210bpts
                                                                                                  LT wholesale funding WAM                                5.1 yrs                      Flat
  NIM3 (%)                                         2.10                     (5)bpts
                                                                                                  Liquidity coverage ratio5                                132%                      -1.0%
  Op income3 ($m)                                24,407                     (2.0%)
                                                                                                  Leverage ratio (APRA)                                     5.6%                    10 bpts
  Op expenses3 ($m)                              11,269                       2.5%                Net stable funding ratio                                 112%                        Flat

  LIE to GLAA (bpts)                                 16                       1bpt                Credit Ratings6                                    AA-/Aa3/AA-                  Refer footnote 6

1. All movements on prior comparative period unless otherwise stated. 2. Includes discontinued operations. 3. Presented on a continuing operations basis. 4. Internationally comparable capital - refer
glossary for definition. 5. Quarter average. 6. S&P, Moody’s and Fitch. S&P revised Australian Major Banks outlook to “Stable” from “Negative” on 9 July 2019. Moody’s lowered the rating on 19 June
2017, outlook “Stable”. Fitch updated outlook on CBA to negative on 7 May 2018.
                                                                                                                                                                                                     11
Franchise strength

            Group Lending                                                    Lending Growth2                                            Home Lending Growth
                                                                                                                                   CBA growth as a multiple of system growth4

                                 +2%                                  +4%               +4%             (12%)                                                                1.3x

                                   760                                                                                                                   0.9x
            747                                                       Home            Business          Insto.
                                                                     Lending          Lending 3        Lending                     0.6x
 $bn

          Jun 18                 Jun 19                                                                                          Jun 18                Dec 18               Jun 19

          Group Deposits5                                             Transaction Balances5                                                    Deposit Funding

                                  +2%                                                                    +9%                                                                 69%
                                    635                                                                 169,648                                          69%
             621                                                                                                                    68%
                                                                                     162,767
                                                           $m
                                                                  155,147
 $bn

           Jun 18                 Jun 19                           Jun 18            Dec 18             Jun 19                     Jun 18              Dec 18                Jun 19
1. Spot balances. 2. Jun 19 vs Jun 18. 3. Includes NZ. 4. Growth over 6 month period. System source: RBA Lending and Credit Aggregates, adjusted for new market entrants. CBA includes
Bankwest and subsidiaries. 5. Includes non-interest bearing deposits.                                                                                                                    12
Franchise strength1

                Home Lending2                                              Business Lending                                                Household Deposits2
                    Volume growth                                                  Volume growth                                                       Volume growth
                        System    CBA                                                    System    CBA                                                  System   CBA
                                         annualised                                                       annualised                                                   annualised
                                                                                                                                    5.0%
         3.4%      3.7%                 3.1%      3.9%                                                                                         4.1%
                                                                         4.0%                            2.5%                                                      2.5%       1.3%
                                                                                 -3.6%                          -4.0%

            12 Months                      6 Months                        12 Months                        6 Months                       12 Months                     6 Months
             Jun 19                         Jun 19                          Jun 19                           Jun 19                         Jun 19                        Jun 19

34%                  Market share                                                      Market share                           34%                       Market share
                                                                32%

30%                                                             28%                                                           30%
                                                                                                     Includes IB&M                                                                  28.1%
                                                                24%
26%                                                                                                                           26%
                                                      24.4%     20%
                                                                                                                              22%                                                   23.0%
22%                                                   22.8%     16%

18%
                         CBA            Peers                   12%                               CBA             14.4%       18%                       CBA          Peers
                                                      14.4%       8%
                                                                                                                                                                                    14.1%
                                                                                         (peers unavailable)                  14%
14%
                                                      14.0%       4%
                                                                                                                                                                                    12.6%
10%                                                               0%                                                          10%
  Jun 07                                         Jun 19                Jun 07                                   Jun 19           Jun 07                                         Jun 19

1. Market share sources: RBA Lending and Credit Aggregates and APRA Monthly Banking Statistics. CBA includes Bankwest and subsidiaries. Comparatives have been updated to reflect market
restatements. Business lending excludes CMPF. 2. System adjusted for new market entrants.                                                                                                   13
Best in digital

    A global mobile banking leader                                          Recognition and engagement                                             CommBank app users
      Forrester Banking WaveTM: Global Mobile Apps                                                                                                    Monthly unique customers (m)8
                    Asia Pacific 20181                                                 Mobile app
                                                                          #1           Net Promoter Score2                                                                                 5.6m
                                                                                                                                                                           5.3
                                                                                       Online banking                                                          4.4 4.8 5.0
                                                                          #1           (Canstar - 10 years in a row)3                          3.0 3.4
                                                                                                                                                       3.7 4.1

                                                                                       Mobile banking                                         Jun Dec Jun Dec Jun Dec Jun Dec Jun
                                                                          #1           (Canstar - 4 years in a     row)4                       15 15 16 16 17 17 18 18 19

                                                                                       Ranked in Australia                                            Digital transactions
                                                                          #1           (Forrester)5                                                  % of total transactions - by value9

                                                                                                                                                                                           63%
                                                                                       Most Innovative Major Bank
                                                                          #1           (DBM Australian Financial Awards)6
                                                                                                                                                51    52    52    53   54    56    59    60

                                                                                       Best Major Digital Retail Bank
                                                                          #1           (DBM Australian Financial Awards)7
                                                                                                                                                Jun Dec Jun Dec Jun Dec Jun Dec Jun
                                                                                                                                                15 15 16 16 17 17 18 18 19

1, 2, 3, 4, 5, 6, 7, 8, 9. Refer to notes slide at back of this presentation for source information. 1. The Forrester Banking Wave™ is copyrighted by Forrester Research, Inc. Forrester and Forrester
Wave™ are trademarks of Forrester Research, Inc. The Forrester Banking Wave™ is a graphical representation of Forrester's call on a market. Forrester does not endorse any company, product, or
service depicted in the Forrester Banking Wave™. Information is based on best available resources. Opinions reflect judgment at the time and are subject to change.                                    14
Operating income down 2.0%1

         •   Core volume growth                                         •   Better Customer Outcomes - fee removals                              (118)
         •   Margin -5bpts (flat 2H19)                                  •   Institutional lending fees - AASB 15                                  (73)

                                            -1.2%                                                       •    NSW/Vic storms, Qld floods
                                                                                                        •    Lower advice fees
              24,914                                                                                    •    FUA growth +6.0%
                                                 (222)                      -3.9%

                                      Volume Growth2
                                                                                                                                                                     -2.0%
                                                                             (194)                          -10.2%
                                  Home Loans      3%
                                  Transactions           7%     Better Customer Outcomes                     (138)
                                                                             $m                                                            47
                               Business Loans      4%                                415
                                                                                                                                                                      24,407
                                                                            275       220
                                  Insto. Loans    -8%                        90
                                                                                            NII & FMI
                                                                  70
                                                                   3        185       195   OBI
                                                                  67
    $m                                                           FY18       FY19   Annualised

               FY18                           Net                            Other                       Funds &                   Mortgage                            FY19
                                            Interest                        Banking                     Insurance                   Broking
                                            Income 3                        Income 3                                              Consolidation 4
1. Presented on a continuing operations basis. 2. Average balances. 3. Excludes Mortgage Broking consolidation. 4. Includes impact of AHL consolidation and implementation of AASB 15.
                                                                                                                                                                                         15
Group margin1

  bpts                                                     bpts

             Last 5 halves                                                                          This half

              216                                                                                                                                  Flat
                         214
    210                            210        210
                                                                                 1               (1)               1               (1)
                                                              210                                                                                  210           FY20 Headwinds
                                                                                                                                                                                          bpts
                                                                           Home Loans:                         Higher            Lower
                                                                           Switching   (2)                    deposit           earnings                         AASB 16                    (1)
                                                                           Discounting (2)                    funding            on free
                                                                                                                                                                     Cash Rate2             (4)
                                                                           SVR         +4                                        equity

                                                                           Lending Mix           +1

  2H17 1H18 2H18 1H19 2H19                                   1H19           Asset Deposit Portfolio Capital                                       2H19
                                                                            Pricing Pricing Mix      and
                                                                                                    Other
1. Presented on a continuing operations basis. Comparative information has been restated to conform to presentation in the current period. 2. Estimated impact of the RBA’s cash rate cuts in June
and July 2019 on Group NIM, including the deposits impact, lower expected replicating portfolio and equity hedge benefits, and flow through of announced home loan repricing. Excludes impact of
any future cash rate movements.                                                                                                                                                                      16
Group margin

                                     Basis Risk                                                       Replicating Portfolio (RP) & Equity Hedge
                                Every 5 bpts = 1 bpt of NIM1                                                                                 Equity and Deposit Hedge
                                                                                                                                             Jun 19   2H19         Exit        Average
                                                                                                                                             Balance   Avg.      Tractor2    investment
                                                                                                                                               $bn   Tractor2     Rate          term
1.0%                                                                                               8.0%
                                                                                                                             Equity Hedge      46        2.17%   2.06%      3 yrs

                                                                                                                             Deposit Hedge     67        2.26%   2.22%              5 yrs

                                                                                       FY19

                                                                                                                                                            RP Hedge            FY19
0.5%                                                                                               4.0%                                                       Rate
                                                                                                                               3M BBSW
                                               Avg 28bpts
                                                                                                                      RBA Official
                                                                                                                      Cash Rate
                                                                                                                                                      Cash Rate Forecast
                                                                                                                                                       (Market Implied)
0.0%                                                                                               0.0%      Jul 07                                                                    Jul 19

    Jun 07                                                                           Jun 19            Jun 07                                                                 Jun 19
1. Includes the impact of basis risk on replicating portfolio. 2. Tractor is the moving average hedge rate on equity and rate insensitive deposits.                                             17
Operating expenses up +2.5%1

                                                                                                                                                      Strategic Targets
                                              Notable                                                              +2.4%                         •   Absolute cost reduction
                                               items                                                           (ex notable items)                •   Sub 40% Cost:Income

  12,000
                                                                                                                                                                         +2.5%
                                                                                              158                       259                     (190)
                                                                                                                                                                          11,269
  11,000

           10,995                      (930)                       977
  10,000

                                                      Remediation +$866m                    +600 FTE
   9,000

                                                      +450 FTE
                                                                                                    Wage inflation and IT increases
   8,000

                               ($700m) AUSTRAC penalty     prior period
                               ($155m) Regulatory Costs                                                            • Business simplification
   7,000

                               ($145m) AUSTRAC insurance                                                           • Optimising distribution footprint
  $m                             $70m Mortgage Broking Consolidation                                               • Operating model & cost discipline
   6,000

             FY18                  Prior period             Customer                     Enhanced                Staff, IT, and               Business                      FY19
                                    one-offs/            Remediation, Risk             risk capability            Other excl.               Simplification
                                                                                                                                4
                                      Other 2             & Compliance                                           notable items
                                                            programs 3
1. Presented on a continuing operations basis. 2. Prior period = FY18. 3. Represents FY19 total customer remediation costs of $996m ($918m recognised in continuing operations operating
expenses), less FY18 total customer remediation costs of $131m ($52m recognised in continuing operations operating expenses). Also includes movement in risk and compliance programs of
$111m. 4. Excludes staff, IT and other costs related to notable items, enhanced risk and resiliency capability and simplification.
                                                                                                                                                                                           18
Credit risk

     Loan Loss Rate1 - Group                                     Loan Loss Rate1 – Divisions                                                            TIA
                                                                                                                                 • Single name exposures
         Consumer                              17
                                                               BPB – Small number of larger impairments                          • Emerging signs of weakness -
         Corporate                             14
                                                               IB&M – Ongoing portfolio optimisation                               discretionary spending, agriculture
         Group                                 16                                                                                  and construction
  73
                                                                                                                                    % of
                                                                        bpts                  FY18          FY19                    TCE       0.60%        0.62%           0.72%

                                                                        RBS                      16             17
                                                                                                                                     $bn                                   7.8
         41                                                             BPB                      14             21                               6.5          6.7
              25                                                                                                                                                            3.6
                                                                        IB&M                        7             2                    Gross
                                                                                                                                                  3.2          3.6
                   21 20               19                                                                                            impaired
                            16 16           15 15 16
                                                                        ASB                      10             13                  Corporate
                                                                                                                                                  3.3                       4.2
                                                                                                                                 troublesome                   3.1
                                                                        Group3                   15             16
     2
                                                                                                                                                Jun 18      Dec 18         Jun 19

1. Cash Loan Impairment Expense as a percentage of average Gross Loans and Acceptances (GLAA) (bpts). 2. FY09 includes Bankwest on a pro-forma basis. 3. Includes Other.            19
Credit risk – consumer credit quality & provisions

 %                                          Arrears1                                                            $m            Collective Provisions
                                              90+ days                                                                                Provision Coverage3

 Personal Loans                                                                                                                0.75%                     1.05%
    1.41%                                           1.44%                                       1.56%
                                                                                                                                                          3,904
                           1.21%                                               1.44%
 Credit Cards
    1.03%                                           1.03%                                                                       2,763
                            0.88%                      v                                           v                                                       2,416        Consumer
                                                                                                 1.02%
                                                                               0.94%                                            1,528
  Home Loans2
                                                     0.70%                     0.67%             0.68%
     0.60%                  0.59%                                                                                                                         1,488        Corporate
                                                                                                                                1,235

       Jun 17                Dec 17                 Jun 18                 Dec 18                 Jun 19                      Jun 18                    Jun 19
                                                                                                                             AASB 139                   AASB 9

1. Group consumer arrears including New Zealand. 2. Excludes Reverse Mortgage, Commonwealth Portfolio Loan and Residential Mortgage Group loans. 3. Collective provisions divided by
credit risk weighted assets.                                                                                                                                                           20
A simpler bank – divestments/reviews

 Sovereign                                         Completed Jul 18
 TymeDigital                                       Completed Nov 18                                                                        CET1

 CFSGAM                                            Completed Aug 19                                                                                   11.8%
                                                                                                                                10.7%
 BoCommLife                                        Expected Completion 1H20                                                                           Includes
                                                                                                                                                    divestments1
                                                                                                                                 10.5%
 CommInsure Life                                   Expected Completion 1H20                                                   Unquestionably        ~130bpts
                                                                                                                                 strong
 PTCL                                              Expected Completion 1H20                                                                        Pro-forma2
                                                                                                                               Jun 19
 Aligned Advice:
  - Count Financial                                Expected Completion 1H20
                                                                                                                                    Group NPAT FY19
  - Financial Wisdom                               Assisted Closure
  - CFP-Pathways                                   Cessation
 General Insurance                                 Strategic Review
                                                                                                                                                        Core
 VIB                                               Strategic Review
                                                                                                                                                       ~95%
 CFS & Mortgage Broking3                           Intention to exit
1. Completion of divestments subject to regulatory approvals. The sale of BoCommLife is a condition precedent for the sale of CommInsure Life. Expected completion dates in financial
years. 2. Pro-forma includes divestments of CFSGAM, BoCommLife, CommInsure Life, PTCL and the impact of regulatory changes. 3. Includes Colonial First State, Aussie Home Loans
(AHL) and CBA’s minority shareholding in ASX-listed Mortgage Choice.                                                                                                                    21
Investment spend1

                               Investment spend                                 FY19 vs                  Investment spend                       FY19 vs
                                                                                 FY18:
                                             $m                                                                      $m                          FY18:
                                                             1,399                +9%                                             1,399           +9%
                           1,282                                                                                                                          Total
                                                                                                         1,282

    1st Half                 597                              676                +13%                                              603            (1%)    Capitalised
                                                                                                          611

                                                                                  +6%                                                            +19%       Expensed
    2nd Half                 685                              723                                         671                      796

                           FY18                              FY19                                        FY18                     FY19
                               Investment spend                                                         Capitalised software balance
                                          % of total                                                                        $bn           Average amortisation
   Branches &                                                                                               2.23
                                                             9%                                                                             period 3.9 years
        Other                 12%                                                                2.09
 Productivity &                                             27%                                                            1.93
      Growth
                              38%
                                                                                                                                         1.82
                                                                                                    Average amortisation
                                                                                                                                                     1.71
                                                                                                      period 5.0 years
      Risk &                                                 64%
   Compliance                 50%

                             FY18                           FY19                                 FY15      FY16            FY17      FY18           FY19
1. Comparative information has been restated to conform to presentation in the current period.                                                                          22
3 Funding, Liquidity
        and Capital

“with
  We have maintained our strong funding position
      the highest share of stable household deposits
                     in Australia
                                  ”
Funding overview
     Resilient balance sheet with ongoing                           Stable wholesale funding composition                                    ...with a >5.0yrs WAM to reduce
           customer deposit growth                                    weighted to longer term funding…                                               refinancing risk

                      Deposit Funding                                              Long Term Funding                                                    Long Term Funding WAM
                                                                                % of total wholesale funding                                                       Tenor, years

                                        68%        69%                                                   67%         66%
                  66%        67%                                                 58%         60%                                                                                         5.1             5.1
      63%                                                            52%
                                                                                                                                                         4.1            4.1
                                                                                                                                      3.8

     Jun 15      Jun 16    Jun 17      Jun 18     Jun 19            Jun 15      Jun 16      Jun 17      Jun 18      Jun 19         Jun 15               Jun 16       Jun 17         Jun 18              Jun 19

            Efficient balance sheet mix                             …and a sound liquidity position with a                        …allowing for a reduction in wholesale
           supporting a strong NSFR…                                       stable LCR at 132%...                                             funding in FY19

                              NSFR                                                             LCR1                                                     Sources and Uses of Funds
             Regulatory
                                                                                                                                                               12 months to Jun 194
            requirement       112%               112%
          from 1 Jan 18                                                                     135%
                                                                                                       133%        132%                           22
                                                                                                                                                            (33)       Funding Gap
                                                                                                                                     2
                                                                                124%                                                                                     9        (12)                     8
           107%                                                      121%                                                                     $11bn                                              3
                                                                                                                                            reduction

          Jun 17             Jun 18              Jun 19             Jun 15      Jun 16     Jun 17      Jun 18     Jun 19           Equity      Long Term Long Term Customer      Lending       Liquid     Other 3
                                                                                                                                               Issuances Maturities 2 Deposits                 Assets

1. Quarter Average. 2. Reported at historical FX rates. 3. Includes $5.3bn FX revaluation. 4. Numbers do not sum to zero due to rounding.
                                                                                                                                                               24
Deposit funding

                   Deposit Funding                                                   Deposits vs Peers1                                               Deposits in NSFR5
                                                                                                   $bn                                                As at 30 June 2019 ($bn)
                                                     69%                          499                                                                Peers as at 31 March 20196
                                          68%                                                  426
                             67%                                      Other                                 343                       250
                                                                    deposits      235                                                                                                  CBA
                  66%                                                                          211                          273                                                        Peer 1
                                                                                                             211
                                                                 Household                                                   155                                                       Peer 2
      63%                                                                         264          215                                    200                                              Peer 3
                                                                   deposits                                  132             118                          CBA
                                                                                                                                                       overweight
      Jun 15     Jun 16      Jun 17     Jun 18      Jun 19                       CBA          Peer 3       Peer 2          Peer 1
                                                                                                                                                       more stable
                                                                                                                                                        deposits
                                                                                                                                      150
      Group Transaction Balances2                                            New Transaction Accounts3
                               $m                                                             # ‘000       Retail Deposit Mix4
                                                    9.3%                                                           $bn
                                                                                                                                      100
                                                                                                                       Transactions
                                                    4.2%                                                    Savings &      57.5
                                                                                                           Investments
                                                                                                              121.2     Online
                                                                                                                         65.4
                                                 169,648                                                                              50
                           162,767                                           604
                                                                                                575                  589
      155,147
                                                                                                                                       0
        Jun 18               Dec 18               Jun 19                    2H18                1H19                2H19                        Stable Deposits         Less Stable Deposits

1. Source: APRA Monthly Banking Statistics. Total deposits (excluding CD’s). CBA includes Bankwest. 2. Includes non-interest bearing deposits. 3. Number of new personal transaction accounts,
excluding offset accounts, includes CBA and Bankwest. 4. Transactions includes non-interest bearing deposits and transaction offsets. Excludes business deposits. Online includes NetBank Saver,
Goal Saver, Business Online Saver, Bankwest Hero Saver, Smart eSaver and Telenet Saver. Savings and Investment includes savings offset accounts. 5. Stable and less stable deposits in NSFR
calculation. Excludes operational deposits, other deposits and wholesale funding. 6. Source: 31 March 2019 Pillar 3 Regulatory Disclosures; CBA reported as at 30 June 2019.                       25
Wholesale funding

                                      Portfolio Mix                                                                       Short Term funding by product¹

                                                                                                             Certificate of Deposits                                                    46%
      Short term
                          33%                34%                34%
       funding¹
                                                                                                                 Commercial Paper                                  24%

                          67%                66%                66%                                                       FI Deposits                            22%
       Long term
       Funding2            5.1               5.0                5.1
                          WAM                                  WAM3                                                               MTN            5%
                                            WAM
                                                                                                                                 Other         3%
                         Jun 18             Dec 18             Jun 19

                  Long Term funding by currency2                                                                           Long Term funding by product2

              Jun 19                                                                                                    Senior Bonds                                             52%
                                                                             AUD
              Jun 18                                                                                                 Covered Bonds                        20%
                                                                             USD
              Jun 17                                                                                                                     4
                                                                                                                               AT1/T2                 14%
                                                                             EUR
              Jun 16
                                                                             OTH                                        Securitisation           7%
              Jun 15
                                                                                                                     Structured MTN              7%
                       0%                   50%                  100%
1. Includes the categories ‘central bank deposits’ and ‘due to other financial institutions’. 2. Includes IFRS MTM and derivative FX revaluation, and includes debt with an original maturity or call date
of greater than 12 months (including loan capital). 3. Represents the weighted average maturity of outstanding long term wholesale debt with a residual maturity greater than 12 months at 30 June 19
                                                                                                                                                                                                           26
4. Additional Tier 1 and Tier 2 Capital.
Long term funding

        Group FY19 benchmark issuance                                                             New term issuance                                           New term issuance
       Date        Entity      Type
                                           Tenor   Volume      Spread at Issue                       by currency                                                   by tenor
                                            (yr)     (m)           (bpts)
   Jul 18          CBA       GBP Senior     3       GBP 250   3m GBP Libor +45                                   25%                                   23%           21%
   Jul 18          CBA      USD Covered     5      USD 1,250       MS +40                              38%                     42%
                                                                                           44%                                                                                               45%     >5 years
   Aug 18          CBA       AUD Senior    3, 5    AUD 3,500 3m BBSW +73 / 93                                                                                                  50%
   Sep 18          ASB       NZD Senior     5       NZD 450      BKBM +102                                                               AUD                                                         5 years
   Sep 18          CBA       AUD RMBS      6.8     AUD 1,630   1m BBSW +132                                                                            32%
                                                                                                                 41%                     USD                         43%
   Oct 18          ASB      EUR Covered     7       EUR 500        MS +16                                                                                                                            4 years
                                                                                                       35%                     24%       EUR
   Dec 18          CBA       AUD Tier 1    5.4     AUD 1,500   3m BBSW +370                33%
                                                                                                                                         Other         12%                     27%                   3 years
   Jan 19          CBA      AUD Senior      5      AUD 2,500   3m BBSW +113                                                                                                                  40%
   Jan 19          ASB       CHF Senior     6       CHF 200        MS +58                                                                                            16%                             2 years
                                                                                                       15%       23%           23%
   Feb 19          CBA      EUR Covered     10     EUR 1,000       MS +29                  11%                                                         30%                     12%
   Feb 19          ASB       NZD Senior     3       NZD 500       BKBM +83                                                                                           13%                             1 years
                                                                                           13%         13%       10%           10%                                      3%     10%           12%
   Feb 19          CBA       USD Senior    5.25    USD 1,250 T +88, 3m USDL +82                                                                         3%            3%        1%            3%
   Mar 19          ASB       EUR Senior     5       EUR 500        MS +70
                                                                                           FY16        FY17     FY18          FY19                    FY16          FY17      FY18       FY19
   May 19          ASB       USD Senior     5       USD 500         T +100
                                                                                                                       Chart totals do not add to 100% due to rounding.

          Indicative funding cost curves                                          $bn                        Issuance                                                        Maturity
                              Margin to BBSW (bpts)                                                                                                                Weighted average maturity 5.1 years1
160
                                                                          126
                                          108       112        115
120                                                                       112                                                                                                                        54
                             90                    100        102                                                 44
                                          89                              111       38
                                                               95                                         38                                                                  35
  80                         65                     92                                            31                            33                       32
              56                          82                                                                                                22                       20                 17
  40          40             63
                                          Jun 18          Dec 18      Jun 19
              25
   0
          1 year            2 year    3 year       4 year    5 year   10 year     Jun 14     Jun 15     Jun 16   Jun 17   Jun 18  Jun 19              Jun 20     Jun 21   Jun 22      Jun 23       > Jun 23
                                                                                                          Long Term Debt²   Covered Bond              Securitisation    AT1 / T2³
1. Represents the weighted average maturity of outstanding long term wholesale debt with a residual maturity greater than 12 months at 30 June 2019. 2. Includes Senior Bonds and Structured                    27
MTN. 3. Additional Tier 1 and Tier 2 Capital.
Capital overview

                                                                                                                                                                       CET1                                                                                                                 CET1                                                                                                                                 CET1
                                                                                                                                                                       433%                                                                                                                                                                                                                                             International
                                                                                                                                                                                                                                                                                            APRA

                                                                                                                                                                                                                                                                                            10.8%                                       10.7%                                                                                 16.5%                                               16.2%
                                                                                                                                                                       Assets                                                         10.1%                                                                                                                                          15.5%
                                                                                                                                                                       122%

               2007           2009               2011                             2013                          2015                                       2017                     2019                                                     Jun 18                                          Dec 18                                     Jun 19                                       Jun 18                                       Dec 18                                          Jun 19

                                                                                                                                                                        International CET1 ratios
16.9 16.3
               16.2 16.2
                             14.8 14.8 14.6 14.6 14.5 14.3                                                                                                                                                                                                                                                                                                                                                                    G-SIBs in dark grey
                                                                                         13.9 13.8 13.7 13.7 13.4
                                                                                                                                                                       12.8 12.6 12.4 12.3 12.2 12.2 12.2
                                                                                                                                                                                                                                                                        12.0 12.0 11.9 11.9 11.8 11.8 11.7 11.6 11.4 11.4 11.4
                                                                                                                                                                                                                                                                                                                                                                                                                                              11.3 11.2 11.1
                                                                                                 China Construct. Bank

                                                                                                                                                                                                                                                                                                                                                                                                                                                                                                10.3

                                                                                                                                                                                                                                                                                                          China Merchants Bank
                                                                                                                                     Standard Chartered2
                                                               Intesa Sanpaolo2
        RBS2

                                                                                                                                                                                                                                                                                                                                                                                                       Agric. Bank of China
 ANZ1

                                                                                                                                                                                                                                                                         Toronto Dominion
                                                                                                                                                                                                                                                  Credit Agricole SA2
                CBA

                                                                                                                                                                                                                                                                                                                                                                                                                                                                                                                   8.2

                                                                                                                                                                                                                                                                                                                                                      Bank of America

                                                                                                                                                                                                                                                                                                                                                                                                                                               Bank of Montreal
                                                                                                                                                                                                                                   BNP Paribas2
                                                                                                                                                                               Credit Suisse2
                      WBC1

                                                                                                                                                                                                                                                                                                                                                                                                                                                                  Bank of Comm.

                                                                                                                                                                                                                                                                                                                                                                                                                                                                                                 Sumitomo Mitsui
                              Nordea

                                                                                                                                                                                                                                                                                                                                                                                                                              Bank of China
                                                     Lloyds2

                                                                                                                                                                                                                                                                                                                                                                                      Mitsubishi UFJ
                                                                                                                                                                                                             SocGen2
                                                                                                                         Barclays2
                                       ING2

                                                                                                                                                                                                                       JP Morgan
                                                                                                                                                            Deutsche
                                                                                          UBS2

                                                                                                                                                                                                                                                                                            Wells Fargo
                                                                                  HSBC

                                                                                                                                                                                                UniCredit2

                                                                                                                                                                                                                                                                                                                                                                        Santander2
                                              NAB1

                                                                                                                                                                        ICBC

                                                                                                                                                                                                                                                                                                                                        BBVA2

                                                                                                                                                                                                                                                                                                                                                                                                                                                                                   Scotiabank
                                                                                                                                                                                                                                                                                                                                 Citi

                                                                                                                                                                                                                                                                                                                                                RBC

                                                                                                                                                                                                                                                                                                                                                                                                                                                                                                                   Mizuho
Source: Morgan Stanley and CBA. Based on last reported CET1 ratios up to 1 August 2019 assuming Basel III capital reforms fully implemented. Peer group comprises listed commercial banks
with total assets in excess of A$800 billion and which have disclosed fully implemented Basel III ratios or provided sufficient disclosure for a Morgan Stanley estimate.
1. Domestic peer figures as at 31 March 2019. 2. Deduction for accrued expected future dividends added back for comparability.
                                                                                                                                                                                                                                                                                                                                                                                                                                                                                                                            28
CET1 – internationally comparable

 bpts                  Internationally Comparable1 CET1                                   CET1 APRA                                  10.7%
                                                                                          Equity investments                         1.0%

                                                                                          Capitalised expenses                       0.1%

                                                                                          Deferred tax assets                        0.4%
    16.5%                (99)              110              (49)
                                                                          8      16.2%    IRRBB RWA                                  0.3%

                                                                                          Residential mortgages                      2.1%

                                                                                          Other retail standardised exposures        0.1%

                                                                                          Unsecured non-retail exposures             0.4%

                                                                                          Non-retail undrawn commitments             0.3%

                                                                                          Specialised lending                        0.7%

                                                                                          Currency conversion                        0.1%

                                                                                          CET1 Internationally Comparable            16.2%
      Dec 18          Dividend            Cash              RWA          Other   Jun 19                                              18.7%
                                                                                          Tier 1 Internationally Comparable
       Int'l        (net of DRP)          NPAT                                    Int'l
                                                                                          Total Capital Internationally Comparable   22.1%
1. Internationally comparable capital - refer glossary for definition.                                                                       29
Leverage ratio

    Leverage ratio introduced to constrain the build-up of leverage in                                    $m                                                                            Jun 19
                          the banking system.
                                                                                                          Tier 1 Capital                                                                      57,355

                    Leverage ratio = Tier 1 Capital                                                       Total Exposures                                                                 1,023,181
                                    Total Exposures
                                                                                                          Leverage Ratio (APRA)                                                               5.6%

                                                                                                           $m                                                                           Jun 19
             6.3%                        6.4%                     6.5%
                                                                                                          Group Total Assets                                                                976,502
  5.5%                       5.6%                      5.6%                       Proposed
                                                                                3.5% APRA                 Less subsidiaries outside the scope of regulatory
                                                                                                                                                                                           (18,064)
                                                                                  minimum                 consolidations
                                                                                (1 Jan 2022)              Add net derivative adjustment                                                        4,317

                                                                                  3% Basel                Add securities financing transactions                                                     304
                                                                                 Committee
                                                                                  minimum                 Less asset amounts deducted from Tier 1 Capital                                  (21,002)
                                                                                (1 Jan 2018)
                                                                                                          Add off balance sheet exposures                                                    81,124
        Jun 18                   Dec 18                      Jun 19
                                                                 1
                     APRA                   International                                                 Total Exposures                                                                1,023,181

1. The Tier 1 capital included in the calculation of the internationally comparable leverage ratio aligns with the 13 July 2015 APRA study entitled “International capital comparison study”, and
                                                                                                                                                                                                          30
includes Basel III non-compliant Tier 1 instruments that are currently subject to transitional rules.
APRA’s LAC proposal

                                                                                    •   Additional 3% of RWA in Total Capital
                                                        18.0%                           applicable to all domestically systemically
                                                                                        important banks (D-SIBs) by 1 January 2024.
                                                                Capital Surplus
                            15.5%                                                   •   This represents additional A$13.6bn of Total
15.0%
                                                        14.5%                           Capital requirement for CBA.
                                         Tier 2
        Capital Surplus                                            Capital          •   Over the next four years, APRA will consider
                            12.7%                                Conservation
                                                                    Buffer
                                                                                        feasible alternative methods for raising
11.5%                               Additional Tier 1
                                                        11.0%
                                                                                        additional 1-2% of RWA, in consultation with
           Capital          10.7%
         Conservation                                                                   industry and other stakeholders.
            Buffer
                                                                     Tier 2
8.0%                                                                                A$bn                                        Jun 19
             Tier 2
6.0%                                                                                Risk Weighted Assets                         452.8
        Additional Tier 1                CET1           6.0%    Additional Tier 1
4.5%                                                    4.5%                        Additional Total Capital requirement @ 3%      13.6

             CET1                                                    CET1           Tier 2 buffer above 2.0% (30 June 2019)         3.7

                                                                                    AT1 buffer above 1.5% (30 June 2019)            2.2
          Current                        CBA                       2024             LAC shortfall as at 30 June 2019                7.7
        Requirements                    Jun 19                  Requirements

                                                                                                                                          31
APRA’s LAC proposal

A$bn
                                                                   •   Continue to hold a strong, stable capital position with A$69bn
                                         Tier 2
                                                                       of loss absorbing capital underpinning Tier 2 issuance.
                                         12.8
                                                                  Actions to Strengthen Capital Levels;
                                                                  • Capital actions CBA may implement to increase capital levels
                                    Additional Tier 1
                                           9.0
                                                                      before reaching the Capital Trigger:
                                                                         DRP discount or underwrite
        Potential loss absorption

                                                                         Reducing dividend payout
                                                                         Share issue
                                                                         RWA growth restrictions
                                         CET1
                                                            $69bn        Expense management
                                         48.4
                                                                  Capital Conservative Buffer (CCB)
                                                                  • Distribution of earnings restricted, including ordinary share
                                                                      dividends and buy backs, discretionary bonuses and AT1
                                        FY19        1                 coupon payments.
                                       Earnings
                                         11.9                       AT1 Conversion Trigger
                                         CBA                        • Mandatory conversion to equity or write-off of AT1 securities
                                        Jun 19                        if CET1 capital ratio is equal to or less than 5.125% of RWA.

1. FY19 Profit before tax presented on a continuing basis                                                                               32
RBNZ capital proposal

   RBNZ proposed capital requirement changes

                                16.0%             18.0%                       •   Potential capital increase in ASB of ~NZ$3bn,
                             Minimum                                              assuming current balance sheet size and
                                                    2.0%       Tier 2
                                Tier 1                                            composition.
                                                    1.5%       AT1
                                                               CCYB Buffer
                                                                              •   RBNZ expected to finalise reforms towards the end
                                                    1.5%
                                                                                  of calendar year 2019.
                                                    1.0%       D-SIB Buffer
                                    Proposed
   8.5%      10.5%                  increased
                                                                              •   Implementation expected to commence from April
Minimum                                buffers                                    2020 with a transitional period of a number of years.
               2.0%       Tier 2
   Tier 1
               1.5%       AT1
                                                    7.5%       Conservation
                                                               Buffer
                                                                              •   Proposals not expected to change reported CBA
                          Conservation
                                                                                  Level 2 CET1 and manageable at Level 1 CET1.
               2.5%       Buffer
                                                                14.5%         •   Sufficient capacity exists under both current and
  7.0%                                                          CET1
  CET1                                                                            proposed APS222 (Association with Related Entities)
               4.5%       CET1 Minimum              4.5%       CET1 Minimum       limits to absorb the proposed additional capital
                                                                                  requirement.
              Current                             Proposed
            Requirement                          Requirement

                                                                                                                                          33
Regulatory capital changes
       Change                                                               Details                                                      Implementation

       APRA’s
                           • Capital to exceed unquestionably strong benchmark of CET1 >10.5% by 1 Jan 2020                                  1 Jan 2020
 unquestionably strong

                           APRA commenced consultation in 2018 on:
                           • Revisions to risk-based capital requirements for credit, interest rate risk in the banking book and
APRA’s revisions to the      operational risk                                                                                                 1 Jan 2022
 ADI capital framework     • Transparency, comparability and flexibility of the ADI capital framework                                (Operational RWA 1 Jan 2021)
                           APRA commenced consultation on standardised approaches for credit and operational risk and simpler
                           method for calculating capital requirements for residential mortgages in June 2019

Loss Absorbing Capacity
                           • Total Capital increase of 3% for all domestically systemically important banks (D-SIBs)                         1 Jan 2024
        (“LAC”)

                           •   RBNZ commenced consultation in 2017, final consultation paper released Dec 2018
        RBNZ               •   RBNZ expected to finalise reforms towards the end of 2019                                             Transition period commencing
    Capital Review         •   Implementation proposed from Apr 2020 with a transitional period of a number of years                            Apr 2020
                           •   Minimal impact expected at Level 2 CET1, manageable at Level 1 CET1 (within APS222 capacity limits)

                           • APRA commenced consultation in 2018
     Leverage ratio        • Proposed minimum 3.5%                                                                                           1 Jan 2022
                           • APRA expects that IRB ADIs will continue to report leverage ratios under the existing framework

Counterparty Credit Risk
                           • Effective 1 Jul 2019                                                                                             1 Jul 2019
       (SA-CCR)

       AASB 16
                           • Effective 1 Jul 2019                                                                                             1 Jul 2019
       Leasing

        APS 220
Credit Risk Management     • Consultation closed Jun 2019                                                                                     1 Jul 2020

                                                                                                                                                                    34
4 Business Units
“ We have maintained sound business fundamentals
  and momentum in a challenging operating context
                                                    ”
Business Units

                                 ~ 95% of Group NPAT1                                                                               Divestments/
                                                                                                                                  Strategic Reviews
                                   Movements are FY19 vs FY18                                                                                     Life              13
                                                                                                                                                  IFS Discontinued (15)
         (10%)                                                                                                                                    Sovereign          -
                                                                                                                                                  Eliminations     (24)
           4,234           (7%)
                                             (8%)               4%             49%           (28%)                (37%)            (18%)            (73%)             Large
                            2,658

                                             1,071            1,191                                                                   240
    $m                                                                            227            (941)              160                                33               (26)
                  2
            RBS               BPB             IB&M              ASB               IFS             Other             WM            CFSGAM            Mortgage           Other
                                                               (NZD)                                                                                Broking &
                                                                                                                                                     General
                                                                                                                                                    Insurance

1. Calculation based on the sum of the BU NPAT figures presented above divided by FY19 cash NPAT (incl. discontinued operations). 2. Includes Bankwest and Commonwealth Financial Planning,
excludes General Insurance and Mortgage Broking.
                                                                                                                                                                                              36
Retail Banking Services (RBS)1

                                                                           % of Group NPAT2                                                 Volume growth3,4
                                                                                                                                 Balancing growth and returns - managing
                                                                                                                                         regulatory requirements
                                                                                                                                                 12 months to Jun 19
                                                                                                                                                                   5.0%
                                                                                                50%                                System       3.4%
                                                                                                                                                                   4.1%
                                                                                                                                                 3.7%

                                                                                                                                                Home            Household
                                                                                                                                                Loans            Deposits

                                                                $m                  Jun 18         Jun 19           %                               Margin
     RBS provides simple, convenient                            Income              11,470         10,959          (4)
     and affordable banking products                                                                                                 Driven by home loan competition
       and services to personal and                             Expense             (4,102)        (4,213)          3              (discounting) and customer switching
       business customers, through                              LIE                  (652)          (693)           6
      Australia’s largest branch and                                                                                                           271
                                                                NPAT                 4,703          4,234         (10)
     ATM network, and market leading                                                                                                                         260          255
             digital channels                                  Income - lower NIM partly offset by asset growth.
                                                                                                                                     bpts
                                                               Expenses – inflation, risk and compliance spend.
                                                               LIE - higher personal loan collective provisions.                            2H18           1H19          2H19
1. Includes Bankwest and Commonwealth Financial Planning, excludes General Insurance and Mortgage Broking consolidation. 2. Group Cash NPAT excludes Corporate Centre and Other.
3. Source: RBA Lending and Credit Aggregates and APRA Monthly Banking Statistics. Includes home loan balances included in the Business and Private Banking (BPB) division 4. System
                                                                                                                                                                                      37
adjusted for new market entrants.
Business & Private Banking (B&PB)

                                                                             % of Group NPAT1                                                    Volume growth
                                                                                                                                                     Jun 19 vs Jun 18
                                                                                                                                   Transport & Storage +10%
                                                                                                                                   Business Services +10%
                                                                                                  31%                              Property Investor    +3%
                                                                                                                                   Property Developer -12%
                                                                                                                                                                             2.9%

                                                                                                                                          1.7%
                                                                                                                                                           -0.7%
                                                                                                                                       Business            Home            Deposits
                                                                                                                                       Lending             Loans

    We are continuing to invest in our                            $m                  Jun 18          Jun 19           %                                Margin
       business digital and analytics                             Income               6,540           6,573           1            Higher business lending and home loan
   platforms, including extension of the
                                                                  Expense             (2,230)         (2,409)          8              margins in the half, offset by lower
   Customer Engagement Engine (CEE).
                                                                                                                                               deposit margins
  We have hired more corporate bankers                            LIE                  (247)           (362)          47
  and created a new team of relationship                                                                                                                      317           317
                                                                  NPAT                 2,845           2,658          (7)                      317
      managers to support our small
 business customers. We have launched                           Income – Business growth offset by Retail Products.
 Apple Pay for Business and BizExpress                          Expenses - Higher remediation costs.                                  bpts
 to provide same day decisions on small
                                                                LIE – Small number of large individual exposures.                             2H18           1H19           2H19
             business loans2.
1. Group Cash NPAT excludes Corporate Centre and Other. 2. BizExpress is being rolled out to eligible existing customers for simple business loans up to $250K unsecured and $1m secured.
                                                                                                                                                                                            38
Institutional Banking and Markets (IB&M)

                                                                     % of Group NPAT1                                                  Volume growth
                                                                                                                     Front book discipline, back book optimisation
                                                                                        13%
                                                                                                                                              RWA $bn
                                                                                                                                101      97     96      90      85
                                                                                                                      Other      13      16     20      17      18
                                                                                                                      Credit     88      81     76      73      67

                                                                                                                               Jun 17 Dec 17 Jun 18 Dec 18 Jun 19

     Institutional Banking and Markets
                                                          $m                  Jun 18        Jun 19             %                             Margin
        serves the commercial and                         Income              2,671           2,444           (8)
                                                                                                                          Lower yields on bond inventories this
     wholesale banking needs of large                     Expense             (1,067)       (1,043)           (2)                         half
        Corporate, Institutional and                      LIE                  (80)           (17)            (79)
      Government clients across a full
                                                          NPAT                1,170           1,071           (8)
   range of financial services solutions,                                                                                             105       108          103
      including access to debt capital
                                                          Income - lower lending volumes and Markets income.
       markets, transaction banking,
                                                          Expenses – one-offs in FY18, higher risk/compliance.            bpts
           working capital and risk
                management                                LIE - lower collective and individual provisions.                           2H18      1H19         2H19

1. Group Cash NPAT excludes Corporate Centre and Other.
                                                                                                                                                                     39
ASB

                                                                     % of Group NPAT1                                     Volume growth
                                                                                                               Solid volume growth in lending and deposits
                                                                                     13%
                                                                                                                             12 months to Jun 19

                                                                                                                           6%                 6%

                                                                                                                         Deposits          Lending
                                                           NZD $m           Jun 18        Jun 19        %
    ASB conducts its business through
                                                                                                                                 Margin
                                                           Income            2,600        2,726         5
    four business units: Retail Banking;                                                                           Margin remained stable over the half
                                                           Expense           (935)        (970)         4
  Business Banking; Corporate Banking;
      and Private Banking, Wealth and                      LIE                (80)        (108)         35
  Insurance. ASB provides products and                     NPAT              1,143        1,191         4
     services across multiple channels                                                                                    227       221        222
   including the branch network, digital                  Income – Solid balance sheet growth.
     platforms and mobile relationship                    Expenses – Technology investment, risk/compliance.      bpts
                 managers.
                                                          LIE – Increased rural and business provisioning.                2H18      1H19       2H19

1. Group Cash NPAT excludes Corporate Centre and Other.
                                                                                                                                                             40
5 Home and
      Consumer Lending
“ We are Australia’s largest home lender, providing
  $92 billion of new lending this year for Australian
                     home buyers
                                   ”
Home lending – system overview
     The recent modest slowdown in housing credit                                                  The slowdown has been driven by a combination of
  growth is expected to extend into calendar year 2020                                            regulatory/other factors, largely in investment lending
   %                               Housing Credit1                                CBA Economics
                                                                               Forecast Range
                                                                                                  %                              Credit Growth1
                                                               7.3 6.7 6.6                        p.a
   25                            (annual % change)                         5.6                                                     (% change)
                                                                                3.5 3½-5½         12
   20
                                                                                                  10        Investor Credit
   15                                                          2015 2016 2017 2018 2019 2020       8                                                    Credit ex investors
   10                                                                                              6
                                                                                                   4
    5                                                                                              2
    0                                                                                              0
    Jun 98     Jun 01     Jun 04     Jun 07     Jun 10     Jun 13        Jun 16     Jun 19         Jun 10          Jun 12        Jun 14            Jun 16        Jun 18

    Despite recent house price softening, most capital                                            Housing credit demand continues to be supported by
        cities remain well up over the long term2                                                                  population growth
   Period movements to                                                                                                        Population growth3
   Jun 19 (%)                       10yrs           3yrs           1yr         6mths               ‘000                          (annual change)                          ‘000

   Sydney                             64             (1)          (10)             (4)                          Rest of
                                                                                                   150         Australia                        Melbourne                 300
                                                                                                                (RHS)                             (LHS)
   Melbourne                          59              5             (9)            (4)
                                                                                                   100                                                                    200
   Brisbane                           11              -             (3)            (3)
   Adelaide                           22              5              -             (1)              50                                    Sydney                          100
                                                                                                                                           (LHS)
   Perth                              (6)           (13)            (9)            (5)
                                                                                                        0                                                                 0
   Capital Cities (Combined)          42              -             (8)            (4)                   2003/04       2007/08       2011/12           2015/16

1. Source: RBA Lending and Credit Aggregates. 2. Source: CoreLogic Hedonic Home Value Index. 3. Source: ABS.                                                                     42
Home lending - CBA1
     CBA adopted regulatory changes early and avoided                                              Whilst some market share was ceded as a result, more
        riskier segments at the peak of the market                                                      recent growth has been at or above system
                                                                                                          CBA growth vs system (6mthly)
 •    APRA 10% cap on           12 month rolling growth (%)                                                                                                    Market share
      IHL growth (Dec 15)                                                                                                   0.9x          1.3x
                                                                                                            0.6x                                            Monthly Movement (bpts)
 •    APRA 30% cap on                                              CBA Owner Occupied Loans                                                                                                                                    3   4
      new IO loans (Mar 17)                                        CBA Investment Loans                     Jun 18          Dec 18        Jun 19                                                                                       2
                                                                                                                                                                                          1   1                           1
                                                                   CBA Total                                                                                                                        0
                                                                                            5.1%                                                                                                                    (0)
                                                                                                                                  (1)                                                                         (1)
                                                                                            3.7%                            (2)                                         (2)                             (2)
                                                                                                                                        (3) (2) (3)                           (3)
                                                                                                                      (4)                                   (4)
                                                                                            0.8%    (5)
                                                                                                          (6)
                                                                                                                (5)                                               (5)
                                                                                                                                                      (6)
                                                                                                                                                                                    (7)
 Jun 16          Dec 16       Jun 17          Dec 17        Jun 18       Dec 18    Jun 19          Jun 17                         Dec 17                            Jun 18                              Dec 18                     Jun 19

     FY19 funding levels were modestly lower than FY18,                                                 The Bank’s focus remains on the core markets of
              reflecting the market slowdown                                                                owner-occupied and proprietary lending
 $bn
                                          Balance growth2                                                              Book %4,7                         Balance growth:                                              Flow % FY19
                                                                                                   NSW/ACT
                                                  36                                                             11%
                                                                                                                    6%                                Jun 19 vs Jun 18 (%)4,5
                                                                                                   VIC/TAS                                                                                              Broker       41%
                                                                                                                                                                                                                                    59%
                                                                   (112)                           QLD                36%
                              92                                                                                 19%
                                                                                                   WA                                                                                             Proprietary        59%
                                                                                                                                                                                                                                    41%
                                         94         92                                             SA/NT
                                                                                                                        28%
                                         27                                                                                                                                                                                4                6
                                                    26      Investment                                                                                                                                               CBA           System
                          Fundings3                                                 467
           451                           67         66      Owner-Occupied                                15.4%
                                                                                                                                  6.1%                3.6%                     3.9%
                                      FY18         FY19                                                                                                                                             0.8%

          Jun 18          New Fundings          Redraw          Repayments/        Jun 19             Principal &              Owner               Proprietary                Broker              Investor            Interest only
                                               & Interest     External Refinance                       Interest               Occupier
                                                                    / Other
                                                                                                                                                                                                                          (22.2%)
1, 2, 3, 4, 5, 6, 7. Refer to notes slide at back of this presentation for source information.                                                                                                                                                  43
Borrowing capacity relatively stable1
     A number of strengthened servicing policies and                                               Despite tightening, maximum borrowing capacity has
    practices have been implemented since June 2015                                                remained relatively stable over the last 12-18 months
                                                                                                                      Change in maximum borrowing capacity2
                                                                                                                            Indexed December 2016
       Increased serviceability buffers on income and debt in line with regulatory guidance
       Income and household-scaled living expense models used in serviceability test                                Single Investor              Joint Owner Occupiers
       Limits on lending in high risk areas, non-residents                                         1.1              Single Owner Occupier        Joint Investors
       LVR limits on interest only and investment lending
                                                                                                    1.0
       Removed Low Doc loans from sale
       Introduced limits on high Debt-to-Income ratios                                             0.9
       Serviceability assessments prior to in-life IO switching                                    0.8
       Data-driven liability verification tools, including Comprehensive Credit Reporting
                                                                                                    0.7
                                                                                                                   2016             2017             2018             2019

        Few borrowers are currently utilising their full                                                  …with minimal change in average loan size and
                   borrowing capacity3                                                                                   approval rates
         CBA applicants with additional capacity to borrow                                                       Change in approval rate and average funding size
         CBA applicants who borrowed at capacity
                                                                                                                             Approval rate (Indexed to June 2018)               000’s
                        Dec 18                             Jun 19                                                            Average funding size [RHS]                         $400
                                                          13%                                       1.0
                       12%                                                                                                                                                      $350
                                                                                                                                                                                $300
                                                                                                    0.5
                                                                                                                                                                                $250
                               88%                                 87%
                                                                                                    0.0                                                                         $200
                                                                                                            Jun 18                      Dec 18                      Jun 19

1. CBA excluding Bankwest. 2. Scenarios based on differing assumptions with respect to family types, number of dependents, loan size, income sources and existing liabilities/commitments.
3. Applications that have passed system serviceability test; borrowed at capacity reflects applicants with minimal net income surplus.                                                       44
Serviceability assessment1
   New loan applications are assessed based on a range                                                                  An interest rate buffer is used in
           of income and expenditure metrics                                                                                  loan servicing tests
                    All income used in application to assess serviceability is verified
                                                                                                                  Interest rate buffers (%)                      •    Loans assessed based on the
                    80% or lower cap on less stable income sources (e.g rent, bonus)                                                                                 higher of the customer rate2 +
                                                                                                          7.60%             7.62%                  7.43%
 Income             90% cap on tax free income, including Government benefits                  7.25%                                                                 buffer, or minimum floor rate
                    Limits on investor income allowances, e.g. RBS restrict rental                        2.25               2.25                  2.50         •    APRA advised that ADI’s will
                                                                                                                                         5.75%
                     yield to 4.8% and use of negative gearing where LVR>90%                                                                                          set their own floor for use in
                                                                                                                                                                      serviceability assessments,
                                                                                                           5.35               5.37                  4.93
                  Living expenses captured for all customers                                                                                                         effective 5 July 2019.
 Living           Servicing calculations use the higher of declared expenses or                                                                                 •    CBA now applies a minimum
 Expenses          HEM adjusted by income and household size                                                                                                          floor rate of 5.75% and a
                  Continued focus on reducing HEM reliance                                               Jun 16            Jun 19                 Aug 19
                                                                                                                  SVR (OO P&I)        Buffer                          buffer of 2.50%, effective 22
                                                                                                                                                                      July 2019.
                  Assess customer ability to pay based on the higher of the                                           Minimum Floor Rate
 Interest          customer rate plus serviceability buffer2 or minimum floor rate
 Rates            Interest Only (IO) loans assessed on principal and interest basis                                       Applicant gross income band3
                   over the residual term of the loan
                                                                                                 50%                                       6 months to Jun 19
                  CBA requires and reviews transaction statements to identify                   40%                                             Fundings $
                                                                                                             Owner Occupied (OO)
                   undisclosed debts                                                             30%         Investor Home Loans (IHL)
                  Automatic review of CBA personal transaction account and
                                                                                                 20%
                   Comprehensive Credit Reporting (CCR) data to identify
                                                                                                 10%
 Existing          undisclosed customer obligations
 Debt             All existing customer commitments are verified                                 0%
                  For repayments on existing mortgage debt:                                              0k to 75k 75k to 100k          100k to       125k to       150k to    200k to    > 500k
                                                                                                                                          125k          150k          200k       500k
                    CBA & OFI repayments recalculated using the higher of the
                       actual rate plus a buffer or min. floor over remaining loan term                                                            Fundings #
                    Credit cards calculated at an assessment rate of 3.82%                        OO:       15%           16%             18%             15%         19%         16%        1%
                                                                                                   IHL:      5%             8%             10%             13%         24%         37%        3%

1. CBA excluding Bankwest unless stated otherwise. Excludes Line of Credit, Reverse Mortgage, Commonwealth Portfolio Loan and Residential Mortgage Group. 2. Customer rate includes any
customer discounts that may apply. 3. CBA including Bankwest.                                                                                                                                          45
Portfolio quality remains sound1
  Approximately 60% of the book was originated under                                                                   Significant repayment buffers
           tightened standards from FY16                                                                                          in place
                       Mortgage portfolio by year of origination                                                                      Repayment buffers
                                                                                       17%                                 (Payments in advance2, % of accounts)
                                                                             15% 16%                                                                                            10%
                                                                       12%
                                                                9%                                                                                                               6%
                                                          7%                                           31%                                                                       5%
                                                    5%
     2%             3% 3% 3% 3%
           1% 1% 2%                                                                                                                                              12%            14%
                                                                                                                      7%             7%            7%
                                                                                                    > 2 years      1-2 years    6-12 months 3-6 months 1-3 months            < 1 month

       Those with less than 1 month buffer include                                                   Portfolio LVR remains strong, despite recent house
   investors, those with fixed rates and new borrowers                                                                prices softening
                                     Repayment buffers                                                                            Portfolio Dynamic LVR3
                                   Residual:
Portfolio LVRs1
   Portfolio LVRs remain strong, with a modest uptick in                                           Approximately 3.5% of accounts and 4.5% of balances
         higher LVR bands given market softening                                                            are in a negative equity3 position
                                     Dynamic LVR Bands2                           Jun 18                                Proportion of Balances in Negative Equity3
   60%                                                                            Dec 18
   50%                           % of total Portfolio Accounts                    Jun 19
                                                                                                                                                                   4.5%
   40%
                                                                                                          3.3%                         3.7%
   30%                                                                                                                                                             3.5% of
                                                                                                                                                                               2.1%
                                                                                                                      1.5%            3.0% of     1.6%            accounts
   20%                                                                                                    2.8% of
                                                                                                         accounts                    accounts
   10%
     0%                                                                                                                                                                          4
                                                                                                               Jun 18                      Dec 18                       Jun 19
              LVR        LVR          LVR         LVR        LVR        LVR        LVR
             100%                                  Negative Equity          Negative Equity > $50k
                         70%          80%         90%        95%        100%

                                    Dynamic LVR Bands2                            Jun 18           • CBA updates house values on a monthly basis using internal and external
   60%                                                                            Dec 18             valuation data
   50%                          % of total Portfolio Balances                     Jun 19           • Negative equity arises when the outstanding loan (less offset balances)
   40%                                                                                               exceeds the updated house value
   30%                                                                                             • 4.5% of balances are in negative equity
   20%
                                                                                                   • 72% of negative equity is from WA and QLD
   10%
                                                                                                   • Over 50% of home loans in negative equity have Lenders Mortgage
    0%                                                                                               Insurance
             LVR         LVR         LVR         LVR        LVR        LVR         LVR
            100%           • 66% of customers ahead of repayments
                         70%         80%         90%        95%        100%
1. CBA including Bankwest. Excludes Line of Credit, Reverse Mortgage, Commonwealth Portfolio Loans and Residential Mortgage Group. 2. Taking into account cross-collateralisation. Offset
balances not considered. 3. Based on outstanding balances, taking into account cross-collateralisation and offset balances. 4. Based on Jun 19 valuations.                                  47
Home loan portfolio – CBA

Portfolio1                          Jun 18   Dec 18   Jun 19   New Business1                                                   Jun 18             Dec 18             Jun 19
Total Balances - Spot ($bn)          451      458      467     Total Funding ($bn)                                                 45                 49                 43
Total Balances - Average ($bn)       443      455      462     Average Funding Size ($’000)7                                      319                326                320
Total Accounts (m)                   1.8      1.8      1.8     Serviceability Buffer (%)8                                        2.25               2.25               2.25
Variable Rate (%)                     81       80      80      Variable Rate (%)                                                   86                 82                 80
Owner Occupied (%)                    65       66      66      Owner Occupied (%)                                                  70                 70                 71
Investment (%)                        32       31      31      Investment (%)                                                      29                 29                 28
Line of Credit (%)                    3        3        3      Line of Credit (%)                                                  1                   1                  1
Proprietary (%)                       55       55      54      Proprietary (%)                                                     59                 55                 52
Broker (%)                            45       45      46      Broker (%)                                                          41                 45                 48
Interest Only (%)2                    30       26      22      Interest Only (%)                                                   23                 23                 22
Lenders’ Mortgage Insurance (%)2      21       21      21      Lenders’ Mortgage Insurance (%)2                                    16                 16                18
Mortgagee In Possession (bpts)        5        5        6      Debt-to-Income9 (DTI) > 6 (%)                                       12                 12                 11
Negative Equity (%)3                 3.3      3.7      4.5     1. CBA including Bankwest. All portfolio and new business metrics are based on balances and fundings respectively,
                                                                  unless stated otherwise. All new business metrics are based on 6 months to Jun18, Dec18, Jun19. Excludes ASB.
Annualised Loss Rate (bpts)           3        3        3      2. Excludes Line of Credit (Viridian LOC/Equity Line).
                                                               3. Negative equity arises when the outstanding loan balance (less offset balances) exceeds updated house value.
Portfolio Dynamic LVR (%)4            50       51      52         Based on outstanding balances, taking into account both cross-collateralisation and offset balances. Excludes Line
                                                                  of Credit, Reverse Mortgage, Commonwealth Portfolio Loans and Residential Mortgage Group.
Customers in Advance (%)5             78       78      78      4. Dynamic LVR defined as current balance/current valuation.
                                                               5. Any amount ahead of monthly minimum repayment; includes offset facilities.
Payments in Advance incl. offset6     32       35      33      6. Average number of monthly payments ahead of scheduled repayments.
                                                               7. Average Funding Size defined as funded amount / number of funded accounts.
Offset Balances – Spot ($bn)          42       46      45      8. Serviceability test based on the higher of the customer rate plus an interest rate buffer or min floor rate.
                                                               9. Total Debt Amount / Gross Income; excludes Bridging Loans.                                                           48
Interest only (IO) home loans1
    IO loans account for a reducing proportion of total                                                              …and a reducing proportion of
                  portfolio balances…                                                                                  total new business flow
                                 IO % of total home loans                                                                                IO % of total home loans
                                      Total portfolio balance                                                                                  New business flow
                   30%
                                             26%
                                                                        22%                                     23%                                   23%                               22%

                  2H18                      1H19                        2H19                                    2H18                                  1H19                              2H19

      Switching from IO to Principal and Interest (P&I)                                          The IO portfolio is dominated by investor loans and
                 peaked in the Dec 17 half                                                              those well in advance of repayments
                                  Balance Movement ($bn)2                                                         Scheduled IO term expiry ($bn)2                             Payments in advance > 6 mths3

                                            16.3                                                                                                                              Investment Loans: tax benefit in
                                                                                                                                                                              keeping interest payments high
                                                       12.8      12.2                                    13.5      Chart totals do not add to 100% due to rounding
                                                                                                                                                                                    Dynamic LVR
Home loan arrears
    Group portfolio arrears broadly stable                         Trends are broadly consistent across                       ….with interest only arrears steady over
                   this half                                                   loan types….                                              the last 12 months
                 Arrears by Portfolio             Group                           Arrears by Product                                           Arrears by Repayment Type
                                                                1.0%
 1.8%                                                                                                                        1.0%
                  Group 90+ days                 Bankwest                                90+ days1                                                         90+ days1
                                                   CBA          0.8%                                                         0.8%
                                                   ASB
 1.2%                                                           0.6%                                                         0.6%

                                                                0.4%                                                         0.4%
 0.6%
                                                                                                     Owner Occupied                                                         Interest Only
                                                                0.2%                                                         0.2%
                                                                                                     Investment Loans                                                   Principal & Interest

 0.0%                                                           0.0%                                                         0.0%
    Jun 17      Dec 17     Jun 18       Dec 18    Jun 19            Jun 17      Dec 17     Jun 18     Dec 18     Jun 19           Jun 17       Dec 17          Jun 18      Dec 18           Jun 19

  Overall arrears are down on 2018, though                              ….reflecting pockets of stress in                       Vintage performance since 2007-2010
    marginally elevated vs prior years…                                     particular geographies                                continues to be relatively steady
                     Arrears by Year                                                 Arrears by State                                                 Arrears by Vintage
                                                                 2.0%
 1.0%                Group 90+ days                                                      90+ days1                   NT     1.6%                          90+ days1,2
                                                                                                                     WA                                                             FY07-FY10
                                                                 1.5%                                               QLD     1.2%
                                                                                                                     SA                                         FY13-FY15        FY12        FY11
                                                                 1.0%                                               AUS
 0.5%                                                                                                                       0.8%
                                                                                                                    TAS                                        FY16
                                                 2015
                                                 2016                                                                VIC                                FY17
                                                                 0.5%                                                       0.4%               FY18
                                                 2017                                                               NSW
                                                 2018                                                               ACT             FY19
                                                 2019                                                                                                    Months on Book
 0.0%                                                            0.0%                                                       0.0%
        Jul Aug Sep Oct Nov Dec Jan Feb Mar Apr May Jun              Jun 17    Dec 17    Jun 18     Dec 18     Jun 19               0      6 12 18 24 30 36 42 48 54 60 66 72

1. CBA including Bankwest. Excludes Line of Credit, Reverse Mortgage, Commonwealth Portfolio Loan and Residential Mortgage Group. 2. Bankwest included from FY08.                                    50
Portfolio losses, insurance and stress testing1

                  Losses to average gross loans2                                                                       Portfolio Insurance Profile3
    2.5%                                                                                                                     % of Home Loan portfolio

                                                                                                       Excess of loss re-                                      Insurance with Genworth
                                                                                                          insurance                     4%                        or QBE for higher risk
    2.0%                                                                                                                                          21%            loans above 80% LVR

                                                                                                                                                          5%
    1.5%
                                                      CBA Home Loans                            Insurance not required            70%                                  Low deposit
                                                      Group Total Loans                         - Lower risk profile e.g.                                           premium segment
                                                                                                       low LVR
    1.0%

                                                                                                                                 Stress testing
    0.5%                                                                                    •     A severe stress test scenario is modelled on an ongoing basis.
                                                                                            •     Scenario includes stresses to house prices (31% decline),
                                                                                                  unemployment (11%), cash rates (reduced to 0.5%).
    0.0%                                                                                    •     Losses4 are estimated over three years: Gross 3-year losses of
           1983       1989        1995        2001        2007        2013        2019            $4.09b, or $3.17b net of insurance.

1. CBA including Bankwest. 2. Bankwest included from FY09. 3. Excludes Line of Credit, Reverse Mortgage, Commonwealth Portfolio Loan and Residential Mortgage Group. 4. Increase in gross
stressed losses from last half reflects slow down in housing market. Net losses reflect stressed macroeconomic and LMI assumptions (50%). Results based on December 2018 data.
                                                                                                                                                                                            51
Consumer arrears

                                                                                 Group                                                                                                    2015
                                     Credit Cards                              Bankwest
                                                                                                                                             Credit Cards                                 2016
                                                                                                                                                                                          2017
  1.8%                               Group 90+ days                              CBA                                                         Group 90+ days                               2018
                                                                                 ASB 1                                                                                                    2019
                                                                                                  1.2%

  1.2%

                                                                                                  1.0%
  0.6%

  0.0%                                                                                            0.8%
     Jun 17               Dec 17             Jun 18              Dec 18             Jun 19                Jul    Aug   Sep     Oct     Nov     Dec     Jan     Feb     Mar    Apr   May      Jun

                                    Personal Loans                                                                                        Personal Loans                                  2015
                                                                                 Group
                                     Group 90+ days                                                                                                                                       2016
                                                                                Bankwest                                                     Group 90+ days
                                                                                                                                                                                          2017
                                                                                  CBA                                                                                                     2018
                                                                                                   1.9%
                                                                                  ASB 1                           Modest uptick due to lower portfolio growth and emerging                2019
 1.8%                                                                                                              stress from Western Sydney and areas of Melbourne

 1.2%
                                                                                                   1.4%

 0.6%

 0.0%                                                                                              0.9%
    Jun 17               Dec 17              Jun 18              Dec 18              Jun 19               Jul    Aug   Sep     Oct     Nov    Dec      Jan    Feb     Mar    Apr    May     Jun

1. ASB write-off Credit Card and Personal Loans typically around 90 days past due if no agreed repayment plan.                                                                                     52
6 Business and
     Corporate Lending
 “$36Supporting   Australian businesses with
      billion of new business lending this year
                                                  ”
Corporate portfolio quality1

               Exposures by Industry                               Corporate Portfolio Quality                               Group TCE by Geography
                                                                                Investment Grade
                      AAA       A+    BBB+                                                                                                Jun 18         Dec 18        Jun 19
                                                       Jun
TCE $bn                 to       to      to   Other
                                                        19
                       AA-      A-    BBB-                                                                           Australia             77.6%             77.9%         78.4%
                                                                       67.9%           67.9%        67.4%
Sovereign             95.8      9.1     0.5       -   105.4
                                                                                                                     New Zealand           10.0%             10.4%         10.6%
Property                3.1     6.2    14.7    44.2    68.2

Banks                 23.1     22.0     3.2     0.1    48.4
                                                                                                                     Europe                    4.7%          3.9%          3.5%

Finance - Other       23.9     22.6     4.0     2.2    52.7                                                          Other                     7.7%          7.8%          7.5%
Retail &                                                               Jun 18          Dec 18       Jun 19
                        0.1     1.2     4.0    14.8    20.1
Wholesale Trade
Agriculture               -     0.1     2.7    19.7    22.5     Top 10 Commercial Exposures                          Troublesome and Impaired Assets
Manufacturing             -     2.3     4.4     8.1    14.8                                                                                                     0.72%
                                                               BBB+                                                   % of TCE          0.60%         0.62%
Transport                 -     1.4     7.4     6.3    15.1     AAA                                                                                                  7.8
                                                                  A-
                                                                                                                                         6.5          6.7
Mining                    -     3.2     5.1     3.1    11.4    BBB+
                                                                  A-                                                                                                 3.6
Energy                  0.3     2.2     5.9     1.8    10.2       A+                                                           Gross     3.2           3.6
                                                                                                                             Impaired
                                                               BBB+
All other ex                                                     AA-
                        1.7     5.9    18.3    42.3    68.2
Consumer                                                          A+                                                      Corporate      3.3                         4.2
                                                                                                                       Troublesome
                                                                                                                                                       3.1
Total                148.0     76.2    70.3   142.6   437.1        A                                                                                                         $bn
                                                              TCE $m -           500      1,000    1,500     2,000                      Jun 18        Dec 18     Jun 19

1. CBA grades in S&P equivalents.                                                                                                                                                  54
Credit exposure summary

                            Group TCE                TIA $m            TIA % of TCE
                           Dec 18       Jun 19   Dec 18       Jun 19   Dec 18    Jun 19
Consumer                    57.8%        58.6%    1,832        2,101    0.29%         0.33%
Sovereign                   10.0%         9.7%        -            -        -             -
Property                     6.2%         6.3%      652          775    0.97%         1.14%
Banks                        4.6%         4.5%        9            9    0.02%         0.02%
Finance – Other              4.9%         4.9%       78           35    0.15%         0.07%
Retail & Wholesale Trade     2.0%         1.9%      478          636    2.15%         3.16%
Agriculture                  2.1%         2.1%    1,042          989    4.65%         4.40%
Manufacturing                1.4%         1.4%      375          403    2.46%         2.71%
Transport                    1.5%         1.4%      225          259    1.41%         1.72%
Mining                       1.3%         1.1%      314          199    2.30%         1.74%
Business Services            1.3%         1.1%      278          333    1.97%         2.72%
Energy                       0.9%         0.9%        2           86    0.02%         0.84%
Construction                 0.8%         0.8%      419          579    5.08%         7.10%
Health & Community           0.8%         0.8%      222          224    2.49%         2.47%
Culture & Recreation         0.6%         0.6%       62          101    0.93%         1.64%
Other                        3.8%         3.9%      761        1,070    1.82%         2.51%
Total                      100.0%       100.0%    6,749        7,799    0.62%         0.72%

                                                                                              55
Sectors of interest - Construction

   Exposures of $8.2bn (0.8% of Group TCE) with no                                                  Group Exposure                                                 Jun 18

                                                                       8.1 8.3 8.2
                                                                                                                                                                    Dec 18
    material changes to sector composition.
                                                                                                                                                                    Jun 19
   Portfolio rated 18% investment grade and 41% of                                                     17 17
                                                                                                                 18

    exposures secured.
   On-going higher risk is evidenced by elevated TIAs                                                                              7.1          210
                                                                                                                                                       170
                                                                                       0.7 0.8 0.8                        3.7 5.1                                   2.5 2.1
    reflecting recent failures and challenging market                                                                                       37                0.5

    conditions. Impaired portfolio is lower in the half                TCE ($bn)     % of Group TCE     % of portfolio % of portfolio        Portfolio        % of portfolio
                                                                                                      investment grade graded TIA          impaired $m         Impaired
    following a large single name write off.
   Indirect risk is evident in other industry classifications
    not captured in Construction.                                                         Group Exposure by Sector                                                  Jun 18
                                                                 4.0
   Recent losses, while elevated, are consistent with the       3.5
                                                                                                                      ($bn)                                         Dec 18
                                                                                                                                                                    Jun 19
    sector’s disproportionate share of write offs over the       3.0
    longer term.                                                 2.5
                                                                 2.0
   Revised origination guides introduced and detailed           1.5
                                                                 1.0
    portfolio monitoring continues.                              0.5

   The credit outlook remains cautious despite a positive         -
                                                                         Building     Other           Installation       Site        Non-Building       Building       Building
    growth outlook largely from Government supported                   Construction Construction
                                                                                     Services
                                                                                                         Trade
                                                                                                       Services
                                                                                                                      Preparation
                                                                                                                       Services
                                                                                                                                     Construction      Completion
                                                                                                                                                        Services
                                                                                                                                                                       Structure
                                                                                                                                                                       Services
    infrastructure projects.
                                                                                                                                                                                   56
Sectors of interest – Commercial Property

                                                                                                                                        Group Exposure                                        Jun 18
  Increase in investment exposures driving moderate                                                                                                                                         Dec 18
                                                                                                              68.2
   increase exposure for the half year (+1.4%).                                                     67.2 67.2                                                                                 Jun 19

  Diversified across sectors and by counterparty.
  Lower apartment development exposures.
                                                                                                                                         34 34 35

  Top 20 counterparties primarily investment grade
                                                                                                                      6.2 6.2 6.3
   (weighted average rating of BBB equivalent) and                                                                                                       0.9 1.0 1.1       83 78 70         0.12 0.12 0.10
   account for 16.6% of Commercial Property exposure.                                                  TCE ($bn)     % of Group         % of portfolio   % of portfolio   Portfolio impaired % of portfolio
                                                                                                                        TCE           investment grade    graded TIA              $m          Impaired
  35% of the portfolio investment grade, majority of sub-
   investment grade exposures secured (91%).                                                                          Sector                   Profile1                   Geography
                                                                                                                                                                  SA                          Other
  Impaired exposures remain low (0.10% of the portfolio).                                                                                                        5%                           2%
                                                                                                                     Other
                                                                                                                                                                     QLD
  Geographical weighting remained steady this half.                                                   Industrial
                                                                                                                     13%            Retail                            7%
                                                                                                                                    27%
                                                                                                         10%                                                       WA
  Ongoing comprehensive market, exposure monitoring                                                                                                               14%                        NSW
   of the portfolio.                                                                                   Residential                                                                            52%
                                                                                                         14%
                                                                                                                                     Office                               VIC
                                                                                                                     REIT            21%                                  20%
                                                                                                                     15%

1. Sector profile is Group wide Commercial Property. Geographic profile is domestic Commercial Property.                                                                                                      57
Sectors of interest – Residential Apartments

    Apartment Development1 exposure reduced by $2.9bn                                                                                     Profile
     (56%) since Dec 16.                                                                                 Total Residential                                Apartment Development1
                                                                                                        $9.5bn (14% of CP)                                 $2.3bn (0.2% of TCE)
    Facilities being repaid on time from pre-sale
     settlements.                                                                                                                                           Perth      Other
                                                                                                                                                                       $0.3bn
    Weighting to Sydney - Sydney developments are                                                       Investment        Apartment
                                                                                                                                                           $0.07bn
                                                                                                                                                        Brisbane
     diversified across the metropolitan area.                                                               43%          development1                  $0.06bn
                                                                                                           ($4.1bn)           24%                                                  Sydney
    Portfolio LVR and Qualifying Pre-sales (QPS)2 broadly                                                                  ($2.3bn)                           Melbourne            64%
                                                                                                                  Other                                         $0.4bn            ($1.5bn)
     stable at 55.3% and 107.7% respectively.                                                                  development
    Ongoing comprehensive market, exposure and                                                                    33%
                                                                                                                 ($3.1bn)
     settlement monitoring on the portfolio.

                  Residential Apartment Development                                                                        Exposure Maturity Profile1
                                    Total Exposure ($bn)                                                                                      ($bn)

               5.2
                           4.5                                                                                             0.9                 0.9
                                       4.1          3.7
                                                                2.6         2.3                                                                                    0.5

             Dec 16      Jun 17      Dec 17       Jun 18      Dec 18       Jun 19                                         2019                2020                2021
1. Apartment Developments > $20m. Brisbane, Melbourne and Perth defined as all postcodes within a 15km radius of the capital city and Sydney is all metropolitan Sydney based on location of
the development. Other is all other locations. 2. QPS cover is the ratio of Qualifying Pre Sales to loan exposures.                                                                            58
Sectors of interest – Agriculture

                                                                                                                                                                                               Jun 18
                                                                                                                                            Group Exposure
  Group agriculture exposure of $22.5bn (2.1% of Group                                                                                                                                        Dec 18
                                                                                                        21.8 22.4 22.5
   TCE) – diversified by geography, sector, client base.                                                                                                                                       Jun 19

  Australian agriculture portfolio is facing weak seasonal
   and drought conditions. The Australian dairy sector is                                                                                13 12 13
   encountering challenging conditions.
  NZ dairy sector outlook remains stable with market                                                                    2.0 2.1 2.1                      4.1 4.7 4.4
                                                                                                                                                                           463
                                                                                                                                                                                 527
                                                                                                                                                                                    415     2.1 2.4 1.9
   forecast for 2019/20 milk prices continuing to support
   recovery in the NZ dairy portfolio.                                                                    TCE ($bn)      % of Group      % of portfolio   % of portfolio      Portfolio     % of portfolio
                                                                                                                            TCE        investment grade    graded TIA       impaired $m      Impaired

                                                                                          Jun 18                                                                                               Jun 18
                           NZ Dairy Exposure1                                                                                    Group Exposure by Sector
                                                                                          Dec 18        9.0                                                                                    Dec 18
                                                                                                        8.0
                                                                                                                                                     ($bn)
                                                                                          Jun 19                                                                                               Jun 19
   7.6 7.7 7.6                                                                                          7.0
                                       12.6 13.0                                                        6.0
                                   12.1
                                                                                                        5.0
                                                                                                        4.0
                                                    5.6 5.7 5.6                                         3.0
                                                                                        4.5 4.0
                                                                      340 312                   3.6     2.0
                                                                              273
                  0.7 0.7 0.7
                                                                                                        1.0
                                                                                                          -
  TCE ($bn)      % of Group       % of portfolio   % of portfolio   Portfolio impaired % of portfolio         Dairy Farming Grain Growing Sheep and Beef      Forestry,    Horticulture and Other Livestock
                    TCE         investment grade    graded TIA              $m          Impaired                                             Farming         Fishing and    Other Crops
                                                                                                                                                              Services
1. New Zealand dairy exposure (AUD) included in Group exposure.                                                                                                                                               59
You can also read