Unsettling Suburbia: The New Landscape of Oil and Mortgage Vulnerability in Australian Cities - Jago Dodson and Neil Sipe - Urban Research Program
←
→
Page content transcription
If your browser does not render page correctly, please read the page content below
Unsettling Suburbia:
The New Landscape of Oil and Mortgage
Vulnerability in Australian Cities

Jago Dodson and Neil Sipe

Urban Research Program
Research Paper 17
August 2008
Unsettling Suburbia:
The New Landscape of Oil and Mortgage Vulnerability in
                 Australian Cities

                  Jago Dodson and Neil Sipe

                  Urban Research Program
                   Research Paper No. 17
                       August 2008

                                                         i
THIS PAGE HAS BEEN INTENTIONALLY LEFT BLANK

                                              ii
The Urban Research Program acknowledges the generous
support provided by Brisbane City Council for production of
        the Program’s Issues and Research Papers.

                                       © Jago Dodson and Neil Sipe
     ISBN 978-1-921291-40-1               Urban Research Program,
                                                Griffith University

                                                                 iii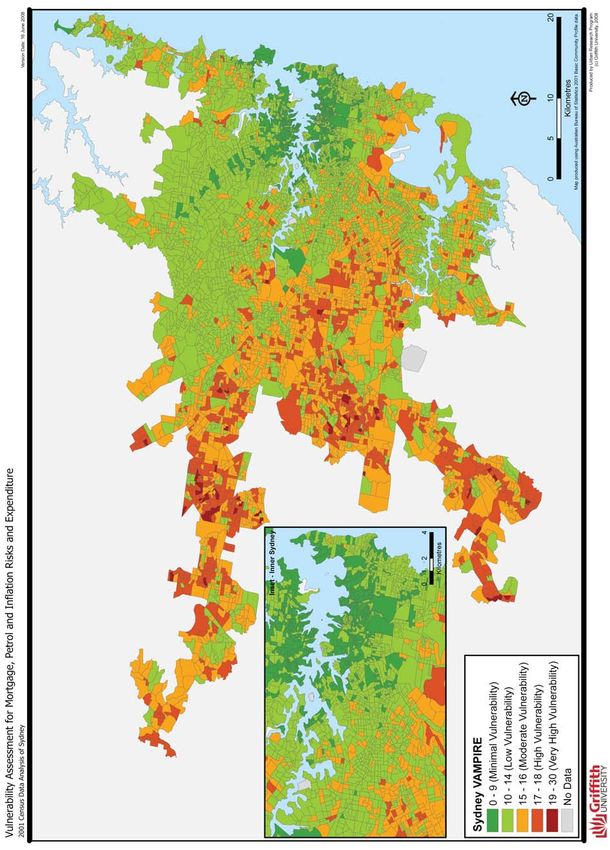
THIS PAGE HAS BEEN INTENTIONALLY LEFT BLANK

                                              iv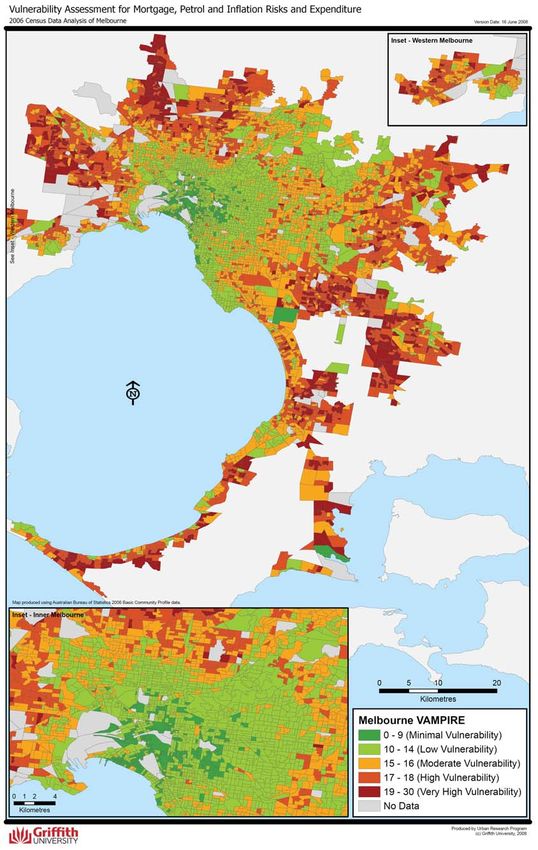
URBAN RESEARCH PROGRAM
The Urban Research Program (URP) was established in 2003 as strategic research and
community engagement initiative of Griffith University. The strategic foci of the Urban
Research Program are research and advocacy in an urban regional context.

The Urban Research Program seeks to improve understanding of, and develop
innovative responses to Australia’s urban challenges and opportunities by conducting and
disseminating research, advocating new policy directions, and by providing training
assistance. We aim to make the results of our research and advocacy work available as
freely and widely as possible.

                  URP RESEARCH AND ISSUES PAPERS
URP Research Papers impart findings and conclusions from our research program. URP
Issues Papers tackle current problems and challenges, and advocate potential new
directions in Australian urban policy.

The Issues Papers and Research Papers are edited by Jago Dodson, Research Fellow in the
Urban Research Program. Email j.dodson@griffith.edu.au

Both Issues Papers and Research Papers may be downloaded from our website free of
charge:
                        www.griffith.edu.au/centre/URP
Hard copies are available for purchase. Contact Ms. Joanne Pascoe, Email
j.pascoe@griffith.edu.au.

                 THE AUTHOR OF THIS ISSUES PAPER
Jago Dodson is a Senior Research Fellow in the Urban Research Program at Griffith
University. Email: j.dodson@griffith.edu.au.

Neil Sipe is a Senior Lecturer and Discipline Head of Urban and Environmental
Planning in the School of Environment at Griffith University. Email: n.sipe@griffith.edu.au.

                            ACKNOWLEDGEMENT
The authors wish to acknowledge the expert assistance of Mr Rick Evans, Senior
Research Officer in the Urban Research Program, in preparing the maps presented in
this report.

                                                                                           v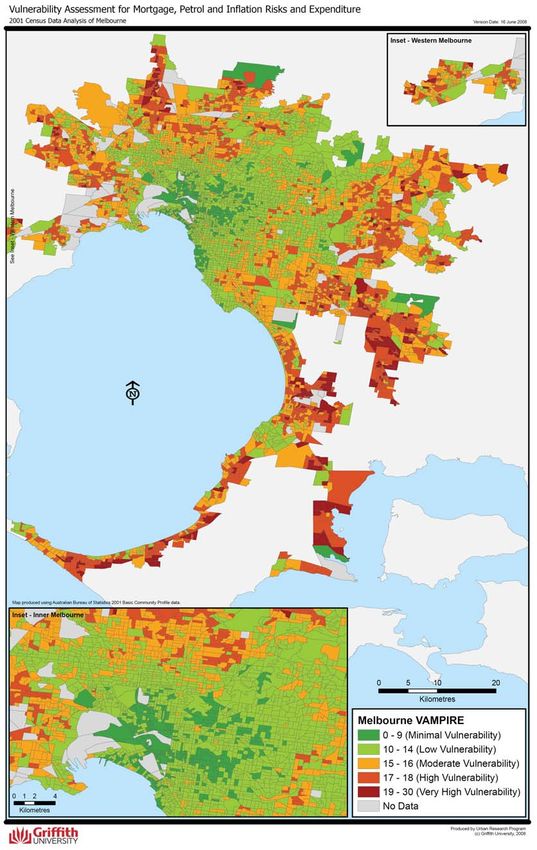
THIS PAGE HAS BEEN INTENTIONALLY LEFT BLANK

                                              vi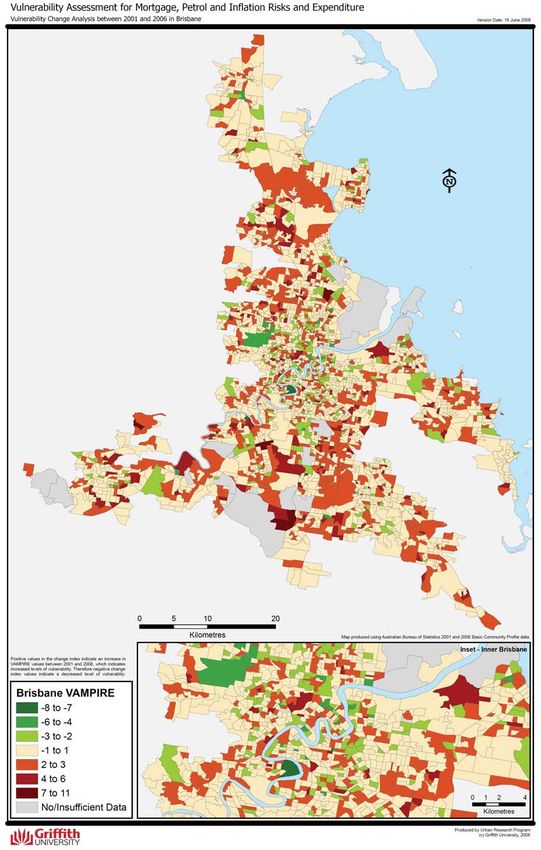
CONTENTS

List of Tables and Figures................................................................................................................viii

Introduction..........................................................................................................................................1
    On the up..........................................................................................................................................................1
    The cost of petrol prices ................................................................................................................................4
    Depending on cars ..........................................................................................................................................4
    Housing oil vulnerability ................................................................................................................................5
    Compounding pressures.................................................................................................................................6

The Effects of Recent Fuel Price Increases .....................................................................................9
    Shifting perceptions ........................................................................................................................................9
    Close to busting ............................................................................................................................................ 10
    Hitting home ................................................................................................................................................. 11

The 2006 VAMPIRE: Mapping oil, mortgage and inflation vulnerability. ..............................12
    Part A: The 2006 VAMPIRE: Distributing urban oil and mortgage vulnerability. ......................... 13
        Minimal and Low Vulnerability Areas................................................................................................................. 24
        Moderate Vulnerability Areas............................................................................................................................... 24
        High Vulnerability Areas....................................................................................................................................... 24
        Very High Vulnerability Areas ............................................................................................................................. 25
    Part B: Changes in urban oil and mortgage vulnerability 2001-2006.................................................. 26
        Brisbane................................................................................................................................................................... 26
        Sydney...................................................................................................................................................................... 28
        Melbourne ............................................................................................................................................................... 30
        Adelaide................................................................................................................................................................... 32
        Perth......................................................................................................................................................................... 34

Discussion ...........................................................................................................................................36

Conclusions: the policy challenge of urban oil and mortgage vulnerability ..............................37
        The regressive city.................................................................................................................................................. 37
        Fuelling futility........................................................................................................................................................ 37
        The planning imperative........................................................................................................................................ 38
        Missing the train ..................................................................................................................................................... 39
        Housing vulnerability............................................................................................................................................. 39
        Public planning, public transport......................................................................................................................... 40

References ...........................................................................................................................................42

                                                                                                                                                                             vii
List of Tables and Figures
Figure 1: Spot price for crude oil, 2000-2008................................................................................................................. 2
Figure 2: Fuel, Food and Consumer Price Indexes, Australia, 1972-2008................................................................. 7
Figure 3: Indicator standard variable housing loan interest rates, Australia, 1988-2008. ......................................... 7
Figure 4: Total value of Bank Loans for Owner Occupied Housing, Australia, 1998-2008. .................................. 8
Figure 5: Sydney rail patronage 2001/2002 to 2006/2007......................................................................................... 10
Figure 6: Oil and mortgage vulnerability in Brisbane, 2001....................................................................................... 14
Figure 7: Oil and mortgage vulnerability in Brisbane, 2006....................................................................................... 15
Figure 8: Oil and mortgage vulnerability in Sydney, 2001.......................................................................................... 16
Figure 9: Oil and mortgage vulnerability in Sydney, 2006.......................................................................................... 17
Figure 10: Oil and mortgage vulnerability in Melbourne, 2001................................................................................. 18
Figure 11: Oil and mortgage vulnerability in Melbourne, 2006................................................................................. 19
Figure 12: Oil and mortgage vulnerability in Melbourne, 2001................................................................................. 20
Figure 13: Oil and mortgage vulnerability in Adelaide, 2006..................................................................................... 21
Figure 14: Oil and mortgage vulnerability in Perth, 2001........................................................................................... 22
Figure 15: Oil and mortgage vulnerability in Perth, 2006........................................................................................... 23
Figure 16: Change in oil and mortgage vulnerability at the Census Collectors District level, Brisbane, 2001-
2006..................................................................................................................................................................................... 26
Figure 17: Spatial change in oil and mortgage vulnerability at the Census Collectors District level, Brisbane,
2001-2006........................................................................................................................................................................... 27
Figure 18: Change in oil and mortgage vulnerability at the Census Collectors District level, Sydney, 2001-
2006..................................................................................................................................................................................... 28
Figure 19: Spatial change in oil and mortgage vulnerability at the Census Collectors District level, Sydney,
2001-2006........................................................................................................................................................................... 29
Figure 20: Change in oil and mortgage vulnerability at the Census Collectors District level, Melbourne,
2001-2006........................................................................................................................................................................... 30
Figure 21: Spatial change in oil and mortgage vulnerability at the Census Collectors District level,
Melbourne, 2001-2006. .................................................................................................................................................... 31
Figure 22: Change in oil and mortgage vulnerability at the Census Collectors District level, Adelaide, 2001-
2006..................................................................................................................................................................................... 32
Figure 23: Spatial change in oil and mortgage vulnerability at the Census Collectors District level, Adelaide,
2001-2006........................................................................................................................................................................... 33
Figure 24: Change in oil and mortgage vulnerability at the Census Collectors District level, Perth, 2001-
2006..................................................................................................................................................................................... 34
Figure 25: Spatial change in oil and mortgage vulnerability at the Census Collectors District level, Perth,
2001-2006........................................................................................................................................................................... 35

Table 1: Value assignment relative to Census District percentile for VAMPIRE. ................................................. 13
Table 2: Selected examples of suburban vulnerability based on the 2006 VAMPIRE Index ............................... 25

                                                                                                                                                                               viii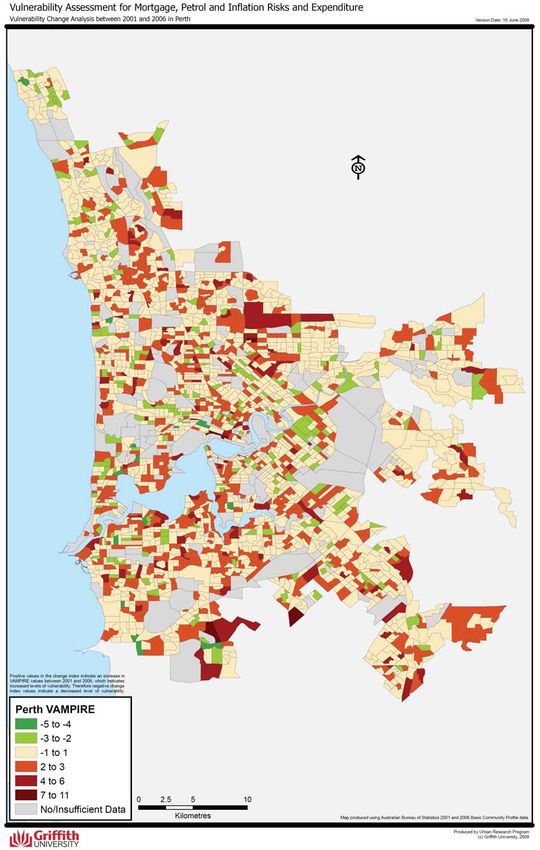
Introduction
This paper provides an update of a report we released in 2006 – titled Shocking the Suburbs –
which examined the distribution of household exposure to higher petrol prices, mortgage
interest rate rises and general price inflation due to increases in global oil prices. That paper
received wide attention from scholars, policy makers and the media. In that paper we
presented a numerical index which we created called the ‘vulnerability assessment for
mortgage, petroleum, and inflation risks and expenditure’ (VAMPIRE). This index measures
the extent of household exposure to the impacts of higher fuel prices and mortgage interest
rates. Versions of the first paper, including the VAMPIRE index, have since been published
in various peer-reviewed venues1.

The 2006 paper used data from the 2001 ABS Census which was the most recent available at
the time. The equivalent data from the 2006 Census became available in early-2008. Thus,
we have been able to update the original VAMPIRE analysis to identify changes in the
distribution of oil and mortgage vulnerability over time. The present paper therefore offers
an opportunity to evaluate the early impacts of higher fuel prices, given that the 2006
Australian Census was undertaken after the global price of oil began its upward march in
2004.

This paper has four aims. First it reviews the basis for the increases in global oil prices seen
since 2004. Next the paper considers some of the emerging evidence of socio-economic
impacts arising from higher fuel prices and mortgage interest rates. Third, the paper presents
the results of the 2006 VAMPIRE and compares them to the 2001 VAMPIRE results.
Finally the paper makes observations about the policy implications of the changes in oil and
mortgage vulnerability within Australian cities – including advocating for urgent government
action to address the oil vulnerability of Australian cities and suburbs and reiterating our
earlier call for more indepth research on this increasingly unsettling issue.

On the up

In 2004 global petroleum prices began to increase sharply from the levels over the previous
two decades. The price of oil was barely more than US$30 per barrel at the start of 2004 but
has grown rapidly since then. The ‘psychological barrier’ of US$50 per barrel [ref] was
broken in early 2005 (Agence Presse France 2004). Oil prices have continued to grow apace
with increasingly marked volatility, reaching US$95 per barrel by the end of 2007 and hitting
US$100 per barrel in February 2008. By May 2008 the price of oil had passed US$130 per
barrel and in June 2008 US$140 was topped for the first time before again dropping to
US$125 per barrel at the time of writing.

1
  Dodson, J. and Sipe, N. (2007). "Oil vulnerability in the Australian city: Assessing socio-economic risks from
higher urban fuel prices." Urban Studies 44(1): 37-62; Dodson, J. and Sipe, N. (2008). "Shocking the Suburbs:
Urban Location, Homeownership and Oil Vulnerability in the Australian City." Housing Studies 23(3): 377-
401.

                                                                                                          1
160
140
120
100
US$ per barrel
80
60
40
20
0
4/01/2000
4/04/2000
4/07/2000
4/10/2000
4/01/2001
4/04/2001
4/07/2001
4/10/2001
4/01/2002
4/04/2002
4/07/2002
4/10/2002
4/01/2003
4/04/2003
4/07/2003
4/10/2003
4/01/2004
4/04/2004
4/07/2004
4/10/2004
4/01/2005
4/04/2005
4/07/2005
4/10/2005
4/01/2006
4/04/2006
4/07/2006
4/10/2006
4/01/2007
4/04/2007
4/07/2007
4/10/2007
4/01/2008
4/04/2008
4/07/2008
Date
(Source: Energy Information Agency 2008)
Figure 1: Spot price for crude oil, 2000-2008.
There are multiple reasons behind the growth in the price of oil. The global economy
continues to expand, creating increased demand for petroleum products. Moderate
economic growth within the developed nations has been accompanied by strong growth in
rapidly industrializing economies, such as China and India, to produce a global growth rate
of around 5 per cent by 2006. China’s economy has grown by more than 7.5 per cent each
year since 1991 and has not slowed below 9 per cent since 2002 (International Monetary
Fund 2007). India’s GDP growth has not been quite as great, yet has remained above 4 per
cent since 1991 and above 7 per cent since 2002 (International Monetary Fund 2007).
Economic growth in China and India is producing an expanding middle class that is
demanding petroleum consumption profiles similar, although not yet as intensive, to their
counterparts in developed nations. The result is massive demands on global petroleum
supplies.
In addition to strong global economic growth, concerns about the security and sustainability
of global petroleum supplies have heightened since 2004. Capacity constraints in the oil
production stream – such as old oil wells, rusting pipelines and ageing refineries – have
limited oil producers’ abilities to keep production rates ahead of demand. In this context it is
not surprising that oil prices have increased. It seems however that this production capacity
deficit will persist for some time. The cost of increasing global petroleum production
capacity – including refining and distribution infrastructure – to meet the level of demand
anticipated by 2030 has been estimated at $US4.3 trillion (International Energy Agency
(IEA) 2006, p. 40). Yet the source of this investment is currently highly uncertain given the
investment risks associated with many oil producing regions. The availability of large sums
of credit is also in doubt given recent problems in global debt markets. To compound these
production problems, a number of major oil producing regions are facing declining
2production due to exhaustion of oil fields. North Sea oil production has been in decline
since 1999 while Mexican oil production is also declining sharply. Production losses in one
oil producing region mean increasing expectations on other zones to maintain production
levels.
Another factor stimulating higher oil prices has been geopolitical instability in some of the
major oil producing regions. The Middle East is the most significant of such zones – global
oil reserves are increasingly concentrated in this region – yet this area is wracked by conflict
and political turmoil. The US has waged war in Iraq since 2003 and tensions between the US
and Iran have become magnified in recent years. Oil prices jumped by eight dollars
overnight in April 2008 after Israel threatened to attack Iran over the latter’s nuclear
ambitions. At the time of writing Iranian missile tests were adding to the volatility of global
oil markets.
On top of these pressures there is growing uncertainty over the long term sustainability of
global petroleum supplies. An expanding number or reports and official documents have
recognized the possibility of global petroleum production reaching a ‘peak’ followed by a
decline. The theory of ‘peak oil’ has gained increasing prominence in public and policy
debates in recent years. Institutions such as the US Government Accountability Office
(Government Accountability Office 2007), the US Army Corps of Engineers (Fournier and
Westervelt 2005), the Australian Senate (2007) and the Queensland Government (2007),
among others, have all investigated the question of peak oil and the depletion of global
petroleum supplies. All have recognised petroleum depletion as a major policy issue that
demands urgent attention. In 2007 the Australian Senate’s bipartisan report accepted that a
global petroleum peak was likely by 2030 and argued that:
[T]he possibility of a peak of conventional oil production before 2030 should be a matter
of concern. Exactly when it occurs (which is very uncertain) is not the important point. In
view of the enormous changes that will be needed to move to a less oil dependent future,
Australia should be planning for it now. (p. 55)
The Queensland Government’s 2007 Oil Vulnerability Taskforce report identified 2013 as a
likely point at which global oil supplies will peak, give or take seven years, thus setting 2020
as its official latest estimate for a peak oil prediction. The current patterns of petroleum
supply and oil prices do not unambiguously support the view that peak oil is approaching,
however the rapid growth of global oil prices provides little evidence for the contrary view.
Regrettably the formal science on petroleum depletion is underdeveloped (in contrast to, for
example, climate change science). As urban planners we consider there is sufficient evidence
regarding oil depletion and a sufficiently large set of implications arising from a global
petroleum peak that the issue must be addressed through further research and analysis.
Even if the world does not experience a peak in production before 2020, the many other
petroleum supply factors discussed above suggest that residents of Australian cities will face
higher fuel prices during that period. Recent experience has shown that global oil prices can
accelerate rapidly. Higher fuel prices also have a number of significant flow-on impacts into
other sectors of the economy and upon Australia’s urban systems. As we have argued
previously (Dodson and Sipe 2008b) and reiterate below, there is now a reasonably
established link between the inflationary effects of higher fuel prices and Australian
3mortgage interest rates, mediated through the Reserve Bank of Australia’s interest rate
policy. Such linkages inevitably amplify the impacts of higher fuel prices on our urban
economies. As a simple matter of national importance, we need to improve our
understanding of the socio-economic impacts of higher fuel prices on our urban systems.
Our interest in this paper is the relative socio-spatial distribution of consequences from
higher fuel prices, including their intersection with other household socio-economic
pressures, such as housing costs. The next sections chart some of the impacts of higher fuel
prices
The cost of petrol prices
The main economic effect of costlier oil has been higher petrol prices in Australian cities. In
January 2004 the price of petrol fluctuated around 85 cents/L across Australia. By June
2008 the average national petrol price had increased to around 160 cents/L representing
almost a one hundred per cent gain in four years. The effect of global petroleum prices on
Australian petrol prices might have been even more pronounced had the Australian dollar
not appreciated so strongly against the US dollar during this period.
Higher fuel prices have unsettled urban motorists, generating a clamour of complaint. Many
households have inevitably found their fuel expenses draining increasingly large proportions
from their budgets. It is worth keeping this financial burden in perspective, however.
According to the most recent official expenditure survey taken in 2003, transport costs make
up around 16 per cent of household expenditure in Australia, while petrol makes up almost a
quarter of all household transport costs (Australian Bureau of Statistics 2006). So, on average,
petrol costs were around four per cent of household expenditure in 2003. However,
aggregate averages mask distributional effects. The burden of rising transport and fuel costs
is shared unevenly between household income segments. Higher fuel prices affect those on
modest or below-average incomes the hardest. In proportional terms, the middle fifth of all
households spends the greatest share of their income on fuel, with the next income bracket
down the second most burdened (Australian Bureau of Statistics 2006). It should be noted
that the data on which these values are based was gathered before oil prices began to grow in
2004. It is reasonable to assume that these costs are now higher than they were at the time of
that survey.
Depending on cars
Dependence on private motor vehicles for travel exacerbates the potential impact of higher
fuel prices on urban households. Australian cities are highly car dependent – approximately
80 percent of trips are taken by private automobile – and therefore also highly petroleum
dependent. But there is a wide spatial variation in automobile dependence for daily travel
within our cities. In general, households in the inner zones of Australia’s major cities use
their cars less than middle suburban households who in turn are less car dependent than
outer suburban households. For those in the inner suburbs, public transport, walking and
cycling tend to substitute for car use. When the car is used in the inner suburbs, the trips are
shorter. Sydney provides a good example of these patterns. Residents of inner eastern
4Sydney use a car for only 48.7 per cent of their journeys and travelled on average 10.1 km
per day (DIPNR 2003). The average trip distance for households in this zone is only 5.7 km.
By comparison, those in Sydney’s outer west use their car for 79.1 per cent of their trips
while travelling an average 33.1 kilometres daily with an average trip distance of 13.7 km.
The Sydney evidence also reveals that those living in inner areas are becoming less car
dependent over time while those in the middle and outer suburban areas are becoming more
car dependent. Thus average daily vehicle kilometres travelled (VKTs) of inner eastern
Sydney residents declined by 9.9 per cent over the decade to 2001 while VKTs for those in
the outer west grew by 22.8 per cent. (DIPNR 2003). Such sharply differentiated travel
patterns imply differentiated household socio-economic exposure to higher fuel prices.
Outer suburban households also tend to have higher rates of car ownership which also
increase transport expenses. The average weekly running cost for a small car was estimated
by the NRMA (2007) at $144 per week; for a medium car the average was $237; and for a
large SUV the cost was $323. Petrol costs make up around 18 per cent of the weekly vehicle
running expenses behind depreciation, fees and the opportunity cost of vehicle capital value.
This means that households in the outer suburbs face heavy additional costs from rising fuel
prices. An outer suburban family with one small and one medium sized car, plus a 4WD
could already be spending more than $600 per week in running costs for their three-car fleet,
based on NRMA figures.
The urban geographic divergence in travel patterns has significant implications for the
distributional effects of higher fuel prices. In the absence of dramatic behavioural shifts on
the part of Australia’s urban motorists, it will be those in the middle and outer suburban
areas of our cities who will face the highest additional costs from higher fuel prices. Even
changes in travel behaviour would inevitably cause disruptions to household activity patterns
– the main means of reducing the cost of car travel is to either get rid of the car or use it less.
Reduced reliance on the car would mean reduced capacity to access activities and services.
Housing oil vulnerability
Australia’s urban housing is also implicated in the process of distributing household socio-
economic vulnerability to higher fuel prices. Settled home ownership remains a major desire
for many Australian households. Around a third of households are currently purchasing their
dwelling via a mortgage. The structure of Australia’s urban housing markets strongly
influences household locational choices. In general, house prices decline as the distance
from the CBD increases. Because household income largely determines borrowing capacity,
lower income households often find their housing opportunities constrained to outer or
fringe suburbs where housing prices are lower. Around half of all first home owners in
Australian cities locate in outer suburban zones (Productivity Commission 2004).
The distribution of new housing stock also influences this pattern because the new stock of
popularly favoured detached dwellings tends to be found in fringe suburban greenfield sites.
Urban geographers and economists have long recognized the effects of this urban socio-
spatial arrangement. Maher et al (1992) warned of the ‘locational disadvantage’ experienced
by outer suburban households who are forced to make trade-offs between affordability and
5access to infrastructure and services. Dispersed urban form and infrastructure deficits,
including poor access to quality public transport, compounds these problems. Burnley et al’s
(1997) study, for example, showed that households who move to outer suburban areas to
attain home ownership become more car dependent as a result of their shift.
The problems of suburban infrastructure deficits, especially in public transport, reflect the
consistent failure of state governments to expand infrastructure to keep pace with the rate
and scale of land development, especially during the period of rapid suburbanisation in the
decades after World War II. Such spatial supply deficits, in part, lie behind the large
variation in travel patterns between inner, middle and outer suburban areas described above.
These problems have been exacerbated by the planning of suburban areas around
automobile travel, including the dispersion of land-uses. The lack of travel alternatives and
the creation of car dependence in large middle and outer suburban areas has been described
as ‘forced car ownership’ (Currie and Senbergs 2007). Such pressures inevitably impose
costs on households through petrol expenses and other car ownership costs such as
depreciation, insurance, maintenance and registration.
The result of these social, housing, transport and planning processes has been to create a
complex set of suburban arrangements which, we argue, unevenly distribute the socio-
economic impacts of higher fuel prices. In general, households in middle and outer suburbs
face higher levels of car dependence and fewer alternative travel options than those in the
inner areas – a result that is, in part, due to lower incomes and thus housing purchasing
capacity. This means that the costs of higher fuel prices will be borne most heavily by those
with the least capacity to pay. The structure of Australia’s infrastructure systems and
housing markets is compounding the unsettling effects of higher fuel prices. The financial
system will further exacerbate this effect.
Compounding pressures
The high concentration of households with mortgages in outer suburban zones complicates
the socio-economic impact of higher petrol prices because of the association between higher
fuel prices and inflation. As fuel prices increased during 2004-2008 they have contributed to
general price inflation in Australia.
Higher inflation in Australia has had broader effects due to government policy responses.
Under the Australian government’s interest rate policy, the Reserve Bank of Australia is
expected to keep inflation in a frame of 2 to 3 per cent by setting interest rates to control the
supply of credit. Official interest rates dropped to as low as 4.25 per cent in 2001, but with
inflation increasing over the past four years, the Reserve Bank has boosted interest rates
twelve times since 2002 to reach 7.25 per cent by early 2008. Oil has been a factor in these
interest rate increases – eight of the increases have occurred since oil prices started
accelerating in 2004. These gains have resulted in higher mortgage interest rates. Standard
variable home mortgage rates have climbed steadily from a thirty-year low of 6.05 per cent as
late as February 2005 to 9.35 per cent by March 2008 (Figure 3). While these rate increases
amount to just over three percentage points on a standard mortgage, this equates to a 50 per
cent increase in interest rates since April 2002.
6250.0
Fuel Price Index
Consumer Price Index
Food Price Index
200.0
Fuel Price Index
150.0
100.0
100 = Jan 1990
50.0
0.0
Sep-72
Sep-73
Sep-74
Sep-75
Sep-76
Sep-77
Sep-78
Sep-79
Sep-80
Sep-81
Sep-82
Sep-83
Sep-84
Sep-85
Sep-86
Sep-87
Sep-88
Sep-89
Sep-90
Sep-91
Sep-92
Sep-93
Sep-94
Sep-95
Sep-96
Sep-97
Sep-98
Sep-99
Sep-00
Sep-01
Sep-02
Sep-03
Sep-04
Sep-05
Sep-06
Sep-07
Date
(Source: ABS Consumer Price Index Series, Cat. No. 6401.0, 2008)
Figure 2: Fuel, Food and Consumer Price Indexes, Australia, 1972-2008.
18.00
16.00
14.00
12.00
Interest Rate (% p/a)
10.00
8.00
6.00
4.00
2.00
0.00
Jan-88
Jan-89
Jan-90
Jan-91
Jan-92
Jan-93
Jan-94
Jan-95
Jan-96
Jan-97
Jan-98
Jan-99
Jan-00
Jan-01
Jan-02
Jan-03
Jan-04
Jan-05
Jan-06
Jan-07
Jan-08
Month-Year
(Source: Reserve Bank of Australia, Indicator lending Rates, F05 (2008)).
Figure 3: Indicator standard variable housing loan interest rates, Australia, 1988-2008.
7500.0
450.0
400.0
350.0
300.0
$ billion
250.0
200.0
150.0
100.0
50.0
0.0
Se 9 8
Se 9 9
Se 00
Se 01
Se 0 2
Se 0 3
Se 0 4
Se 05
Se 0 6
Se 0 7
M 98
Ja 8
M 99
Ja 9
M 00
Ja 0
M 01
Ja 1
M 02
Ja 2
M 03
Ja 3
M 04
Ja 4
M 05
Ja 5
M 06
Ja 6
M 07
Ja 7
08
9
9
0
0
0
0
0
0
0
0
-
-
-
-
-
-
-
-
-
-
p-
p-
p-
p-
p-
p-
p-
p-
p-
p-
n-
n-
n-
n-
n-
n-
n-
n-
n-
n-
n-
ay
ay
ay
ay
ay
ay
ay
ay
ay
ay
Ja
Month-Year
(Source: Reserve Bank of Australia, Bank Lending Classified by Sector, D05, (2008))
Figure 4: Total value of Bank Loans for Owner Occupied Housing, Australia, 1998-
2008.
The effect of mortgage interest rate rises is magnified by the housing boom which saw
marked house price inflation across Australian cities during the late-1990s and early-2000s
Part of this housing boom was enabled by the availability of cheap credit signalled by low
interest rates. Australia’s housing debt was $139 billion in 1998 but by 2008 had more than
tripled, to $448 billion (Figure 4). This growth was made possible by an unusual combination
of historically low, stable interest rates assisted by low unemployment. Many households
took advantage of lower interest rates during the late-1990s and early-2000s to seek home
ownership.
The period also saw the proportion of Australian mortgagee households increase from 28.1
percent in 1996 to 35.1 per cent by 2004 (Australian Bureau of Statistics 2007, table 1). In
New South Wales this gain was particularly pronounced with 33.2 per cent of households
holding mortgages in 2004 compared to just 24.7 per cent in 1996 (Australian Bureau of
Statistics 2007, table 2). The broader effect of this shift has been that many modest-income
households have swelled the ranks of mortgaged home owners and now face much higher
interest payments on their mortgages. The ratio of housing debt to disposable income in
Australia has gone from less than 50 per cent in the early 1990s to almost 140 per cent by
late-2007 (Reserve Bank of Australia 2008a). The housing debts of many urban households
far exceed 140 per cent of their incomes.
In March 1998, the average Australian household was spending 4.7 per cent of disposable
income on mortgage interest payments. A decade later this figure had more than doubled to
9.5 per cent (Reserve Bank of Australia 2008a). Australia’s households are now expending a
greater proportion of their income than at any time since measurement began in 1977. The
pressure of debt weighs heaviest on those with lower incomes. Mortgagee households in the
8lowest income quintile are typically more highly geared and more likely to suffer financial
stress from housing debt than those in higher income brackets (La Cava and Simon 2005).
Re-financing as a proportion of new loans rose from 18.7 per cent in early 2000 to 30.2 per
cent by 2008 (Reserve Bank of Australia 2008b) suggesting that the impacts of higher fuel
prices, inflation and interest costs were motivating households to rationalise their financial
commitments.
First home buyers have been especially impacted by this process. The average first home
mortgage in Australia more than doubled from $92,000 in 1995 to $209,600 in 2006
(Australian Bureau of Statistics 2007). For those living in Sydney, the average first home
loan grew to $260,000 by 2006. By 2003 of all Australian households paying more than half
of their income on their mortgage, 80 percent were first home buyers. Given that first home
buyers tend to be relatively younger and have lower incomes than mortgage holders, the
impact of house price inflation and its increased debt demands can only be viewed as
regressive. The compounding effect of higher fuel prices driving both general price inflation
and higher mortgage interest rates combined with the structure of Australian cities and urban
housing markets is amplifying the socio-economic risk from higher fuel prices.
The Effects of Recent Fuel Price Increases
There has been little research which has assessed the impact of higher fuel prices on
Australia’s urban households – despite our previous calls for such effort. There is still no
publicly available dataset that records household transport activity and housing costs within
Australian cities. This ongoing deficit makes comprehensive assessment of the impacts of
higher fuel prices difficult. However, some insight into the broader socio-economic effects
of costlier petrol and higher mortgage interest rates can be discerned from a range of
sources. We review some of this evidence in the remainder of this section.
Shifting perceptions
One of the key effects of higher fuel prices has been changing public perceptions of their
significance. This shift is demonstrated in regular consumer surveys undertaken by the Sensis
over the past few years. After rising oil prices led them to add ‘the price of petrol’ to its list
of consumer concerns in May 2005, households immediately rated this issue as their greatest
fear, far above other anxieties such as ‘the conflict in Iraq’, ‘the environment’ and ‘the
workplace relations system’ (Sensis 2005). Petrol prices consistently topped consumer
concerns between 2005 and 2006. While they yielded to drought and interest rates during a
few quarters in 2006 and 2007, by February 2008 petrol prices were again the number one
household fear. Terrorism, by comparison, barely rates as an issue of concern. The Sensis
surveys also revealed that by September 2006, 45 per cent of households reported having to
reduce their budgets to cope with higher fuel prices. Some 30 per cent of surveyed
households were cutting back on entertainment and dining out while another 22 per cent
were trying to use their car less. A further 19 per cent were forgoing holidays while 11 per
cent were cutting down on food. Households on low or modest incomes have faced the
9toughest adjustment to higher petrol prices; more than half of those on annual incomes less
than $35,000 reported cutting spending in an effort to cope. By February 2008, petrol
pressures were nominated in the Sensis survey as the greatest financial fear of households on
annual incomes of up to $55,000 (Sensis 2008).
Close to busting
Another indicator of the impact of higher fuel prices has been the dramatic growth in public
transport use over the last few years. Brisbane is a good example of this massive patronage
boost. In each of the three years since 2004 when fuel prices grew strongly, public transport
patronage increased by an average of 9.7 per cent, adding 12.3 million new passengers to the
region’s system in 2005 followed by another 15.3 million in 2006. This sudden shift took
Brisbane’s transport planners by surprise given just 3.8 per cent growth in the three years up
to 2004. Bus services have struggled to cope under the strain of such massive growth.
Overcrowding has become widespread and chronic. In March 2007, a total of 1,749 buses
were forced to abandon passengers at stops because they were simply too full. By April
2008 this problem afflicted 1,800 services.
284
282
280
278
Passengers (million)
276
274
272
270
268
266
264
2001/2002 2002/2003 2003/2004 2004/2005 2005/2006 2006/2007
Year
(Source: RailCorp Annual Reports)
Figure 5: Sydney rail patronage 2001/2002 to 2006/2007.
Fuel price pressures have put Melbourne’s tram and train network under strain. Melbourne’s
rail patronage has grown by more than 10 per cent annually since 2004 from 137 million
boardings to an estimated 200 million in 20082. Overcrowding on trains has caused intense
public disquiet. The government and private operators have struggled to organise sufficient
services to meet demand, but in March 2008 added another 200 weekly services. Rail
2
Some of this apparent growth is a result of changes in the way rail patronage is recorded (see Mees Mees, P.
(2008). Does Melbourne Need Another Rail Tunnel? Melbourne, Environment and Planning Program, RMIT
University.).
10patronage in Sydney is another indicator of fuel price pressures driving modal shifts (Figure
X). In Sydney rail patronage had steady declined during the first part of the decade to a low
of 270.3 million passengers during 2005 (RailCorp 2006). After strong fuel price growth,
Sydney’s rail patronage has grown sharply. An 11 million extra journeys boosted annual
patronage to 281.3 million by 2007 (RailCorp 2007). This growth is perhaps all the more
notable given the broad perception of poor New South Wales government management of
the Sydney rail network.
Hitting home
For a growing number of households the cost of mortgage repayments has exceeded their
capacity to pay. Mortgage repossessions in Australian cities have begun tracking upward.
This effect is clearest in Sydney where the housing boom was most pronounced. At the peak
of the house price boom in 2004, the New South Wales Supreme Court ordered just 1,750
writs of possession. By 2007 this figure had doubled to 3,935 repossessions (Saulwick 2008).
A recent study of mortgage delinquency by Fitch Ratings (2008) found repossessions
concentrated in a set of suburbs across western Sydney. Guildford was the most affected
suburb with 5.7 percent of mortgages in default followed by nearby Granville, Wetherill Park
and Belmore.
The effects described above appear to be consistent with what might be expected from the
combined socio-economic pressures of higher fuel prices and mortgage interest rates on
Australian urban households. Many households on lower incomes are becoming
increasingly concerned about higher petrol prices while large numbers are beginning to
contemplate changes to their travel behaviour to offset higher fuel costs. In turn, a growing
number of households are facing further pressures on their capacity to afford mortgage
finance for home ownership.
While the above patterns indicate early responses to higher urban fuel prices we anticipate
that more profound effects are likely but that these will take time to develop momentum as
higher fuel costs percolate through the urban economy. Australia has luckily benefited from
seventeen years of continuous economic expansion which is unlikely to be immediately
slowed by higher fuel costs. In this context, the gradual increases in fuel prices are unlikely
to instantly flow through to the urban economy; the effects of higher fuel prices are more
likely to be gradually realised over a number of years. In mid 2008 Australia’s cities have
probably only just begun to experience the full effects of the higher fuel prices of the 2004-
2006 period. The full impacts of the dramatically higher 2008 fuel prices will probably not
be seen until the early years of the next decade. In this context the problem of household
socio-economic vulnerability and exposure to the impacts of higher fuel prices and mortgage
interest rates remains highly relevant. In the absence of higher quality socio-spatial data our
‘vulnerability assessment for mortgage, petroleum, and inflation risks and expenditure’
remains a good means of assessing the spatial distribution of the socio-economic pressures
from higher fuel prices.
11The 2006 VAMPIRE: Mapping oil, mortgage and inflation
vulnerability.
To understand household vulnerability to socio-economic stressors we created the
‘Vulnerability Assessment for Mortgage, Petrol and Inflation Risks and Expenditure’, known
as the VAMPIRE. This is an index which calculates the level of household vulnerability at
the local level and is based on Australian Census data. It combines information on car
dependence, mortgages and incomes at the Collection District (CD) level (about 200
households).
We first presented the VAMPIRE in our 2006 paper Shocking the Suburbs which used 2001
Census data to assess oil and mortgage vulnerability across Brisbane, the Gold Coast,
Sydney, Melbourne, Adelaide and Perth3. With data from the 2006 Census now available we
have updated the 2001 VAMPIRE analysis. This allows us to compare patterns in 2006 with
those in 2001. The results of this analysis are presented below following a reprisal of the
methodology used to analyse the Census data.
The VAMPIRE Index is constructed from four indicator variables obtained from the 2001
and 2006 ABS Censuses that are combined to provide a composite vulnerability index which
can be mapped at the CD level. The VAMPIRE Index assesses the average vulnerability of
households within the CD rather than the specific vulnerability of individual households.
The variables used are:
Car dependence:
• Proportion of those working who undertook a journey to work (JTW) by car (either as a
driver or passenger)
• Proportion of households with 2 or more cars
Income level:
• Median weekly household income
Mortgages:
• Proportion of dwelling units that are being purchased (either through a mortgage or a
rent/buy scheme)
The first two variables indicate the extent of car dependence for urban travel. The JTW
variable provides a basic measure of demand for automobile travel while the proportion of
motor vehicles per household indicates the extent of household investment, and thus
dependence, on motor vehicle travel. Together these two variables provide an indicator of
the extent to which households are exposed to rising costs of motor vehicle travel.
The mortgage variable represents the prevalence of mortgage tenure and accordingly
household exposure to interest rate rises. The income variable is used to measure the
3
Dodson, J. and Sipe, N. (2006) Shocking the Suburbs: Urban Location, Housing Debt and Oil Vulnerability in the
Australian City, Research Paper 8; Brisbane, Urban Research Program, Griffith University.
12financial capacity of the locality to absorb fuel and general price increases. Together these
four variables provide a basic, but comprehensive, spatial representation of household
mortgage and oil vulnerability.
The VAMPIRE Index was constructed by combining the four variables as shown in Table 2.
High levels of car ownership, JTW by car and mortgage tenure received high index values
while low levels of household incomes received lower scores. Thus a CD with high levels of
car ownership, JTW by car, income and mortgages would receive a score of 15 (5+5+0+5)
as shown in Table 2. The four variables we have selected are not equal in their contribution
to the VAMPIRE Index. The variables have been weighted according to their proportional
contribution to the overall VAMPIRE Index (Table 3). Thus of a total possible VAMPIRE
Index of 30, five points are provided by each of the car ownership and JTW variables while
ten points each are provided by the income and mortgage scores.
Table 1: Value assignment relative to Census District percentile for VAMPIRE.
Value Assigned
Percentile
Car own ≥ 2 JTW by car Income Mortgage
100 5 5 0 5
90 4 4 1 4
75 3 3 2 3
50 2 2 3 2
25 1 1 4 1
10 0 0 5 0
The VAMPIRE Index permits two forms of analysis to be undertaken. First a simple update
of the VAMPIRE Index based on the 2006 Census data is possible. We present the results
of the 2001 and 2006 VAMPIRE assessments in Part A. Next a comparison of patterns
between 2001 and 2006 can be undertaken and the relative increase or decline in oil
vulnerability for given areas identified. The results of this analysis are presented in Part B.
Part A: The 2006 VAMPIRE: Distributing urban oil and mortgage vulnerability.
Thematic maps were created for five major Australian cities – Brisbane, Sydney, Melbourne,
Adelaide and Perth – based on the ABS definition of the urban area and shaded from
minimal to very high vulnerability. The results of this mapping are presented in figures x to
XXX. We have placed the 2001 and 2006 VAMPIRE maps side by side so that a visual
comparison can be made4.
Rather than describe the distribution of oil and mortgage vulnerability suburb by suburb for
each city, we consider that the patterns are sufficiently generalised that they can be grouped
by VAMPIRE category. We discuss the results of the 2006 VAMPIRE assessment (to p.25)
4
We note that there may be some slight differences between the 2001 maps in our earlier paper and those in the present
paper. These differences arise because of changes in the compilation of Census data between 2001 and 2006, including
changes to a small number of Collectors District boundaries, which necessitated minor adjustments to the method to
ensure inter-Censal comparability.
13Figure 6: Oil and mortgage vulnerability in Brisbane, 2001.
14Figure 7: Oil and mortgage vulnerability in Brisbane, 2006.
15Figure 8: Oil and mortgage vulnerability in Sydney, 2001.
16Figure 9: Oil and mortgage vulnerability in Sydney, 2006.
17Figure 10: Oil and mortgage vulnerability in Melbourne, 2001.
18Figure 11: Oil and mortgage vulnerability in Melbourne, 2006.
19Figure 12: Oil and mortgage vulnerability in Adelaide, 2001.
20Figure 13: Oil and mortgage vulnerability in Adelaide, 2006.
21Figure 14: Oil and mortgage vulnerability in Perth, 2001.
22Figure 15: Oil and mortgage vulnerability in Perth, 2006.
23(from p. 13) according to four categories of vulnerability, ranging from low vulnerability to high
vulnerability5. Rather than an exhaustive recounting of the specifics of each category by city we
encourage the reader to use our discussion to guide their own perusal of the maps.
Minimal and Low Vulnerability Areas
Inner city areas of these five Australian cities almost universally fall into low or moderate
vulnerability categories. Places like New Farm and Indooroopilly in Brisbane, Crows Nest, Surry
Hills and Bondi in Sydney, Fitzroy and Collingwood and St Kilda in Melbourne, central, inner
north and inner eastern Adelaide with Crawley, Claremont and central Perth all rating as having
low oil and mortgage vulnerability. The residents of these areas are typically wealthier than
average and are far more likely to use public transport, walk or cycle than those more distant
from the city centre, in part because these areas have some of the best public transport services.
Some minimal or low oil vulnerability areas are found in locations distant from the CBD. For
example in Brisbane areas such as Chapel Hill and Kenmore exhibit low oil vulnerability while
most of Sydney’s northern suburbs (east of Epping) fall within low oil vulnerability categories.
Comparable patterns apply to Melbourne and Adelaide’s eastern suburbs. Low oil vulnerability
areas are found as far east as Box Hill in Melbourne and as far south east as Blackwood in
Adelaide. Low oil and mortgage vulnerability areas are found along Perth’s western shorefront
including Mulalloo and Scarborough.
Moderate Vulnerability Areas
The suburbs beyond the immediate core of Australian cities are more oil vulnerable than those at
the centre but only moderately so. These include suburbs such as Hamilton, Kenmore, Stafford
and Holland Park in Brisbane. In Sydney the lower oil vulnerability zones are much more
extensive and include southern suburbs adjacent to Parramatta Road and south of the CBD plus
almost all of northern Sydney east of Macquarie Park. Melbourne’s moderate oil and mortgage
vulnerability suburbs include, among a large swathe, most of Essendon, Brunswick and
Northcote, and extend as far east as Doncaster, Surry Hills, Chadstone and Brighton. In
Adelaide a band of moderate oil vulnerability localities west of the central city extends south from
Marion to Mitchell Park while a further zone is apparent to the north west of the Adelaide CBD.
In Perth moderate vulnerability areas are found to the south, east and north of the CBD in places
like Bull Creek, Cloverdale and Duncraig.
High Vulnerability Areas
In general, the VAMPIRE index shows that the further from the centre of the city a suburb is
situated, the more likely it is to fall into the higher vulnerability categories. In Australian cities
large areas of moderate-high oil and mortgage vulnerability are found in the middle and outer
suburbs. In Brisbane these areas include suburbs like Narangba, Beenleigh, Karalee and
Drewvale, all in outer suburban areas. Sydney’s areas of moderate-high oil and mortgage
vulnerability include outer suburbs such as Campbelltown, Regents Park, Penrith and Camden.
In Melbourne a large swathe of high oil vulnerability suburbs cover Sunshine, Lilydale, Werribee
and South Morang. Adelaide’s high oil vulnerability zones include suburbs such as Northfield,
Paralowie, Craigmore and Campbelltown. In Perth, high vulnerability areas are found among
5
Minimal vulnerability categories are combined with the Low vulnerability categories for this discussion.
24outer suburban zones such as Coogee in the south, Bassendean and Kenwick in the east, plus
Innaloo, and Karalloo in the north.
Table 2: Selected examples of suburban vulnerability based on the 2006 VAMPIRE Index
Vulnerability Category
City (VAMPIRE Index Range)
Minimal/Low (0-14) Moderate (15-16) High (17-18) Very High (19-30)
Brisbane Indooroopilly Stafford Narangba Browns Plains
New Farm Holland Park Beenleigh Caboolture
Coorparoo Hamilton Karalee Redcliffe
Bulimba Kenmore Drewvale Capalaba
Sydney North Sydney Baulkham Hills Campbelltown Cabramatta
Mosman East Hills Regents Park Parramatta
Potts Point Kellyville Camden Hebersham
Pymble Phillip Bay Penrith Fairfield East
Melbourne Port Melbourne Essendon Sunshine Deer Park
Brunswick Glen Waverley Lilydale Beaconsfield
Camberwell Oakleigh Werribee Roxburgh Park
Bentleigh Nunawading South Morang Knoxfield
Adelaide Central Adelaide Newton Campbelltown Wingfield
North Adelaide Reynella East Northfield Seaford
Hyde Park Allenby Gardens Paralowie Parafield Gardens
Beaumont Pennington Craigmore Elizabeth
Perth Central Perth Bull Creek Bassandean Banksia Grove
Crawley Cloverdale Karalloo Marangaroo
Claremont Duncraig Innaloo Huntingdale
Carine Lesmurdie Kenwick Armadale
Very High Vulnerability Areas
Very high vulnerability is distributed across large tracts of the outer areas of Australia’s cities.
These include places such as Caboolture, Redcliffe, Capalaba, Logan, Beenleigh and Browns
Plains in Brisbane. In Sydney high oil and mortgage vulnerability is distributed across much of
the city’s western suburbs including Hebersham, Green Valley, Cabramatta and Canterbury in the
mid and outer west. Even parts of Sydney’s inner west show high levels of oil vulnerability with
many areas around Bankstown exhibiting high VAMPIRE scores. In Melbourne the pattern of
outer suburban oil vulnerability is particularly pronounced. Melbourne is ringed by a number of
high vulnerability zones, including many outer suburban growth corridors such as Frankston,
Cranbourne, Berwick and Knox Park in the south-east plus Epping, Roxburgh Park and
Cragieburn in the north and Kings Park, Deer Park plus Hoppers Crossing in the west. In
Adelaide the most vulnerable suburbs include Queenstown, Burton, Holden Hill and Elizabeth in
the north plus Christies Beach and Hackham West, Morphett Vale and Sturt in the south.
Perth’s most vulnerable localities include Banksia Grove, Girrawheen, Balga, Marangaroo,
Alexander Heights, Ballajura, Beechboro and Morely in the north, Gooseberry Hill in the east
and Langford, Huntingdale, Seville Grove, Armadale, Hamilton Hill and Success in the south.
25You can also read