ARCHAEA ENERGY INVESTOR PRESENTATION APRIL 2021 - Rice Acquisition Corp.
←
→
Page content transcription
If your browser does not render page correctly, please read the page content below
ARCHAEA                INVESTOR PRESENTATION
            ENERGY                 APRIL 2021
Renewable Energy. Redefined.

                               1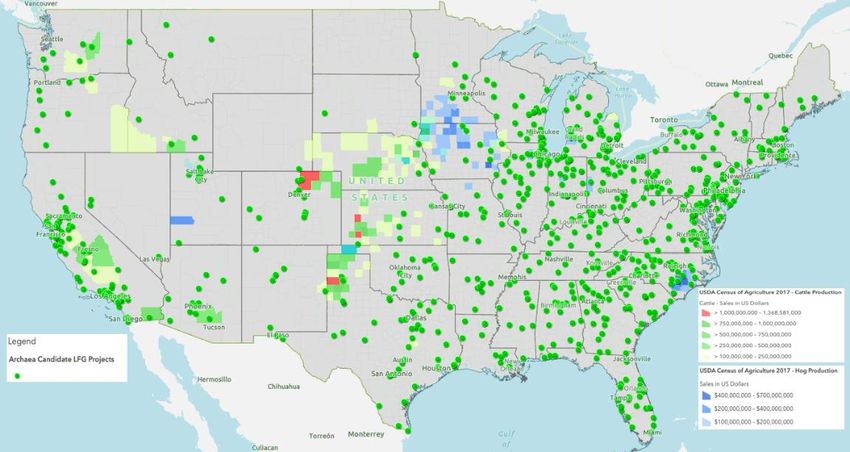
Disclaimer
This investor presentation (the “Investor Presentation”) is for informational purposes only and does not constitute an offer to sell, a solicitation of an offer to buy, or a recommendation to purchase any equity, debt or other financial instruments of Rice Acquisition Corp. (the “SPAC”), Archaea Energy LLC (“Archaea”) or Aria
Energy LLC (“Aria” and together with Archaea and their respective parent companies, subsidiaries and associated companies, the “Companies”), which offer may only be made at the time a qualified offeree receives definitive offering documents and other materials (collectively, the “Offering Materials”). Without limiting the
generality of the foregoing, this Investor Presentation does not constitute an invitation or inducement of any sort to any person in any jurisdiction in which such an invitation or inducement is not permitted or where the SPAC and the Companies are not qualified to make such invitation or inducement. In the event of any
conflict between this Investor Presentation and information contained in the Offering Materials, the information in the Offering Materials will control and supersede the information contained in this Investor Presentation. No person has been authorized to make any statement concerning the SPAC and the Companies other than
as will be set forth in the Offering Materials, and any representation or information not contained therein may not be relied upon. An investment in the Companies should be made only after careful review of the information contained in the Offering Materials.

General
This Investor Presentation is strictly confidential and may not be copied, reproduced, redistributed or passed on, in whole or in part, or disclosed, directly or indirectly, to any other person or published or for any purpose without the express written approval of the SPAC and the Companies. By accepting this Investor
Presentation, the recipient agrees that it will, and will cause its representatives and advisors to, use this Investor Presentation, as well as any information derived by the recipient from this Investor Presentation, only for initial due diligence regarding the SPAC and the Companies in connection with (1) the SPAC’s proposed
business combination (the “Business Combination”) with one or more of the Companies and (2) the SPAC’s proposed private offering of public equity (the “PIPE Offering”) to a limited number of investors that qualify as QIBs and Institutional Accredited Investors (each as defined below) and for no other purpose and will not,
and will cause their representatives and advisors not to, divulge this Investor Presentation to any other party. This Investor Presentation may not be reproduced or used for any other purpose.
The information contained herein does not purport to include all the information that may be important to you in connection with your consideration as to whether to invest in the PIPE Offering. This Investor Presentation is based upon financial information reasonably available to the Companies and shared with the SPAC for
inclusion herein as of the date hereof. The data contained herein is derived from information provided by the Companies and various third-party sources and is included herein for illustrative purposes only. The delivery of this Investor Presentation shall not, under any circumstances, create any implication that the Investor
Presentation is correct in all respects, including as of any time subsequent to the date hereof, and the SPAC and the Companies do not undertake any obligation to update such information at any time after such date. Certain information in this Investor Presentation may be based upon information from third-party sources
which we consider reliable, but none of the SPAC nor the Companies represent that such information is accurate, complete or sufficient for any purpose and it should not be relied upon as such. Any historical price(s) or value(s) are as of the date indicated unless stated otherwise. No representation is made as to the
reasonableness of the assumptions made within or the accuracy or completeness of any projections, modeling or back-testing or any other information contained herein. All levels, prices and spreads are historical and do not represent current market levels, prices or spreads, some or all of which may have been changed since
the date hereof. Any data on past performance, modeling or back-testing contained herein is not an indication as to future performance and should not be relied upon as an indication of future performance. Neither the SPAC nor any of the Companies assumes any obligation to update the information, back-testing, models or
assumptions underlying the foregoing in this Investor Presentation.
Neither the SPAC nor any of the Companies nor any of their respective affiliates makes any representation or warranty, express or implied, as to the accuracy or completeness of the Investor Presentation and nothing contained herein should be relied upon as a promise or representation as to past or future performance of the
SPAC, the Companies or any other entity referenced herein. In particular, no representation or warranty is made with respect to the reasonableness of any estimates, forecasts, illustrations, prospects or returns, which should be regarded as illustrative only, or that any profits or projections will be realized. The metrics regarding
select aspects of the SPAC’s and the Companies’ operations were selected by the SPAC and the Companies on a subjective basis. Such metrics are provided solely for illustrative purposes to demonstrate elements of the SPAC’s and the Companies’ businesses, are incomplete, and are not necessarily indicative of the SPAC’s
and Companies’ performance or future performance or overall operations. There can be no assurance that historical trends will continue. An investment in the PIPE Offering entails a high degree of risk and no assurance can be given that investors will receive a return on their capital and investors could lose part or all of their
investment.
This Investor Presentation is being distributed to selected recipients only and is not intended for distribution to, or use by any person or entity in, any jurisdiction or country where such distribution or use would be contrary to local law or regulation. Neither this Investor Presentation nor any part or copy of it may be taken or
transmitted into the United States or published, released, disclosed or distributed, directly or indirectly, in the United States, , except to a limited number of qualified institutional buyers (“QIBs”), as defined in Rule 144A under the Securities Act of 1933, as amended (the “Securities Act”), or institutional “accredited
investors” (“Institutional Accredited Investors”) within the meaning of Regulation D under the Securities Act.
As of the date hereof, none of the information contained herein has been filed with the U.S. Securities and Exchange Commission, any securities administrator under any securities laws of any U.S. or non-U.S. jurisdiction or any other U.S. or non-U.S. governmental or self-regulatory authority. No such governmental or self-
regulatory authority will pass on the merits of the PIPE Offering or other offering of interests in the Companies or the adequacy of the information contained herein. Any representation to the contrary is unlawful.
EACH RECIPIENT ACKNOWLEDGES AND AGREES THAT IT IS RECEIVING THIS INVESTOR PRESENTATION ONLY FOR THE PURPOSES STATED ABOVE AND SUBJECT TO ALL APPLICABLE CONFIDENTIALITY OBLIGATIONS AS WELL AS THE UNITED STATES SECURITIES LAWS PROHIBITING ANY PERSON WHO HAS
RECEIVED MATERIAL, NON-PUBLIC INFORMATION FROM PURCHASING OR SELLING SECURITIES OF THE SPAC OR FROM COMMUNICATING SUCH INFORMATION TO ANY OTHER PERSON UNDER CIRCUMSTANCES IN WHICH IT IS REASONABLY FORESEEABLE THAT SUCH PERSON IS LIKELY TO PURCHASE OR
SELL SUCH SECURITIES.

Presentation of Financial and Other Information
Unless otherwise indicated herein, this Investor Presentation presents financial and other information of the Companies on a pro forma combined basis and not a historical pro forma or standalone basis. No independent registered public accounting firm has audited, reviewed, compiled, or performed any procedures with
respect to the combined pro forma financial information of the Companies for the purpose of inclusion in this Investor Presentation, and accordingly, neither the SPAC nor any of the Companies expresses an opinion or provides any other form of assurance with respect thereto for the purpose of this Investor Presentation. The
pro forma combined data included herein has not been prepared in accordance with GAAP and does not reflect or predict actual results of a combined audit in accordance with GAAP, which actual results could materially differ from the data presented herein. Such information is included for illustrative purposes only.
Unless otherwise specified herein, the amounts, percentages, leverage ratios, descriptions, estimates, assumptions and projections contained herein assume no redemptions and exclude the dilutive impact of 11.9 million public warrants and 6.8 million SPAC sponsor warrants. Illustrative amounts may fluctuate as a result of
redemptions, including an increase in the amount of debt. As a result, the amounts, percentages, leverage ratios, descriptions, estimates, assumptions and projections contained herein are subject to adjustments that could cause actual results to differ from the amounts, percentages, leverage ratios, descriptions, estimates,
assumptions and projections discussed or implied herein.
Certain aspects of the calculation of the pro forma combined financial information presented herein may be subject to change, but neither the Companies nor the SPAC deems such changes material to (i) an investor’s understanding of the pro forma combined financial information of the Companies, (ii) an investor’s
understanding of the potential merits of the proposed Business Combination or (iii) an investor’s decision to participate in the proposed PIPE Offering. Neither the SPAC nor any of the Companies undertakes or assumes any obligation to update any of the financial information presented herein.
In the event of any inconsistency between the Companies’ pro forma financial information presented herein and the Companies’ financial information presented in the proxy statement which will be filed in connection with the Business Combination (the “Merger Proxy”), the Merger Proxy shall govern. All information provided
in this Investor Presentation is qualified in all respects by the information set forth in the Merger Proxy and the other documents attached thereto or incorporated by reference therein. You are strongly encouraged to carefully review and consider all of the information provided or incorporated by reference in the Merger Proxy
when available.

Use of Projections
This Investor Presentation contains pro forma financial information, financial forecasts and other projections (collectively “Projections”) prepared by the Companies with respect to one or more Companies including on a combined basis. None of the Companies’ or the SPAC’s independent registered public accounting firms
have audited, reviewed, compiled, or performed any procedures with respect to the Projections for the purpose of their inclusion in this Investor Presentation, and accordingly, neither the SPAC nor any of the Companies expresses an opinion or provides any other form of assurance with respect thereto for the purpose of this
Investor Presentation. These Projections should not be relied upon as being necessarily indicative of future results with respect to any Company on a standalone basis or with respect to the combined Companies. The Projections presented herein are provided solely for illustrative purposes, reflect the current beliefs of the
applicable Companies as of the date hereof, and are based on a variety of assumptions and estimates about, among others, future operating results, market conditions, any related transaction costs, all of which may differ from the assumptions on which the Projections herein are based. None of the Companies assumes any
obligation to update the Projections or information, data, models, facts or assumptions underlying the foregoing in this Investor Presentation.

                                                                                                                                                                     i
Disclaimer                                   (cont’d)
Any financial projections in this Investor Presentation are forward-looking statements that are based on assumptions that are inherently subject to significant uncertainties and contingencies, many of which are beyond the SPAC’s and the Companies’ control. While all projections are necessarily speculative, the SPAC and the
Companies believe that the preparation of prospective financial information involves increasingly higher levels of uncertainty the further out the projection extends from the date of preparation. The assumptions and estimates underlying the projected results are inherently uncertain and are subject to a wide variety of
significant business, economic and competitive risks and uncertainties that could cause actual results to differ materially from those contained in the projections. There are numerous factors related to the markets in general or the implementation of any operational strategy that cannot be fully accounted for with respect to
the Projections herein. Any targets or estimates are therefore subject to a number of important risks, qualifications, limitations, and exceptions that could materially and adversely affect the SPAC and the Companies’ performance. Moreover, actual events are difficult to project and often depend upon factors that are beyond
the control of the SPAC and the applicable Company and its affiliates. The performance projections and estimates are subject to the ongoing COVID-19 pandemic, and have the potential to be revised to take into account further adverse effects of the COVID-19 pandemic on the future performance of the SPAC and the
applicable Company. Projected returns and estimates are based on an assumption that public health, economic, market, and other conditions will improve; however, there can be no assurance that such conditions will improve within the time period or to the extent estimated by the SPAC and the Companies. The full impact of
the COVID-19 pandemic on future performance is particularly uncertain and difficult to predict, therefore actual results may vary materially and adversely from the Projections included herein.

Cautionary Language Regarding Forward Looking Statements
This Investor Presentation includes “forward looking statements” within the meaning of the “safe harbor” provisions of the United States Private Securities Litigation Reform Act of 1995. Forward-looking statements may be identified by the use of words such as “may,” “might,” “will,” “would,” “could,” “should,” “forecast,”
“intend,” “seek,” “target,” “anticipate,” “believe,” “expect,” “estimate,” “plan,” “outlook,” and “project” and other similar expressions that predict or indicate future events or trends or that are not statements of historical matters. Statements other than historical facts, including, but not limited to, those concerning (i) the
Business Combination, (ii) the PIPE Offering, (iii) market conditions, (iv) the revenues, earnings, performance, strategies, prospects and other aspects of the businesses of the SPAC and the Companies or (v) trends, consumer or customer preferences or other similar concepts with respect to the SPAC, the Companies or the
Business Combination, are based on current expectations, estimates, projections, targets, opinions and/or beliefs of the SPAC and the applicable Companies or, when applicable, of one or more third-party sources. Such statements involve known and unknown risks, uncertainties and other factors, and undue reliance should
not be placed thereon. The risks and uncertainties that could cause those actual results to differ materially from those expressed or implied by these forward-looking statements include, but are not limited to, (1) our ability to develop and operate new renewable energy projects, (2) reduction or elimination of government
economic incentives to the renewable energy market, (3) delays in acquisition, financing, construction and development of new projects, (4) the length of development cycles for new projects, including the design and construction processes for our projects, (5) identifying suitable locations for new projects, (6) dependence on
landfill operators, (7) existing regulation and changes to regulations and policies that effect our operations, (8) decline in public acceptance and support of renewable energy development and projects, (9) sustained demand for renewable energy and (10) impacts of climate change, changing weather patterns and conditions,
and natural disasters. You are cautioned not to place undue reliance upon any forward-looking statements, which, unless otherwise indicated herein, speak only as of the date of this Investor Presentation. Neither the SPAC nor any of the Companies commits to update or revise the forward-looking statements set forth herein,
whether as a result of new information, future events or otherwise, except as may be required by law. Forward-looking statements and discussions of the business environment and management strategy of the SPAC and Companies included herein (e.g., with respect to financial markets, business opportunities, demand,
investment pipeline and other conditions) may materially differ as a result of the severe and ongoing COVID-19 pandemic. The full impact of the COVID-19 pandemic is particularly uncertain and difficult to predict, therefore such forward-looking statements do not reflect its ultimate potential effects, which may substantially
and adversely impact the performance of the SPAC and the Companies.

Note on Performance/Statistics and Use of Non-GAAP Financial Measures
Past performance is not indicative of future results. Unless otherwise specified herein, performance figures included herein are presented on a forward-looking, pro forma basis and do not reflect any events subsequent to the date hereof, including the continued impact of the COVID-19 pandemic and further deterioration of
global economic conditions. The full impact of the COVID-19 pandemic is particularly uncertain and difficult to predict, but may have an adverse effect on the future performance of the SPAC and the Companies.
This Investor Presentation includes certain non-GAAP financial measures, such as EBITDA, EBITDA margin and free cash flow, that are not prepared in accordance with accounting principles generally accepted in the United States (“GAAP”) and that may be different from non-GAAP financial measures used by other
companies. Each of the SPAC and the Companies believes that the use of these non-GAAP financial measures provides an additional tool for investors and potential investors to use in evaluating ongoing operating results and trends of each Company. These non-GAAP measures should not be considered in isolation from, or as
an alternative to, financial measures determined in accordance with GAAP. Forward-looking non-GAAP financial measures are presented on a non-GAAP basis without reconciliations of such forward-looking non-GAAP measures due to the inherent difficulty in forecasting and quantifying certain amounts that are necessary for
such reconciliation. The SPAC and the Companies are unable to provide reconciliations to the most directly comparable GAAP measures without unreasonable effort due to the uncertainty if the necessary information of such calculation.

Use of Trademarks and Other Intellectual Property
All registered or unregistered service marks, trademarks and trade names referred to in this presentation are the property of their respective owners, and the use herein does not imply an affiliation with, or endorsement by, the owners of these service marks, trademarks and trade names. Third-party logos included herein may
represent past customers, present customers or may be provided simply for illustrative purposes only. Inclusion of such logos does not necessarily imply affiliation with or endorsement by such firms or businesses. There is no guarantee that either the SPAC or any of the Companies will work, or continue to work, with any of the
firms or businesses whose logos are included herein in the future.

The Potential Impact of the COVID-19 Pandemic
The ongoing and severe COVID-19 pandemic has caused a worldwide public health emergency and a global economic contraction. In an effort to contain the COVID-19 pandemic, national, regional and local governments, as well as private businesses and other organizations, have taken severely restrictive measures, including
instituting local and regional quarantines, restricting travel (including closing certain international borders), prohibiting public activity (including “stay-at-home” and similar orders), and ordering the closure of large numbers of offices, businesses, schools, and other public venues. As a result, the COVID-19 pandemic has
caused a significant decline in global economic production and activity of all kinds and has contributed to both volatility and a severe decline in all financial markets. Among other things, these unprecedented developments have resulted in material reductions in demand across most categories of consumers and businesses,
dislocation (or in some cases a complete halt) in the credit and capital markets, labor force and operational disruptions, slowing or complete idling of certain supply chains and manufacturing activity, steep increases in unemployment levels in the United States and several other countries, and strain and uncertainty for
businesses and households, with a particularly acute impact on industries dependent on travel and public accessibility, such as transportation, hospitality, tourism, retail, sports and entertainment.
The ultimate impact of the COVID-19 pandemic—and the resulting precipitous decline in economic and commercial activity across nearly all of the world’s largest economies—on global economic conditions, and on the operations, financial condition and performance of any particular industry or business, is impossible to
predict, although ongoing and potential additional materially adverse effects, including a further global or regional economic downturn (including a recession) of indeterminate duration and severity, are possible. The extent of the COVID-19 pandemic’s impact will depend on many factors, including the ultimate duration and
scope of the global public health emergency and the restrictive countermeasures being undertaken, as well as the effectiveness of vaccination programs and other governmental, legislative and financial and monetary policy interventions designed to mitigate the crisis and address its negative externalities, all of which are
evolving rapidly and may have unpredictable results. Even if and as the spread of the COVID-19 virus itself is substantially contained and economies are able to “re-open,” it will be difficult to assess what the longer-term impacts of an extended period of unprecedented economic dislocation and disruption will be on future
macro-and micro-economic developments, the health of certain industries and businesses, and commercial and consumer behavior.
The ongoing COVID-19 crisis and any other future public health emergency could have a significant adverse impact and result in significant losses to the SPAC and the Companies. The extent of the impact of the COVID-19 crisis on the SPAC’s and the Companies’ operational and financial performance will depend on many
factors, all of which are highly uncertain and cannot be predicted, and this impact may include significant reductions in revenue and growth, unexpected operational losses and liabilities, impairments to credit quality and reductions in the availability of capital. These same factors may limit the ability of the SPAC and the
Companies to source, diligence and execute new transactions, and governmental mitigation actions may constrain or alter existing financial, legal and regulatory frameworks in ways that are adverse to the SPAC’s and Companies’ financial and operational objectives. They may also impair the ability of the SPAC, the Companies
or their respective counterparties to perform their respective obligations under debt instruments and other commercial agreements (including their ability to pay obligations as they become due), potentially leading to defaults with uncertain consequences. In addition, the operations of the SPAC and the Companies may be
significantly impacted, or even temporarily or permanently halted, as a result of government quarantine measures, restrictions on travel and movement, remote-working requirements and other factors related to a public health emergency, including its potential adverse impact on the health of any such entity’s personnel. These
measures may also hinder the SPAC’s and the Companies’ ability to conduct their affairs and activities as they normally would, including by impairing usual communication channels and methods, hampering the performance of administrative functions such as processing payments and invoices, and diminishing their ability to
make accurate and timely projections of financial performance.

                                                                                                                                                                    ii
Transaction Summary and Today’s Presenters
                                                                                                                     • The proposed transaction would involve the simultaneous acquisition
                                                                                                                       of Aria Energy and Archaea Energy by Rice Acquisition Corporation
                                                                                                                       (NYSE: RICE), a publicly listed SPAC with $238 million of cash held
                      Danny Rice                                                                                       in trust to form the industry-leading renewable natural gas (“RNG”)
                      CEO, Director                                                                                    platform(1)
                                                                                      Summary of                     • Archaea Energy LLC is currently majority owned and controlled by
                                                                                       Proposed                        Rice Investment Group, an affiliate of RAC’s sponsor
                      Kyle Derham
                                                                                      Transaction                    • Archaea Energy is seeking a fully committed PIPE of $300 million
                      President, CFO, Director                                                                         ($38 million committed from Rice, Saltonstall, and management,
                                                                                                                       which is in addition to $20 million invested by Rice at SPAC IPO)
                                   ARCHAEA                                                                           • The transaction will target a closing in Q3 2021
                                   ENERGY                                                       ARCHAEA              • Comps Snapshot (TEV / EBITDA):
                                                                                                ENERGY
                                                                                                                             2022E (RNG Comps)(2)              2024E (Disruptors Comps)(2)
                      Nick Stork                                                                                            Archaea            Median           Archaea          Median
                      CEO                                                                                                     8.2x             31.0x              3.5x            80.7x

                      Rich Walton
                      President                                                                                    $1.15bn                                $300mm                                 $327mm
                                                                                                                      Pro Forma                                  PIPE                                2024 Pro
                                                                                                                      Enterprise                                Offering                              Forma
                      Brian McCarthy                                                                                     Value                                                                       EBITDA(3)

                      CFO and CCO
1.   The combined entity will be named "Archaea Energy." For the purposes of this presentation, "Archaea" is used to refer to the combined company post-closing (except in content relating to sources and uses and value allocations between the targets).
2.   See “Benchmarking and Valuation” section of presentation for definition of comp sets.
3.   All financials projections are presented on a pro forma basis for the business combination of Archaea and Aria. The pro forma projections present the Mavrix joint-venture on a consolidated basis net to Archaea’s interest, but has historically been
     accounted for on an equity-method basis.                                                                             1
Indicative Transaction Overview
                                         Sources & Uses                                                                                                     Illustrative Pro Forma Valuation
 Sources                                                                                     ($ millions)                                                                                                                    ($ millions)
     RAC SPAC Cash in Trust(1)                                                                          $238                        Share Price                                                                                    $10.00
     New Corporate Debt(2)                                                                              $220                            (x) Pro Forma FDSO (mm)(8)                                                                       116
     Assai Project Financing(3)                                                                         $133                        Pro Forma Equity Value                                                                         $1,159
     PIPE                                                                                               $300
                                                                                                                                        Plus: Pro Forma Debt                                                                           $353
     Archaea Equity Rollover                                                                            $332
                                                                                                                                        Less: Pro Forma Cash                                                                        ($364)
     Aria Equity Rollover                                                                               $230
                                                                                                                                    Pro Forma Enterprise Value                                                                     $1,148
 TOTAL SOURCES                                                                                      $1,453

 Uses                                                                                        ($ millions)                                               Illustrative Pro Forma Ownership(6)
     Total Aria Consideration                                                                           $680                        Archaea Equity Rollover                                         29%
                                                                                                                                                                                                                      Rice Family,
     Total Archaea Consideration                                                                        $347                        PIPE (Incl. Rice & Saltonstall)                                 26%             Saltonstall, and
                                                                                                                                                                                                                    Management to
     Cash to Balance Sheet(4)                                                                           $364                        SPAC Shareholders                                               20%
                                                                                                                                                                                                                     own ~40% of
     Transaction / Financing Fees(5)                                                                      $62                       Aria Equity Rollover                                            20%                Pro Forma
                                                                                                                                                                                                                      Company(9)
 TOTAL USES                                                                                         $1,453                          SPAC Founder Shares(7)                                             5%
1.   Assumes no RAC stockholders exercise redemption rights to receive cash from the trust account.                                6.   Post-transaction ownerships calculated using a nominal share price of $10.00, on a pre-diluted basis,
2.   Corporate Term Loan facility expected to price at L + 325bps.                                                                       which excludes the impact of warrants, potential management equity compensation, etc.
3.   $72.5mm of Assai project financing closed January 2021 and an incremental $60.8mm financing is expected to close              7.   Includes shares held by RAC sponsor, independent directors, and Atlantic Trust.
     on April 5, 2021.                                                                                                             8.   Warrant dilution calculated using the treasury stock method and is comprised of 18,883,500 warrants
4.   Assai project financing cash is effectively restricted cash to be utilized pursuant to the terms of the Assai financings, a        (inclusive of public issuance warrants, private placement warrants, and CIBC FPA public warrants) with a
     portion of which has already been spent on project-related construction costs.                                                     strike price of $11.50 per share.
5.   Illustratively assumes financing fees on Assai project financing, new debt, and PIPE par issuance amounts.                    9.   Archaea Energy LLC is currently majority owned and controlled by Rice Investment Group, an affiliate of
                                                                                                                             2          RAC’s sponsor.
What We Like About the Company

           Proven, Durable                                               Predictable,                                             Best in Class                     Solving Global
           Business Model                                              Economic Growth                                          Management Team                    Climate Problems
  • Combination creates the                                       • Expect to generate ~$395mm                             • Entrepreneurial management        • Capturing landfill gas (“LFG”)
    industry-leading RNG developer                                  of EBITDA in 2025E(2) (10x                               team pushing the boundaries to      and converting to RNG creates a
    that is day 1 profitable ($40mm                                 increase from 2020E(1)) under                            create shareholder value            more sustainable, circular
    EBITDA in 2020E)(1)                                             conservative commodity price                           • Complemented by the most            economy
  • Proven operators leveraging                                     assumptions, almost entirely                             experienced technical team in     • Size of the Prize: Capturing
    proven technology deploying a                                   from existing asset base                                 the industry having developed       emissions from LFG is
    proven commercial strategy                                    • Expect 60-70%+ of Archaea’s                              50+ RNG projects                    environmentally equivalent to
  • Landfills provide the lowest                                    RNG volumes will be contracted                         • Expanding TAM by significantly      electrifying ~75% of U.S.
    cost, most predictable and                                      under fixed-price offtake                                reducing development costs and      passenger vehicles(3)
    longest-term feedstock of any                                   arrangements with investment                             deploying novel technologies      • RNG is the lowest carbon
    renewable fuel                                                  grade customers to limit                                 including CO2 sequestration and     intensity (“CI”) transportation
                                                                    earnings volatility                                      LFG to Green Hydrogen projects      fuel source(4)
                                                                  • Archaea currently has more                               at a targeted cost of $1.65/kg
                                                                    indicated demand in the form of
                                                                    long-term contracts than its
                                                                    2025E RNG volume projection

                 Rice Acquisition Corp’s strategic combination with Aria Energy and Archaea
                Energy creates the industry-leading developer of renewable natural gas (RNG)
1. Please see Appendix A (slide 42) for additional information.   3. Emissions estimates per EPA. Calculation per RAC management.
2. Assumes $1.50/gal RIN pricing and $140/MT LCFS.                4. Source: California Air Resource Board.            3
Archaea Energy At A Glance
One of the Largest and Fastest Growing RNG Producers in the World
WA
ND VT ME
NYSE Ticker
LFG
MT
OR MN NY
NH
ID SD WI EBITDA ($mm)
MA
WY MI RI
CA
PA CT
NE IA
NV IN OH NJ
UT IL DE
CO WV VA MD
KS MO KY
NC
OK TN
AZ $327
NM AR SC
AL GA
LA MS
TX
AK FL
$40
HI
2020 (1) 2024E
High probability prospects
9 13 16 25+
Near-Term
Operating Operating capable of generating
RNG Projects
RNG Projects Electric Projects over $250mm of annual EBITDA
in Development
not included in projections
Source: RAC management.
1. Please see Appendix A (slide 42) for additional information. 4RNG Overview
Favorable Macro for Long-Term Success
Company Highlights
Premiere RNG Producer with Deep
Inventory of High-Return Growth
RNG Overview
Financial Summary
Cash Flow + Growth + Value
Benchmarking & Valuation
8The Basics of RNG
Where Does Biogas Can Generate RNG Has
RNG Come From? Electricity Or Be Multiple Uses
Upgraded to RNG
CNG H2
Vehicle Fuel
• When organic material decomposes • Using proven technology, biogas is • RNG can be used for many
in anaerobic conditions a gas is processed onsite to remove purposes including consumer use,
produced often referred to as biogas Archaea impurities and can then be used to CNG for transportation, electricity,
obtains
• Landfill biogas is composed of exclusive
generate green electricity Archaea or combined with other proven
sells RNG technology to produce green
approximately: rights to • Biogas can be further processed to
to multiple hydrogen
– 50% CH4 (Methane) biogas primarily remove CO2 and types of
through remaining contaminants to increase • Because RNG was created from an
– 35% CO2 buyers for
long-dated
the methane content and reach various uses organic source, in addition to the
– 15% O2, N2 and VOCs 25+ year
agreements pipeline specifications for natural underlying commodity value, RNG
• Landfills produce predictable gas gas produces Environmental Attributes
flows, with increasing production which can be monetized
• Resulting product is referred to as
through landfill closure and
Renewable Natural Gas (RNG) • RNG is becoming part of the US
relatively constant productions rates
and worldwide green supply chain
and composition for 30-years post
with an increasing number of
closure
entities looking to enter long-term
• Agricultural manure also produces contracts to buy RNG
biogas with much higher methane
content but with significantly lower
gas volumes
6Why is RNG an Attractive Source of Energy?
1 2 3 4 5
Sustainability Certainty Deliverability Demand Optionality
Perpetual feedstock Proven assets with Growing demand
Lowest emission Offers optionality to
sources, expected to immediate access to all from blue-chip
baseload fuel evolve with the
grow alongside customers via existing customers seeking low-
with growing TAM energy transition
population / consumption natural gas infrastructure carbon alternatives
• Capturing emissions from • RNG feedstock is the • RNG production for • Durable regulatory • Today: Landfills are used
LFG is environmentally anerobic decomposition of transportation fuel has backdrop (Renewable to generate green
equivalent to electrifying organic matter increased 10x since Fuel Standard) has electricity and RNG where
~75% of U.S. passenger • Landfills, waste-water 2013(2) historically provided the there is significant
vehicles(1) treatment plants, dairy • RNG leverages existing economic incentive for demand from long-term
• Reliable, baseload energy and food digesters natural gas infrastructure RNG development buyers
complements wind and represent critical (pipelines, industrial • RNG global mandates • Potential Future: LFG can
solar development infrastructure and are facilities, etc.) allowing driving international be used to create green
• Landfills provide the perpetual feedstock RNG to be a drop-in adoption hydrogen through steam-
lowest cost, most sources of RNG solution for consumers • In addition, blue-chip methane reform (SMR)
predictable and longest- • Feedstock providers customers are purchasing process where the
term feedstock of any aligned with RNG RNG on a long-term, technology is proven, and
renewable fuel producers via royalty fixed-price basis, costs are expected to be
structure removing subsidy risk below the aspirational
from RNG developers targets of other zero-
carbon hydrogen
producers
1. Source: Emissions estimates per EPA. Calculation per RAC management.
2. Source: The Coalition for Renewable Natural Gas. 7Sustainability
1
Why RNG Has Massive Sustainability Impacts
Emissions into Energy …While Replacing Carbon Intensive Fuels
Potential sources of organics used to produce RNG include:
Using Using
100% RNG 20% RNG- RNG
blend
Food Waste Wastewater Agriculture Landfill Gas from some sources
Waste are carbon
66.5 million 17,000 1,750
in vehicles can Provides negative, meaning
tons / year facilities 8,000 large landfills
reduce GHG a GHG reduction that they sequester
farms & dairies
emissions by of between GHG during the
more than 80% 26-30% fuel lifecycle
Natural
Approximately The U.S. Gas Lower NOx emissions with
1/3 of the wastes
Provides 90% new “near-zero” engine
world’s food 30-40%
goes to waste of its food
U.S. retailers & consumers 99% SOx reduction
Trillion pounds of food is
discard 133 billion Compared
squandered globally each year
pounds of food annually to diesel
Source:The Coalition for Renewable Natural Gas.
8Sustainability
1
RNG is the Lowest-Emission Transportation Fuel
Carbon Intensity Ranges of Transportation Fuels
What is a Carbon Intensity (CI) score? (gCO2e/MJ)
• CI Score measures the life cycle GHG emissions of CO2e per unit
of fuel (CO2e grams per megajoule) 150
Archaea expects to achieve CI
• The lower the score, the better scores near 0 through on-site solar
Score Observations power and CO2 sequestration
• RNG carbon intensity is >50% lower than diesel 100
• Electric Vehicles charged on California’s electric grid, produce a CI
score of 84 which is far higher than other renewable fuel sources
What is the benefit of lowering the CI of fuel?
50
• Cleaner fuel sources will be the greatest benefactors of the
continued global decarbonization initiatives and have the highest
value to end users
• California’s Low Carbon Fuel Standard (LCFS) program is a clear 0
example of this, where the number of monetizable LCFS credits
per unit of fuel increases with a lower CI score
• Other regulatory bodies are adopting similar programs, which
provide greater incentives to cleaner fuels -50
How are we lowering our CI score?
KEY
• Carbon Capture (primarily via sequestration)
CI Score
– Generates ~$50/ton of value for CO2 sequestered (45Q -100 Range
program)
Wtd. Avg.
• Utilizing onsite solar power in lieu of electricity Midpoint
• Archaea is developing LFG and Digester to RNG projects that could
-150
yield the lowest CI scores ever awarded by CA CARBOB Diesel Fossil CA Grid Landfill Hydrogen Renewable Renewable Archaea Digester
• Lower CI = More LCFS credits = Higher Realized RNG Price CNG CNG Gasoline Diesel RNG CNG
(RNG) Target (RNG)
Source:IEA and EPA. Chart using data per the California Air Resource Board (CARB) as of March 2021. Archaea RNG Target per RAC management estimate.
9Certainty
2
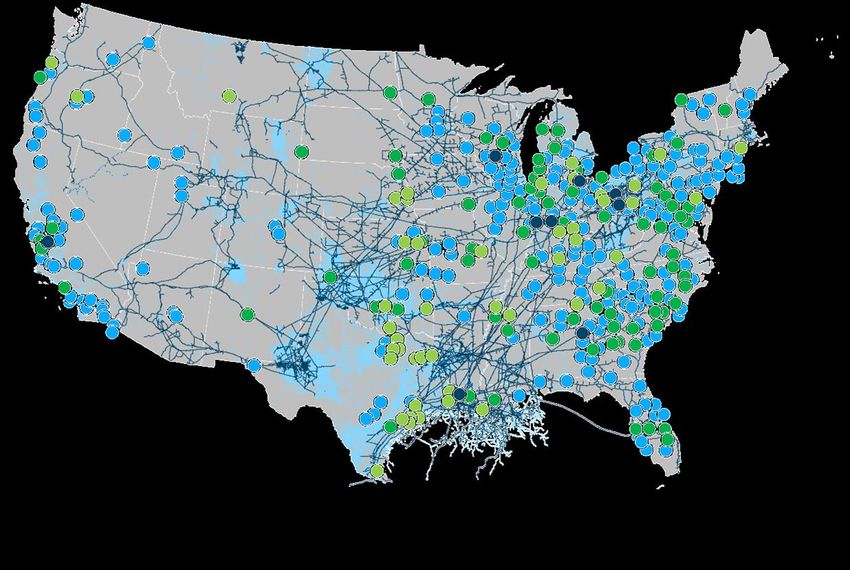
Landfill Growth Provides 40Y+ of Feedstock Security for LFG Development
U.S. landfill waste continues to grow and is expected to surpass 13 billion tons by 2050 (60% increase from 2020),
causing robust growth in LFG (our feedstock), which is expected to exceed 2.7 Bcf/d by 2050 (44% increase from 2020)
U.S. Annual Waste Forecast Daily U.S. Landfill Gas Generation
(MM Tons) (MMcf/d)
~60% increase in ~44% increase in
landfill waste in place landfill gas production
5,063
4,167
3,304
2,472
1,671 64
900
147 391
727 2,202
1,075 1,437 1,813
8,176 8,176 8,176 8,176 8,176 8,176 8,176 1,867
1,534
1,261
1,037
852
700
576
2020 2025 2030 2035 2040 2045 2050 2020 2025 2030 2035 2040 2045 2050
Cumulative Additions Landfill - Base Cumulative Additions Landfill - Base
The growth in U.S. landfill waste for the next 20-30 years, followed by a very
predictable methanogenesis profile for the subsequent 20-30 years, gives
us 40-60 years of unprecedented feedstock visibility for RNG
Source:World Bank Group, 2018 Report Titled “What a Waste: A Global Snapshot of Solid Waste Management to 2050” and RAC management estimates.
10Deliverability
3
RNG Utilizes Existing Gas Infrastructure to Reach Customers Nationwide
Map of LFG Projects & Pipeline Infrastructure Benefits of Existing Infrastructure
• Lower transportation cost + lower emissions
• Enables Archaea to physically deliver to strategic customers
from coast-to-coast and to markets that place the greatest
value on the environmental benefits of our low-emission fuel
• Deliverability to every single metroplex in the continental U.S.
without needing to build any new interstate pipelines
Pipeline owners are very supportive helping us
deliver our low-emission RNG to their customers
University of California (“UC”) launched its Carbon Neutrality
Initiative in 2013 with a commitment to cutting greenhouse gas
emissions from its buildings and vehicle fleet to net zero by
2025. UC is partnering with Archaea to develop a biomethane
project in San Bernardino County that will capture and clean
methane from an existing landfill. An on-site treatment plant will
Electricity
turn it into RNG for use on UC campuses. The facility expects to
Direct Use generate 900,000 MMBtus of RNG annually.
UC will receive half of the production for 15 years —
RNG – Pipeline Injection
enough biomethane to replace UC Santa Barbara’s
RNG – Local Use Puerto Rico entire current natural gas use.
Interstate Pipeline
Intrastate Pipeline
Source:EIA.
11Demand
4
Strong Regulatory Environment and Corporate Support Driving RNG Growth
Select Corporate Announcements Growth in RNG Mandates
“Amazon is excited about introducing new sustainable solutions “With more than 700 public stations across the U.S., the Organization Geography Target or Mandate
for freight transportation and is working on testing a number of Hypertruck ERX leverages a robust natural gas refueling
new vehicle types including electric, CNG and others.” infrastructure. The truck is the only electric Class 8 vehicle that 20% RNG by 2030
can achieve a net-negative greenhouse gas emissions footprint
-Company Statement (2/5/2021) using RNG.”
-Company Statement (6/25/2020) 20% RNG by 2030
“The use of RNG is a very important part of UPS’s strategy to
increase alternative fuel consumption to be 40% of total ground 15% RNG by 2030,
“NW Natural is partnering with BioCarbN, a developer and 30% by 2050
fuel purchases by 2025. We are using both LNG and CNG as
operator of sustainable infrastructure projects, to convert
bridging fuels to increase our use of RNG. This will have a
methane from some of Tyson Foods facilities into RNG to heat
measurable impact as RNG yields up to a 90% reduction in 15% RNG by 2030
homes and businesses.”
lifecycle greenhouse gas emissions when compared to
conventional diesel. Using RNG is what will ultimately help “These first deals with Tyson are a good start, but we will need to
UPS meet its 2025 sustainability goals.” invest in more projects to meet our goals.” 5% RNG by 2025
-Mike Whitlatch, Vice President of -David Anderson, CEO (1/19/2021)
Global Energy & Procurement (2/6/2020) €4.8bn support
scheme for RNG
“Farms all over the U.S. are looking to convert manure into RNG. 10% RNG by 2030,
“We are working to increase the amount of RNG that we have on In the next 36 months we will have food waste co-digestion 800mm investment
our system to help customers reduce their carbon emissions.” systems in each of the top 25 metro areas of the U.S.”
10 State-owned
-Kevin Akers, President and CEO (2/3/2021) -John Hanselman, Chairman and CEO (1/5/2021) Enterprises
10 Bcm by 2025
Corporate Support for RNG Across Industries Clean City RNG Initiatives
Source:Publicly available news and press releases.
12Demand
4
RNG Demand Is Expected to Exceed Supply For the Foreseeable Future
Estimated Fixed Price RNG Demand From IG
• Archaea already has more indicated demand in the Counterparties & Projected Archaea Supply
100
form of long-term fixed price contracts than its (Millions of MMBtu/year)
2025E RNG volume projection due to customers
90
with regulatory or voluntary RNG targets over the
next several years
80
Currently Buying Fixed Price RNG
70
(Regulatory Mandates or Volunteer Programs)
60
50
40
30
20
10
0
2021E 2030E 2021E 2030E
Archaea Known & Potential Future
Source:RAC management estimates. RNG Production Customer Demand
13Optionality
5
LFG Creates Seven Potential Revenue Sources
Product Rationale
Anaerobic Direct-Use On-Site Electricity
Sequestration Dairy (Waste Heat • Low-cost, baseload
$$ Digesters Recovery) cash flows
99% Methane $
• RNG conversion
opportunities
• Attractive REC pricing
Landfill Gas Green Hydrogen
CO2 CH4
On-Site
Direct-Use
~50% CH4 Electricity • Low-cost and low CI
$
(Carbon Dioxide) ~40% CO2 (Methane) $$
hydrogen for
transportation and
power generation
RNG
Enhanced Green • Long-term, fixed-price
Flare/Vent Flare/Vent RNG
Oil Recovery Hydrogen
$
$0 $0 $$$
$$$$
contracts
• Investment-grade
customers
# of $ indicative of
• Favorable D3 RIN
Core Archaea Business
revenue potential pricing + LCFS
Archaea is uniquely equipped to convert these emissions into valuable revenue streams
Source:RAC management estimates.
14RNG Overview
Favorable Macro for Long-Term Success
Company Highlights
Premiere RNG Producer with Deep
Inventory of High-Return Growth
Company
Highlights Financial Summary
Cash Flow + Growth + Value
Benchmarking & Valuation
8The Industry-Leading RNG Platform
1 2 3 4
Team Assets / Growth Commercial Capital Allocation
• Led by an • Industry-leading RNG • Expect to have 60-70% • High bar to capital
entrepreneurial platform today ($40mm of revenues locked-in deployment
management team and of 2020E EBITDA)(1) through long-term fixed • Attractive returns
complemented by • Deep backlog of highly price offtake deals with secured with fixed price
proven technical economic and organic investment grade contracts alone
operators development projects counterparties • Environmental attributes
• Developing novel underpin economic • Currently have more are free upside to
technologies to expand growth to $395mm of indicated demand in the attractive base case
TAM by lowering 2025E EBITDA form of long-term • Predictable inputs from
development costs, contracts than current known 30+ year landfill
implementing CO2 supply gas flows
sequestration and
• Predictable outputs in
developing green
investment grade RNG
hydrogen
contracts
Source:RAC management.
1. Please see Appendix A (slide 42) for additional information. 16Team
1
Best-In-Class Management Team Aligned to Create Shareholder Value
ARCHAEA
ENERGY
• Entrepreneurial management team • Highly accomplished, seasoned industry • Track record of building energy
disrupting the RNG space veterans businesses from scratch into $10bn+
• Best LFG gas processing minds in the • ~100 highly trained RNG plant operators successful public enterprises
industry led by Charlie Anderson across the U.S. • Best-in-class operators leveraging data,
(inventor of multiple critical industry • Strong safety and environmental record technology, and sound decision-making
patents) and other technical experts from and processes to create compelling shareholder returns;
Air Liquide, Honeywell, Guild, Flir proven deal makers, with track record of
• Expertise and relationships to executing and integrating large-scale
• Path to lower RNG production costs by economically develop negative CI score
40% by 2022 energy acquisitions
digester projects
• Pioneered a differentiated commercial • Rice Energy (NYSE: RICE) outperformed
• Expect the vast majority of the Aria Team its peers by 95% during its time as a
strategy to de-risk future development to be retained at Archaea
and financing public company; Rice Midstream (NYSE:
RMP) outperformed its peers by 40%
• Archaea Management expected to own during its time as a public company
>15% of pro forma shares outstanding
and will invest further • Rice Family invested $20mm in IPO and
is investing another $20mm in the PIPE
17Assets &
Growth
2
Project Backlog Generates Unmatched Risk-Adjusted Economic Returns
RNG Upgrade /
WA
ME Conversion Projects
MT ND VT
OR MN • $250mm CapEx
WI NH
ID SD MI NY MA • $110mm EBITDA(1)
WY
RI
CA PA CT • 2.3x Build Multiple
NE IA
NV OH NJ
UT IL IN DE
CO WV MD Organic
KS VA
MO KY RNG Development
NC
OK TN
AZ • $305mm CapEx
NM AR SC
AL • $163mm EBITDA(1)
GA
LA MS • 1.9x Build Multiple
TX
AK FL
High Probability
HI RNG Development
• $600mm CapEx
13 RNG Upgrade /
Conversion Projects 16 Organic RNG
Development 25+ High Probability
RNG Development
• $250mm EBITDA(1)
• 2.4x Build Multiple
Source: RAC management.
1. Represents first full-year run rate EBITDA; assumes $1.50 RIN pricing, $140/MT LCFS pricing and long-term fixed 18
price contracts ranging from $10 to $18/mmbtu. High probability RNG development assumes $15/mmbtu fixed price.Assets &
2 RNG Development Spotlight: Project Assai Will Be the World’s Largest Growth
LFG to RNG Plant
“Partnering with Archaea to bring these
RNG volumes into our distribution system
Long-Term Fixed IG-Rated Project provides us with the opportunity to
Project Overview continue growing in an environmentally
Price Offtake With Attractive responsible way, and enhances and
& Asset Details expands our commitment to offer energy
Agreements Financing In Place solutions that are innovative, efficient and
beneficial to the environment.”
-Hans Bell
President of UGI Utilities
• Archaea is currently • ~80% of expected Assai RNG • In January 2021, Archaea (February 2021)
constructing a high-BTU RNG production volumes are closed on an initial debt
facility (“Project Assai”) in contracted through long-term offering of $72.5 million for
Dunmore, PA at the Keystone fixed price agreements with Project Assai at an interest
Sanitary Landfill capable of IG counterparties totaling rate of 3.75%
producing ~4.0-5.5 million 2,750k to 3,527k MMBtu
• Expect to close on $60.8
MMBtus/year of RNG annually (16.6-year weighted
million of parity debt at an
average term)
• Secured evergreen LFG supply interest rate of 4.47% on
(Keystone and nearby Alliance Term Rating April 5th for total debt
Landfill) Buyer proceeds of $133 million(2)
(Years) (Agency)
• CI Score (ICF): 38.5 10Y Aa2 (Moody’s) • Project achieved IG rating
• Year-1 Run Rate EBITDA: 20Y A (S&P) • Financing generated strong
~$43 million(1) (at $1.50 D3 interest from high-quality,
RIN price) 20Y A3 (Moody’s) buy-and-hold investor base
Source:RAC management.
1. Represents first 12 months of EBITDA following Project ramp-up.
2. Difference in interest rates between Assai I and Assai II project financings is reflective of different average life of financings (6.4 years vs. 16.0 years; structured in relationship to offtake contracts) and market changes in UST benchmark rate.
193 Commercial Strategy: Meeting the Significant Growth of the Voluntary RNG Commercial
Market with Long-Term Fixed Price Contracts
Volatile D-3 RIN Pricing vs.
Current Partners
Representative Archaea Contract(2)
$3.50 Current Price
as of 3/8/21:
$3.00 $2.88
$2.50
$2.00
$1.50
$1.00 Budget
Assumption:
$0.50 $1.50 RIN
$0.00
Late-Stage Discussion & Future Partners Mar-15 Mar-16 Mar-17 Mar-18 Mar-19 Mar-20 Mar-21
• Archaea’s commercial strategy differs significantly from other RNG
developers who are significantly exposed to RIN price volatility
• Archaea has developed a substantial backlog of long-term RNG
demand that it is actively converting into long-term fixed price
contracts
– Archaea’s current and future customers have demand that
exceeds Archaea’s 2025E RNG volume forecast
• Expect to contract 60-70% RNG volumes through 10-20-year fixed
price contacts that will limit RIN price volatility and deliver
sustainable returns to shareholders
1. Source: RAC management
2. Source: EPA. 20Commercial &
Cap Allocation
3/4
Archaea’s Commercial Strategy Generates Attractive Risk Adjusted Returns
Contracted RNG volumes • At budgeted prices (below spot),
Summary 65% under long-term fixed price blended realized price of Projects expected to
generate a >10x ROI
of RNG contracts $20.43/MMBtu
over a 30-year period
Commercial Variable RNG volume • Spot prices = ~$50/MMBtu may
or a >5x Discounted
Strategy 35% exposure to “Environmental support higher long-term fixed
ROI (PV10)
Attributes” (RINs, LCFS) price contracts into the future
Revenue Sensitivities Illustrative Project Economics
($/mmbtu) ($/mmbtu)
$49.42 CO2
$1.50
LCFS
$200/ton
Unbudgeted RINs
$12.14 Potential
Upside
Brown Gas
LT Fixed
$29.59
$29.59
$1.50
35% Budgeted
$140/ton
(Total
$8.50 Environmental Attributes Revenue)
$2.88/gal
$33.77 $1.50
$2.97 $4.09
$15.50
$1.50 (20% of $3.00
$1.50/gal
$6.16 $1.00
$0.70
$17.59 65% Fixed $20.43
Revenue)
$14.00 Price RNG $13.35 $12.35
$9.10
$2.00 $2.00
Fixed Price
Spot Green
Price Brown
BudgetGas Fixed Price
RIN RNG LCFS CO2 Total Revenue
Blended Realized Royalty Operating Net Operating CAPEX (30-Year FCF Margin
Gas
(Uncontracted) (Uncontracted) (Fully Contracted) Price Under 65% Expenses Income Amortization)
Contracting Scenario
Source:RAC management calculations.
21Archaea is Pursuing Multiple Avenues to Expand & Capitalize on Growing TAM
1
Reducing RNG Reducing RNG
1 Development Development Costs by 40%
Costs by 40%
• Archaea’s version 1 (v1) Archaea v1 Plant
RNG Plant (2022), will
lower development
costs 40% (not
modeled)
• Reductions are driven
by decades of know-
Lower CI Scores to how, RNG plant
2
ARCHAEA Maximize Revenue experience, proprietary
packaging and system
ENERGY designs
• v1 design allows for
‘Small, Medium, Large”
standardization, leading
to better performance,
manufacturing
approach deployment
Green Key:
3 • 50% reduction to
Hydrogen
Proprietary Approach
standard construction
timeline (18 vs. 36 Development cost reductions expand
months) addressable market by 3,000+ projects
Source:RAC management.
22Archaea is Pursuing Multiple Avenues to Expand & Capitalize on Growing TAM (cont’d)
2 3
Lower CI Scores to Green
Maximize Revenue Hydrogen
• CO2 sequestration and onsite solar significantly reduce carbon • Opportunity to achieve $40 per mmbtu+ effective pricing (long-term
intensity and increase the value of the LCFS credit fixed pricing available with LCFS upside), which we do not model
• For a typical project, CO2 sequestration will reduce the project CI • Archaea’s strategy turns low-flow / closed landfill sites into highly
score by 20-30 points economic green H2 production centers
• Onsite renewable energy would create negative project score
RNG-to-H2 Projects
• We do not model the LCFS uplift from these initiatives, and use flat
SMR w/ CO2 CCS
pricing assumption of $140 per MT (vs. $200 per MT today) LFG
• We are long-term bullish on the LCFS model rolling out across new
states; WA, NY, CO, NM are pushing for near-term adoption
• 45Q + LCFS Uplift expands opportunity set of attractive projects;
Renewable electricity and waste
heat-to-steam for low CI H2
small flow sites with Tier II distinction (vented methane) become
Archaea RNG via Pipeline
A R C H A E A
highly compelling with LCA CO2e calculation E N E R G Y
• RNG-to-Hydrogen approach offers green H2 at leading levelized
Uplift from Carbon Intensity Reduction(1) costs, carbon intensities and production efficiency
$14 ($/mmbtu)
$12
$10
+$7.10 per mmbtu of Levelized Cost of Green H2 Comparison(2)
$8 unmodeled revenue (Total, Dispensed; $/kg H2)
$6 benefit
$4
Notes: Assumes Archaea Base Case $140 per
mt; management estimates of CI scores using
$4.00
$2 CARB model; LCFS value only, assumes no to
45Q benefit or other credits
$0 $6.00
$2.00 $1.65
Base Case LCFS Base with CO2 Base with CO2 Seq. &
1. Source: RAC management calculations. Sequestration Onsite Solar Electrolysis LCOH Today Electrolysis LCOH Target Archaea RNG-to-H2
2. Source: DOE, 202O figures.
23Near-Term and Actionable Growth Opportunities in a Highly Fragmented Market
Untapped RNG Potential(1) Sample of RNG Development Opportunities(2)
Significant potential for Archaea to convert existing LFG to
electric facilities and emitting landfills to RNG
Only 13% of U.S.
LFG is converted
451 Landfills
into RNG today
1,325 MMcf/d
237
13%
1,400 landfills
have no LFG
305 738
collection 16% 1,867 40%
MMscfd
KEY Cattle Production (Sales in USD)
587
Archaea Candidate LFG Projects $1bn - $1.4bn
31% Hog Production (Sales in USD) $750mm - $1bn
$400mm - $700mm $500mm - $750mm
Electricity / Flared / Not $200mm - $400mm $250mm - $500mm
RNG
Direct Use Vented Captured $100mm - $200mm $100mm - $250mm
Significant opportunities for Archaea to apply its operational excellence, commercial scale,
and technology to unlock valuable revenue and create meaningful shareholder value
Note: Pie chart % based on production.
1. Source: EIA and RAC management estimates. 24
2. Source: RAC management and USDA Census of Agriculture 2017 (Cattle & Hog Production).You can also read