A Baseline Citizens' Assessment of the NRM Government's First Year of the 2016-2021 Term - Uganda National NGO Forum - Global Call to Action ...
←
→
Page content transcription
If your browser does not render page correctly, please read the page content below
Uganda National NGO Forum

A Baseline Citizens’ Assessment
of the NRM Government’s First
  Year of the 2016-2021 Term
                      1

Uganda National NGO Forum

A Baseline Citizens’ Assessment of the NRM Government’s
             First Year of the 2016-2021 Term

                        In Partnership with
           Uganda Governance Monitoring Platform (UGMP)

                             July 2017

                                  1
2
Foreword and Acknowledgement

This report is a Baseline Citizens’ Assessment of the National             between citizens and their leaders, in the monitoring of the NRM
Resistance Movement (NRM) Government’s First Year of the                   manifesto and for the general public to have an issue-based
2016-2021 Term. It is the first report produced by the Uganda              discussion on the performance of the ruling party. Many times
Governance Monitoring Platform under the Citizen Manifesto                 citizens discuss public matters with no empirical evidence and
(2016-2021). The Citizen Manifesto is premised on the idea                 this leads to generalizations as well as unrealistic demands from
that, for something to be of value, it is not enough for citizens          citizens and pompous promises from politicians. This report
to say that it is desirable. Anything will be of value to citizens         bridges that gap.
– either individually or collectively – when they are willing to
give something up in return for it. During the electoral process,          In a simple and straight forward way, this baseline speaks to the
citizens granted power to the state by voting for their leader.            challenges at hand with a view of finding solutions. The solutions
They also however articulated their expectations in the Citizens’          to Uganda’s challenges will not come from this report, but from
Manifesto. Furthermore, citizens pay for the leaders when they             the collective, collaborative and creative conversations that will
contribute taxes to running the state. In return for the votes and         emerge from the monitoring of the ruling party. The combined
taxes that citizens give, they expect the state to deliver outcomes,       +efforts of leaders and citizens are what will culminate into the
services and trust.                                                        desired results. This report offers a starting point in the next 5
                                                                           years of the NRM term in office.
In this report, we bring two manifestos together – the NRM
Manifesto and the Citizens’ Manifesto. In the NRM Manifesto,               We express our deep appreciation to our many partners. Our
the ruling party does set out what it will do when in power. In            partners at the sub national level did a great good. We thank
the Citizen Manifesto, citizens point out the expectations that            the researchers, consultants, government officials and politicians
they have of the state. This baseline report therefore collects            for their contributions. We appreciate the invaluable and kind
some data on the current status of selected sectors that are               support of the Democratic Governance Facility for making this
covered in the two manifestos. The reason for this report is               process possible. I also acknowledge the invaluable coordination
therefore to provide a benchmark that shows what the ‘state of             by all the staff of UNNGOF for the hard work during this process.
play’ of services is within communities as reported by citizens in
a representative sample of 930 households in 35 districts. Using           To all I say – thank you!
qualitative and quantitative data techniques, this report presents
data in a selected number of sectors.
                                                                           Richard Ssewakiryanga
The information in this report will therefore be useful in dialogues       Executive Director

                                                                       3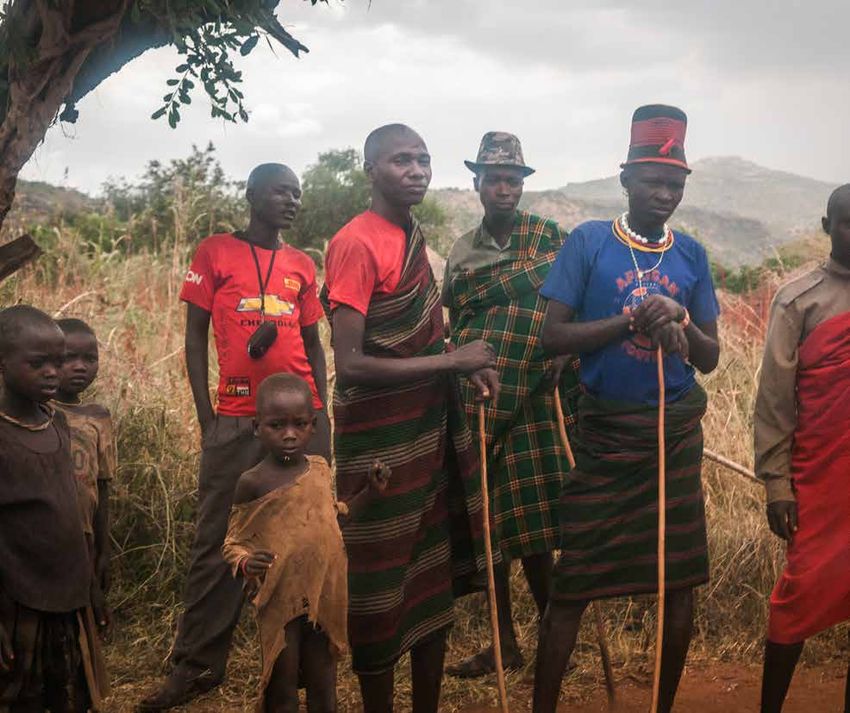
A Baseline Citizens’ Assessment of the NRM Government’s First Year of 2016-2021 Term

ACRONYMS
DGF		 Democratic Governance Facility
NRM		 National Resistance Movement
UGMP		 Uganda Governance Monitoring Platform
UNNGOF Uganda National NGO Forum
GAP		 Good Agricultural Practices
FGDs		 Focus Group Discussions
OWC		 Operation Wealth Creation
SACCOs		 Savings and Credit Cooperatives
NAADS		 National Agricultural Advisory Services
ARVs		 Antiretroviral
KPEP		 Karamoja Primary Education Project
UPE			 Universal Primary Education
USE			 Universal Secondary Education
ID			Identity Card

                                                                                       4
TABLE OF CONTENTS

Foreword and Acknowledgement �������������������������������������������������������������������������������������������������3
ACRONYMS �����������������������������������������������������������������������������������������������������������������������������������4
1.0 BACKGROUND �������������������������������������������������������������������������������������������������������������������������7
1.1   Introduction	�����������������������������������������������������������������������������������������������������������������������������������������������������������������������������7
1.2   The NRM Manifesto 2016 - 2021	�������������������������������������������������������������������������������������������������������������������������������������������8
1.3   The Citizens’ Manifesto 2016-2021	����������������������������������������������������������������������������������������������������������������������������������������8
1.4   Design and Methodology	������������������������������������������������������������������������������������������������������������������������������������������������������11
1.5   Research Methods and Tools	�������������������������������������������������������������������������������������������������������������������������������������������������11
1.6   Coverage	��������������������������������������������������������������������������������������������������������������������������������������������������������������������������������11

2.0 FINDINGS �������������������������������������������������������������������������������������������������������������������������������13
2.0   Demographics	������������������������������������������������������������������������������������������������������������������������������������������������������������������������13
2.1   Economic activity	������������������������������������������������������������������������������������������������������������������������������������������������������������������19
2.2   Agriculture	�����������������������������������������������������������������������������������������������������������������������������������������������������������������������������22
2.3   Water supply	��������������������������������������������������������������������������������������������������������������������������������������������������������������������������36
2.4   Energy	�����������������������������������������������������������������������������������������������������������������������������������������������������������������������������������40
2.5   Health	������������������������������������������������������������������������������������������������������������������������������������������������������������������������������������42
2.6   Education	�������������������������������������������������������������������������������������������������������������������������������������������������������������������������������45
2.7   Roads	�������������������������������������������������������������������������������������������������������������������������������������������������������������������������������������50
2.8   Governance	����������������������������������������������������������������������������������������������������������������������������������������������������������������������������53

3.0 CONCLUSIONS �����������������������������������������������������������������������������������������������������������������������57
Annex I                                                                                                                                58
Annex II                                                                                                                               59

                                                                                               5
6
1.0 BACKGROUND

                                                                       found that the NRM Party performed well in responding to
  1.1       Introduction                                               the issues highlighted in the Citizens’ Manifesto, scoring 67%
                                                                       representation of citizens’ aspirations.
The Uganda Governance Monitoring Platform (UGMP), was
established in 2004 and is hosted at Uganda National NGO               In May 2017 the NRM party made one year in its third term.
Forum. The Platform is a coalition with the primary objective of       During the current five year term (2016-2021), as the ruling party,
monitoring trends in governance in Uganda and Africa at large.         the NRM will be in charge of overseeing the implementation of
These trends inform lobbying and engagements with relevant             all government programs as well as the commitments made by
actors to improve governance in the country. UGMP under the            the NRM in its manifesto. Since the NRM Government assumed
auspices of one of its flagship projects, the Citizen Manifesto,       office, it has continued to implement some of its already existing
committed to a process of monitoring the implementation of the         programmes from the last term in office and also articulated a
ruling party manifesto.                                                number of new priority areas articulated in the 23 development
                                                                       priorities code-named – Kisanja Hakuna Mchezo.
February 2017 marked the one year anniversary since the National
Resistance Movement Party (NRM) assumed office as the ruling           This baseline assessment falls within the rubric of social audits.
party. The 2016 elections presented yet another opportunity for        In broad terms, a social audit is a process of evaluating the
Ugandans to listen to promises and commitments from political          performance of an entity to understand its effect on society. In
aspirants in form of manifestos. At the same time, citizens            order to conduct a systematic and methodologically robust social
developed their own manifesto with 10 key development priorities       audit, we needed to collect data on some broad parameters to
which they felt needed urgent attention by the next government.        develop a baseline that we shall use as our benchmark in reporting
In total, eight manifestos were presented at Presidential level,       on performance of the NRM during the current five term of office.
with most of them representing at least 50% of the citizens’           We envisage a three stage governance monitoring audit in the
aspirations.                                                           current 5 year term. The stages will include; a Baseline Assessment
                                                                       in the first year, a Mid Term Review after a period of two and half
A Political Party Manifesto Analysis commissioned by the Uganda        years and an End of Term Impact Survey at the end of the 5 year
Governance Monitoring Platform (UGMP) that scrutinized all             period. This will then give us a complete picture in terms of the
eight political party manifestos against the Citizens’ Manifesto       performance of the ruling party over the period of 5 years.

                                                                   7
A Baseline Citizens’ Assessment of the NRM Government’s First Year of 2016-2021 Term

This continuous and systematic citizen-led monitoring of the                               its commitment to the economic and social transformation of
ruling party is important in ensuring that citizens continuously                           Uganda.
engage with their leaders. The continuous engagement also
ensures that leaders are able to focus on the core mandate of                              The NRM Manifesto further outlines the achievement in each
institutions of leadership and not on ‘individual merit’ of leaders,                       of the above prioritized areas and the way forward. The NRM
which is a recipe for fueling patronage politics. Being a social                           Manifesto is being implemented through the 23 strategic
audit process, the assessment collects citizen views and voices on                         guidelines. This manifesto is the roadmap for Uganda and her
service delivery and related governance questions.                                         people on the journey to attain the middle-income status. For
                                                                                           this to happen, the NRM promises to pay attention to specific
Therefore this report is a baseline - the first in a series of monitoring                  actions that are outlined in the sectors discussed herein. The
reports that will be produced in evaluating the extent to which                            table below (Table 1) presents a selected number of actions that
the NRM Government is delivering on its 2016 election promises                             analyze the synergies between the proposed actions by the NRM
and manifesto. These reports are intended to trigger public                                Manifesto and the Citizen Expectations in the Citizen Manifesto.
debate on the performance of the NRM Government in relation
to citizens’ expectations. This report will therefore be useful to
the manifesto monitoring team of the ruling party, the various                               1.3        The Citizens’ Manifesto 2016-2021
parties in opposition and for research and political analysts that
are interested in building a culture of evidence-based decision                            The Citizens Manifesto, 2016-2021, is premised on the idea of
making in Uganda.                                                                          a country governed for equal opportunity and shared prosperity.
The report has three main sections; section one provides an                                It lays out the citizens’ commitment to building a better future
introduction and background to the audit, overview of the NRM                              by establishing a socio-economic and political order through a
and the Citizens’ Manifestos, and the approach and methodology                             popular and durable national Constitution based on the principles
used to conduct this audit. The second section is a presentation of                        of unity, peace, equality, democracy, freedom, social justice and
the detailed findings; while the third section provides conclusions                        progress. This is through citizens’ commitment to exercise their
and recommendations.                                                                       rights and hold leaders accountable to these principles. The Citizen
                                                                                           Manifesto outlines some of the social economic development
                                                                                           imbalances. For example, the citizens observe that 77% of the
   1.2          The NRM Manifesto 2016 - 		2021                                            total labour force in Uganda is employed in agriculture yet it
                                                                                           is allocated an average of only 3.2% of the total budget. Thus
The byline for the NRM Manifesto 2016-2021 is taking Uganda                                through the Citizens Manifesto, citizens articulate their demands
to modernity through job creation and inclusive development.                               and call upon the Government that assumes office to implement
In its manifesto, the NRM pledges to continue providing                                    programmes that respond to their demands and aspirations.
revolutionary, visionary and democratic leadership and reiterates

                                                                                       8
A Baseline Citizens’ Assessment of the NRM Government’s First Year of 2016-2021 Term
The Citizens Manifesto draws lessons from past elections, Citizens’ mission is to “Work hard to build a New Uganda which
articulates Uganda’s problems and outlines citizens’ dreams and is truly a country of free, prosperous, proud and happy people.”
mission for Uganda. Thus the Manifesto is anchored in a vision The following are the key citizens’ expectations generated
of: “A Peaceful, Prosperous Nation with a Happy People.” The through these actions:
Table 1 : Priority Areas and Key Expectations
Priority Area Key Expectations
Restore dignity and collective • Promotion and defence of the dignity of all Ugandans
productive potential to create • Favourable conditions for equal opportunity and shared prosperity for all citizens
opportunities for all Ugandans • Restoration of an accountable and democratic governance culture
• Individual and collective freedoms and liberties to build prosperity and citizen-centred
socio-economic transformation
Creating a developmental • A State that uses the Nation’s resources to fight poverty and expand opportunities
State • Policies that respond to citizen-centred development
Beyond security and stability • A fully functional government that is accountable to all Ugandans
to peace and prosperity • Equitable distribution of resources and elimination of inequality in all its forms
• Investment in creating conditions for good relations with all our neighbouring countries
• Adoption and implementation of policies and programmes that create a sound
environment for business and create opportunities for all citizens
• Demonstrated commitment and adoption of policies that focus on improving the stock of
human capital
• Maintainance of channels of dialogue and always act in good faith to ensure that any
conflicts are resolved amicably and in the interest of promoting peace and prosperity for
citizens
Reforming the system of • Governance under a democratic system of government based on the rule of law
governance • A system of government that creates opportunities for active participation of all citizens in
both politics and civic life
• A national constitution that creates mechanisms for periodic peaceful change and renewal
of governments and leaders through peaceful, credible, free and fair elections
• Effective protection of the human rights and the dignity of every Ugandan
• Effective distribution of power between central government and local governments –
decentralization of political, fiscal and administrative functions
9A Baseline Citizens’ Assessment of the NRM Government’s First Year of 2016-2021 Term
Priority Area Key Expectations
Political and Constitutional • National consensus on content and steps towards delivering a transitional government of
reforms national unity
Public services that uphold • Access to a quality and rewarding primary and secondary education to every Ugandan child
dignity • Establishment of a national health services delivery system and a national insurance scheme
• Dignified working conditions and rewarding remuneration for teachers, health workers and
men and women in the security forces
• Specific time-bound and measurable programmes to enhance the delivery of affordable
credit and other financial services to local businesses and Uganda citizens
Equal opportunity in national • Government adopts policies that promote inclusive economic growth and development,
development create decent and well-paying jobs for the population, reduce inequality and uplift the
majority of citizens from conditions of perpetual vulnerability
• Operationalization of an Independent salaries and Remuneration Commission
• Greater investment of taxpayers’ money in public schools and hospitals all over the country
• Government change in budget priorities to ensure measurable reduction in public
administration expenditure and promote investments in the productive socio-economic
sectors of the economy, and in particular agriculture , education and health
• A fair tax regime that boots domestic companies
Decent employment • Elected leaders and government put in place a fully functional regulatory framework for
building a performance oriented society
Equity in sharing natural • Conservation, protection and development of natural resources for the benefit of the
resources wealth present and future generations of Ugandans
A corruption free Uganda is • Commitment to a renewed fight against corruption
must • Denial of votes to any Member of Parliament or Councilor who votes to increase their pay
as priority over all expenses as soon as they are sworn in
• Maintain a detailed anti-corruption performance register for each elected and public service
leader for evidence based accountability
Strong and functional • Defence and protection of the independence of institutions of state and citizenship as the
institutions foundations for building a durable democracy
10A Baseline Citizens’ Assessment of the NRM Government’s First Year of 2016-2021 Term
In the table above, it is evident that the Citizen Manifesto and government in relation to their expectations. A total of 354
the NRM Manifesto have some areas of common interest. This is community members (181 male and 173 female) participated
important and helpful because it is expected that leaders develop in the FGDs.
manifestos based on citizen aspirations and expectations. When
areas of common interest emerge in the Citizen Manifesto, it
indeed creates an opportunity for shared engagement. 1.6 Coverage
The assessment was conducted in 32 districts in Uganda. These
1.4 Design and Methodology districts implement the citizens’ manifesto and therefore were
purposively selected. In each district, two villages were randomly
The survey used both qualitative and quantitative methods. A selected for the survey, considering one rural and one urban.
desk review of relevant literature was conducted to assess the Therefore a total of 64 villages were covered.
current state of affairs. A study team was constituted comprising
of experienced researchers in both qualitative and quantitative
methods. UNNGOF worked closely with Citizen Manifesto
partners during the field research.
1.5 Research Methods and Tools
The following methods were utilised;
(i) Review of literature – a review of the NRM Manifesto 2016 –
2021 and the Citizen Manifesto 2016 – 2021, was done to
understand NRM promises and the Citizens demands
(ii) Household level – a statistically representative sample was
visited in each to generate evidence about socioeconomic well-
being of the household members. A household questionnaire
was designed for this purpose. A total of 960 household were
surveyed.
(iii)Community level – in each village visited, focus group
discussions were held with community members on their
perceptions on the performance of the first year NRM
1112
2.0 FINDINGS

The findings of this baseline assessment are limited to a few              Figure 1: Household Headship by Sex
selected sectors. These include agriculture, water, energy, health,
education, roads, economic activities and governance. The scope
of this assessment is not to cover all areas promised by the NRM
but to take those core areas that are foundational in the creation
of human security and better livelihoods. The core areas will then
be the basis of continuous monitoring over the 5 year period.

  2.0       Demographics
Overall, 76% of the households in the sampled areas are male
headed households, while 24% are female headed households.
26% households in the urban areas are female headed and
only 22% in the rural are male headed. This shows that in the
urban areas, the number of female headed households is high,
represented by up to 4% points. These gender differences in                Source: Baseline Research Data
headship at a household level imply that a lot more needs to be
done to ensure that the all interventions reflect these gendered
differences in rural and urban areas.                                      In terms of regional representation, 3 out of 10 households in
                                                                           Central and Eastern are female headed compared to 2 out of
                                                                           10 in Northern and Western regions. Again this is an important
                                                                           difference at the regional level and government interventions will
                                                                           have to take into consideration these gender differences.

                                                                      13
A Baseline Citizens’ Assessment of the NRM Government’s First Year of 2016-2021 Term
Figure 2: Regional Differences in Household Figure 1.3: Distribution of Respondents by Age
Headship
Source: Baseline Research Data Source: Baseline Research Data
In terms of age, overall, 45% of the respondents were aged In terms of place of residence, there were no significant
36 – 60 years. 48% of the female respondents are aged 36 – differences. We found that in the age bracket of 36-60 years,
60 years. We therefore reached a significant number of young they were relatively equally spread in the rural and urban areas.
people and older persons. For the women, this study reached In the rural areas, there were a higher number of older persons
fewer women in the category of 18-35 years of age. There were represented – up to 18% of people aged 60 years and above live
a bigger number of older women represented in the sample that in the rural than in urban areas.
participated in the study, 25% of those aged 61 years and above,
compared to only 16% of the men in this age bracket.
14A Baseline Citizens’ Assessment of the NRM Government’s First Year of 2016-2021 Term
Figure 4: Distribution of Age by Residence Figure 5: Number of Household Members
Source: Baseline Research Data Source: Baseline Research Data
In terms of household size, the most dominant household size is On education, 50% of the respondents had completed primary
4 to 6 people representing 39%. Further, 32% of the households level education and only 7% did not have any formal education.
comprise of 7 to 10 people. Only 11% of the respondents The combined total of respondents with primary and secondary
reported household sizes of more than 11 people. Clearly the education was 81%. This indicates a reasonably high number of
sample indicates that most households in Uganda have between educated people in the sample population.
4 to 10 people which represents over 70% of households in
Uganda.
15A Baseline Citizens’ Assessment of the NRM Government’s First Year of 2016-2021 Term
Figure 6: Level of Education Figure 7: Educational Level by Sex
Source: Baseline Research Data Source: Baseline Research Data
When the data on education is further disaggregated, it shows When the data on education attainment was disaggregated by
that 16% of the female respondents did not receive any formal geographical location, the number of respondents who had not
education compared to only 3% of the male. This gender disparity attained any formal education was higher in the rural (10%) than
in attainment of education does indicate a continuing challenge in the urban areas (4%). This disparity shows that urban areas
in ensuring equal opportunities for girls attaining education. offer more opportunities for individuals to explore.
16A Baseline Citizens’ Assessment of the NRM Government’s First Year of 2016-2021 Term
Figure 8: Level of Education by Geographical Area Figure 9: Literacy Levels among Respondents
Source: Baseline Research Data Source: Baseline Research Data
In terms of literacy levels, more than three quarters of the A gender disaggregation of the literacy levels shows that 39%
respondents (79%) are able to read and write. These high levels of the female respondents are not able to read and write
of literacy indicate that even for those who drop out of school, a compared to 13% of their male counterparts. This is certainly a
few of them have got the requisite survival literacy skills to read challenge that needs to be addressed through the various literacy
and write. interventions that government and NGOs offer.
17A Baseline Citizens’ Assessment of the NRM Government’s First Year of 2016-2021 Term
Figure 10: Literary Levels by Gender
Source: Baseline Research Data
18A Baseline Citizens’ Assessment of the NRM Government’s First Year of 2016-2021 Term
are involved in any type of trading.
2.1 Economic activity
Paid jobs was also about 12%, but this referred to any type of
As part of the contextual analysis, this study also sought to job where a person gets a payment, either in casual work or
understand the types of economic activity that respondents were in employment. Other types of economic activity like artisanship
involved in. Crop production was reported as the main economic were quite low (2.5%) and yet they represent an important sector
activity for 60% of the households. This implies that 6 people out that can support employment of young people. Those who are
of 10 were involved in crop production. This is a sizeable part of not involved in any economic activity were also about 2.5% of
the population. Only 14% of the population reported that they the respondents.
19A Baseline Citizens’ Assessment of the NRM Government’s First Year of 2016-2021 Term
Figure 11: Main household economic activity Figure 12: Secondary Household Economic Activity
Source: Baseline Research Data
Source: Baseline Research Data
The main secondary activities were comprised of crop production
(28%), livestock production (23%) and trading (20%). These Overall, 59% of the respondents are self-employed, 14% are
were activities that supplement the primary activity which was in paid employment and 28% are either unpaid family workers
farming as shown in the previous figure. Trading came third as a or unemployed. Both in rural (52%) and urban (67%), the
secondary activity and this was mostly petty trading that was still respondents are self-employed, and are aged 18 to 35 years old.
closely linked to crop farming. Artisanal work was still quite low, Unemployment is higher in the rural (37%) than in urban (18%),
representing only 2.8% of the secondary economic activities. and is dominant among people aged 60 years and above.
Overall, the structure of economic activity is driven by crop
production and livestock farming. Improvements in livelihood
will therefore depend largely on how government responds to
the constraints in these two key sectors.
20A Baseline Citizens’ Assessment of the NRM Government’s First Year of 2016-2021 Term Figure 13: Employment Status of the Respondents by Location and Age Source: Baseline Research Data A gender analysis shows that only 4% of the female respondents are in paid employment compared to 17% of their male counterparts. This is a significant disparity that can be closed through intentional investments in enterprises that support female participation in trading. The data also indicates that for unpaid care work at household level, women are significantly represented with 42% of the work being done by women. This disparity mirrors the gender division of labor at household level and indeed has implications for the kind of policy interventions the government should pursue. If unpaid care work is shouldered by very many women, then it may be time to think about how it can be costed and seen as work that benefits the economy. This is because every economic activity does require inputs in terms of unpaid care work for it to flourish. It will therefore be important that the government pay close attention to the implication of unpaid care work on the economy. 21
A Baseline Citizens’ Assessment of the NRM Government’s First Year of 2016-2021 Term

Figure 14: Employment Status of the
Respondents by Sex                                                                          ¤¤ Put in place a mechanism to sure that all poverty
                                                                                               alleviation-related programmes are well coordinated
                                                                                            ¤¤ Invest in agriculture to increase exports of specific
                                                                                               commodities ash coffee, maize, tea, and beans
                                                                                            ¤¤ Support individuals and companies including the Uganda
                                                                                               Prison Services, in seed production
                                                                                            ¤¤ Support companies and individuals in livestock breeding
                                                                                            ¤¤ Promote use of manure, organic fertilizers, inorganic
                                                                                               fertilizers and appropriate irrigation technology
                                                                                            ¤¤ Promote mechanization through availing machinery for
                                                                                               hire at affordable rate
                                                                                            ¤¤ Invest in disease and pest control
                                                                                            ¤¤ Support research in agriculture
                                                                                            ¤¤ Continue with the Agriculture Finance Credit scheme
                                                                                            ¤¤ Invest in agricultural marketing and storage to improve
Source: Baseline Research Data
                                                                                               the quality of agricultural produce
                                                                                            ¤¤ Put in place measures to ensure that Good Agricultural
   2.2          Agriculture                                                                    Practices (GAP)
                                                                                            ¤¤ Invest in value-addition
In order to promote agricultural productivity, the NRM                                      ¤¤ Promote rice production towards self-sufficiency
Government in its Manifesto promised the following key actions:                             ¤¤ Promote cotton growing to sustain the country’s textile
                                                                                               industry
    NRM Manifesto Actions                                                                   ¤¤ Promote cassava production and seek investors for value
                                                                                               addition
    ¤¤ Mobilise and support small scale farmers along the four-                             ¤¤ Create regulatory body for policing lakes against illegal
       acre model concept                                                                      fishing, protect fish breeding sites and restock fish in all
    ¤¤ Under Operation Wealth Creation (OWC) coordinate all                                    water bodies
       the state agencies involved in the production chain and                              ¤¤ Build two tea factories in Kabale and Kisoro
       link them with the private sector

                                                                                       22
A Baseline Citizens’ Assessment of the NRM Government’s First Year of 2016-2021 Term
Results of this study indicate that 86% of the respondents own
land and this land is largely under agricultural production.
The Citizens’ Manifesto indicates that 77% of the labour force
in Uganda is employed in agriculture, yet the sector budget
allocation is 3.2% on average. The citizens demand that
Government change its budget priorities to ensure measurable
reduction in public administration expenditure and invest in
agriculture as a way of ensuring that there is equal opportunity
in national development. Figure 15 below shows percentage
ownership of land under agriculture.
Figure 15: Ownership of Land under Agricultural
Activities
Table 2: Type of Household Agricultural Enterprises
Source: Baseline Research Data Type of agricultural enterprise Percent
Crop production 59.4
The study also shows that land under agriculture has the following
categories of enterprises; 59% are engaged in crop production, Livestock farming 29.6
30% are in livestock production, while 11% are engaged in other Others 11.0
agricultural activities. Total 100.0
Source: Baseline Research Data
23A Baseline Citizens’ Assessment of the NRM Government’s First Year of 2016-2021 Term
A gender analysis of ownership and participation of women Figure 16: Household Agricultural Enterprises by Sex
and men in agricultural enterprises shows that men dominate
the agricultural enterprises at the household level. In both crop
farming and livestock, men’s ownership and participation is
over 70% and for women it is about 21%. This indicates that
women and men are still very unequally represented in a sector
where 60% of the citizens are engaged. This reality does point to
the critical need to continue addressing the disparities between
women and men in agriculture.
Source: Baseline Research Data
Table 3 below indicates that overall, the Western region has
the highest numbers in crops, livestock and other agricultural
enterprises. For instance, 33% of the households in the western
region are engaged in crop production compared to 21% in
Central, 23% in Eastern and 24% in Northern. Further, households
in the Western region engaged in livestock production (30%)
are higher than other regions. The Central region has the least
households engaged in crop and livestock production but has
a high number of respondents who are involved in other agro-
enterprises.
24A Baseline Citizens’ Assessment of the NRM Government’s First Year of 2016-2021 Term
Table 3: Type of Household Agricultural Enterprises by Figure17: Responses on Support from Operation
Region Wealth Creation
Type of Central Eastern Northern Western
agricultural (%) (%) (%) (%)
enterprise
Crop 21.1 22.6 23.7 32.6
production
Livestock 18.0 25.4 26.8 29.9
farming
Others 30.4 23.8 23.8 22
Source: Baseline Research Data
2.2.1 Operation Wealth Creation
Source: Baseline Research Data
The study also engaged respondents in discussions related to
Operation Wealth Creation. Operation Wealth Creation has Further analysis of the type of support gained indicated that
the goal to enhance household participation in commercial 14% of the inputs from OWC were in form of crops/seedlings of
agricultural production through community mobilization, various varieties, 4% and 3% was in form of training and farm
equitable and timely distribution of agricultural inputs, and implements respectively.
facilitation of agricultural production chains.1 29% of the
respondents with agricultural enterprises did indicate that they Table 4: Type of Support Received from OWC
had received support from Operation Wealth Creation (OWC).
Support from Operation Wealth Creation Percent (%)
This is a significant achievement since it points to a reasonable
level of community penetration by the OWC program. Figure Training 3.6
17 summarizes the findings related to this government policy Crop/seed varieties 14.4
intervention. Inputs/Farm implements 3.2
Animals 0.6
Extension services 0.8
Poultry 0.2
Funds 0.3
1 See OWC portal for details.
Source: Baseline Research Data
25A Baseline Citizens’ Assessment of the NRM Government’s First Year of 2016-2021 Term
During the focus group discussions, community members across variously; one woman in Karamoja had this to say;
all villages visited observed that OWC is benefiting a few people
and would want the program to be expanded. Communities
that received seeds and seedlings such coffee, oranges, mangoes “You are given maize or bean
and cassava noted that seeds under OWC are sometimes of poor
quality and in some cases do not germinate. The absence of seeds in a ‘tumpeco cup’2, is this
extension services to accompany the work of OWC, especially for
crop farming, was expressed as a key constraint to the delivery of
creating wealth? Some seeds
the program. Some respondents noted that some of the reasons
why seeds to do not germinate may be more to do with the
are bad and don’t germinate,
handling of the seedlings and farmer knowledge than just the some seeds are received by some
seeds being of poor quality. These challenges were expressed
people and they take them to
the open market,”
Elderly Woman, Moroto district.
Community members also noted that they are not always
consulted on the type of seed varieties they need. They
mentioned that sometimes the distribution is not supported by
prior sensitization and there were a few cases reported where the
2 Tumpeco refers to cup (plastic or tin) with a carrying capacity of 500 grams.
26A Baseline Citizens’ Assessment of the NRM Government’s First Year of 2016-2021 Term
timing of the distribution of seeds and seedling was off-season.
Some respondents were able to make comparisions with other
“Here in Iganga, we are in an urban
programs like the National Agricultural Advisory Program. This is area. The little plots of land we
what one respondent had to say:
have nearby are not big enough for
“When you compare OWC with growing maize and planting lemon
NAADS, there are some good things or orange trees whose seedling and
that NAADS did. NAADS offered seeds I have seen distributed. I hope
sensitization and monitored farmers government can find other appro-
but they did not give enough seed- priate crops for the urban areas and
lings, but WC gives seeds but does also teach us how to do urban ag-
not monitor farmers and teach them. riculture. That way we shall love
In some cases OWC just dump the OWC.”
seeds, you don’t see them again! Male FGD Participant, Iganga District
They should give the seeds and en- Participants in the FGDs spoke very extensively about OWC, this
sure that they work with farmers to was mostly because it was a current program and they had a lot
of feedback to share. While some of it was very critical of the
create a strong system for seeing how program, there is a lot that can be done to ensure that citizen
farmers are doing.” benefit more from the program. The findings in this report are
now a baseline that we can track to see if the perceptions and
feedback of citizen will change overtime.
Women in FGD, Lira district.
2.2.2 Loans for Agriculture
Another male participant in Iganga district spoke about the
need for additional mapping of appropriateness of the inputs Table 5 indicates that 18% of the respondents had accessed a loan
distributed. for agricultural production. The table also shows that SACCOs are
the main sources of loans for agricultural production, followed
27A Baseline Citizens’ Assessment of the NRM Government’s First Year of 2016-2021 Term
by microfinance institutions. While the NRM Manifesto did are in a farmer group. While this is a good start, encouraging
indicate that it will continue expanding the agricultural finance more farmer groups and cooperatives will have to be emphasized
credit scheme, there was no evidence available at community so that farmers can leverage the advantages of economies of
level of said scheme. It is also important to note that the number scale and collective bargaining.
of farmers that are able to access agricultural financing is still very
low. Only 2 out of 10 people are able to access financing and Figure 18: Members in Farmer Groups
yet 6 out of 10 people are in the agricultural sector. This large
disparity compromises the profitability of the agricultural sector
and the overall sector output and contribution to the economy.
Table 5 shows the percentage distribution of respondents and
access to loans.
Table 5: Access and Sources of Agricultural Loans
Accessed a loan Percent (%)
Yes 18.0
No 82.0
Sources of loan Percent (%)
SACCO 5.4
Micro-Finance Institution 3.5
Commercial Banks 2.9
Money lenders 0.5
Relatives and friends 1.6
Source: Baseline Research Data
Farmer group 1.6
Source: Baseline Research Data
2.2.4 Seed Production
2.2.3 Farmer Groups
The NRM Manifesto undertook to support individual and
One of the main undertakings of the NRM Manifesto is mobilizing companies in seed production. This is an important ingredient in
farmers along the ‘four acre model’ and also in farmer group. the process of improving agricultural productivity in Uganda. As
From the study, it was evident that there were many farmers who one man in Iganga said;
were in farmer group. 1 out of every 4 farmers reported that they
28A Baseline Citizens’ Assessment of the NRM Government’s First Year of 2016-2021 Term
“Seeds are some of our biggest The NRM Manifesto further undertook to support livestock
breeding but as Table 6 shows, only 6% of farmers in livestock
headache in agriculture. To get production use commercially prepared animal feeds. This number
is still low and is one that requires additional policy intervention.
good maize seeds is not simple. We Table 6 summarises some of the key inputs that farmers require
try to use our local seeds but the to transform themselves and the country.
productivity of these local seeds is Table 6: Type of Input Used by Farmers
also a problem. I hope government Inputs Percent
Local seeds 71.2
can come in and ensure that they Improved/hybrid seeds 41.3
have a big program that will supply Organic fertilisers 26.5
seeds and distribute to all of us.” Inorganic fertilizers
Organic pesticides
19.3
16.3
Male Youth, Iganga District Inorganic Pesticides/Herbicides /Fungicides 13.7
Commercially prepared animal feeds 5.5
Table 6 below shows that 71% of the farmers use local seeds and Veterinary drugs 25.4
41% use improved seeds. It is clear from this table that while
Artificial Insemination 2.8
there is a significant number of farmers who use local seeds, there
is also a growing number of farmers who are using improved Source: Baseline Research Data
seeds. It will certainly be important for the interventions in this
area to continue expanding the number of local farmers who are 2.2.5 Good Agricultural Practices (GAP)
accessing local seeds.
The NRM Manifesto committed to put in place, ‘measures to
ensure Good Agricultural Practices’3 One of the GAP ingredients
The NRM Manifesto also undertook to promote the use of manure,
is the nature of storage facilities that farmers have. When asked
organic fertilizers and inorganic fertilizers. This study established
if they have any kind of storage facility, 5 out of every 10 farmers
that among the sampled respondents, 27% use organic fertilizers
did not have a storage facility (52%). The other 48% reported
and 19% use inorganic fertilizers. It will therefore be an uphill
that they had facilities but the majority used their ‘house’ as the
task to ensure that more farmers are supported to adopt the use
storage facility (34%). There were only 5.3% that reported that
of fertilizers. These adoption rates are still too low to create any
they had an improved granary for use as a storage facility. Table
reasonable impact in the productivity of farmers.
7 summarizes the key findings in this area.
3 NRM Manifesto (2016-2021), p.99 (n)
29A Baseline Citizens’ Assessment of the NRM Government’s First Year of 2016-2021 Term
Table 7: Household with Storage Facilities for
NRM Manifesto Actions
Agricultural Products
¤¤ Build six dams in 2016 – Acampii dam in Oyam district,
Have storage facility Percent (%) Namatata dam in Nakapiripirit district, Katabok dam in
Yes 48.0 Abim district, Bigasha dam in Isingiro district, Ongole dam
No 52.0 in Katakwi district, Mabira dam in Mbarara district.
Type of Facility Percent (%) ¤¤ Procure and distribute valley tanks/dams construction
Improved granary 5.3 equipment in Teso, West Nile and the Northern regions.
Also Buyende, Kaliro, Kayunga, Masindi, Buliisa, Kyegegwa
Unimproved granary 4.9
districts in the next five years
In the house 34.8 ¤¤ Rehabilitate 15 old dams in Teso and 104 dams in the
Specific house/room 10.2 cattle corridor
Cold storage 0.1 ¤¤ Build bulk water transfer systems to cover long distances
Under ground 0.3 to provide water for multi-purpose use
Over fire place 0.8 ¤¤ Construct large and small-scale irrigation schemes to
increase water for production
Sealed containers 3.3
¤¤ Invest in the development of water for industrial purposes
Source: Baseline Research Data and put in place infrastructure to support the re-use of
water
¤¤ Provide support to scientist at Makerere University
2.2.6 Water for Production
to develop a solar water pump as affordable irrigation
Under water for production4, the NRM Government promised systems
the following actions in its Manifesto:
In all the FGDs, participants concurred that the use of irrigation
was now a necessary part of improved farming practices and
ensuring availability of farm outputs all year round. As one FGD
participant said:
4 NRM Manifesto (2016-2021), p.100, Section 5.1
30A Baseline Citizens’ Assessment of the NRM Government’s First Year of 2016-2021 Term
“If we do not embrace
irrigation, soon we shall
perish…we wait for the rain
and we get the sun, when we
are waiting for the sun we get
the rain. This is a very big
challenge for the farmers. If
government can help us to
learn irrigation and we use it
in our farming, it will be very
good for us.”
Elderly woman, FGD Masindi
Survey results indicated that only 10% of the farmers
use some type of irrigation and 5% have received
some support towards irrigation. As Figure 19
below shows, the use of irrigation is very low with
one near 1 in 10 people being exposed to some
kind of irrigation. Continuing to depend on rain-fed
agriculture is a big challenge that will only be solved
when there is aggressive expansion of the use of
irrigation in farming communities.
31A Baseline Citizens’ Assessment of the NRM Government’s First Year of 2016-2021 Term
Figure 19: Application and Support toward Irrigation Figure 20: Percentage of households with food
shortages in the past 12 months
Source: Baseline Research Data
2.2.7 Food Availability
Source: Baseline Research Data
The outcomes of poor agricultural practices are usually felt at A gender analysis of the data indicated that 82% of the female
the household level through the availability of food. This study headed households experienced food shortages in the past 12
looked at the issues of food availability and found that 77% of months compared to 75% of the male headed households.
the household experienced food shortages in the past 12 months This does point to the gendered nature of vulnerability in food
of the survey and 60% felt that they were likely to experience production and access. It will be important for particular attention
food shortages in the next 12 months. Figure 20 summarizes to be paid to these gendered differences in food shortages.
the statistics.
32A Baseline Citizens’ Assessment of the NRM Government’s First Year of 2016-2021 Term
Figure 21: Percentage of Households with Food Figure 22: Percentage of Households Likely to Have
Shortages in the Past 12 Months by Sex Food Shortages in the Next 12 Months by Sex
Source: Baseline Research Data Source: Baseline Research Data
The question of the likelihood to experience food shortages is an A regional analysis of food shortage indicates that the number of
important question that uses the experience of the respondent. households that reported experiencing food shortages in the past
Women headed households in this case were predicting a smaller 12 months were slightly higher in the central (82%) and northern
likelihood to experience food shortage then the male headed (84%) regions. Table 8 shows these geographical variations.
household. 59% of the male headed household predicted food
shortage and 58% of the female households predicted food
shortage.
33A Baseline Citizens’ Assessment of the NRM Government’s First Year of 2016-2021 Term
Table 8: Households with food shortages in the past 12
months by region
Region Experience food Total
shortage
Yes No
Central 81.9 18.1 100.0
Eastern 72.7 27.3 100.0
Northern 83.6 16.4 100.0
Western 72.2 27.8 100.0
Source: Baseline Research Data
This study also looked at the reasons why there was food
shortage in some areas. 82% of the households experienced food
shortages in the past 12 months due to loss of crops resulting
into insufficient production. Inadequate land (30%) and capital
(32%) for production are also contributing to food shortages at
household level. Table 9 presents a synthesis of the reasons for
food shortage.
Table 9: Reasons for Households with Food Shortages in
Past 12 Months
Reasons for food shortages 1st 2nd 3rd
mention mention mention
(%) (%) (%)
Loss of crops/insufficient 81.6 9.8 6.4
production
Lack of job 4.7 7.5 7.4
Inability to work - illness or 1.6 10.7 10.5
injury
Disability/old age 0.6 2.4 1.4
Inadequate land 4.3 30.4 15.3
34A Baseline Citizens’ Assessment of the NRM Government’s First Year of 2016-2021 Term
Additional information was collected on the reasons that led
Reasons for food shortages 1st 2nd 3rd
mention mention mention to low crop production.The three top reasons that limit food
(%) (%) (%) production included; lack of knowledge on best farming practices
Inadequate capital 3.4 22.9 32.0 (21%); poor rainfall pattern (18%); and insufficient land (18%).
Table 11 shows the distribution of limiting factors.
Family too big 1.0 3.7 8.7
Over selling produce 1.9 7.0 11.6 Table 11: Factors Limiting Crop Production
Loss of livestock 0.1 1.1 4.3 Factors limiting crop 1st 2nd 3rd
Others 0.8 4.4 2.3 production mention mention mention
(%) (%) (%)
Total 100.0 100.0 100.0
Lack of knowledge 21.0 10.9 9.6
Source: Baseline Research Data
Lack of improve seeds 7.9 9.5 7.4
35% of the households in the Northern and 30% Western Insufficient access to 2.7 3.0 3.8
regions experienced food shortages in the past 12 months due extension services
to loss of crops/insufficient production. Inadequate land for Pests and diseases 10.1 6.3 4.9
crop production was highlighted more in the Western (36%) Loss of soil fertility 9.5 7.9 7.1
and Northern (28%) regions. Lack of capital for crop production Poor rainfall pattern 19.3 17.8 11.1
affects household more in the Northern (39%) than other regions.
High costs of production 5.3 6.8 6.3
Table 10: Reasons for Households with Food Shortages in Insufficient water 0.8 4.2 5.8
Past 12 Months by Region Poor health 1.8 2.3 2.4
Reasons for Region (%) Total Labour shortage 3.2 4.6 5.1
food shortages Central Eastern Northern Western Insufficient land 8.9 10.8 17.9
Loss of crops/ Theft 1.5 2.7 2.5
insufficient 18.1 16.4 35.1 30.4 100.0 Weeds 0.7 2.3 1.3
production
Poor roads 0.0 0.1 0.9
Inadequate 19.6 16.6 27.6 36.2 100.0 Natural calamites 7.2 10.5 13.5
land
Inadequate Insecurity 0.3 0.5 0.5
capital 11.0 26.5 38.7 23.9 100.0
Total 100.0 100.0 100.0
Source: Baseline Research Data Source: Baseline Research Data
35A Baseline Citizens’ Assessment of the NRM Government’s First Year of 2016-2021 Term
2.2.8 Awareness of Government Interventions in Table 12: Type of Government Interventions in Agricul-
Agriculture ture Mentioned
Since this is a baseline, this study explored the levels of awareness Type of government intervention Percent
(%)
of respondents of the government interventions in agriculture.
There was a modest level of awareness. 35% of the household Training on best practices like land use etcetera 11.3
surveyed are aware of government interventions in their area to Provision of Crop/seed varieties 27.3
promote agricultural production. Figure 23 shows the percentage Provision of Inputs like fertilizers, pesticides,
4.0
distribution of respondents. etcetera
Provision of Farm implements 5.5
Figure 23: Percentage of Respondents with Provision of Animals 6.1
Knowledge on Government Intervention Towards Extension services 4.9
Agriculture
Provision of Poultry 1.7
Marketing 1.0
Funds/money/credit 1.0
Source: Baseline Research Data
2.3 Water supply
For the period 2016 – 2021, the NRM Government promised
to ensure that there is a water point in every village in order to
increase access to safe clean water coverage within a radius of
one kilometre from the current 65% to 100%. The following are
Source: Baseline Research Data the key action points:
This study went further to understand in which areas the
respondents had awareness. Provision of crops/seed varieties was
cited by 27% of the household as a government intervention to
promote agricultural production. A number of other interventions
were mentioned but there was very low appreciation of the
actual programs.
36A Baseline Citizens’ Assessment of the NRM Government’s First Year of 2016-2021 Term
NRM Manifesto Actions
¤¤ Construct listed Gravity Flow Schemes
¤¤ Rehabilitate and expand listed water systems
¤¤ Construct 60 solar-powered mini-piped water schemes
across the country
¤¤ Develop 5,000 borehole water point sources
¤¤ Review policy on borehole maintenance and repair
¤¤ Develop large ground wells in several water-stressed
parts of the country
¤¤ Complete provision of piped water to 19 towns
Survey results show that 28% of the respondents rated the
coverage of safe water sources in their area as fair. Figure 24
further illustrates that 27% rate the coverage of safe water
sources as very poor.
Figure 24: Percentage Rating of Safe Water Coverage
Source: Baseline Research Data
37A Baseline Citizens’ Assessment of the NRM Government’s First Year of 2016-2021 Term
Figure 25 indicates that 44% of the houses have access to piped Figure 26: Percentage of Respondents Accessing
water although not necessarily installed at household level. While Piped Water by Region
this is a reasonable figure, there still exists the risk of the water
being exposed to unsafe practices that come from transporting
water from the source to the household.
Figure 25: Percentage of Respondents Accessing
Piped Water
Source: Baseline Research Data
Survey results in table 13 show that 25% of the household obtain
water for drinking and domestic use from unprotected sources
such as wells, lakes, rivers and springs. 33% use tap water for
both drinking and domestic use.
Source: Baseline Research Data
Table 13: Sources of Water for Drinking and Domestic
Figure 26 illustrates that 32% of the respondents in the Central, Use
and 26% in the Western have access to piped water. In the Water sources Percent (%)
Northern and Eastern, only 19% and 22% have access to piped
Tap water 32.8
water.
Borehole 51.6
Protected Springs 20.1
Rain Water 12.7
Unprotected Source (well/lake/river/spring) 25.0
Gravity flow scheme 1.4
Shallow wells 7.5
Source: Baseline Research Data
38A Baseline Citizens’ Assessment of the NRM Government’s First Year of 2016-2021 Term
Figure 27 illustrates that 63% of the households are less than half Figure 28: Percentage of Respondents with Access
a kilometer from a safe water source. The figure also indicates to Enough Water for Household Use
that 15% of the households are in the distance of one kilometer
from a safe water source.
Figure 27: Distance to the Nearest Safe Water
Source
Source: Baseline Research Data
Households (35%) in the Western region access enough water
for household use compared to other regions.
Source: Baseline Research Data
Table 14: Percentage Distribution of Households
Accessing Enough Water
When respondents were asked whether they access enough Region Total
water for household use, 60% responded in the affirmative as
Central Eastern Northern Western
indicated in Figure 28.
Yes 20.4% 16.6% 28.3% 34.7% 100.0%
No 8.2% 22.0% 35.4% 34.4% 100.0%
Not sure 0.0% 66.7% 33.3% 0.0% 100.0%
Source: Baseline Research Data
Water for consumption is a very important part of securing
people’s health and wellbeing. The figures above indicate there
is still a lot of work that needs to be done on the issue of safe
water. The commitments in the NRM Manifesto are far reaching
39You can also read