Economic Contribution of Nevada Agriculture - NEVADA DEPARTMENT OF AGRICULTURE
←
→
Page content transcription
If your browser does not render page correctly, please read the page content below
NEVADA DEPARTMENT OF AGRICULTURE

Economic Contribution of
   Nevada Agriculture
Economic Contribution of Nevada Agriculture

ACKNOWLEDGMENTS:

This report was prepared by The Nevada Department of Agriculture. Support for this report was
provided by Jim Barbee, Bob Conrad, Jeff Sutich, Conni Valley and Tatjana Vukovic.
We would like to thank Department of Employment, Training and Rehabilitation as well as
Governor’s Office of Economic Development for providing valuable employment information and
industry insight.
Also we would like to extend our gratitude to Professor Tom Harris, State Extension Specialist
and Director, University of Nevada, Reno Department of Economics, University of Nevada
Cooperative Extension, University Center for Economic Development, for his ideas and guidance,
as well as Maleika T. Landis for her efforts in providing valuable information.
Economic Contribution of Nevada Agriculture

TABLE OF CONTENTS:

Executive Summary ….……………………………………………………………………………………………………... 1
Agriculture in Nevada – Overview ……………………………………………………………………………………. 3
Nevada Agriculture Value Chain Analysis …… ………………………………………………………………..… 12
     Agriculture and Food Production Sector ………….………............................................. 13
     Agriculture and Food Processing and Manufacturing Sector.…………..………………….. 21
     Agriculture and Food Distribution and Wholesale Sector …………………..………………. 27
     Agriculture and Food Retail and Food & Beverage Sector ………………..………………… 30
Conclusion ………………………………………………………………………………………………………………….…. 34
Economic Contribution of Nevada Agriculture

Economic Contribution of
Nevada Agriculture
Executive Summary:

As a longstanding contributor to the state economy, particularly for the rural areas, Nevada agriculture
and its cluster industries have a symbiotic relationship; they provide and receive products and services
from each other. Modern agriculture touches every aspect of our society from the individual consumer’s
health and safety to the nation’s welfare and security. Agriculture is a dynamic export-based sector that
infuses dollars into the economy and is the basis for the future of economic development. To develop a
comprehensive understanding of the impact of agriculture on the Nevada economy, it is important to
understand the scope and structure of Nevada agriculture, how agriculture connects itself to other
industries, and how it contributes to the state economy.

This report is intended to serve as a starting point for   Agriculture has a significant impact on the economy
analysis across the broad span of agricultural             of Nevada. A majority of the materials and inputs for
activities in Nevada. The analysis of the value chain of   agricultural and food production are coming from
Nevada agriculture illustrates connections among           farms and ranches, but modern agriculture is more
different industries and sectors and provides valuable     than just farms and ranches. Many inputs used by
information necessary for the development of this          farms and ranches are purchased from other
important industry, its workforce, and future              industries. For that reason the agriculture and food
economic development strategies.                           sector value chain includes those businesses engaged
                                                           in the processing, manufacturing, and marketing
The need to identify and map the structure of the
                                                           activities, and they are all linked together into a
Nevada food and agriculture cluster has arisen from
                                                           common framework.
recent efforts to engage agriculture as an economic
development driver. Understanding the agriculture          To determine the interconnection within the
value chain provides an opportunity to build bridges       agriculture value chain, it is necessary to examine the
between different commodities and industries in            capital base of Nevada’s farms and ranches, all those
Nevada; reduce some of the existing economic gaps          inputs that go into agriculture production.
within the sector; and, develop the collaboration
across different segments of the value chain.

                                  NEVADA DEPARTMENT OF AGRICULTURE                                          1
This report examines all the segments of the               The main objectives of the Nevada Department of
agriculture and food value chain, value of production,     Agriculture and its agriculture industry partners is to
number of establishments, occupation, and                  explore all the challenges and opportunities within
employment characteristics. With this report we are        the agriculture sector and its related industries, foster
creating a framework for a future detailed analysis –      statewide business environment, improve access to
which will include an economic contribution analysis,      labor by understanding industry needs, and develop a
detailed supply chain analysis, and workforce analysis     strong new brand that will promote Nevada
for the agriculture and food sector and its value chain.   agriculture and its value.

                                  NEVADA DEPARTMENT OF AGRICULTURE                                            2
Figure 2. Farms and ranches by type of entity
Agriculture in Nevada - Overview:
                                                                                                        Other,           Non-Family
                                                                                                         75             Corporations,
Nevada Farms and Ranches – Type of                                                                                          230
Operations and Entity:                                                                                                            Parthnership,
                                                                                                                                       284
Nevada farming and ranching operations vary in size
                                                                                                           Family or
and type of farms and ranches. In 2012, there were a                                                       Individual
total of 4,157 farms and ranches with 5.9 million acres                                                      2,542
of land dedicated to farming and ranching1,
accounting for approximately 8% of the state’s total
land being engaged in some kind of agricultural
                                                                               Source: (USDA, Census of Agriculture, 2007)
production.
Nevada farms and ranches are relatively large in
terms of land by national standards – the average size                         Nevada Farms and Ranches – Location
of Nevada farms in 2012 was 1,423 acres which is
                                                                               and Number of Farms:
more than twice the national level (434 acres). The
majority of Nevada’s agriculture operations – 82.78%                           The number of farms and ranches and acreage these
are those primarily engaged in raising livestock;                              operations cover varies within the different counties
12.85% of Nevada farms and ranches are engaged in                              in Nevada. Most of Nevada’s rural communities have
crop production while the remaining 4.37% are land                             agriculture and food production as a significant part
in farms designated for other usage. (Figure 1.)                               of their economic operations.
Figure 1. Land in farms by type of land2                                       Counties with the highest number of farms are:
                                Other uses                                     Churchill (529), Elko (456), Washoe (393), and Lyon
          Cropland                4.37%
                                                                               (325). More than half of all Nevada farms and ranches
           12.85%
                                                                               are located in those counties. Fifty four percent of all
                                                                               Nevada farm and ranches in 2007 were located in 4
                                                                               counties. (Table 1.) Elko County has 2.1 million acres
                                      Pasture                                  (36%) of land out of total of 5.8 million acres
                                      82.78%                                   dedicated to farming, which is the highest count for
                                                                               all counties in Nevada.3
Source: (USDA, Census of Agriculture, 2007)                                    Table 1. Farm data by county – Nevada 2007:
The largest share of farms and ranches (82.2%) are                                                              County               Number of Farms
owned by families or individuals, and many of these                                                     Churchill                                529
have been Nevada small family owned businesses for                                                           Elko                                456
many years. Partnerships represent 9.1% of all                                                           Washoe                                  393
ranches and farms, and 7.3% of operations are non-                                                          Lyon                                 325
family corporations. 2.4% of total operations are                                                  Other counties
                                                                                                                                                1,428
registered as other cooperative operations, or some                                                    combined
estate or trust operations.                                                                                 Total                               3,131
                                                                               Source: USDA, Census of Agriculture, 2007 State and County Data, Vol.1. Geographic

1                                                                              3
    2012 Census of Agriculture – Preliminary report, USDA, NASS                    Source: Nevada Agriculture Statistical Bulletin 2013 (2007 data)
2
    Percentage calculation is based on 2007 USDA Census of Agriculture data.

                                                        NEVADA DEPARTMENT OF AGRICULTURE                                                                    3
Nevada Farms and Ranches - Size of Nevada Farms and Ranches - Sales by
Operations: Different Economic Classes:
The trend when it comes to the size of farms and More than half of the farm and ranch operations in
ranches in the state, based on the Census data from Nevada, 1,786 out of a total 3,131, or 57% are small
1997 – 2007, shows an increase in the number of businesses with annual sales of less than $10,000.
small (1 to 9 acres and 10 to 49 acres) operations. The (Figure 4.)les
number of smaller farms in 2007 (those less than 179
Figure 4. Distribution of total value of agricultural
acres) increased by 10% on average from 2002.
sales across farms and ranches in Nevada
Typically these smaller operations will most likely sell
their products to local farmer markets or stores, and
sell $10,000 to $99,999
sales by 730 farms that
in most cases they do not consider farming as their
sales by 255 farms that sell
sales by 157 farms that sell
full time professions, but rather a part time lifestyle.
Sales by 1,786 farms that
sell less than $10,000
sales by 203 farms that
Many small part-time operators are in agriculture
$100,000 to $249,999
$250,000 to $499,999
Average value of sales
business to preserve their way of life.
sell $ more than
At the same time the number of large operations
$500,000
(1,000 acres or more) decreased by 12% for the same
period.
Figure 3. Changes in the number of Nevada farm
1,786 730 203
and ranch operations 255 157
No. of Farms and Ranches
3500
Source: USDA, Census of Agriculture, 2007
3000 - 12%
1,000 + acres These small farm and ranch operations in the state
1%
contributed approximately $3.9 million or about 1%
Numbers of farms and ranches
2500
2% 500 - 999 acres
of total agriculture commodity sales in 2007.
2000
12% 180 - 499 acres
On the other side, the largest operations, those with
1500 50 - 179 acres
10%
annual sales of more than $500,000, represent only
1000 10 - 49 acres 6% of total farm and ranch operations. These 203
operations account for approximately 76% of the
500 1 - 9 acres
9% state’s agricultural sales. The total commodity sales of
0 the largest farms and ranch operations were $388.4
1997 2002 2007 million.
Source: USDA, Census of Agriculture, 2007 In between these two, there is span of mid-size farm
and ranch operations, 1,142 farms with sales
The most recent data for 2012 published by the
between $10,000 and $500,000, creating 23%
Census of Agriculture are showing a significant
(approximately $121.1 million) of the total value of
increase in the number of farms and ranches (from
commodity sales.
3,131 in 2007 to 4,157 in 2012). The most significant
change was the number of small farm operations (1 –
9 acres). Those operations increase almost double in
size in 2012 (from 631 in 2007 to 1,003 in 2012).
NEVADA DEPARTMENT OF AGRICULTURE 4
Nevada Farms and Ranches – Capital                                               The difficulty for ranchers and farmers regarding land
                                                                                 and its use in Nevada stems from the fact that more
Inputs:
                                                                                 than 80% of Nevada’s land is under federal control.
In general, the agriculture industry is very capital                             The table below shows 2010 land inventory in Nevada
intensive, water dependent, and land locked. Nevada                              with land cover/use measured in acres.
farm and ranch enterprises create value from the
                                                                                 Table 2. Land cover/use – Nevada, 2010:
capital they use and workers they employ. Capital
                                                                                     Land cover/use                                               Acres:
used in food and agriculture production can be
categorized as human capital, natural-resource                                       Federal Land                                             59,868,900
                                                                                     Water Areas                                                 432,100
capital (land and water), physical capital (agricultural
                                                                                     Developed Land                                              554,900
equipment, livestock inventory, and crop
                                                                                     Rural Land:                                               9,907,200
inventories), and off-farm manufactured capital like                                 Crop Land                                                   595,000
fertilizers, pesticides, and financial capital.                                      Pastureland                                                 215,600
                                                                                     Rangeland                                                 8,357,900
Human Capital:                                                                       Forest Land                                                 315,800
Important asset for agriculture and food production                                  Other Rural Land                                            422,900
is human capital. Human capital has a high degree of                                 Total                                                    70,763,100
                                                                                 Source: Summary Report – 2010 National Resources Inventory
specialization because of specific knowledge, skills,
and abilities that farmers and ranchers have. Their                              The primary use of federal land in agriculture
experience and expertise is what assures the ongoing                             production is livestock grazing. The majority of
economic productivity of the Nevada food and                                     Nevada’s livestock operations are highly dependent
agriculture production industry. In 2007, there were                             on the use of federal rangelands to maintain the
5,117 total operators in Nevada.4 The majority of                                viability of their enterprises.
them had 10 or more years of experience of working                               About 45 million acres of public rangelands in Nevada
on a farm.                                                                       are divided into 745 grazing allotments. There are 550
The knowledge about agriculture and food                                         operators, with a total of 635 permits to graze
production is crucial for this industry. Quality of                              livestock. Nevada has six grazing districts: Elko,
human capital is extremely important, as well as an                              Winnemucca, Carson City, Ely, Las Vegas, and Battle
investment in training, higher education, and                                    Mountain.6
professional development.                                                        The two major agencies administering public land in
                                                                                 Nevada are the Bureau of Land Management (BLM)
Natural Resources – Land and Water:                                              and the USDA Forest Service (USDA-FS). The Federal
In 2012, there were 4,157 farms covering a total of                              grazing fee for 2013 was $1.35 per animal unit a
5.9 million acres of land. Out of those 5.9 million                              month for public lands administered by the Bureau of
acres more than half were owned by farmers and                                   Land Management and the U.S. Forest Service. At the
ranchers, and the rest of the land was rented.                                   state level, grazing fees on state-owned trust lands
                                                                                 fluctuates, depending on differences in state rate
The total value of agriculture land and buildings in
                                                                                 formulas and local market conditions. Table 3. shows
Nevada in 2012 was $5.0 billion.5 The average farm
                                                                                 the average grazing fees for Nevada and neighboring
real estate value in 2012 was $1,050 per acre.
                                                                                 states (2012 data).

4                                                                                6
 Data represent the total reported number of operators for the operations.           Source: http://www.blm.gov/nv/st/en/prog/grazing.html
5
 USDA, Land Values 2013 Summary – August 2013, National Agriculture Statistics
Service

                                                    NEVADA DEPARTMENT OF AGRICULTURE                                                               5
Table 3. Grazing Fee Average Rates for Cattle in $: Nevada cannot rely on rain for agriculture and food
State Region Animal production. Due to Nevada’s arid climate, irrigation is
Cow-Calf Per Head
Unit
an important way to assure the high productivity of
California 19.4 23 20
agricultural land. Almost all crop production in
Arizona 9 - 11
Nevada is dependent upon irrigation to maintain
Utah 13.7 16.7 16
economically viable yields. Irrigation is a primary
Oregon 15 17 17
activity on farms and ranches during the summer
Nevada 15 - 15.5
Source: Nevada Agricultural Statistics Bulletin, 2013 months (May, June, July, and August), and the
purpose of irrigation is to provide optimum amounts
Nevada’s high desert climate provides unique of water at the needed time to maximize economic
growing conditions for crop production. These yields. A total of 691,030 acres of Nevada’s cropland
growing conditions are warm-to-hot summers days, in 2007 was irrigated land.
with low temperature drops of 40-50F during the
Table 4. Irrigated farms (all size) by type of water,
nights. The proper application of water is important
2008:
for agriculture and food production.
Total water
No. of Farms Total
applied
Water is always important part of agriculture Irrigation/water (all farm irrigated
(acre feet
production, and is always at a premium even in good size): acres
1,000)
years. Water rights represent an important asset held Ground Water 715 272,032 677.9
Source
and used by ranchers and farmers in Nevada. On-farm 687 266,419 389.9
Surface Water
Nevada has 14 hydrographic regions with water
Off-farm Water 530 158,980 336.1
basins and sub-basins that provide water supply to Source: http://www.ers.usda.gov/data-products/western-irrigated-agriculture.aspx
farmers and ranchers for their operations:
There were 1,676 irrigated farms (all size farms) in
Northwestern Region
Nevada in 2008. Total acres covered by irrigated
Black Rock Desert Region
farms were 5.4 million with 1.4 million acre feet total
Snake River Basin
water applied.7 Data in the table below shows the
Humboldt River Basin
estimated number of establishments, jobs, and
West Central Region
payroll in Nevada’s Water Supply and Irrigation
Truckee River Basin
Systems industry (NAICS 221310) in 2012:
Western Region
Carson River Basin Table 5. Water supply and irrigation system industry
Walker River Basin annual average employment, establishments and
Central Region wages:
Great Salt Lake Basin Water Supply Annual
and Irrigation Establish Average Total Annual
Escalante Desert Basin Systems ments Employment Wages (2012)
Colorado River Basin (221310) (2012)
Death Valley Basin Private 20 96 $3,224,635
Local
Source: Basin Boundary Map – State of Nevada Division of Water Resources 24 868 $68,444,161
Government
Source: Bureau of Labor Statistics – QCEW Industry Tables
7
Source: USDA, ERS, Western Irrigated Agriculture
NEVADA DEPARTMENT OF AGRICULTURE 6
Based on the numbers provided by the Bureau of                               providers, electricians, plumbers, painters, and any
Labor Statistics, there were 20 private and 24 local                         other professionals that would be hired to help repair
government establishments engaged in operating                               and maintain physical facilities and equipment of the
water treatment plants and water supply systems,                             farm or ranch. Nevada ranching and farming
providing on average approximately 1,000 jobs in                             operations invested approximately $30.6 million in
2012.                                                                        repairs and maintenance of physical capital on farms
                                                                             and ranches, according to the most recent data in
Physical Capital:                                                            2012.
Physical capital used on farms and ranches is could be
divided into fixed capital such as agricultural
machinery and equipment, and other capital inputs
used like seeds, feed, crop, or livestock inventory.

Farm machinery and equipment:
The investment in machinery and equipment, and
upgrades in technology, are also essential for keeping
agriculture production competitive and assuring
production growth. The estimated value of all
equipment and machinery used on Nevada farms and
ranches was nearly $350 million, averaging
approximately $112,000 in machinery per farm.
(USDA, Census of Agriculture, 2007).                                         A small number of home and garden equipment
                                                                             repair businesses (NAICS 811411) have operations in
Farm machinery and equipment manufacturing
                                                                             Nevada, and they usually service and repair
(NAICS 33311) establishments do not have a
                                                                             lawnmowers, edgers, handheld power tools,
significant presence in Nevada, and supply from this
                                                                             trimmers, etc.
industry to agriculture production has to be delivered
from outside of our state. Investments in equipment                          Most of the repair and maintenance services were
used in agriculture and food production involve                              provided by local mechanics, as well as service
mostly purchases from dealers/wholesalers of                                 departments of equipment manufacturers and
manufacturing products. There are approximately 26 8                         vendors. Approximately 276 commercial machinery
farm and garden machinery and equipment                                      repair      and   maintenance      (NAICS    811311)
wholesale       companies,        which     supported                        establishments in Nevada were available to provide
approximately 198 jobs with $9.1 million annual                              repair and maintenance of agriculture and other
wages in 2012. However, these establishments met                             heavy industrial machinery equipment, however it is
only a small portion of the local demand. The majority                       difficult to determine the exact number of jobs used
of industry requirements were satisfied from                                 for maintenance and repair of agriculture equipment.
suppliers out of the region.
                                                                              Given the fact that most of the time service providers
Repair and maintenance is an important part of farm
                                                                             would have to come physically to farm or ranch
and ranch operations. It includes the repair and
                                                                             locations to perform services, it is safe to assume that
maintenance of not only equipment used in
                                                                             at least half of the agriculture production needs were
agriculture production, but also maintenance of farm
                                                                             supported by businesses and contractors within the
buildings and facilities.     These services cover
                                                                             state.
everything from building contractors, HVAC service

8
    Source: Bureau of Labor Statistics – QCEW Industry Tables

                                                        NEVADA DEPARTMENT OF AGRICULTURE                                       7
Table 6. Machinery repair and maintenance industry When it comes to feed, livestock growers and
annual average employment, establishments and producers are the largest buyers, but some of them
wages: grow at least some portion of feed for animals. In
Annual
Establish Average Total Annual
2007 Nevada ranchers paid approximately $69 million
Industry (NAICS)
-ments Employ. Wage (2012) for feed purchase. This expense was significantly
(2012) higher in 2011, when costs went up to $105 million,
Farm and garden
machinery and making up to 26% of total farm origin purchased
26 198 $9,053,374
equipment inputs. In 2012, the feed purchases were estimated at
wholesalers (423820)
$90.8 million.
Commercial
machinery repair and 276 1,271 $70,305,373 The purchase of livestock is another element of the
maintenance (81131)
Source: Bureau of Labor Statistics – QCEW Industry Tables value chain. The most common method of livestock
purchasing is contracting. Contracting provides
Other options for farmers and ranchers are to rent
secured transactions for livestock growers. Other
machinery or services. These options include rental
transactions include animal auctions and market sales
or lease of equipment, or to pay somebody who owns
that occur directly between interested parties.
equipment to perform certain services. Usually
services would be performed by a contractor or
neighboring farm or ranch operator. This is a cost
effective solution for farms and ranches in those
cases when jobs need to be performed only once a
year, or on an occasional basis. Machine hired work
and custom work costs for Nevada farms and ranches
was $7 million in 2012.
Crop and Livestock Inventory:
Harvested crops are used on livestock farms as feed, In 2012, total expenses for livestock and poultry
as seed stock for replanting, or held in storage for purchases were $62.9 million. Figure 5. shows total
sale. Farmers can decide to save some of the expenses for feed, livestock and seed purchased by
harvested seed to replant. For example, in 2012, Nevada’s farms and ranches between 2007 – 2012.
20,000 acres were designated for new seeding for
Figure 5. Expenses for Feed, Livestock, and Seed
alfalfa hay production.9 Most of the time farmers Purchases; 2007 – 2012
decide to purchase new prepared seed in order to
150,000
save some cost rather than storing and preparing
their own, but sometimes they purchase new seed in
order to improve their inventory. Nevada farms and 100,000
($Millions)
ranches spend approximately $11.4 million in new
seed purchases. Most of the companies selling seed 50,000
products are located outside of Nevada, which means
that money spent on purchases leaves the state. -
2007 2008 2009 2010 2011 2012
In their efforts to provide regulatory support to
Feed purchases
Nevada’s seed industry, the Nevada Department of
Livestock and poultry purchases
Agriculture offers seed certification services,
phytosanitary inspection of crops designated for Source: USDA/ERS Farm Income and Wealth Statistics
export, and testing services for seed identity, viability,
purity and diseases.
9
Source: Nevada Agriculture Statistical Bulletin 2013
NEVADA DEPARTMENT OF AGRICULTURE 8Fertilizers & Pesticide:
The majority of fertilizers used in crop production Some of the farms are generating their own energy,
consist of chemical nitrogen. Fertilizing products used and according to the 2007 Census of Agriculture data,
are mostly sourced from all over the U.S. there were 102 farms generating their own energy or
electricity. However, most of Nevada’s farms and
In 2012, Nevada farmers paid $32 million for
ranches are purchasing services from electric power
fertilizers. Only a small percentage of Nevada’s
generators or wholesalers. A major provider of
agriculture production needs for fertilizers is satisfied
electricity is NV Energy, providing 85 % of the state’s
within the state. The majority is supplied outside of
electrical power. Eight percent is provided by the
Nevada. Only small number of manufacturers,
rural electric co-ops, municipal utilities, and general
approximately 8 establishments10, have their
improvement districts, 3% is provided by Shell Energy
operations in Nevada and most of them are
of North America, the Colorado River Commission of
establishments involved with mixing only.
Nevada makes up the remaining 4 % and provides
Weed and pest control represents an ongoing power to the Southern Nevada Water Authority and
challenge for Nevada farmers. Similar to fertilizers, a group of industrial companies in Clark County. The
the manufacturing, distribution, and sale of chemicals remaining 0.2% is provided by Solar Star. To generate
for pest control is a global business, so the majority of electricity, the state uses several sources including
chemical products and pesticides used were natural gas, coal, hydroelectric, and renewables
manufactured and purchased from companies (Figure 6).
outside of the Nevada. It is estimated that Nevada
Figure 6. Source of electric energy:
farms and ranches paid approximately $15 million for
pest control in 2012. The Nevada Department of Hydroelectric
Agriculture (NDA), through the Pest Control Licensing 7%
Renewable, 10%
Section and NRS 555 and NAC 555, requires that all
pest control companies are licensed in specific
categories of pest control for which they apply Coal, 11%
Natural
pesticides11. The noxious weed program is also Gas, 72%
administered through the NDA and provides
resources to all land owners and users to proactively
prevent, control, and manage invasive weed species. Source:” Nevada Status of Energy”, Governor’s Office of Energy, 2012-13
There are approximately 424 licensed companies in Two significant energy cost categories associated
Nevada that perform pest control services and with farming and ranching operations are the energy
approximately 89 licensed companies that perform cost for animal housing, and energy cost associated
weed control services. The majority of them are in with irrigation operations.
state companies, and a few are from California, Idaho,
Electricity used for animal housing operations and its
Utah, Oregon, etc.
cost, in particular dairy farms, can have a significant
impact on production. Figure 7. shows the estimated
Electricity and Petroleum Fuel and Oils:
dairy farm electric energy consumption on average.
Electricity is an important requirement for agriculture (Adopted from Peterson, 2008)12. This data is
production, not only to power the farm and ranch developed for cow dairies, but may be easily
equipment like irrigation pumps, power equipment, applicable to goat or sheep dairies. Dairy farms use a
etc., but also to provide electricity for farm buildings significant amount of energy. On average, milk
and offices. cooling and ventilation utilize the highest percentage
of the electrical energy .
10 12
Source: Bureau of Labor Statistics – QCEW Industry Tables Source: “Dairy Farm Energy Efficiency”, Andy Pressman, ATTRA, 2010
11
Full list of companies: http://agri.nv.gov/Pest-Control/
NEVADA DEPARTMENT OF AGRICULTURE 9Figure 7. Dairy farm electric energy consumption: Figure 8. Farm and ranch expenditure on energy,
Other, 2007 – 2012:
10% Ventilation,
Milking 24% 40,000
Operations,
18% 35,000
Lighting, 30,000
17%
25,000
Electric
Milk
Water 20,000
Cooling,
Heating, 5% 2007 2008 2009 2010 2011 2012
26%
Source: “Dairy Farm Energy efficiency”, ATTRA Publication. Electricity Petroleum fuel and oils
Another cost associated with energy consumption on Source: USDA/ERS Farm Income and Wealth Statistics
farms and ranches is the cost of pumping water in
irrigation operations. According to data from USDA, in
Veterinary Services and Animal Health:
2008, 789 farms were using electricity to power
pumps (with or without wells) with an average energy The veterinary services industry (NAICS 541940)
pumping cost of $81.22 per acre for farms with wells employed approximately 2,620 people in 2012 with
or pumps powered by electricity for 2008 irrigated the total annual wages of $98.5 million. Currently
farms. there are 878 active veterinarians in Nevada.14
However, some of the services provided by this
Gasoline, diesel, and other petroleum products are industry, in particular small animal care, are not part
important for agriculture production, and they are of agriculture operations.
mainly used for farm equipment and machinery.
Because of the nature of services, and the fact that
Diesel fuel requirements and costs associated with
veterinarians have to, in most cases, visit the ranches
tillage is one part of the expenses, and it varies by
and farms to provide services, a significant portion of
tillage implement. Diesel fuel could also be used to
the agriculture industry needs were supplied within
power pumps used for irrigation. The number of the
the state.
farms using diesel fuel to power pumps (with or
without wells), in 2008, was 45 farms with an average
energy cost $120.34 per acre, and approximately 50
farms were using gasoline to power pumps (with or
without wells). 13
In 2007, Nevada farms and ranches paid $26 million
in electricity costs. That cost increased by 2012 to $37
million. Fuel and oil expenses on Nevada farms and
ranches were approximately $33.4 million in 2012,
decreasing significantly from the previous year.
13 14
There was an insufficient number of observations for this category to determine State of Nevada Board of Veterinary Medical Examiners data
average cost according to data source. Source: USDA, ERS, Western Irrigated Agriculture
NEVADA DEPARTMENT OF AGRICULTURE 10Table 7. Veterinary service industry annual average Farm credit systems consist of a combination of
employment, establishments and wages: federal, state, cooperative, and private financial
Annual Total institutions that provide loans, or at least back loans,
Industry Establish- average Annual to those farmers and ranchers who qualify.
(NAICS) ments Employment Wages
(2012) (2012) The most recent analysis done by the American
Veterinary
$98,468,82 Bankers Association (ABA) shows that the U.S.
Services 217 2,620
5 banking industry is the most important supplier of
(541940)
Source: Bureau of Labor Statistics – QCEW Industry Tables
credit to agriculture, providing more than 50% of all
farm loans. The analysis of bank activities within the
Western Region16 of the U.S. found that farm banks
Financial Capital: increased farm loans by 14.9% in 2012 from the
Financial investment in land and physical capital are previous year. Agriculture production loans were up
the most common ways of assuring a successful by 12.9% in 2012, and farmland loans increased
agriculture production process. Farmers and ranchers 16.7% for the same period.17
are using financial investments, along with Major farm lenders like Wells Fargo Bank, Pinnacle
government programs, crop and livestock contracts, Financial, Bank of America, etc. have their branches
and other types of insurance, to manage business and operations in Nevada, but they are
risks associated with market fluctuations (prices and headquartered in different states. 18
market conditions).
A variety of insurance programs are available to Table 8. Financial industry annual average
farmers and ranchers. Most of these programs are employment, establishments and wages:
backed (reinsured or supplemented) by different Annual
Establish- average Total Annual
insurance program products managed by the Federal Industry (NAICS)
ments Employ. Wages (2012)
Crop Insurance Corporation (FCIC), which is overseen (2012)
by the Risk Management Agency (RMA) of the USDA. Real Estate Credit
(522292)
According to Rain & Hail Insurance Society, the total Private 167 1,420 $118,929,581
Federal 4 27 $2,053,964
amount of crop insurance premiums in Nevada, in Direct Life
2010, was $2.5 million, with the total of 51,689 acres Insurance Carriers 88 4,430 $205,869,955
of crop land insured. There were 192 contracts, with (524113)
Direct Property
total premiums of $911,090 paid by farmers. The total and Casualty
104 1,027 $76,757,768
insurance premium amount for livestock was $3,842. Insurance Carriers
The amount of premiums paid by farmers was (524126)
Source: Bureau of Labor Statistics – QCEW Industry Tables
$3,343.15
Most of the insurance companies are headquartered According to the latest USDA data, the estimated
outside of the state. According to EMSI data, in 2012, amount of financial loan interests in 2012 was $25
a majority of services provided by direct property and million, $18 million were interests on loans secured
casualty insurance carriers (NAICS 524126) were by real estate, and $7 million of loan interests were
supplied out of the state to meet the needs of Nevada not secured by real estate.
agriculture producers.
15 17
2011 Crop Insurance Update, Securing America’s Farmers, Rain & Hail Insurance Source: American Bankers Association (ABA)
Society http://www.aba.com/Press/Documents/2012FarmBankPerformance031813.pdf
16 18
Western Region Includes following states: AK, AZ, CA, HI, MT, ID, NV,OR,UT,WA, WY http://www.aba.com/Tools/BankType/Ag/Pages/default.aspx
NEVADA DEPARTMENT OF AGRICULTURE 11Nevada Agriculture Value Chain
Analysis:
The value chain analysis represents linkages in the Another crucial part of the value chain analysis is
process of turning raw materials and necessary inputs developing a sound understanding of agriculture
into a final product that will be of a service and production output or the value of goods coming from
consumed by end users. The agriculture value chain agriculture production – crops and livestock products
for Nevada is defined as the linkages between inputs – that will provide an input for food manufacturing
and outputs of agriculture sector enterprises in the and processing, or that will be retailed to its final user.
process of creating products and its value through
The Agriculture Processing and Manufacturing sector
sales to final customers.
of the agriculture value chain comprises those
The core of the Nevada agricultural value chain is establishments that create additional value to
defined as Agriculture and Food Production, and it agriculture products by marketing them, processing
comprises all establishments engaged in growing them, or using them as an input in manufacturing.
crops and raising animals, farms, ranches, dairies,
The marketing and logistics functions that ultimately
greenhouses, nurseries, orchards, or hatcheries.
deliver products and services to final consumers is
Nevada farms and ranches vary based on the type of
accounted for in the Agriculture Distribution and
land, ownership, size, and economic class. It is
Wholesale sector of the value chain.
important to determine the value and size of their
operations, recent trends, and changes in sizes of The last segment of the value chain are those
ranches and farms, as well as the contribution of their industries that are included in Retail and Food and
operations in the agriculture sector value chain. Beverage Service sector as part of value chain where
products are sold and used by customers.
An important part of the value chain analysis is an
analysis of the capital base of Nevada farms and Each of these sectors, identified as a part of the value
ranches. Capital base is the production capital that chain, are chosen because they have an economic link
includes labor, land, water, and equipment, as well as with farm or ranch operations and present potential
inputs outside of the farm such as fertilizers, marketing opportunities for the future growth of
pesticides, electricity, and fuel necessary for Nevada agriculture in Nevada.
farms and ranches to perform their operations.
Capital base analysis shows all the linkages that exist
between production and other support industries,
and determines what other inputs agriculture
production needs to purchase to exist. Through the
identification of the linkages, it is possible to
determine the potential for future growth and
development of all market opportunities in Nevada.
NEVADA DEPARTMENT OF AGRICULTURE 12Agriculture and Food Production Agriculture and Food Production –
Sector: Economic Contribution:
Direct Economic Effect:
Agriculture and Food Production activities include
primary livestock and crop production, while Direct economic effect of Nevada agriculture and
agriculture support activities are those associated food production could be analyzed by its contribution
with farm operations such as soil preparation, to the state’s economy using traditional economic
planting, and harvesting. indicators such as cash receipts from marketing, value
of agriculture production, tax revenues that the state
Agriculture and Food Production Industries collects, and employment.
- Definition:
Agriculture and Food Production Output:
The agriculture and food production industries In 2012, the annual cash receipts from marketing
include establishments primarily engaged in growing agriculture commodities was $718 million, 60% were
and harvesting crops, raising animals, harvesting cash receipts for livestock and products, and 40%
timber, etc. Establishments are described as farms, were cash receipts for marketing crop products. The
ranches, dairies, greenhouses, nurseries, orchards, or graph below lists a detailed breakdown of total cash
hatcheries and can be operated by the operator alone receipts from farm marketing in Nevada in 2012.
or with the assistance of members of the household
or hired employees. Figure 9. Total cash receipts, percent by commodity,
Industry Groups: Nevada 2012:
Animal Farming: Feed crops,
Food
112111 Beef Cattle Ranching and Farming grains, 20.4% Vegetables and
112112 Cattle Feedlots 1.1% melons, 14.9%
112120 Dairy Cattle & Milk Production Fruits and
Miscellaneous nuts, 0.1%
112210 Hog & Pig Farming livestock, 2.9%
112920 Horse and Other Equine Production
112990 All Other Animal Production Poultry and All other
Crop Farming: eggs, 0.1% crops,
111150 Corn Farming 3.4%
111199 All Other Grain Farming Dairy
111219 Other Vegetable and Melon Farming products,
111332 Grape Vineyards Milk, 17.4% Meat
111339 Other Non-citrus Fruit Farming animals,
39.6%
111998 All Other Misc. Crop Farming
Greenhouse, Nursery and Floriculture: Source: USDA Economic Research Service (www.ers.usda.gov/dtat-products/farm-
income-and-waelth-statistics.aspx)
111411 Mushroom Production
111419 Other Food Crops Grown Under Cover Although commodity cash receipts have a tendency
111421 Nursery and Tree Production
to fluctuate, in recent years agriculture cash receipts
111422 Floriculture Production
have increased, from $555 million in 2010 to $718
Fishing & Hunting:
112511 Finfish Farming & Fish Hatcheries million in 2012. The total value of the agriculture and
112519 Other Aquaculture food sector production in 2012 was $816 million.
114210 Hunting & Trapping
Forestry Operations:
113310 Logging
Support Activities for Agriculture Production
115112 Soil Preparation, Planting, Cultivating
115113 Crop Harvesting
115210 Support Activities for Animal Prod.
115310 Support Activities for Forestry
115115 Farm Labor Contracting & Crew Leaders
115116 Farm Management Services
NEVADA DEPARTMENT OF AGRICULTURE 13Figure 10. Value of Agriculture Sector Production19 Milk cow and dairy production is becoming a
($1,000); 2007 – 2012: significant contributor to the Nevada food and
900,000 817,425 816,530 agriculture production sector. There were 29,000
800,000
660,426 dairy cows21 in Nevada in 2012. The primary revenue
700,000 648,064 670,085
578,503 source of dairy is milk production. Total milk
600,000 production in 2012 was 666 million pounds, and
500,000
almost of all (99%) was sold to plants for processing
400,000
300,000
or to dealers. Only 1% of milk production is consumed
200,000 on the farms. The value of cash receipts from
100,000 marketing was $125 million.
-
2007 2008 2009 2010 2011 2012 Figure 11. Value of milk production by Nevada
dairies (1,000 pounds), 2000-2012:
Source: Nevada Agriculture Statistics Bulletin, 2013
700,000 666,000
Another way Nevada agriculture and food production
sector contributes to the economy is through tax 600,000
revenues that the state collects from farms and 476,000
500,000
ranches. In 2012, Nevada farms and ranches paid $19
million in property taxes. That amount increased from 400,000
2010 when the amount of property taxes was $17 300,000
million.20
2000
2001
2002
2003
2004
2005
2006
2007
2008
2009
2010
2011
2012
Livestock production: Source: Nevada Agriculture Statistical Bulletin 2012
Livestock production represents the largest segment Dairy operations are becoming the fastest growing in
of agriculture in Nevada. The value of livestock Nevada with the cash receipts almost doubling in
production in 2012 was $420 million. 2012 ($125 million) compared to $52 million in 2000s.
Cow-calf operations are the most common
agriculture enterprise and can be found on over half
of the farms and ranches in the state. Nevada farms
were raising 470,000 cattle and calves in 2012. The
value of cattle and calves production in 2012 was
$212 million. Elko County has the largest inventory of
cattle and calves (140,000 head), followed by
Humboldt (65,000), Churchill (39,000), and Lyon
County (38,500). Cash receipts from cattle and calves
marketing in 2012 were $283 million.
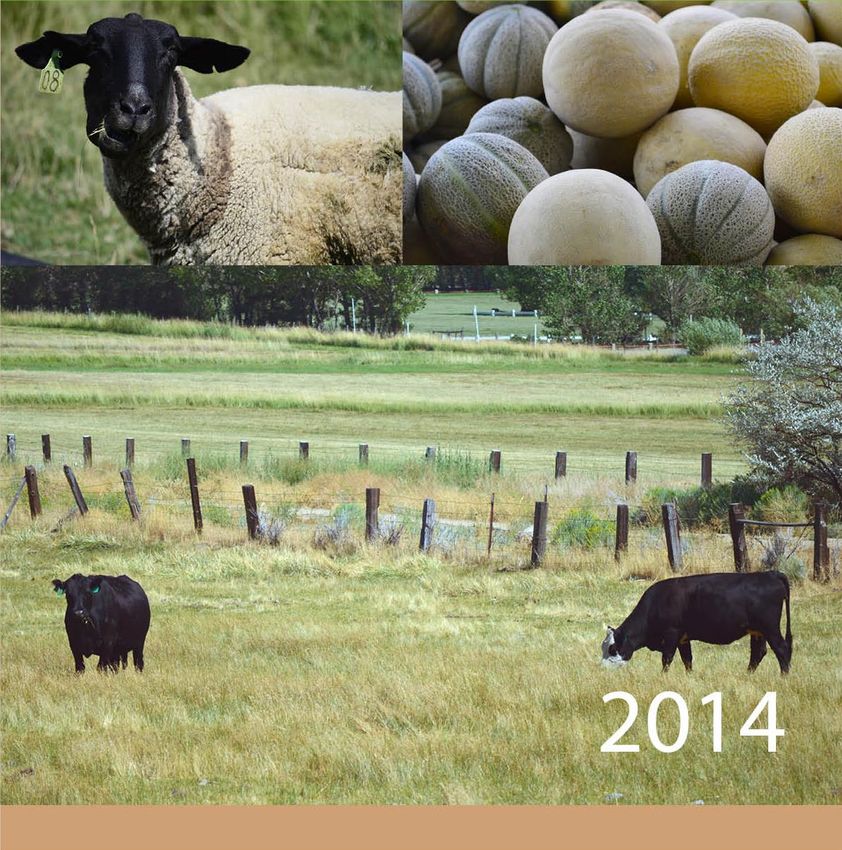
Sheep and lamb production numbers are
considerably lower, but remain the alternative on
many ranges. 2012 inventory shows 70,000 sheep
and lambs with a total inventory value of $17.9
million. The total value of sheep and lamb production
in 2010 was $2.6 million. Cash receipts from sheep
and lamb marketing in 2010 were 4.5 million.
19 20
Value of agricultural production is the gross value of the commodities and services Source: USDA/ERS Farm Income and Wealth Statistics
21
produced within a year. Average number during the year, excludes heifers not yet fresh.
NEVADA DEPARTMENT OF AGRICULTURE 14primarily to race horse accounts across the Western
United States.
There were 2,700 hogs and pigs produced on Nevada
farms with a total inventory value of $405,000 in A majority of Nevada’s grain acreage is harvested for
2012. The production value in 2012 was $990,000, hay rather than grain. Wheat, barley oats, rye, and
showing a slight increase from a year before, and cash triticale are commonly cut and baled for cattle feed.
receipts from marketing were $1.4 million. The total value of all other hay production was $50
million in 2012.
Export of livestock products to global markets is an
important activity within the Nevada agriculture Exports of crop products in 2012 to global markets
sector. Data for 2012 lists the total value of livestock outside the U.S. were around $13.6 million, wheat
exports outside of the U.S. in the amount of $ 23.8 exports were valued at $4.2 million, and grain product
million, the value of exported beef was $22.9 million exports at $9.4 million.23
and value of pork was $0.4 million.22
Vegetables, fruits, and nuts production:
Crop production: Fruit and vegetable production in Nevada is limited by
The total value of crop production in 2012 was $281 climate, but specific regions of Nevada have proven
million. The cash receipts from marketing crop favorable for fruit and vegetable crops like melons,
products were $287 million. The main crop potatoes, onions, and garlic.
commodity produced in Nevada is hay. Nevada’s
Nevada’s onions are primarily produced for fresh
climate and irrigable soil are conducive to the
market use, and Nevada garlic is used primarily for
production of high quality and specialty hays.
seed, although some is also dehydrated. Most of the
415,000 acres were harvested, and the total value of
acreage planted for these crops is in Lyon County.
hay production was $267 million (2012 data).
The value of onion production in 2011 was $71
Much of Nevada grown alfalfa is marketed to
million, and the value of garlic production for the
California dairymen, and significant quantities are
same year was $2.2 million. Along with onions and
shipped overseas. Production of alfalfa in 2012 was 1
garlic, potatoes are another important row crop in
million tons, and the total value of that production
Nevada. Warm days, cold nights, and quality soil
was $218 million.
provide excellent growing conditions for potatoes.
Table 9. Alfalfa Hay - Acreage Harvested and
Production, 2012:
Production
County Acres
(tons)
Humboldt 47,000 223,600
Lyon 33,000 154,700
Pershing 30,000 147,400
Lander 20,000 95,500
Other counties
110,000 410,730
combined
Total 240,000 1,032,000
Source: Nevada Agricultural Statistical Bulletin 2013
All other hay includes wild and improved grasses, The value of potato production was $15 million (2009
Timothy, Tiffany (Teff), Sudan, and grains. Grass hay data). The total value of vegetables and melons
is used to meet the winter feeding demands of production in Nevada in 2012 was $107 million.
resident livestock herds, and Timothy hay is marketed
22 23
Source: USDA Economic Research Service; USDA Foreign Agricultural Service (Global Source: USDA Economic Research Service; USDA Foreign Agricultural Service (Global
Agricultural Trade System). Agricultural Trade System).
NEVADA DEPARTMENT OF AGRICULTURE 15Figure 12. Values of production - potatoes, onions, Figure 13. Nursery, Greenhouse, Floriculture and
and garlic (2000 – 2010): Sod - market value of products sold 1997-2007:
$100,000
$20,000 $16
$80,000 milion
Value of products sold
$12
$15,000 $10
$60,000 million
million
($1,000)
$40,000 $10,000
$20,000
$5,000
$-
2001 2002 2003 2004 2005 2006 2007 2008 2009 2010 $-
Potatoes Onions Garlic 1997 2002 2007
Source: USDA, National Agricultural Statistic Service, 1997, 2002, 2007
Source: USDA, Nevada Agricultural Statistics, 2010-11
Greenhouses and nursery crops are considered high
Fruit and nut tree production represents a small part value crops, and they usually do not require
of total agriculture production in Nevada. In 2007, significant land. However, they do require a
there were 38 farms growing non citrus fruits, significant amount of water, fertilizers, and pesticides
covering 1,465 acres of land, and those farms were so their production could be considered fairly capital
mostly growing apple, grapes, peaches, and pears. intensive. Growth in urban areas of the state has
There were 12 farms involved in tree nut farming of provided a demand base for these crops. The
almonds, pecans, walnuts, pistachios, etc. The estimated market value of selected capital assets of
estimated value of capital assets, including land, green house, nursery, and floriculture production in
building, machinery, and equipment on these farms 2007 was $697,602, and the estimated market value
in 2007 was $ 445,508. The most recent numbers for of products sold in the same year was $12 million.
2012 show a total value of fruits and nuts production
was $1.1 million.24
Exports of fresh fruits and vegetables in 2012 to
global markets was $11.5 million; the value of fresh
fruit exported was smaller, at $0.3 million; and the
value of fresh vegetables exported outside the U.S.
was $11.2 million.
Greenhouse, Nursery, and Floriculture Production:
Greenhouse and nursery crops are sometimes an
overlooked category when it comes to traditional Growing food under cover or indoors is becoming a
agriculture production. These crops are typically popular method of crop production. According to
grown in greenhouses and nurseries, and they are information provided by the Governor’s Office of
grown mostly for residential and commercial Economic Development, every year, Nevada’s
landscaping, gardening, or indoor use. Based on the Tourism, Gaming, and Entertainment sector spends
latest Census of Agriculture data for 2007, there were $2 billion on the food supply chain outside the state.
a total of 41 establishments; two farms that were If locally grown food could satisfy a small fraction of
growing crops under cover (11141 NAICS) and 39 what the average Nevada visitor spends on food, with
production nurseries and floriculture establishments. development of indoor agriculture and food
production all year around, it would benefit Nevada’s
economy by keeping those dollars in state. 25
24 25
Source: Nevada Agricultural Statistics Bulletin 2013 “Commercial Indoor Agriculture,” Governor’s Office of Economic Development.
NEVADA DEPARTMENT OF AGRICULTURE 16Forestry Operations:
Forestry operations in Nevada represent a small In FY 2012, over 156,000 licensing privileges (licenses,
segment of agriculture and food production sector. In stamps) were sold resulting in more than $7 million in
2007, there were 1,320 woodland farms in Nevada revenue for the state. Also, 51,000 boats were
covering 36,327 acres of land. The amount of forest registered in Nevada, totaling to almost $2 million in
product sold in that same year was $20,000. revenue. The largest annual hunting draw, Nevada’s
big game draw, received over 159,000 applications
submitted for the 2012 big game season, and total
Wildlife Operations:
revenues for applications, tags, and other related fees
It is important to mention the value of agriculture that exceeded $5 million in FY 2012.26
is tied to wildlife and open space land operations. The
value can be measured by what locals and tourists are Agriculture and Food Commodity Exports:
willing to pay in order to visit areas that offer different
The agriculture sector is an important export-based
activities such as hunting, fishing, and boating on
sector that brings dollars back to the local economy.
public lands and waters.
A wide range of products and commodities produced
Although Nevada is widely known as a dry state, it is in Nevada are exported to international markets.
home to over 200 lakes and reservoirs and 600
streams and rivers, which provide nearly 400,000 Figure 14. Agriculture Commodity Export27 2000 –
surface acres of sport fishing opportunity. 2012:
The majority of Nevada's fishable still waters consist Total Export (Mill $)
200.0
of man-made reservoirs that vary in size from one 160.1 160.5
acre to the 115-mile-long Lake Mead. A good portion 150.0 132.4
of the pristine waters of Lake Tahoe are in Nevada. 121.1
91.9 110.3 111.6
87.4 96.0
Nevada's fish species vary as widely as the state’s 100.0 75.377.074.181.9
geography (Cutthroat Trout, Rainbow trout,
Largemouth bass, etc.). 50.0
Nevada big game species include mule deer, bighorn 0.0
sheep, elk, mountain goats, and pronghorn antelope.
Hunters may also choose to hunt certain migratory
birds and upland birds. Source: USDA Economic Research Service; USDA Foreign Agricultural Service (Global
Agricultural Trade System).
The Nevada Department of Wildlife (NDOW) is the
state agency responsible for the restoration and The value of the Nevada foreign export in 2012 was
management of fish and wildlife resources, and $160.5 million, the value of beef and veal exports was
promotion of boating safety. The agency and its $22.9 million, the total value of processed and fresh
subdivisions manages 17 urban ponds around the vegetables exported was $32.2 million, and the value
state. They also manage the hunting, fishing, and of dairy product exported to international market was
boating licensing and permitting privileges in state. A $17.3 million for the same year. $46.9 million was the
recent increase has been noticed in the number of total value of other products sold on the foreign
citizens participating in fishing and hunting. market, which includes other animal and poultry
products, other grains and oilseeds, wine, beer, other
beverages, coffee, chocolate, other horticulture
products, and prepared foods.
26 27
Source: “2012 Annual Report”, July1, 2011 – June 30, 2012; The Nevada Department Export values are calibrated such that the sum of state export estimates for a
of Wildlife commodity equals the total U.S. export value for the commodity.
NEVADA DEPARTMENT OF AGRICULTURE 17Figure 15. Value of Export by Commodity – Nevada Demographic characteristics indicate there were
2012: more male (81%) than female (19%) principal
operators in 2007. The most recent data for 2012 are
Livestock and showing increased number of principal operators
Other Livestock Products,
Products 22% (4,157) with 3,253 male and 904 female operators on
29% Nevada farms.
Planting Dairy products,
Seeds, 2% 11% Table 10. The characteristics of principal, second and
Feeds and third farm operators, 2007 (continued):
Fodders, Vegetable & Fruits Demographics: All Principal Second Third
7% (Fresh & Processed),
Wheat & Grain
20% >25 75 15 25 35
Products, 8%
25 - 34 288 119 131 38
Source: USDA Economic Research Service; USDA Foreign Agricultural Service (Global
Agricultural Trade System)
35 – 44 729 379 295 55
45 - 64 2,632 1,632 899 101
65 < 1,245 986 238 21
Agriculture and Food Production Workforce: Source: Census of Agriculture, Nevada 2007
There are roughly three main categories of workers In 1997 the average age of the principal operator was
on Nevada farms and ranches: 54.9, and in 2002 the average age had risen to 55.9,
Owner-operators (primary operators and and in 2007, the average age was 57.5. The average
part-time operators) age based on the most current data for 2012 is 59.7.
Employees (primary operators, part time The farm population used to be younger on average,
operators, and hired farm labor) than urban and other non-farm residents, but today
Contractors (skilled contractors and they are much older, on average. There is a relative
contracted labor)
shortage of people younger than 25 years on farms
In 2007, the latest Census of Agriculture data counted compared with those who are 45 to 69 years old.
a total of 4,969 farm operators28 and 9,811 household
Although farm operators and their families account
members on Nevada farms and ranches. More than
for most of agricultural employment, hired
half, or 2,480 of them, have farming and ranching as farmworkers are a vital resource. In 2012, there were
their primary occupation. 4,481 farm workers. The amount of hired labor used
There were 3,131 principal operators, and more than on farms is related to the size of farm operations and
the commodity that is produced. Larger farms will
half (52.7%) listed farming as their primary
more likely have labor needs in excess of the
occupation. The majority of principal operators in
capacities of the families who farm them. Some
Nevada have been working on their farms and commodities whose production has been largely
ranches for more than 10 years. mechanized (such as many grains), as well as livestock
Table 10. The characteristics of principal, second and operations, do not require large amounts of labor per
farm.
third farm operators, 2007:
Characteristics: All Principal Second Third However there are crops that require hand harvesting
(Operators) - such as many fresh fruits and vegetables, tree nuts,
Total Number: 4,969 3,131 1,588 250
and horticultural commodities – that continue to use
Sex of Operators:
Male 3,222 2,530 544 148
large amounts of hired labor. Because these
commodities are perishable, more labor is needed for
Female 1,747 601 1,044 102
Primary
short periods, mostly during the harvesting season.
Occupation:
An additional 1,624 jobs were employed in the
Farming 2,480 1,650 701 129
forestry, fishing, and supporting activities industry.29
Other 2,489 1,481 887 121
Source: Census of Agriculture, Nevada 2007
28 29
Data were collected for a maximum of 3 operators per farm Source: Bureau of Economic Analysis (BEA)
NEVADA DEPARTMENT OF AGRICULTURE 18You can also read