Are global value chains receding? The jury is still out. Key findings from the analysis of deflated world trade in parts and components - DIAL / IRD
←
→
Page content transcription
If your browser does not render page correctly, please read the page content below
DOCUMENT           DE TRAVAIL                                                       DT/2019-03

 Are global value chains receding?
        The jury is still out.
 Key findings from the analysis of
 deflated world trade in parts and
           components

Guillaume GAULIER
Aude SZTULMAN
Deniz ÜNAL

                                                UMR LEDa
 Place du Maréchal de Lattre de Tassigny 75775 • Paris •Tél. (33) 01 44 05 45 42 • Fax (33) 01 44 05 45 45
           • 4, rue d’Enghien • 75010 Paris • Tél. (33) 01 53 24 14 50 • Fax (33) 01 53 24 14 51
                               E-mail : dial@dial.prd.fr • Site : www.dial.ird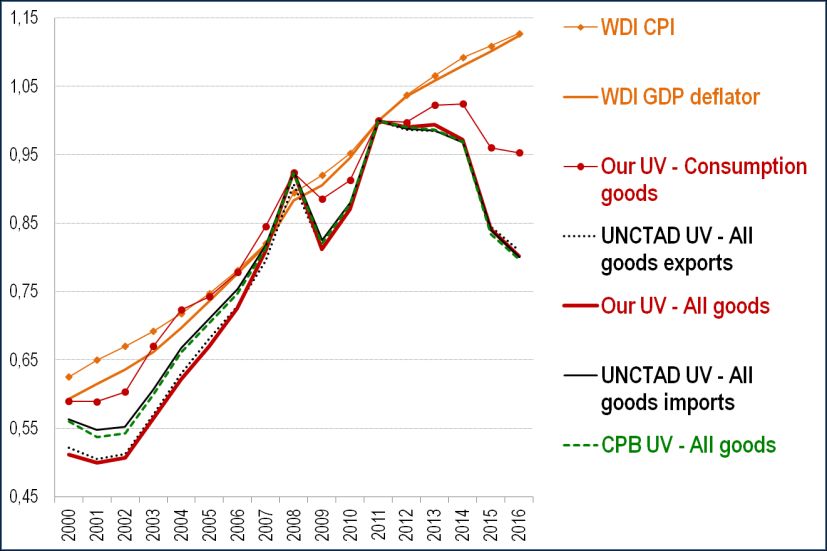
G. Gaulier, A. Sztulman, D. Ünal Are global value chains receding? The jury is still out.
Are global value chains receding? The jury is still out.
Key findings from the analysis of deflated world trade in parts and components
Guillaume Gaulier, Aude Sztulman, Deniz Ünal
Highlights
Over the period 2000-2016, the share of intermediate goods in world trade in nominal
terms is fairly well correlated to various Global Value Chain (GVC) indicators based
on international input-output matrices: a moderate expansion of international
fragmentation followed by a decline from 2011 onwards.
However, taking into account price effects (using an original deflator by production
stages based on very detailed and harmonised bilateral trade unit-values), our results
show a different evolution: the intermediate trade share in volume is growing at a
subdued rate between 2000 and 2016.
Focusing on the manufacture of Parts and Components (P&C), which corresponds to
activities more embedded in GVCs than other intermediate goods, that is, semi-
finished products, the same pattern emerges, namely a slight increase in the share of
P&C in manufacturing world trade in volume. Furthermore, after controlling for the
global business cycle, there is a modest but steady rise, with no sign of a downturn
after the Great Recession.
GVCs are particularly well-developed for electronics, the share of this sector in P&C
trade being the highest and remaining stable over the period. However, subsectors
exhibit contrasting development: P&C trade related to office machinery and
computers receded while trade in telecommunications equipment, the flagship IT
revolution industry, thrived.
Counts of clients or suppliers by stages of production indicate a higher and growing
geographical diversity for P&C.
Abstract
In this article, we examine the dynamics of Global Value Chains (GVCs) since the 2000s. Did
it show a marked expansion up to the Great Recession and did GVCs begin a downturn in
the 2010s? To better understand the evolution of GVCs at the world level, we use very
detailed trade data for 2000 to 2016, which distinguishes different production stages along
the GVC. In particular, among intermediate goods, we focus on Parts and Components
(P&C) rather than semi-finished products since the manufacture of P&C corresponds to
activities more embedded in GVCs. We control, also, for the global business cycle and price
effects using an original production stages deflator based on detailed bilateral trade unit-
values. This new GVC indicator shows moderate growth over the study period with no trend
reversal. In the electronics sector, where GVCs are particularly well-developed, we observe
contrasting effects: the share in P&C trade for office machinery and computers has
decreased, while it has increased in the case of telecommunications equipment, the flagship
IT revolution industry. Also, counts of clients or suppliers by stages of production indicate
higher and growing geographical diversity for P&C.
Keywords: Global value chains; Parts and Components – P&C; Trade in volume; Electronics
JEL codes: F14, F15, L60
1
G. Gaulier, A. Sztulman, D. Ünal        Are global value chains receding? The jury is still out.

Résumé

La forte expansion des chaînes de valeur mondiales (CVM) depuis les années 2000 a-t-elle
marqué le pas avec la Grande Récession pour laisser place à un déclin depuis 2011 ? Cette
étude propose une analyse de la dynamique des CVM au niveau mondial au cours de la
période 2000-2016 à partir du commerce en volume de pièces et composants. La correction
des effets prix par un déflateur basé sur des valeurs unitaires bilatérales harmonisées révèle
une croissance modérée des CVM depuis 2000. L‘indicateur de CVM proposé fluctue avec
l‘activité économique mondiale. Dans les P&C électroniques, la part des ordinateurs décline
au profit du matériel de télécommunication, branche emblématique des technologies de
l‘information et de la communication.

                                                                                              2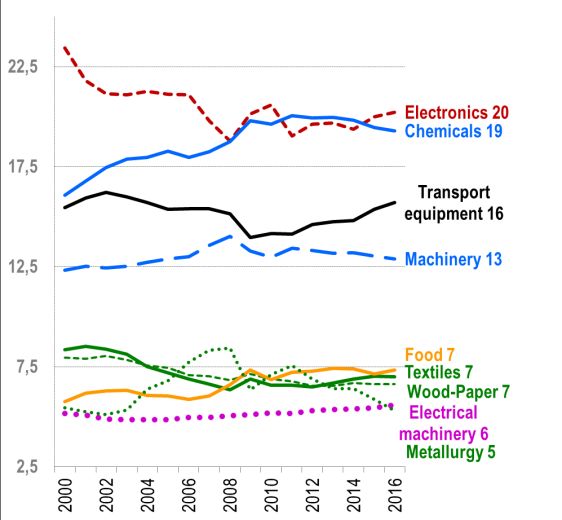
G. Gaulier, A. Sztulman, D. Ünal          Are global value chains receding? The jury is still out.

                             Are global value chains receding? The jury is still out.
    Key findings from the analysis of deflated world trade in parts and components

                                                Guillaume Gaulier, Aude Sztulman, Deniz Ünal*

      The same product is crafted or can be crafted in a certain way from one people, in a
      different way from a second people, in a yet different way from a third people and so
      on. It crosses five or six borders and is processed five or six times before it reaches the
      hands of a merchant who will sell it nearby or faraway, in his own city or in the other
      hemisphere. Here is muslin that was perhaps woven in Saxony with Manchester yarn
      obtained from a mixture of cottons harvested in Surate in India, in Mobile in the United
      States and in Egypt: it is embroidered in Nancy to be sold in Philadelphia or in Canton
      or in Batavia[Java] after having passed through a warehouse in New York or in Hon-
      Kong[sic] or in Singapore.

      M. Chevalier, exposition universelle de Londres en 1851 (p. 498) quoted from Todd D.
      (2017), « 1860 L’autre pays du libre-échange », in L'Histoire mondiale de la France,
      directed by P. Boucheron, éditions du Seuil, p. 497-501.1

As Michel Chevalier‘s statement shows, the world-wide organisation of production is well
established. However, although not a new phenomenon, international production sharing has
increased since the 1980s. The 1990s and early 2000s are often considered periods of
unprecedented development of Global Value Chains (GVCs) and the expansion of GVCs has
contributed to the boom in world trade. The crucial role of GVCs in the globalization process
is reflected in the growing academic attention afforded to them.2 Richard Baldwin (2016,
pp.5-6) underlines that:

*
 Guillaume Gaulier is an economist at the Banque de France, Associate Professor at the Université
Paris 1 Panthéon-Sorbonne and research associate at CEPII (Guillaume.GAULIER@banque-
france.fr), Aude Sztulman is Associate Professor at DIAL, LEDa, IRD, Université Paris-Dauphine,
Université PSL, (aude.sztulman@dauphine.psl.eu), Deniz Ünal is an economist at CEPII
(deniz.unal@cepii.fr), editor-in-chief of Panorama du CEPII and coordinator of the CEPII Country
Profiles            . This work is also published as a CEPII Working Paper.
We thank Guillaume Daudin, Lionel Fontagné, Sébastien Jean, Pierre Sicsic, Vincent Vicard and
participants in Banque de France (25 June, 2018) and CEPII (12 July, 2018) seminars for helpful
comments. We are grateful, also, to Michele Mancini and Marcel Timmer for making their data
available to us.
The views expressed in this paper are those of the authors and do not represent those of the Banque
de France or the Eurosystem. The usual disclaimers apply.
1
  Our translation.
2
  A World Trade Report (WTO, 2014) indicates that a Google Scholar search on the phrase ―global
value chains‖ reveals dramatic growth in the scholarly literature between 1980 and 2013. Appendix 1
Figure A.1 shows the results of the same Google Scholar search for the period 1980-2017 and reveals
a similar academic interest in the issue.

                                                                                                 3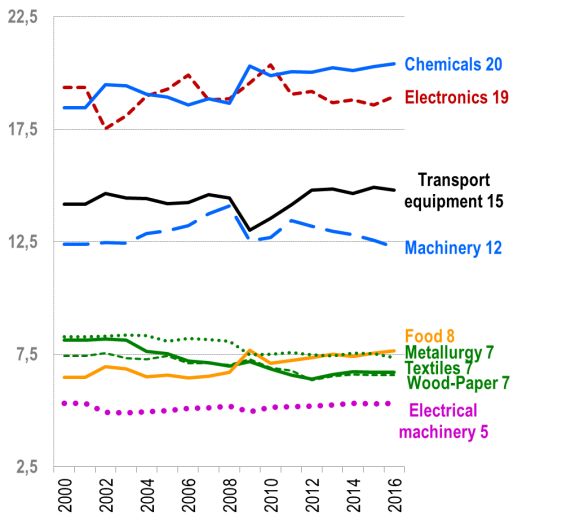
G. Gaulier, A. Sztulman, D. Ünal              Are global value chains receding? The jury is still out.

          Globalization accelerated again from around 1990, when the ICT revolution radically
          lowered the cost of moving ideas. This launched globalization‘s next phase— call it
          the ―second unbundling‖ since it involves the international separation of factories. […]
          As a consequence, the second unbundling— sometimes called the ―global value
          chain revolution‖— redrew the international boundaries of knowledge. The contours of
          industrial competitiveness are now increasingly defined by the outlines of international
          production networks rather than the boundaries of nations.

However, questions are being raised about the possibility of a slowdown in the international
production fragmentation process and its effect on global trade growth during the 2011-2016
period.3

Several empirical studies have tried to identify the main factors underlying world trade growth
evolutions, the rise in world trade during the 1990s and 2000s, and its recent slowdown.4
Among the many determinants identified, are cyclical and structural factors, and the
international fragmentation of production in GVCs is considered to have played a key role in
world trade dynamics since the 1990s.5 In relation to the recent trade slowdown, the
repositioning of the Chinese economy in its domestic market6 and declining GVC
participation7 are regarded as important contributors.8 However, there are several other
drivers including a weak economic environment with low levels of investment and scant final
demand in the wake of the Great Recession and the ensuing euro area crisis,9 deceleration
of the trade liberalization process and increased non-tariff protection measures, smaller
transportation cost reductions and higher relative demand for non-tradable goods, limited
trade finance, and so on.

We are especially interested, in this article, in the dynamics of GVCs since 2000. Did they
exhibit a marked expansion up to the time of the Great Recession and are GVCs
experiencing a downturn in the 2010s? To better understand the evolution of GVCs at the
world level, we use disaggregated trade data, which distinguish different production stages
along the global value chain, in particular Parts and Components (P&C) and semi-finished
products. Furthermore, we take account of price effects through the construction of an
original production stages deflator (based on disaggregated bilateral trade unit-values). To
better grasp GVC dynamics, global business cycles are controlled for and the evolution of
GVCs is examined at the sectoral level. We then adopt a different standpoint by using data

3
  The period analysed in this paper is 2000-2016. The slowdown in world trade growth occurred
between 2011 and 2016. After the Great Recession, world trade growth did not return to its pre-crisis
level. The latest statistics show a slight increase of 2.5% in 2016 (and a strong rebound of 5.2% in
2017). Projections for 2018 and 2019 are 4.2% and 4% compared to a growth rate of 3.7% for world
output for these years (IMF, 2018).
4
  Concerning the global trade slowdown and its determinants, see, e.g., the research contributions in
the ebook edited by Hoekman (2015).
5
    See Johnson and Noguera (2012, 2017), Haugh et al. (2016) and Timmer et al. (2016).
6
    See Lemoine and Ünal (2017), Gaulier et al. (2016), Gaulier et al. (2015).
7   See Crozet et al. (2015).
8
  Before the Great Recession, China was central to the expansion of GVCs, as companies
(particularly foreign owned) demanded large quantities of inputs (P&C – parts and components, etc)
destined for the production of many consumer goods for export.
9
  See, e.g., IMF (2016, Ch. 2) and Boz et al. (2015), on the role of investment decline and import
intensity in capital goods and Ollivaud and Schwellnus (2015) on the role of weaker demand in the
euro area.

                                                                                                    4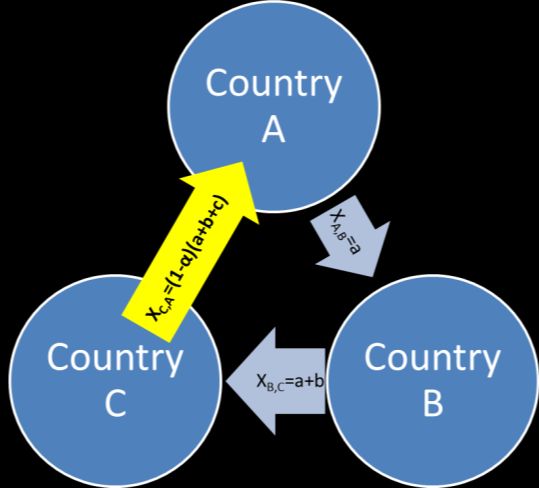
G. Gaulier, A. Sztulman, D. Ünal               Are global value chains receding? The jury is still out.

on number of clients by exporter, and number of suppliers by importer (by country and
product) to provide a set of quantitative information on the geographical diversity along
GVCs, that is, on the extensive margins.

We show that the share of intermediate goods in world trade, in nominal terms, is fairly well
correlated to various GVC indicators, based on International Input-Output (IIO) matrices. A
moderate rise in the 2000s is followed by a trend reversal after 2011. Intermediate trade
shares - computed on gross trade flows only - are much less data demanding, provide
information for a longer time span and can be readily updated, while IIO based measures,
inter alia, require country level data on value added flows and are published irregularly.
Another advantage of using this world level GVC indicator is the relative ease of obtaining
volume calculations. When accounting for price effects, the intermediate trade share shows a
different evolution: it is growing at a low rate between 2000 and 2016. Similarly, focusing on
the manufacture of P&C, which includes industries typical of the ―second unbundling
(Baldwin, 2016), and corresponds to activities embedded more deeply in GVCs compared to
semi-finished products, we observe a slight increase of the P&C‘s share in manufacturing
world trade in volume. Further, if we control for the global business cycle, we find a modest
rise and no sign of a downturn after the 2008-09 global crisis. Also, these GVC evolutions
are not the result of a sectoral composition effect and, according to our indicator, there is no
indication of a recent GVC decline for the main branch groups. Finally, counts of clients or
suppliers by production stages also indicate higher and growing geographical diversity for
P&C.

1.     GVCs: concepts and measurement issues

Both theoretical and empirical studies show that the international segmentation of production
processes is a major underlying factor in the trade flows between countries. Production steps
have become fragmented internationally, as firms located in different countries take part in
the production of a good (or a service), in different stages of the value-added chain (Baldwin,
2016). Countries specialize in the supply of specific tasks rather than production of the entire
final good and it is this vertical division of labour that is at the origin of countries‘ comparative
advantage at different stages of the production process leading to a ―trade in tasks‖
(Grossman and Rossi-Hansberg, 2008).

Therefore, a GVC involves combining domestic and imported inputs into the production
processes to manufacture goods and services that are exported for another stage of
production or incorporated into the final good, which is sold domestically10 or exported. GVC
expansion can be the result of various factors. The international segmentation of production
occurs in sectors where the production process can be broken down into technologically
separate and independent operations, providing intermediate inputs to be assembled into the
final product (Lassudrie-Duchêne, 1985). Technological progress can, but may not
necessarily, contribute to the evolution of GVCs. Following Bloom et al. (2009), Baldwin
(2016) distinguishes the effects of coordination11 and information technologies. While the
former favours the international fragmentation of production, the latter – for example,
automation - could enable more onshoring.12 Moreover, trade corresponding to an
international segmentation of production process is enhanced by the lowering of transport

10 Depending upon how a GVC is defined, the import of intermediate goods to produce a final good
that is consumed domestically is included or not. See below.
11
     Coordination technologies are technologies that facilitate any form of transmission.
12
    ―Better CT (coordination technologies) favor fractionalization by making it cheaper; better IT
(information technologies) discourages fractionalization by making it less necessary‖ (Baldwin, 2016,
pp. 200-201).

                                                                                                     5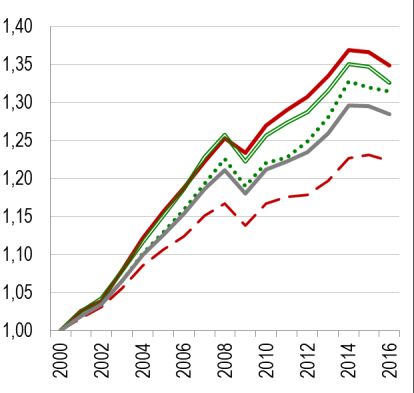
G. Gaulier, A. Sztulman, D. Ünal            Are global value chains receding? The jury is still out.

and communication costs. Multinational firm strategies inevitably play a key role as
companies decide to develop sourcing policies relying on foreign and sometimes distant
suppliers. Offshoring – either through in-house sourcing (within a multinational firm) or
outsourcing (to independent contractors) – has increased imports of intermediate inputs and,
as a result, the development of GVCs is at the heart of massive (intra- and inter-firm) trade
flows of intermediate goods (and services), in particular of P&C (Fontagné, 1991).

GVCs are an international network of the stages of production and capturing their evolutions
statistically raises several problems since it requires the tracking of value added through
supply and use linkages, both between sectors and across borders. Most studies of ―vertical
specialization‖ (Hummels et al., 2001) draw on global input-output matrices, which are
difficult to obtain and are published only for limited and recent periods. This limits the
                                            13
availability of up-to-date tables over time. Moreover, as Johnson (2017) points out, the
construction of such matrices relies on numerous methodological assumptions: for example,
in some studies, production destined for different foreign markets or the domestic market of a
given industry, is assumed to contain the same proportion of foreign input from various
industries.14 This assumption does not hold in the case, for example, of China‘s processing
and ordinary trade flows (Lemoine and Ünal, 2017).

Another and much simpler way to study the international fragmentation of production at the
world level is to examine the evolution of the share of intermediate goods in global trade. As
explained above, a consequence of the international segmentation of production processes
is a growing share of intermediate products in world trade, in particular P&C. Trade flow
statistics by production stages, are relatively easy to compute since the data are directly
available with few constraints on their temporal, sectoral or geographical dimensions.

Admittedly, trade in intermediate goods does not correspond absolutely to all cross border
production-sharing activities included in GVCs and is not fully integrated in GVCs. For
example, at country level, GVC participation indexes usually include both the export‘s foreign
value added as a share of the country‘s gross exports, and the domestic content in the
country‘s exports that then is exported by its trading partners (i.e., backward and forward
engagement in GVCs). According to this definition, not all intermediate goods trade flows are
embedded in GVCs and, especially, those used for the production of a good destined for the

13
   The joint OECD–WTO Trade in Value-Added (TiVA) database provides indicators for the years
1995 to 2015 with successive editions based on different Systems of National Accounts and industrial
classifications (latest edition 2018) while the World Input-Output Database (WIOD) covers the period
2000-2014 (published in 2016).
14
   More precisely, Johnson (2017, p. 19) discusses two types of problems in the construction of global
input-output tables: ―One problem is that the ‗use table‘ in the input-output accounts – which tracks
how commodities are used as inputs by individual industries – does not distinguish between patterns
of input use for domestically produced versus imported goods/services. This implies that one must use
assumptions (or data imputation techniques) to decompose input use across sources. Most
commonly, imported input use tables are constructed using ―proportionality‖ (alternatively, ―import
comparability‖) assumptions, under which imported inputs are allocated across sectors in the same
proportion as domestic goods. Further, the proportionality assumption is naturally applied to total
imports, so inputs from all bilateral trade partners are treated in the same way. In plain language, the
input-output segment of the national accounts do not directly tell us how much imported steel is used
in US car production, nor whether imported steel from Canada versus Japan are used in the same
way. A second problem is that imported inputs are assumed to be used with equal intensity in industry-
level production for domestic and export markets. When imported input intensity differs across firms
within an industry, then using the average input intensity reported in input-output tables to represent
production techniques may lead to large biases in measurement of the value added content of trade
and other GVC metrics‖.

                                                                                                      6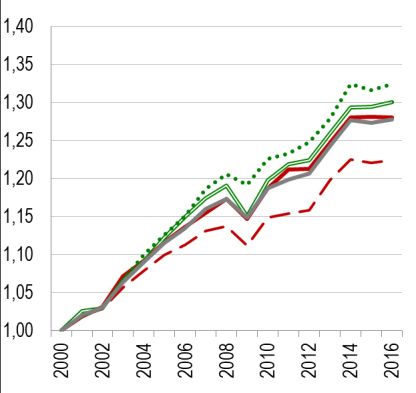
G. Gaulier, A. Sztulman, D. Ünal            Are global value chains receding? The jury is still out.

domestic market.15 Furthermore, some GVC production stages, such as final assembly
activities, are not included in intermediate goods trade.

To measure country level GVC participation or bilateral offshoring,16 the availability of IIO
tables is a positive development since it provides information on the origins of all value
added flows imported by a given country. Johnson (2017, p. 6) highlights that IlO matrices
allow both the possibility of some domestic content in imported inputs and the ―multilateral
nature of GVCs‖: bilateral foreign content can indeed ―travel indirect routes (via third
countries) from its source to where it is ultimately used in production‖. However, at the global
level, knowledge about all value-added trade flows between countries is not required and the
share of intermediate goods in world trade is a valid proxy for GVC dynamics.17

The differences between an IIO based measure of GVCs and the share of intermediate
goods in world trade are depicted in the simplified example of a three-country ―global‖ value
chain (see Figure 1).

                                          Figure 1
                         Three country “global” value chain example

15
   WTO (2014, p. 80) states that inter-country input-output indicators often make ―the assumption that
the production network is composed of at least three different stages or steps performed sequentially
in different countries‖. The import of intermediate goods to produce a final good that is consumed
domestically or ―direct absorption‖ is excluded by Borin and Mancini (2017), e.g., in their GVC
participation index: for these authors a GVC corresponds to at least two international shipments.
16
   To illustrate the measurement difficulties related to bilateral offshoring, Johnson (2017, p. 6) takes
the example of Mexico and the US: ―consider trying to measure Mexican content in US-produced cars,
and suppose that the US uses imported engines from Mexico. […] First, the US might export inputs
(e.g., spark plugs) to Mexico that are embodied in Mexican engines. Second, Mexican engines might
include value-added content from third countries (e.g., steel from China). These higher-order input
linkages would lead the conventional import share measure to overstate how much Mexican value
added is embodied in US cars‖.
17
   Nevertheless, even at country level, intermediate goods trade data capture a high share of a
country‘s GVC activities. E.g., according to an OECD (2013) report, for most economies, on average,
around one-third of intermediate imports end up in exports. Of course, the differences are large
between both industries and countries and are linked to the size of the country. In Hungary, nearly
two-thirds of all intermediate imports are exported compared to 22% in Japan and 17% in the US. In
the electronics sectors in China, South Korea and Mexico, three-quarters of intermediate imports are
exported and in Hungary the figure is 85% (OECD, 2013).

                                                                                                       7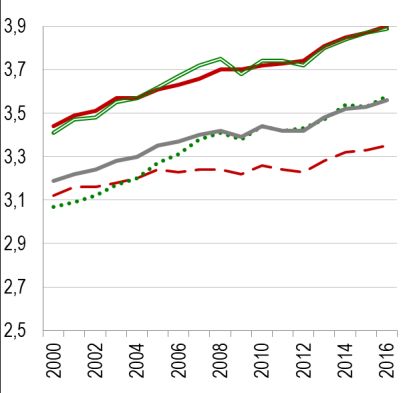
G. Gaulier, A. Sztulman, D. Ünal             Are global value chains receding? The jury is still out.

In our schematic GVC, Country A exports to Country B an intermediate good with a value
added a, and Country B re-exports this intermediate good to Country C, adding a value
added b. Country C then incorporates the imported inputs in a final good after adding a value
added c; a share α of the gross output of the final good is consumed domestically while a
share (1-α) is exported to Country A.18

In this schematic GVC, world trade (WT), intermediate goods world trade (IGWT) and world
trade in value added (VAWT) correspond respectively to:

WT = XA,B+ XB,C +XC,A = a(3- α)+b(2-α)+c(1- α)

IGWT = XA,B+ XB,C = 2a+b

VAWT = a+b+c(1-α)

A frequently used IIO-based measure of GVCs (Johnson and Noguera, 2017) is the ratio of
                                                 19
gross to value added world exports, i.e. WT/VAWT.

To compute this indicator requires knowledge of a, b and c which is not directly observable
for all countries and products and, therefore, poses a number of measurement difficulties at
the world level, especially for GVCs that involve many countries (see above).

Hence, here, we consider the more easily measured proxy of the share of intermediate
goods in world trade:

Such a GVC indicator (computed only from gross trade flows at world level) is directly
observed and, thus, requires no information on the value added flows, a, b and c.20 This
measure is both easy to compute and interpret and allows GVCs to be tracked at the global
level in a simple and transparent manner.

2.   GVCs inter-country input output indicators and intermediate goods trade share

Studies using IIO-based measures show that GVCs expanded in the 2000s before either
plateauing or decreasing in more recent years (Aslam et al., 2017; Timmer et al., 2016;

18
   The share (1-α) could have been exported to Country B; in the interests of keeping the figure simple
and since it does not change our indicator values because at the global level we only consider the
total sum, we do not consider this possibility here. Furthermore, again for simplicity, Country B does
not use a share of XB,C domestically. Finally, it would have been possible to add values for trade flows
not embedded in GVCs.
19
   Timmer et al. (2016) point out that this indicator of production fragmentation tracks forward as
opposed to backward linkages. In our view, this distinction is relevant mainly at the country or bilateral
level.
20 Here, a rise in the share α of imported inputs that are not re-exported has a positive impact on
        . Conversely, it has a negative impact on           . It is questionable whether this share of
imported inputs used for the production of a good sold domestically should have an influence on an
indicator measuring GVCs intensity at the world level, and which direction is appropriate.

                                                                                                        8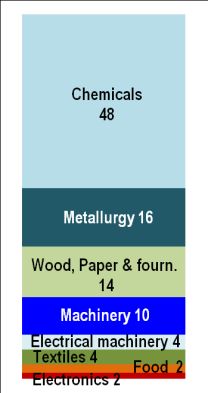
G. Gaulier, A. Sztulman, D. Ünal              Are global value chains receding? The jury is still out.

Haugh et al., 2016, Los et al., 2015). For instance, Timmer and co-authors (2016, p. 30)
created an indicator of the Global Import Intensity (GII) of production which ―measures the
imports needed in any stage of production‖. This indicator is based on world input-output
tables from the World Input-Output Database (WIOD) for 836 final goods21 over the period
2000-2014. To better identify GVC dynamics, the authors regress GIIs on a set of annual
dummy variables and country-industry pair dummies.

Figure 2.A shows the shift in the pattern of international production networks, with a period of
expansion of the international fragmentation process after 2002 followed by a relative decline
from 2011. Borin and Mancini (2015, 2017) use a different type of inter-country input-output
indicator, but find a similar GVC evolution. Their index of GVC participation measures
―production processes that require at least two international shipments of goods (including
both intermediate inputs and final products)‖ (Borin and Mancini, 2017, p. 23);22 in addition, it
is adjusted to take account of changes to the composition of demand.23 Again, we see GVCs
expanding during the 2000s and declining from 2011 (see Figure 2.B). Interestingly, as
recent European Central Bank (ECB), OECD and World Trade Organization (WTO)
research24 claims, evolution of the trade in intermediate goods and GVCs at the global level
appears to be similar: Figure 2.B shows that the share of GVCs in total trade (as measured
by Borin and Mancini, 2017), and the share of intermediate trade in nominal terms, are
strongly correlated and point to initially increased GVC intensity followed by a fall after 2011.
Over the period, and at world level, intermediate trade shares seem to carry the same
information on GVCs as IIO based GVC measures.

Intermediate trade shares as opposed to IIO based GVC measures could be an alternative
for analysis of GVC dynamics at world level.

However, such a measure of GVCs has some limitations. In certain cases, as Hummels et al.
(2001) point out, the product classification used to distinguish production stages - namely the
United Nations Broad Economic Categories (BEC) – can be misleading: for example, a car
embedded in a GVC (i.e., for reexport after some transformation) may be classified as a
consumption good; conversely, a tyre, classified as an intermediate good, can be sold
directly to a consumer. However, since the BEC provide a highly disaggregated
classification, this categorisation problem should be limited in our case: misclassifications are
likely to cancel each other out when the totality of world trade flows is considered. Moreover,
this problem is not specific to the share of intermediate goods in world trade since the BEC
are used, also, to construct data on value-added flows (e.g., WIOD). Another limitation of
intermediate trade shares is the exclusive coverage of GVCs in goods rather than services
production (although services incorporated in manufactured goods are included).25

21
     836 GVCs corresponding to 19 manufacturing industries for 44 final destination countries.
22
   ―The measure is estimated using bilateral trade data based on the World Input-Output Database
(WIOD). It excludes the fraction of domestic value added that is exported only once and directly
absorbed by the destination country. The remaining part of exports is considered part of global value
chains processes and is divided by total trade of a country or region to obtain the GVC participation
index. The index is adjusted for commodity price effects by setting to zero valued added in energy
sectors.‖ (IRC Trade Task Force, 2016, p. 25).
23
  Borin and Mancini (2017, p. 25) adjust their indicators of GVC-related trade ―by ‗neutralizing‘ the
changes in demand composition and using constant prices input-output tables available in the WIOD
database‖. See fn. 27 for a detailed description of their procedure.
24
     IRC Trade Task Force (2016), Haugh et al. (2016) and WTO (2014).
25Therefore, it is better adapted to the ―second unbundling‖ rather than the ongoing ―third unbundling‖
taking place through remote services (Baldwin, 2016).

                                                                                                     9
G. Gaulier, A. Sztulman, D. Ünal Are global value chains receding? The jury is still out.
Figure 2
Measuring GVCs evolutions
Inter country input output indicators and intermediate goods trade share
A. Trend in international fragmentation of goods production
Global import intensity
Notes: Global Import Intensities (GII) regressions of GVCs
on dummies for final country-industry and years. The figure
presents estimated coefficients and 95% confidence
intervals for the year dummies, relative to 2000. The
observations (11,889) are weighted by final output
excluding trade in products from the mining industry (WIOD
Sector 4) and petroleum refining (WIOD sector 10).
Source: data from Timmer et al. (2016) provided by Marcel
Timmer.
B. GVC share of total trade and
share of intermediate goods in total goods imports (%)
Notes: The GVC participation index is explained in the text.
Both measures exclude energy-related trade. GVC
participation is rebased to be equal to the intermediate
trade share in 2000 and its evolution is calculated based on
its 2000-2014 growth index.
Source: data from Borin and Mancini (2017) provided by the
publication‘s authors.
Overall, the share of intermediate goods in global trade in nominal terms is fairly well
correlated to various GVC indicators based on IIO matrices. It is much less data demanding
and provides information for both recent years and a longer time span, unlike the irregularly
published IIO based measures. This world level GVC indicator can also be updated regularly.
As shown below, another advantage of this measure is the relative ease of obtaining
deflators at the detailed product level and, therefore, volume calculations.
10G. Gaulier, A. Sztulman, D. Ünal Are global value chains receding? The jury is still out.
3. Mapping GVCs through intermediate goods trade shares: parts and components
versus semi-finished products
In this study, we use detailed trade flows and trade unit values drawn from the World Trade
Flows Characterization (WTFC) dataset.26 This CEPII dataset provides harmonised unit
values, categorisation by type of trade (one- and two-way trade) and price-quality ranges of
bilateral trade flows for more than 230 countries and 5,000 products (HS6) over the period
2000-2016. It is constructed from two other CEPII databases, TUV (Trade Unit Values) and
BACI (Base Analytique du Commerce International).27 As Emlinger and Piton (2014)
suggest, WFTC data have two main advantages: improving data quality and increasing data
availability. The TUV dataset offers indeed more reliable and consistent unit values than the
UN COMTRADE database. Furthermore, WTFC is a harmonised version of TUV and the
harmonisation procedure increases the quality and the number of unit values (see
Appendix 2 for more details).
Our study distinguishes different production stages along the GVC. Production stages are
classified according to their use. Upstream of the production process are primary goods used
either directly or after processing. Intermediate goods act as inputs to the production process
and correspond to any manufactured goods that are reintroduced into the production cycle
and disappear (are transformed) during that cycle. Semi-finished products are subjected to
further processing while P&C - already ‗finished‘ products - are intended for assembly.
Downstream of the value chain are capital and consumer goods, which are for final use
respectively by producers and consumers. For our analysis, we consider only the
manufacturing sector excluding production of coke, refined petroleum products and nuclear
fuel.28
Using detailed trade data for the period 2000-2016 from CEPII‘s WFTC database, we
compute trade shares by production stages,29 with the aim, in particular, to distinguish semi-
finished products from P&C within intermediate goods. Separate analysis of these two stages
among intermediate products might provide additional insights into GVC dynamics since the
manufacture of P&C (which includes electronics, automotive industry, etc.) corresponds to
activities more deeply embedded in GVCs than semi-finished goods production (which
includes chemicals, basic metals, etc.). Yeats (1998), for example, using the trade share of
P&C, shows that global production sharing increased over the 1978-1995 period. Following
30
Baldwin (2016), we go a step further and consider the phenomenon of two-way trade as
indicative of production fragmentation. In Figure 3 high levels of two-way trade flows for
26
The Appendix 2 provides a detailed description of the WFTC dataset.
27
Detailed presentations of TUV and BACI are set out respectively in Berthou and Emlinger (2011)
and Gaulier and Zignago (2010).
28
Manufacturing sector groups ISIC 2 digit branches from 15 to 36 (except 23 - coke, refined
petroleum and nuclear products) and excluding commodities and not elsewhere specified products.
29
See Appendix 3 for the classification by stages of production, branch groups and branches as well
as a breakdown of world trade in all products (2000-2016 average, % total).
30
Following CEPII‘s methodology (Emlinger et al., 2016; Fontagné and Freudenberg, 1997), trade at
the country-partner-product-year level is considered two-way or intra-industry if the value of the
minority flow (the smallest value between the export and import flows) represents at least 10% of the
( )
majority flow: ith and corresponding respectively to exports and imports in
( )
value from country i to country j for a product k (6-digit level of the Harmonized System classification).
If the ratio is below this 10% threshold, the flow is considered to be one-way.
11G. Gaulier, A. Sztulman, D. Ünal Are global value chains receding? The jury is still out.
intermediate products, especially for P&C31, relative to final goods, indicate the international
segmentation of production.
Figure 3
Intermediate goods and two-way trade,
2000-2016 average, manufacturing trade in value
A. Share of two-way trade B. Two-way trade C. Two-way trade in D. Two-way trade in
(in % of production stage) breakdown semi-finished goods parts & components
by production stages breakdown by industry breakdown by industry
(%) groups (%) groups (%)
Notes: Intermediate goods include semi-finished products and P&C. One-way and two-way trade are calculated according to the
CEPII‘s methodology (Emlinger et al., 2016; Fontagné and Freudenberg, 1997). Production stages are classified according to
BEC classification.
Source: Authors‘ calculations from CEPII‘s WTFC database.
On average, in the 2000-2016 period, P&C recorded the highest share (61%) of two-way
trade; semi-finished goods achieved 34%, lower than the share of capital and consumption
goods. The share of P&C in total two-way trade was 32%, compared to 25% for semi-
finished goods. Among industry groups, two-way trade in P&C occurs mainly in electronics,
transport equipment (automotive sector) and machinery. These industries are the sectors
typical of the ―second unbundling‖ (Baldwin, 2016). In the case of semi-finished products,
most two-way trade flows are related to chemicals (48%). Thus, to study GVC dynamics
requires account to be taken of P&Cs. Since GVCs (and two way trade) tend to be organised
on a regional basis (Fontagné and Santoni, 2018), Appendix 4 provides a regional
breakdown of P&C trade32 and highlights the central role of ―Factory Asia‖ in the expansion of
GVCs.
The results of our calculations of intermediate trade shares in manufacturing, based on
detailed trade data for the period 2000-2016, are the same as those derived from IIO based
measures; a moderate rise in the 2000s then a trend reversal since 2011 (see Figure 4.A).
Note that growth between 2002 and 2011 (excluding the recession years 2009 and 2010)
33
was limited and reached only 2.3%. A breakdown of traded goods by production stages
shows that trends depend strongly on the type of products considered (see Figure 4.B).
Changes in the share of intermediate trade are due mainly to semi-finished products with the
share of P&C remaining stable or declining slightly since 2000.
31
P&C are more differentiated horizontally and vertically than semi-finished products.
32 However, Los et al. (2015) point out that regional fragmentation has increased less than global
fragmentation.
33
This 4.5% rise (equivalent to 52.9/50.6 – 1) is of a similar magnitude to the level in Timmer et al.
(2016) (5%) using their GVC indicator (see Figure 2.A).
12G. Gaulier, A. Sztulman, D. Ünal Are global value chains receding? The jury is still out.
Figure 4
Share of intermediate goods in world trade for manufacturing
(at current prices, in %)
A. Total intermediate goods
(semi-finished + P&C)
B. Manufacturing world trade breakdown
by production stages
Note: See Appendix 5 for the share of production stages in total
world trade at current prices.
Source: Authors‘ calculations from CEPII‘s WTFC database.
This result might be surprising since P&C and more deeply embedded in GVC production
activities than semi-finished products. It is possible that use of trade data at current prices
provides misleading results. The evolution observed is due, in part, to price effects, which
can have a much stronger impact on semi-finished product trade shares compared to P&C.
4. Controlling for price effects: trade flow volumes
The findings for GVCs – derived from intermediate trade shares and IIO based measures –
could depend on the price treatment. However, gross trade and value added trade flows are
not normally deflated. Taking account of price effects is important since the production of
intermediate goods can involve a large share of commodities (especially oil) and, therefore,
can be affected by variations in energy prices. For instance, as a result of composition
effects, goods, such as semi-finished products, which undergo fewer transformations, may
be more strongly affected by commodity price developments than P&C, which represent a
13G. Gaulier, A. Sztulman, D. Ünal Are global value chains receding? The jury is still out.
more downstream stage of production. Excluding the energy sector to control for such effects
34
is not sufficient to remove the impact of commodity prices. Also, GVC expansion based on
increased competition between production sites, exerts a downward pressure on prices that
needs to be controlled for.35
To our knowledge, few empirical studies of GVC developments try to control for price
movements or used deflated series (exceptions include Haugh et al., 2016; Borin and
Mancini, 2017). To take account of price effects at the detailed international trade data level,
we compute the deflators by production stages using bilateral trade unit-values (based on
bilateral trade flows for around 5,000 products). Appendix 6 provides a comprehensive
description of our methodology and the development of our trade unit value index by
production stages. Unit values to measure prices might be considered questionable,36 but, as
Redding and Weinstein (2017, pp. 22-23) emphasize:
… the coverage of sectors is much wider than in datasets that directly survey prices.
As a result, many authors—including those working for statistical agencies—advocate
for greater use of unit value data in the construction of import price indexes.
Furthermore, existing research comparing aggregate import price indexes constructed
using unit values and directly surveyed prices finds only small differences between
them.
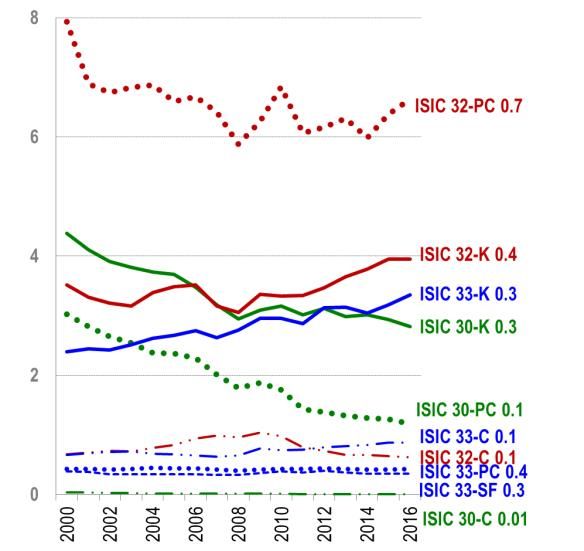
If we compare our deflator to similar indicators, we observe a fairly good match (see
Appendix 6).
A large part of the 2002-2011 intermediate goods share increase in world trade at current
values is linked to price effects. Indeed, calculated with deflated flows, this share remains
fairly stable throughout the period (excluding 2009 and 2010) and shows no signs of a
reversing trend in the more recent years (see Figure 5).
34
See, e.g., IRC Trade Task Force (2016). As explained above, for this reason, in the manufacturing
sector, we exclude branch 23 (in the ISIC Rev.3 classification) which corresponds to coke, refined
petroleum products and nuclear fuel.
35In Section 6 we show that P&C trade involves a greater diversity of clients and suppliers than other
stages of production, and that the gap increases over time.
36
Unit values can be subject of measurement error. However, at the world level, measurement errors
are less severe since we use a unique deflator, with no country dimension, for each product. We also
trim the top and bottom 5% of our indicators, which removes any large changes in elementary unit
values.
14G. Gaulier, A. Sztulman, D. Ünal Are global value chains receding? The jury is still out.
Figure 5
Share of intermediate goods
in world trade for manufacturing in volume
(at 2011 prices, in %)
A. Total intermediate goods
(semi-finished + P&C)
B. Manufacturing world trade breakdown
by production stages
Note: See Appendix 5 for the share of production stages in total
world trade in volume.
Source: Authors‘ calculations from CEPII‘s WTFC database.
A breakdown by production stages is also informative. Again, the results for semi-finished
products and P&C are different. In the case of the former, much of the growth and
subsequent fall in current values are linked to price effects. The share of semi-finished goods
in volume decreased between 2002 (33.7%) and 2006 (32%) and has remained quite flat
afterwards. In the case of P&C, the share in volume slightly increased between 2002 (20.2%)
and 2016 (21.4%). It is interesting that, for consumption goods, the share in volume is quite
flat while, for capital goods, we observe a drop from 21.3% in 2011 to 19.7% in 2016. This
decrease in the manufacture of capital goods is consistent with reduced demand since the
Great Recession.
In the following analysis of GVC dynamics, we focus on the share of P&C in volume.
15G. Gaulier, A. Sztulman, D. Ünal Are global value chains receding? The jury is still out.
5. GVCs and business cycles
Following Haugh et al. (2016), we control for cyclical movements. Our GVC indicator, based
on P&C, is likely to be affected by general economic conditions (see Figure 5.B). In their
research, Haugh et al. (2016, p. 17) compute an indicator of ―backward participation in
GVCs‖, which is based on trade data and corresponds to the ratio of intermediate goods
imports to final domestic demand,37 in nominal terms, for the 1991-2015 period. To exclude
commodity prices and cyclical effects, the authors deflate their GVC indicator38 and regress
the resulting indicator in volume on a measure of the output gap.39 We adopt a similar
approach: our GVC indicator - share in volume of P&C in world trade for the manufacturing
industries- is purged of business cycle effects by regressing it on a measure of the output
gap and a trend (see Appendix 7 for the results of the estimation).
Both explanatory variables are statistically very significant. The trade share of P&C is higher
when the world economy is booming with annual average growth of around 0.3% according
to the trend coefficient. In Figure 6.A, recent GVC evolutions, taking account of price effects
and business cycle, show no sign of a downturn after the 2008-09 global crisis.
37
In contrast to trade shares, the denominator of their GVC index, i.e., final domestic demand,
changes with the country‘s GDP (including demand for non-tradable goods). Therefore, an economic
shock unrelated to GVCs (e.g., trade liberalisation measures at world level) is likely to influence this
indicator. This does not apply to intermediate trade shares and trade shares by production stages,
which are independent of any shocks that affect trade flows by production stages and total trade in a
similar way. For this reason, trade shares might more accurately capture GVC dynamics.
38
The authors use two different deflators: price of total imports of goods and services to deflate
imports of intermediate goods, and the deflator for total domestic expenditure concerning final
domestic demand. However, neither of these deflators has a sectoral dimension, whereas, in our
methodology, trade unit value deflators are calculated according to production stages.
39
Their resulting ―GVC structural index‖ (Haugh et al., 2016, pp. 17-18) shows a steady rise since the
1990s to the 2010. Apart from a slight decline since 2013, the trend reversal of the structural GVC
index is much less pronounced than the sharp reduction (starting in 2011) in their GVC indicator
before correcting for price effects and cyclical movements (Haugh et al., 2016, Figure 10, p. 18).
Therefore, despite differences in the methods used (and the results), Haugh et al. (2016) also find a
major influence of commodity prices and business cycle.
16G. Gaulier, A. Sztulman, D. Ünal Are global value chains receding? The jury is still out.
Figure 6
Actual and adjusted shares
of Parts & Components in volume
(at 2011 prices, in % of manufacturing world trade)
A. All Parts & Components
B. P&C excluding
―Office machinery & Computers‖ (ISIC 30)
Note: Adjusted share is the fit of the regression of the P&C share in
volume on a linear trend and an output gap from IMF-WEO
database (see Appendix 7).
Source: Authors‘ calculations from CEPII‘s WTFC database.
6. GVCs and sectoral developments
Finally, we investigate whether sectoral composition effects played a role in the evolution of
the trade share in volume of P&C. Is the share of world trade in industries where this stage of
production is significant higher in 2016 compared to 2000? Or, does the share of P&C
increase within industries?
Figure 7A depicts the evolution in world manufacturing trade in volume by branch groups. In
the medium term, trade shares were relatively stable, particularly for branch groups involved
in P&C trade. In this production stage, over the period considered, four branch groups
account for more than 96% of world trade in P&C (see Figure 7.B) with electronics
accounting for 40% of P&C trade in 2016. Transport equipment represented 26% of P&C
trade followed by machinery 18% and electrical machinery 12% in 2016. Thus, there is no
17G. Gaulier, A. Sztulman, D. Ünal Are global value chains receding? The jury is still out.
evidence of a sectoral composition effect on P&C trade shares. At this level of aggregation,
we observe no major changes and the rise in the P&C trade share in volume is not, as might
have been expected, linked to expansion of the electronics industry.
Figure 7.C shows that, within these four main branch groups, P&C trade shares remained
stable (in the case of machinery and electronics) or grew slightly (electrical machinery and
transport equipment) throughout the period, with no sign of a slowdown after the Great
Recession. In contrast, starting in 2009 in the case of transport equipment and 2011 in the
case of electronics, there was an upturn after the 2008-09 global crisis.
Figure 7
World manufacturing trade in volume by branch groups and zoom on P&C
A. World manufacturing sector breakdown by branch groups
(all production stages, %)
B. Main branch groups in P&C: C. Main branch groups in P&C:
share in the P&C world trade (%) share of P&C in each branch group’s trade (%)
Notes: See Figure A.6 in Appendix 8 for trade shares in value.
Source: Authors’ calculations from CEPII’s WTFC database
18G. Gaulier, A. Sztulman, D. Ünal Are global value chains receding? The jury is still out.
Figure 8
World trade in electronics in volume
(in % of world manufacturing trade)
A. ISIC branches in electronics B. ISIC branches in electronics
(all production stages) detailed by production stages
Notes: In panel A HS6 products are regrouped in branches according to 2 digit ISIC classification: ISIC 30 (Office machinery &
computers), 32 (Radio, TV & communication equipment) and 33 (Medical, precision & optical instruments). In panel B, these three
branches are detailed by production stages: SF, semi-finished goods; PC, P&C; K, capital goods; and C, consumption goods. See
Figure A.7 in Appendix 8 for trade shares in value.
Source: Authors‘ calculations from CEPII‘s WTFC database.
Given the high share of electronic products in P&C trade flows, we explore this sector in
more detail, according to branches and production stages. Figure 8.A shows that global
stability in electronics is hiding some major changes among branches. Trade shares in
volume for telecommunications equipment and precision and medical instruments increased,
but decreased in the case of the share of office machinery and computers in world
manufacturing trade. These changes are not linked to price effects since similar evolutions
are observed in trade shares at current prices (see Appendix 8). In the case of office
machinery and computers, the decline is even more pronounced in current prices: -3.4 (from
7.4% to 4%) versus -3.2 (from 6.6% to 3.4%) in volume. Consistent with the smaller increase
in the prices of precision and medical instruments, trade shares in volume in this subsector
exhibited a higher increase over the period: 1.3 (from 3.3% to 4.6%) compared to 1.1 in
value (from 3.9% to 5%). For telecommunications equipment, the slight decrease in the trade
share in value (-0.9, from 12.1% to 11.2%) becomes a slight increase in volume (+0.5, from
9.6% to 11.1%).
A breakdown by production stages indicates that the decline in the trade share of office
machinery and computers was linked to a major decrease in P&C and a more modest
decrease in capital goods (see Figure 8.B). Similarly, the rise in telecommunications
equipment was driven by P&C growth, and capital goods growth was responsible for the
increase in precision and medical instruments.
These changes are linked, in part, to a structural transformation of the electronics sector
where the development of telecommunications equipment activities has occurred in parallel
with a decrease in the more mature office machinery and computer sectors.
In light of these findings, we re-ran the regressions for share in volume of P&C in world trade,
but excluding office machinery and computers (see Figure 6.B) which accounted for a high
share of P&C trade in the electronics industry in 2000 (35% in volume compared to 11% in
2016). This subsector includes a diversity of goods and is characterized by rapid
19G. Gaulier, A. Sztulman, D. Ünal Are global value chains receding? The jury is still out.
technological change, which increases the relevance of classification and measurement
issues.40 As expected, our GVC indicator shows a greater increase when office machinery
and computers are excluded.
7. GVCs at the extensive margin
More qualitative data on the number of international ―links‖ in production networks allow for
more in-depth analysis of GVCs and production stages. Johnson (2017) suggests that the
number of links in the GVC can be used to study GVC organization, length, position of
industries in the value chain and degree of fragmentation. Johnson (2017) refers to Fally
(2012) and Antràs and Chor (2013) who count the number of production stages. Another
―qualitative‖ count statistic in the context of GVCs is growth in the variety of products.
Papageorgiou and Spatafora (2012), for the case of Vietnam, find an 18-fold rise in the
number of products exported between 1990 and 2010. Other studies measure varieties gains
by incorporating growth in the number of varieties in price measures (Feenstra, 1994;
Feenstra and Weinstein, 2017).
In the present study, data on the number of clients by exporter, and the number of suppliers
by importer, are used to measure geographic diversity along GVCs and the expansion of
trade at the extensive margin. A client (respectively a supplier) of an exporter (respectively
importer) is a destination (respectively origin) country for a given product. Figure 9 presents
numbers and equivalent numbers by production stages, of clients per exporter and suppliers
per importer. Average values are computed for countries and products at the 6-digit HS level
for manufacturing world trade and for each year in our period of analysis (2000-2016).41
Since absolute numbers treat two clients (or suppliers) representing, respectively, 1/10000th
and 10% of sales (or purchases) similarly, we also calculate equivalent numbers to obtain
further information on the geographic concentration of sales and supply.42 Since equivalent
numbers give higher weights to larger partners, they are an appropriate statistical indicator to
measure diversity in a context of highly heterogeneous country sizes (e.g., the Kiribati
Islands compared to Japan).43
40
Due to an insufficient level of detail in the product classifications, some items have a strong effect on
aggregates. For instance, HS 847330 ―parts and accessories of data processing equipment not
elsewhere specified‖ contributes a great deal to the decline of the P&C trade share in volume for office
machinery and computers, due to both its declining values and rising unit values.
41
Note that our measures may underestimate growth at the extensive margin since they do not
consider the numbers of clients and suppliers in a country.
42
The following example shows how equivalent numbers measure partner diversity. If a country has
two clients, each accounting for 50% of export sales, the equivalent number is 2. If a country has 11
clients and one of them accounts for 90% of export sales and the other ten each account for 1%, the
equivalent number is 1.2. To find equivalent numbers, we consider simple average values although
weighted averages (or medians) can also be calculated. Appendix 9 presents weighted equivalent
numbers for manufacturing world trade, using trade at the 6-digit HS level as the weight (average over
2000-2016). It also provides the numbers for all world trade products.
43
However, using this indicator (as well as absolute numbers), replacing two suppliers, one in Italy
and one in Germany, by four suppliers in China, reduces diversity. Therefore, this indicator cannot
capture firm diversification within a single country. However, considering the high level of
concentration of trade among firms at country level, this might not be too much of a problem. Also, our
focus is on international, not national fragmentation of the production process.
20G. Gaulier, A. Sztulman, D. Ünal Are global value chains receding? The jury is still out.
We observe, first, that the number of international links is increasing, and this applies to each
44
production stage. Also, apart from a slight slowdown between 2008 and 2012, we find no
evidence of weaker growth in geographic diversification since the Great Recession. It is
interesting that the greatest geographic diversity is in P&C – based on either numbers or
equivalent numbers, for both clients and suppliers. In contrast, despite an increase since
2000, the lowest values are for semi-finished products. So P&C trades involves more
countries and more border crossings and geographic diversification, and has been rising
steadily while diversification in semi-finished products has remained almost unchanged. Also
noteworthy is the high level of geographic diversification on the import side in the case of
P&C, regardless of which indicator is used.45 This might reflect a GVC organisation where
firms source inputs from across the world, but sell output to a limited number of destinations.
For example, a Mexican subcontractor of a German carmaker may buy inputs from
numerous suppliers, but sell its output exclusively to the US.46 In addition, in the context of
imports, the flat slopes of the curves of the equivalent numbers for semi-finished products
and consumption goods indicate that new suppliers are of small size. It is significant that the
gap between the two types of intermediate products is increasing up to 2014.47 Figure 10
shows that semi-finished products decline according to all the indicators whereas P&C show
increased supplier diversity. For clients, P&C show similar dynamics to finished goods. All
producers, including P&C producers, require a high and increasing diversity of suppliers.
However, once the parts are combined into a product, the number of clients is no higher for
P&C. Diversified supply of inputs is crucial for monopolistic firms selling a specific variety,
whereas (geographical) diversification of sales entails fixed costs related to each destination,
which, especially for small and medium sized firms, can reduce the benefits deriving from
economies of scale.
44
Note that the increase in our indicators cannot be due to the emergence of new countries or new
products since our calculations are based only on countries and products available in each of the
years in the 2000-2016 period. It implies that, during our period of analysis starting in 2000, there were
very few withdrawals of products or countries.
45
In the case of imports, using weighted equivalent numbers leads to the same result (see
Appendix 9). In the case of exports, equivalent numbers are more similar for P&C and capital goods.
46
Supplier diversity at the country level stems from both the number of suppliers of a representative
firm and the number of firms, each of which will have preferred suppliers.
47
The figures for years 2015 and 2016 should be interpreted with caution since these recent data may
not be exhaustive and are subject to revision (due, in particular, to missing data for some countries in
recent releases). Therefore, the slight decline observed in our indicators for these two years could be
attributable to statistical issues as well as the relative weakness of Asian trade and cyclical factors.
Further research will be needed to study the more recent evolutions.
21You can also read