Concealed Carry Permit Holders Across the United States: 2018* - Concealed Carry in USA
←
→
Page content transcription
If your browser does not render page correctly, please read the page content below
1

Report from the Crime Prevention Research Center

  Concealed Carry Permit Holders Across the
            United States: 2018*

                                       John R. Lott, Jr.
                                           President
                              johnrlott@crimeresearch.org
                                        484-802-5373
                                      August 14, 2018

  •   Rujun Wang and Roger Lott provided valuable research assistance in producing this report.
      Copyright 2018 by John Lott. No more than a third of tables may be reproduced without the
      permission of the author and must be properly credited.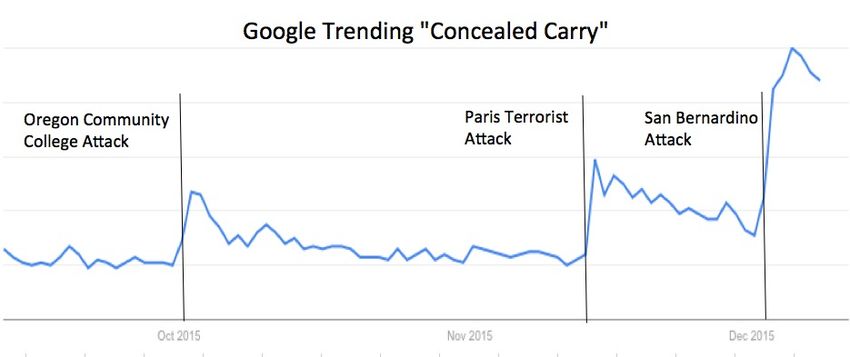
2

Table of Contents

     SUMMARY                                                                3

     THE EXPONENTIAL GROWTH IN THE NUMBER OF PERMITS                        5

     THE CHANGING GENDER AND RACE OF PERMIT HOLDERS                         24

     EVIDENCE THAT LOS ANGELES COUNTY OFFICIALS DISCRIMINATE AGAINST

            HISPANICS AND WOMEN WHEN GIVING OUT PERMITS                     31

     EXAMPLES OF PEOPLE WHO ARE FACING DEATH THREATS

            ARE PREVENTED FROM GETTING PERMITS IN STATES

            WITH DISCRETIONARY PERMITTING RULES                             18

     PERMIT HOLDERS ARE EXTREMELY LAW-ABIDING                               33

     DETERRING CRIME                                                        37

     WHY is THE NUMBER OF PERMITS INCREASING                                40

     Table 1: NUMBERS OF PERMITS BY STATE                                   12

     Table 2: PERCENT OF ADULT POPULATION WITH PERMITS BY STATE             15
     Table 3: PERMIT FEES BY STATE                                          18
     Table 4: REVOCATION RATES FOR PERMIT HOLDERS                           35
     DATA SOURCES FOR NUMBER OF PERMITS, PERMIT FEES, AND LENGTH OF

            PERMITS                                                         43

     Appendix on rates that permit holders are convicted of violent crime   53

     Appendix on Academic Research                                          56

     Academic Advisory Board                                                59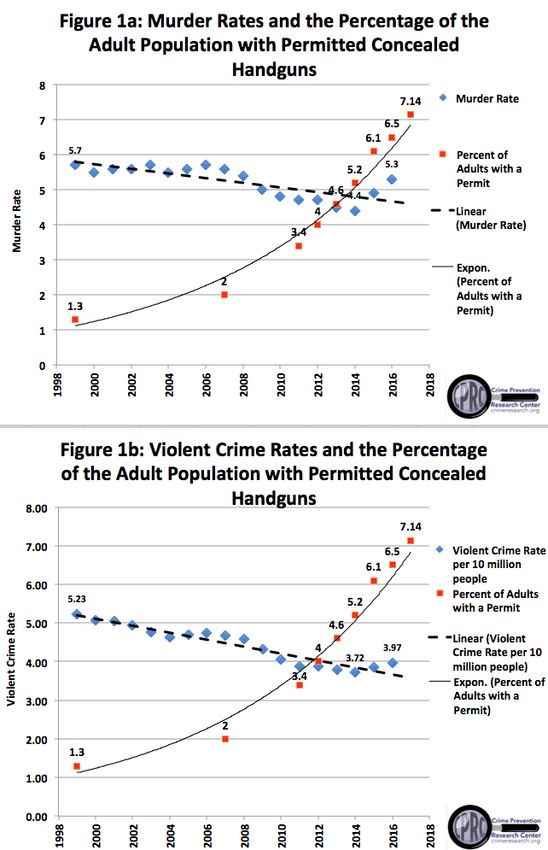
3

Summary
Despite the expectations of many after the 2016 elections, the number of
concealed handgun permits has continued increasing. In 2018, the number of
concealed handgun permits soared to now over 17.25 million – a 273% increase
since 2007. 7.14% of American adults have permits. Unlike surveys that may be
affected by people’s unwillingness to answer some personal questions, concealed
handgun permit data is the only really “hard data” that we have on gun
ownership across the United States. Still, an even larger number of people carry
because in 14 states people don’t need a permit to carry in all or virtually all those
states.
Among the findings of our report:

   ■ Last year, despite the common perception that growth in the number of
     permit holders would stop after the 2016 election, the number of permits
     grew by about 890,000.
   ■ Outside the restrictive states of California and New York, about 8.63% of
     the adult population has a permit.
   ■ In fifteen states, more than 10% of adults have permits, up from just eleven
     last year.
   ■ Alabama has the highest rate — 22.1%. Indiana is second with 17.9%, and
     South Dakota is a close third with 17.2%.
   ■ Four states now have over 1 million permit holders: Florida, Georgia,
     Pennsylvania, and Texas.
   ■ Another 14 states have adopted constitutional carry in all or almost all of
     their state, meaning that a permit is no longer required. However, because
     of these constitutional carry states, the nationwide growth in permits does
     not paint a full picture of the overall increase in concealed carry.
   ■ Permits continued to grow much faster for women and minorities. Between
     2012 and 2018, the percent of women with permits grew 111% faster for
     women and the percent of blacks with permits grew 20% faster than for
     whites. Permits for Asians grew 29% faster than for whites.
   ■ Concealed handgun permit holders are extremely law-abiding. In Florida
     and Texas, permit holders are convicted of misdemeanors and felonies at
     one-sixth of the rate at which police officers are convicted.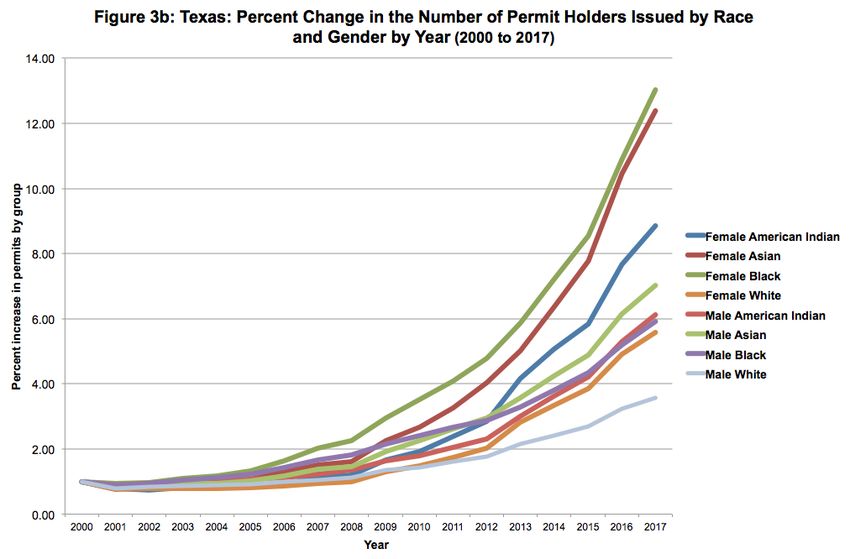
4
5

The Exponential Growth in the Number of Permits
Figures 1a and b show how the percentage of adults with concealed handgun
permits has been growing exponentially over time. There were 2.7 million
concealed handgun permit holders in 1999, 4.6 million in 2007, 8 million in 2011,
11.1 million in 2014, and now 17.25 million in 2018. The growth in permits has
been continuous.

At the same time that there has been an exponential growth in permits, there has
been a general linear decline in murder and violent crime rates. Murder rates fell
from 5.7 to 5.3 per 100,000, a 7% drop. Overall violent crime fell by 24 percent.
Meanwhile, the percentage of adults with permits soared by five fold. Such simple
evidence by itself isn’t meant to show that concealed handgun permits reduce
violent crime rates, as many factors account for changes in crime rates, but only
that there doesn’t seem to be any obvious positive relationship between permits
and crime.

Over the years, more and more states have adopted laws allowing individuals to
obtain concealed carry permits. Illinois was the last state to do so, issuing its first
permits in March 2014. Even Washington, D.C. finally enacted a concealed
handgun permit law in September 2014. Today, permitted concealed handguns
are allowed in every jurisdiction of the United States. Some of the increase in
permits in earlier years was due to more states having permitted concealed
handguns.

But the rules vary greatly from state to state, and generally states have made it
easier over time to get permits. There are no fees or training requirements in the
fourteen states that do not require permits in all or almost all their state. The
average fee for a five-year permit is $64. California is at the high end of the
spectrum, charging up to a $385 fee and requiring 16 hours of training. The
training costs also vary widely. If private trainers are allowed, the costs could be
as low as $250. But some jurisdictions require that applicants go through the
same training as law enforcement, and costs can be over $1,000. Applicants must
also demonstrate to their local sheriff that they really need a gun. In many parts
of California, permits only go to the most politically connected applicants. By
contrast, South Dakota has no training requirement and charges only $10 for a
four-year permit. Similarly, Pennsylvania has no training requirement and charges
$19 for a five-year permit. You just need to be 21 and pass a background check.

A lot of changes in fees are occurring this year. Texas just reduced its fee from
6

$140 to $40 and Florida from $60 to $55. The average fee for state permits fell by
6% from 2017, dropping to $63.81 (see Table 3).

Not surprisingly, concealed carry is much more popular in states where permits
are relatively inexpensive and easy to obtain. Texas has seen dramatic growth in
the number of permits after the drop in fees and reduction in training
requirements, with it moving from the state with the third most permits to
second.

This report will focus on changes in the number of concealed carry permits. From
a crime prevention standpoint, the important thing is whether people actually
carry guns, not merely whether they are allowed to do so.

All states now allow concealed carry. And they are all issuing more permits. The
longer that concealed carry laws have been in effect, the more time that people
have had to apply for and receive permits. But President Obama’s election in
2008 also seems to have been a major factor. Many have referred to Obama as
the best gun salesman ever. Not only did Obama’s presidency increase gun sales,
it also increased the number of concealed handgun permits.

Conventional wisdom held that the sharp rise in gun sales during Obama’s
presidency was driven, at least in part, by the threat of gun control. That’s why
everyone expected gun sales to decline after Trump’s victory.

Some evidence indicates that gun sales have cooled down. The National Instant
Criminal Background Check System (NICS) has seen a slight drop-off in
background checks compared to last year.1 During the first five months of 2017,
background checks were down about 9.3% (998,672) compared to the same
period in 2015.

But there are multiple problems with using background checks to measure the
number of people buying guns. Some people undergo multiple checks to buy
multiple guns, but sometimes multiple guns are sold with a single check.

1
 The NICS background check system does differentiate background checks for concealed handgun
permits from other types of background checks. Yet, the permit estimate from the NICS checks
consistently implies a much higher number of permits than supplied by the states themselves. For
example, Texas says that there were 1,200,746 active permits as of May 31st 2017, but the NICS systems
counts 1,413,621 background checks for the permit system, an eighteen percent difference. That gap is
due to people moving from Texas, dying, and having their permits revoked, though those reasons don’t
explain the entire 200,000 difference. While our estimate shows that there are over 17.25 million
permits, summing up the NICS permit checks gives a number nearer to 30 million.
7

Furthermore, people who have already passed a concealed carry background
check are not always required to undergo another one when they buy a gun.

Polling is another problematic method of measuring gun ownership. When asked
if they own a gun, many people may be reluctant to answer truthfully. They may
feel that it's none of the pollster's business, or be afraid to answer because of
mass shootings or distrust of government.2 Some polls show an increase in gun
ownership, while one shows a decrease.3

Previously, the increase in permits had been relatively slow, growing from roughly
2.7 million permit holders in 1999 to 4.6 million in 2007. But the number of
concealed handgun permits exploded during the Obama presidency. In December
2011, the Government Accountability Office estimated that there were at least 8
million concealed handgun permits. By June 2014, it was 11.1 million. Now, in
2018, the number is now up to 17.25 million.4

After the 2016 election, gun sales slowed down noticeably. After NICS firearm
background checks hit their all time peak of 27.4 million in 2016, they fell back to
24.96 during 2017. Yet, while the growth of concealed handgun permits has
slowed after the election, they have continued to grow, increasing by 890,000
permits this year.

While concealed handgun permit data is a better measure of changing gun

2
  There are a number of polls that show this increasing distrust of government. The Pew Research
Center describes the trust in government a “near historic lows.” See for example, Pew Research Center,
Public Trust in Government: 1958-2014, November 13 2014 (http://www.people-
press.org/2014/11/13/public-trust-in-government/).
3
  Several NBC News/Wall Street Journal polls over the last year show that about 47% to 48% of American
households own a gun. It is up from 44% in 1999. Another Monmouth University Poll in March found
that 46% of Americans lived in households with guns, but if you a portion the 7% who refused to answer
so that you assume 46% of them live in households without guns, there would be about 50% that live in
homes with guns. The one survey that has shown a consistent drop over time is by the General Social
survey, which went from the high 40% range in the early 1970s to the low 30% level in 2014. Crime
Prevention Research Center, “Gun ownership remains at 47%, but that probably underestimates the
true rate,” March 25 2018 (https://crimeresearch.org/2018/03/problems-with-using-the-general-social-
survey-to-measure-gun-ownership/).
4
 There are 16.5 million permits to residents in those states. Some people hold a permit outside their
state simply because it is recognized in states that they want to travel to other states. For some people
that might be their only permit. The two states that issue a lot of permits outside there state are Florida
(225,896) and Utah (487,826). New Hampshire (38,874) also seems to have a sizeable number. For
some others they might hold more than one permit. The total number of permit holders is between
16.5 and 17.25 million.
8

ownership rates than NICS checks or polls, it clearly underestimates the true
number and growth of people who can legally carry concealed handguns. The
scale of that underestimation is increasing over time. There are three reasons for
this.

      1) Permits are not required in 12 states as well as virtually all of Arkansas
         and Montana. Generally, people in these states only obtain permits so
         that they can carry concealed when traveling outside of their home
         state. With no fees or other requirements, these states are probably the
         ones where concealed carry is most common. Indeed, despite the fact
         that the number of people who carried undoubtedly went up
         significantly when there were no longer any fees or training
         requirements to carry, permit growth in the Constitutional Carry states
         was only half the rate as the other states that allow concealed carry.

      2) Data on concealed carry is not readily available for a few states. For
         example, New Hampshire only collects data on permits issued to non-
         residents. They weren't willing to give an exact figure, only giving us a
         conservative estimate. Alabama and New York simply don’t collect this
         data at all on the state level, and it is a very cumbersome process to
         obtain data from a large number of individual counties or cities. In the
         case of Alabama, we collected data for counties representing 37% of the
         state’s population and then assumed that the rate of concealed carry
         was similar to the rest of the state. However, this is likely to
         underestimate the total number of permits, as concealed carry is likely
         to be less popular in the more urban counties that we had data for, as
         opposed to more rural counties. A similar process was used for New
         York.

      3) For some states, the data is one or more years old and thus misses the
         recent, accelerated growth in permits.

As more and more states decide not to require permits, the number of people
who can legally carry a handgun will increasingly outpace the number of permit
holders. The number of people who carry permitted concealed handguns is
clearly related to the cost of getting permission. When there is no cost
whatsoever, concealed carry becomes very popular.

Due to old and missing data, 17.25 million is undoubtedly an underestimate of the
total number of Americans with permits. On the other hand, 752,596 permits are
9
“non-residential,” some of which are issued to people who already have
concealed handgun permits from their home states. Most of these non-residential
permits are issued by Utah (487,826) and Florida (225,896).
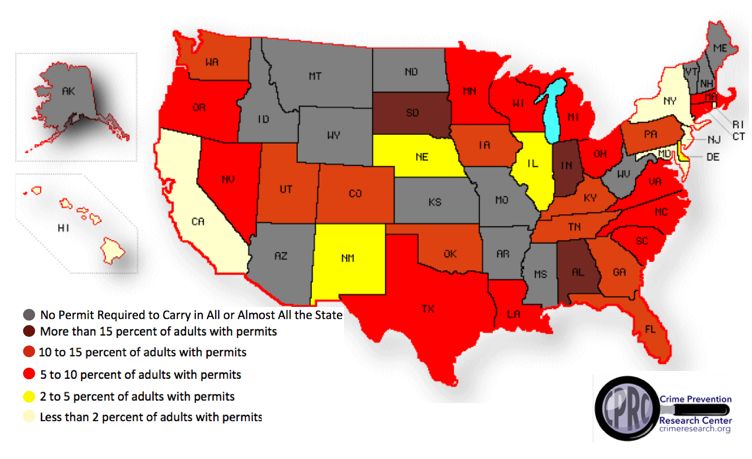
As shown by the map on the next page, every region of the country has both
states that don't require permits as well as states where over 10 percent of adults
have concealed handgun permits.
There is at least one county in Alabama where almost two-thirds of the adults
have a concealed handgun permit (Cleburne with 64.6%). In 2017, there were five
counties in Pennsylvania that had about 30% to 50% of their adult populations
with concealed handgun permits: Potter (50.3%), McKean (34.6%), Warren
(34.6%), Cameron (31.3%), and Armstrong (30.1%).
Figure 2: Percent of adult population with permits by state10 While about 7.14% of the adult population has concealed handgun permits, one of the big questions is how frequently permit holders actually carry their guns. The fact that 14 states allow permitless carry doesn't make it any easier to come up with an estimate. But a Pew Research Center Survey last year makes it possible to estimate the percentage of American adults who carry guns and how frequently they carry them (“America’s Complex Relationship With Guns,” Pew Research Center, June 22 2017). The Pew numbers include both concealed and open carry. In most states, permits are not required for open carry. It might be rare for someone to openly carry a handgun on a regular basis, but open carry may account for a large share of those who carry a gun on occasion. The survey also counts people no matter their reason for carrying, even if it is simply for sport on their way to or at a shooting range or hunting. What it means to carry "some of the time" is also not clearly defined. The Pew survey thus likely overestimates the number of people who carry, especially those who carry occasionally. There are three relevant sets of numbers from the Pew survey: -- 30% of American adults say that they own a gun -- 72% of the people who own a gun, say they own a handgun or a pistol -- 11% of handgun owners say that they carry all the time, 26% say they carry most or all the time, and 57 percent say that they carry at least some of the time. With a little multiplication, we find that: -- 2.4% say that they carry all the time. -- 5.4% carry most or all the time. -- 12.3% carry at least some of the time. To summarize, the total number of permits in the US is at least 17.25 million. Add in people who legally carry without a permit, and the number clearly becomes much larger. While 7.14% of the adult population has permits, the percentage of Americans who say that they carry most or all the time is about three quarters as large at 5.4%. What does this mean in practice? It means that in most places where people are allowed to carry a concealed handgun, there will be someone carrying a concealed handgun. If the probability that any one person has a concealed handgun permit is 5.4%, in a room with 10 people (assuming that the probabilities are independent), the probability that at least one person will have a permitted
11

concealed handgun is 43%. In a room with 20 people, that probability goes up to
67%. With 40, that probability rises to 89%.

The Comparing Permit Issuing Rates Across States
As just noted, there is a huge variation in the rate that permits are given out by
state. The following two tables provide more specific details on these differences.
7.14% of the adult population has concealed handgun permits. If you exclude the
eight May Issue states and the District of Columbia (California, Delaware, DC,
Hawaii, Maryland, Massachusetts, New Jersey, New York, Rhode Island), where
there is discretion on who gets permits, that raises the percent for the other 42
states to 10.14%.
For the vast majority of the US outside of these coastal areas it is very likely that
any place that allows people to carry a concealed handgun and
Fifteen states have more than 10% of their adult populations and seventeen
states have less than 5%. Alabama continues to lead other states with the largest
share of its adult population with permits, about 22%, while California, the District
of Columbia, Hawaii, Maryland, New York, New Jersey, and Rhode Island all have
less than one percent with permits.
12

Table 1: Number of Permit Holders by State
       State           Active         Data Updated
                       Permits
                                  State rate based
    Alabama¥             797,177 on 4 large counties    Florida is the state that has
                                    in June 2018        Florida is the state that has
     Alaska†              11,485      June 22, 2018     issued the most concealed
                                                        carry permits at 1.93 million,
     Arizona†            333,285      June 24, 2018
                                                        followed by Texas with
   Arkansas††            227,898     February 9, 2018   1.314 million.
     California          108,000     March 13, 2018
     Colorado            433,483     March 31, 2018
   Connecticut           267,330       July 2, 2018
     Delaware             18,096     January 31, 2018
District of Columbia       1,482      June 29, 2018
                       1,931,719
                            total,
      Florida                         July 31, 2018
                       1,705,823
                       residential
     Georgia           1,006,946      June 30, 2018
                                      December 31,
      Hawaii                     -
                                         2016
      Idaho†             121,984      June 18, 2018
      Illinois           300,705      June 18, 2018
      Indiana            869,829       July 1, 2018
                                      December 31,
       Iowa              289,060
                                         2017
     Kansas†              85,000       July 5, 2018
                                      December 31,
     Kentucky            374,132
                                         2017
                                      December 31,
     Louisiana           204,625
                                         2017
13
Maine† 42,000 June 30, 2018
Maryland 20,628 May 31, 2018
Massachusetts 401,452 June 28, 2018
Michigan 628,923 April 2, 2018
Minnesota 284,954 July 31, 2018
Mississippi† 46,598 June 21, 2018
December 31,
Missouri† 160,184
2012
Montana* 52,982 February 6, 2018
Nebraska 61,781 July 1, 2018
Nevada 126,995 May 1, 2018
38,874 non-
residential/at
New Hampshire†
least 50,000 December 31,
residential 2017
New Jersey 1,212 2012-2013
New Mexico 45,115 June 29, 2018
March to July
2018, Broome,
Herkimer, Nassau,
Oneida, Rockland,
and Saratoga
Counties were
New York¥ 100,549
used to make this
calculation for the
state outside of
New York City.
NYC data was also
used.
North Carolina 640,702 June 18, 2018
North Dakota† 48,356 February 8, 2018
Ohio 703,476 March 31, 2018
December 31,
Oklahoma 287,786
2017
Oregon 261,155 February 5, 201814
Pennsylvania 1,310,263 February 9, 2018
Rhode Island 2,288 June 19, 2018
South Carolina 324,923 January 1, 2018
South Dakota 107,276 May 31, 2018
Tennessee 618,752 June 1, 2018
Texas 1,314,432 May 31, 2018
713,550
total,
Utah June 30, 2018
225,724
residential
No permits
Vermont†
issued
Virginia 398,239 June 18, 2018
Washington 583,001 July 3, 2018
West Virginia† 163,098 January 18, 2017
Wisconsin 333,217 June 15, 2018
Wyoming† 31,994 June 15, 2018
TOTAL 17,248,117
† States where permits not required to carry within the state. Permits only
obtained to carry outside of state.
†† Permits not required to carry in 99.4 percent of Montana and the vast
majority of counties in Arkansas. For those people, the only reason that
they would obtain a permit is to carry in other states.
¥ Data are only available at the county level for Alabama or New York State.
For Alabama, we were able to get permit data information for the following
counties: Baldwin, Cullman, Jackson, Jefferson, Madison, and Montgomery.
so we assumed a 0.1% permitting rate based on Herkimer, Suffolk, Monroe,
and Suffolk Counties as well as New York City
http://crimepreventionresearchcenter.org/2014/09/more-misleading-
information-from-bloombergs-everytown-for-gun-safety-on-guns-analysis-
of-recent-mass-shootings/. For NYC, Gawker used a FOIA release of NYPD
licensees. 114 pages of carry licenses with 50 names each = 5,700.
http://gawker.com/5974190/here-is-a-list-of-all-the-assholes-who-own-
guns-in-new-york-city.15
Table 2: Ranking States by Percent of the Adult
population with Permits
% of Adult Population
with concealed carry
State permit
Alabama¥ 22.11%
Indiana 17.92%
South Dakota 17.17%
Pennsylvania 13.49%
Georgia 13.28%
Iowa 12.56%
Utah* 12.43%
Tennessee 12.35%
West Virginia† 11.87%
Kentucky 11.38%
Washington 10.45%
Florida* 10.44%
Arkansas†† 10.40%
Colorado 10.34%
Oklahoma 10.21%
Idaho† 9.95%
Connecticut 9.82%
North Dakota† 8.79%
South Carolina 8.59%
Michigan 8.44%16
North Carolina 8.35%
Oregon 8.25%
Ohio 8.13%
Wisconsin 7.72%
Wyoming† 7.70%
Massachusetts 7.59%
Minnesota 6.95%
Montana†† 6.69%
Texas 6.57%
Arizona† 6.42%
Virginia 6.29%
Louisiana 6.04%
Nevada 5.67%
New Hampshire†* 4.80%
Nebraska 4.50%
Kansas† 4.08%
Maine† 4.02%
Missouri† 3.55%
Illinois 3.20%
New Mexico 2.97%
Delaware 2.48%
Alaska† 2.20%
Mississippi† 2.17%
New York¥ 0.67%
Maryland 0.46%
California 0.37%
Rhode Island 0.28%
District of Columbia 0.27%17
New Jersey 0.02%
Hawaii 0.00% (0.02% if include
permits for private security)
Vermont† Not Applicable
†States were permits not required to carry within the state. Permits only obtained
to carry outside of state. These numbers will dramatically underestimate the true
rate that guns are legally carried concealed in these states.
†† Permits not required to carry in 99.4 percent of Montana (areas outside of city
limits). Most counties in Arkansas will not prosecute people for carrying without a
permit. For those people, the only reason that they would obtain a permit is to
carry in other states.
* Only Florida’s, New Hampshire’s and Utah's residential permits are included
here.
¥ Estimates made using a sample of permits from some counties within the state.18
Table 3: Cost of Getting Permits by State 2018
Initial Handgun Carry Length Permit Cost to carry for 5
State Permit Type
Permit Fee is Valid (years) years
1-5 years
Concealed pistol $5-$20 per year (Varies $25-$100 (Varies by
Alabama (chosen by
permit by County) County)
applicant)
Constitutional
carry/permit for
Alaska† $87 5 $87
reciprocity with
other states
Constitutional
carry/permit for
Arizona† $60 5 $60
reciprocity with
other states
Constitutional $142.11; age 65+
carry/permit for $90.61 (Includes on-line $142.11; age 65+
Arkansas† 5
reciprocity with application and $90.61
other states background check fee.)
Local fee not to exceed
$100 for new license.;
State DOJ charges
another $95. Local
fingerprinting costs of
between $20 and $40.
A few jurisdictions
require psychological
Concealed carry
screening test that can $150 to $300 (Varies
California weapons license run up to $150. 2
by Issuing Agency)
(May Issue only)
Training fees in some
areas are as high as
over $1,000. The
licensing authority may
charge an additional
fee, not to exceed $25,
for processing the
application for a license
renewal.
$52.5 plus
Concealed $52.5 plus additional
Colorado 5 additional fees
handgun permit fees (Varies by County)
(Varies by County)19
$192 = $70 (Temporary
Local Permit Cost) + $75
Permit to carry
(State Permit Cost) +
Connecticut pistol or revolver 5 $192
$12 (Federal Processing
permit
Fee) + $35 (State
Processing Fee).
initial
application
Concealed
$65 for issuing; $65 for valid for 3
Delaware deadly weapon $91
renewal years; renewal
permits
every 5 years
thereafter
$110=$75(Application
District of Concealed carry
Fee)+$35(Fingerprint 2 $275
Columbia pistol license
Processing Fee)
Concealed $97=$55(Initial License
Florida weapon or Fee) + $42 (Fingerprint 7 $69.3
firearms license Fee)
$75 average fee (Varies $75 average fee
Georgia Firearms license 5
by County) (Varies by County)
Individual
permits to
acquire
handguns are
required for
each
transaction
and must be
used with 10
License to carry
Hawaii $42 days of issue. A $42
handgun
permit to
acquire
shotguns and
rifles is good
for one year
from the date
of issue for any
number of
transactions.
Constitutional
$20 plus additional
carry/permit for $20 plus additional fees
Idaho† 5 fees (Varies by
reciprocity with (Varies by County)
County)
other states20
$150 for 5 years for
$150 for 5 years for
Concealed carry residents; $300 for 5
Illinois residents; $300 for 5 5
handgun license years for non-
years for non-residents
residents
4 year Personal
Protection: $10 ($5
Refundable) for local
fee and $30 for state
fee; Lifetime Personal
Protection/ No Current
License to carry License: $50 ($30
Indiana 4 $50
handgun Refundable) for local
fee and $75 for state
fee; All NEW license
applications incur a
$11.95 fee for IDEMIA
Electronic
Fingerprinting.
Permit to carry
Iowa $50 5 $50
weapons
Constitutional
carry/permit for $112=$79.5(Attorney
Kansas† General)+$32.5(Local 4 $140
reciprocity with
other states Sheriff's Office)
Permit to carry $60=$20(Local Sheriff's
Kentucky concealed Office)+$40(Kentucky 5 $60
handgun State Treasurer)
Concealed
Louisiana handgun carry $125; age 65+ $62.5 5 $125; age 65+ $62.5
permit
Resident, $35 for an
Constitutional original application and
$40 for residents;
carry/permit for $20 for a renewal;
Maine† 4 $75 for non-
reciprocity with Nonresident, $60 for an
residents
other states original or renewal
application
initial
application
Handgun wear $75 plus fingerprint valid for 2 $125=$75(Initial)+$
Maryland
and carry permit fees years; renewal 50(Renewal)
every 3 years
thereafter
Massachusetts License to carry $100 6 $83.321
Concealed pistol
Michigan $100 4-5 $100
license
Permit to carry not to exceed $100
Minnesota 5 $100
pistol (Varies by County)
Constitutional
carry/permit for
Mississippi† $112 5 $112
reciprocity with
other states
Constitutional
Missouri† carry/permit for not to exceed $100 for 5 $100
reciprocity with application
other states
Concealed carry
$55=$50(Issuance Fee)
handgun permit
+ $5 (Fingerprint
Montana * (Not required 4 $61.3
Processing Fee); $25 for
outside city
renewal
limits)
Permit to carry a
Nebraska concealed $100 5 $100
handgun
$60 (FBI fees will be
Concealed carry not to exceed $60 (FBI
Nevada 5 extra, assume
handgun permit fees will be extra)
$27.50)
Constitutional
$10 for resident;
New carry/permit for $10 for resident; $100
5 $100 for
Hampshire† reciprocity with for nonresident
nonresident
other states
Concealed carry
New Jersey $20 2 $50
handgun permit
$100=$56(Application
Fee paid to NMDPS) +
$44(Background Check
paid to Cogent) for
Concealed
application;
New Mexico handgun carry 4 $118.8
$75=$31(Application
permit
Fee paid to
NMDPS)+$44(Backgrou
nd Check paid to
Cogent) for renewal22
Usually about $100, but
varies by county =
Firearms license
New York¥ permit fee generally $10 (Varies by
to carry 5
not to exceed $10 + County)
concealed
safety classes are
usually also required
$427=$340(License
Concealed carry
Fee)+$87(Fingerprint 3 $711.7
handgun license
Processing Fee)
New York City
$90=$80(Non-
Concealed refundable Fee) + $10
North Carolina 5 $90
handgun permit (Fingerprinting
Processing Fee)
Constitutional
carry/permit for
North Dakota† $60 5 $60
reciprocity with
other states
License to carry
Ohio a concealed $67 5 $67
handgun
Self defense act $100 for 5-year license;
Oklahoma 5 $100
license $200 for 10-year license
Concealed $65 for new; $50 for
Oregon 4 $77.5
handgun license renewal
License to carry
Pennsylvania $20 5 $20
handgun
License to carry
Rhode Island a concealable $40 4 $50
weapon
Concealed
South Carolina $50 5 $50
weapon permit
Concealed Pistol
South Dakota $10 5 $10
Permit
Handgun carry $100 for 8-year license;
Tennessee 8 $62.5
permit $300 for lifetime license
License to carry $40 (as of September 1
Texas 5 $40
a handgun 2017)
Concealed $52 for resident; $62 $52 for resident;
Utah 5
firearm permit for nonresident $62 for nonresident23
No permits
required/does
Vermont† N/A N/A N/A
not issue
permits
not to exceed $50 for $50 for resident;
Concealed
Virginia resident; not to exceed 5 $100 for
handgun permit
$100 for nonresident nonresident
$48 (some law
enforcement agencies
Concealed pistol
Washington will laminate your 5 $48
license
license for an extra
charge)
Constitutional
carry/permit for $100=$75(Application
West Virginia† 5 $100
reciprocity with Fee)+$25(if approved)
other states
$40=$30(Application
Concealed
Wisconsin Fee)+$10(Background 5 $40
weapon license
Check Fee)
Constitutional
carry/permit for
Wyoming† $64 5 $64
reciprocity with
other states
Average cost of because of the permit to carry within a state
(The fee in pure Constitutional Carry states is zero. Since
$63.81
permits are required in parts of Arkansas and Montana, the
state permit fees are used.)
Average cost of because of the permit to carry within a state
(The fee in pure Constitutional Carry states and for those
$59.82
parts of Arkansas and Montana that don’t require a permit
to carry is zero.)
† States where permits not required to carry within the state. Permits
only obtained to carry outside of state.
†† Permits not required to carry in 99.4 percent of Montana and most
counties in Arkansas will not prosecute people for not having a permit.
For those people, the only reason that they would obtain a permit is to
carry in other states.24
The Changing Gender and Race of Permit Holders
Twelve states, with about 6.8 million permit holders between them, have
reported permit data by gender for 2018. Among those states, women averaged
26% of permit holders. The states represent all regions of the country: Arizona,
Connecticut, Florida, Illinois, Indiana, Louisiana, Maryland, Minnesota, Oklahoma,
Tennessee, Texas and Washington State. (Our previous estimate of the percent of
permits held by women was higher, but we had more state that reported those
numbers.)
For eight states, we have the data to make a comparison over at least a six-year
period. All of these states experienced a general upward trend in female permit
holders, though Oklahoma and Texas experienced slight drops in 2018.
■ Arizona: the percentage of permit holders who are women rose from 20.7%
in 2012 to 21.2% in 2016 and 22.0% in 2018.
■ Connecticut: from 24.3% in 2012 to 33.3% in 2016.
■ Florida: from 18% in May 2012 to 24.1% in May 2016 and 26.3% in June
2018.
■ Indiana: from 18.0% in June 2012 to 23.9% in June 2016 and 27.4% in
March 2018.
■ Louisiana: from 18.3% in 2009 to 24.1% in 2016 and 25.6% in 2018.
■ North Carolina: from 21.3% in June 2012 to 27.5% in June 2016 to 28.7% in
March 2017.
■ North Dakota: from 11.2% in 2010 to 24.9% in 2014.
■ Oklahoma: from 28.9% in 2012 to 36.3% in 2016 to 34.1% in 2018.
■ Tennessee: from 25.9% in 2012 to 34.3% in 2016 to 34.9 in 2018.
■ Texas: from 22.00% in 2012 to 28.0% in 2016 to 27.5% in 2018.25
■ Washington State: between 2005 and 2014, “the growth rate for women
getting new permits [was] twice as fast as that of men.”5 We don’t know
the exact percentages in those two years, but by 2017, women held 25.2%
of permits.
In the eight states where we have data by gender for both 2012 and 2018, the
number of permits increased by 207% for women and by 103% for men –– a 101%
faster rate among women.
Five states have data on permit issuance by race for 2012 and 2018. In these
states (Arizona, Connecticut, Florida, Oklahoma, and Texas) the number of
permits grew at a 20% faster rate for blacks than for whites.
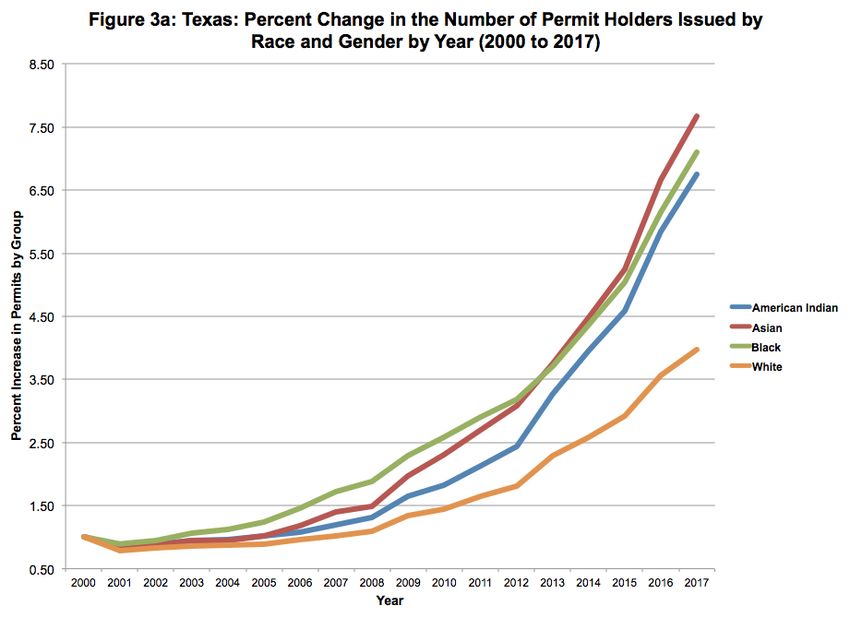
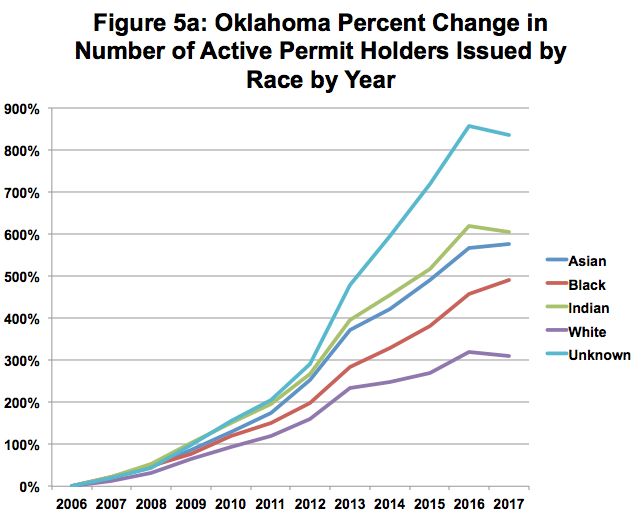
Several states provide detailed data since 2002 or earlier. Texas provides detailed
information on both race and gender from 1996 through 2014.6 The data indicate
that permitting has increased fastest among blacks, followed closely by Asians.
While whites still hold the vast majority of permits, the number of black permit
holders has grown more than twice as quickly as the number of white permit
holders.
After Texas reduced its minimum training hours from ten to four in 2012, the
growth in permit-holding by Asians, blacks, and American Indians reached by far
its most rapid phase. While the number of blacks with permits grew by 71% in the
four years prior to the reduced training requirement, it grew by almost 140% in
the four years after 2012. The growth rate of permits for American Indians also
doubled after the training requirements were reduced.
When permit data is broken down by race and gender, we find that rates of
permit holding among American Indian, Asian, black, and white females all grew
much faster than the rates for males in those racial groups. Concealed carry has
increased most rapidly among black females. From 2000 to 2016, the rate of
growth was 2.22 times faster than among white females.
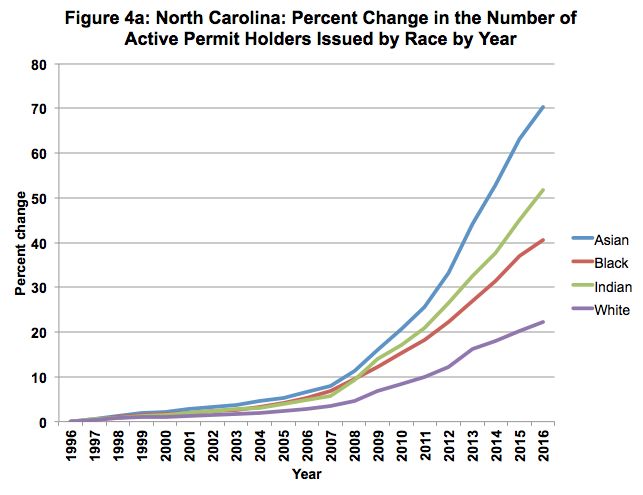
North Carolina has detailed data on the race of permit holders from 1996 to 2016.
5
Justin Mayo, Brian M. Rosenthal, and Erika Schultz, “Concealed-carry permits skyrocket, especially for
women,” The Seattle Times, May 31 2014 (http://www.seattletimes.com/seattle-news/concealed-
carry-permits-skyrocket-especially-for-women/).
6
Those who indicated that they were of multiple races were excluded because people’s willingness to
say that they are of multiple races has changed over time. Thus it is not possible to know how much of
the change is due to people’s willingness to identify themselves this way or an actual change in the
number of people in this category.26 Again, Asians show the largest growth, followed by American Indians and then Blacks. The growth rate for blacks is still about twice as fast as that for whites. Oklahoma data from 2002 to 2016 also show a similar pattern. Asians and American Indians tied for the fastest growth rate. The growth in the number of Blacks permits was about 50% greater than the growth for white permit holders.
27
28
29
30
31

Evidence that Los Angeles County Officials discriminate against Hispanic and
Women when giving out permits
In 2013, LA Weekly obtained a list of the 341 concealed carry permit holders in
Los Angeles County, California.7 That is only about 0.0045% of the 7.7 million
adults living in the county in 2013. LA Weekly pointed out that the people given
permits were judges, reserve deputy sheriffs, and a small group who gave
campaign contributions or gifts to then-Sheriff Lee Baca. Something that LA
Weekly didn’t do was look at the list to determine the race of those lucky few
getting permits. In Los Angeles County in 2013, about 48.1% of the people living
there were Hispanic, 9% were black, and 50.7% women.

To check the race of those who received permits, we used two approaches. First,
we did Google searches as well as searches on social media to find information on
people. Using this, we identified the race of 135 people: 4 Hispanics (3%), 7 blacks
(5.2%), 15 Asians (11.1%), and 109 whites. Only 16 were females
(11.9%). Hispanics and women had much lower permitting rates than the general
population and the rates that those groups obtained concealed handgun permits
in places that don’t allow authorities discretion in determining whether people
have a justifiable need to carry a gun for protection. Asians were not as different
than their 14.4% of the population in 2013.

For all 341 names, we used a website that listed the probability that the last name
is Hispanic.8 We included any last name as Hispanic when the probability of them
being Hispanic was at least 5%. Doing that implied that a total of just 22 of the
341 people could be Hispanic (6.5%), still a number dramatically lower than
their share of the population. There are three names that we couldn’t classify as
male or female (Bobbie, Tracy, Robbie), but if you assume that they are all
women, only 26 of the 341 permit holders are women (7.6%).

By comparison, this is dramatically lower than 29% of the permit holders being
women that we found for eight states in 2012. Eight states that had similar
information on race showed that 11% of permit holders were black.

7
  Gene Maddaus, “Who's Packing Heat In L.A. County? Sheriff Lee Baca's Gun Permit List Includes Many
Personal Friends,” LA Weekly, February 14 2013 (http://www.laweekly.com/news/whos-packing-heat-
in-la-county-sheriff-lee-bacas-gun-permit-list-includes-many-personal-friends-4174664).
8
  The website that we used is called “Most common last names for Latinos in the U.S.”
(http://names.mongabay.com/data/hispanic.html).
32

Previous work that we have done has discussed the impact of how gun control in
Chicago on the poor obtaining handguns.9 In Chicago and DC, the zip codes that
have guns under Democrat rules tend to be higher income and much more
heavily white areas.

Partial List of People who are facing death threats and prevented from getting
permits in states with discretionary permitting rules

-- Cases in San Francisco10
       -- Woman who had a criminal protective order (2014)
       -- Corrections officer, denied three times, last time in October 2013.
              Inmates had clearly threatened him.
       -- Former Del Norte County (California) deputy district attorney who was
             worried that past felons that he had put in prison would harm him.
-- New Jersey
       -- Israel Albert Almeida had evidence that a “tenant's live-in boyfriend
               threatened to kill him” (2015).11
       -- Marc Stephens faced multiple death threats (2013)12
       -- Lt. Col. Terry Russell “applied for a concealed carry permit as military
               personnel and especially personnel that work at highly sensitive

9
  John R. Lott, Jr., “Can poor people be trusted with guns?
 Fox News, March 12 2013 (http://www.foxnews.com/opinion/2013/03/12/can-poor-people-be-
trusted-with-guns.html).
10
   Matt Drange, “Want to carry a concealed gun? Live in Sacramento, not San Francisco,” Reveal, June 12
2015 (https://www.revealnews.org/article/want-to-carry-a-concealed-gun-live-in-sacramento-not-san-
francisco/).
11
   Joe Carlson, “Second Amendment group backs Andover Twp. man’s bid to carry gun,” New Jersey
Herald, March 1 2015 (http://www.njherald.com/story/28230557/second-amendment-group-backs-
andover-twp-mans-bid-to-carry-gun#).
12
   Chris Eger, “New Jersey man fights state gun permit law all the way to Supreme Court,” Guns.com,
January 30 2017 (http://www.guns.com/2017/01/30/new-jersey-man-fights-state-gun-permit-law-all-
the-way-to-supreme-court/).
33
areas (like the Picatinny Armory) are at higher risk of terrorist
attacks.” (2016)13
-- New York
-- John Stossel, Fox News Host, New York City 2013: Denied a permit
despite providing evidence of many death threats.14
-- Sean McCarthy served as a key witness that sent members of the “Pagans
Outlaw Motorcycle Club” to prison. In 2017, he tried to get a permit
as he was worried that he faced retribution.15
-- Washington, DC
-- In 2016, Corrections Officers Robert Smith, Ronald DuBerry, Harold
Bennette, and Maurice Curtis, who had all received death threats
from inmates that they had once guarded, were finally granted
permit licenses but only after a case that they took to the DC Circuit
Court.16
Permit Holders are Extremely Law-abiding
It is very rare for permit holders to violate the law. In order to appreciate how
incredibly rare these violations are, one needs to remember that there are over
17.25 million permit holders in the US. Indeed, it is impossible to think of any
other group in the US that is anywhere near as law-abiding.
To get an idea of just how law-abiding concealed handgun permit holders are, we
need only compare them to police. According to a study in Police Quarterly,
13
Sam Hoober, “CCW Weekend: What Constitutes “Good Cause” In May-Issue States,” November 5
2016 (http://dailycaller.com/2016/11/05/ccw-weekend-what-constitutes-good-cause-in-may-issue-
states/).
14
"The Insane Gun Laws of NYC," Fox News, November 16 2013
(https://www.youtube.com/watch?v=24jRaxXT7JQ).
15
Michael O’Keeffe, “Former club manager sues county over gun permit denial,” Newsday, March 30
2017 (http://www.newsday.com/long-island/former-club-manager-sues-county-over-gun-permit-
denial-1.13340941).
16
Fox News, "DC must let ex-prison guards pack heat, federal court rules," Fox News, June 3 2016
(http://www.foxnews.com/us/2016/06/03/dc-must-let-ex-prison-guards-pack-heat-federal-court-
rules.html).34 police committed an average of 703 crimes per year from 2005 to 2007.17 113 of these involved firearms violations. This is likely to be an underestimate, since not all police crimes receive media coverage. The authors of the study may also have missed some media reports. With about 685,464 full-time police officers in the U.S. from 2005 to 2007, we find that there were about 103 crimes per hundred thousand officers. For the U.S. population as a whole, the crime rate was 37 times higher -- 3,813 crimes per hundred thousand people. Perhaps police crimes are underreported due to leniency from fellow officers, but the vast crime gap between police and the general populace is indisputable. Even given the low conviction rate for police, concealed carry permit holders are even more law-abiding than police. Between October 1, 1987 and June 30 2017, Florida revoked 11,189 concealed handgun permits for misdemeanors or felonies.18 This is an annual revocation rate of 10.4 permits per 100,000. In Texas in 2016 (the last year for which data is available), 148 permit holders were convicted of a felony or misdemeanor – a conviction rate of 12.3 per 100,000.19 Combining Florida and Texas data, we find that permit holders are convicted of misdemeanors and felonies at less than a sixth of the rate for police officers. Among police, firearms violations occur at a rate of 16.5 per 100,000 officers. Among permit holders in Florida and Texas, the rate is only 2.4 per 100,000. That is just 1/7th of the rate for police officers. But there's no need to focus on Texas and Florida — the data are similar in other states. 17 Phil Stinson, J Liederbach and TL Freiburger, “Exit Strategy: An Exploration of Late-Stage Police Crime,” Police Quarterly December 2010 13: 413-435. Data on the number of full-time law enforcement employees is available from the FBI Uniform Crime Reports from 2005 to 2007, Table 74 (https://www2.fbi.gov/ucr/05cius/data/table_74.html). 18 Concealed Weapon or Firearm License Summary Report, October 1, 1987 - June 30 2017 (http://www.freshfromflorida.com/content/download/7499/118851/cw_monthly.pdf). 19 The conviction rates of permit holders during that year is available here (https://www.dps.texas.gov/RSD/LTC/Reports/ConvictionRatesReport2016.pdf).
35

Table 4: Revocation Rates for permit holders for any reason in 2017, revocations for
firearm violations are less than 1/10th the rate that excludes revocations for changing
residency.

State                         Rate                              Source

Arizona (Year before                       http://www.leg.state.co.us/library/reports.nsf/Rep
August 5, 2018)              0.363%        ortsDoc.xsp?documentId=D6727350F8E058DB8725
                                                            6E6600773612

                                           http://www.leg.state.co.us/library/reports.nsf/Rep
Colorado**                   0.099%        ortsDoc.xsp?documentId=D6727350F8E058DB8725
                                                            6E6600773612

Florida (year before                       https://www.freshfromflorida.com/content/downlo
July 31, 2018)               0.065%         ad/7499/118851/cw_monthly.pdf and year earlier
                                                                sheet

                                           https://www.freshfromflorida.com/content/downlo
Kentucky                      0.19%                 ad/7499/118851/cw_monthly.pdf

                                           https://www.freshfromflorida.com/content/downlo
Louisiana                    0.084%                 ad/7499/118851/cw_monthly.pdf

                                             Patrick Mccrory, Maryland State Police Licensing
Maryland                     0.658%                             Division

                                            Michaela Dunne, Manager of Law Enforcement &
                                             Justice Services, Massachusetts Department of
                                                   Criminal Justice Information Services
Massachusetts                0.079%                           (617) 660-4682

                                           https://www.michigan.gov/documents/msp/CPL_A
Michigan                     0.305%             nnual_Report_01-04-2018_611131_7.pdf

                                                 https://dps.mn.gov/divisions/ooc/news-
                                           releases/Pages/BCA-releases-2017-permit-to-carry-
Minnesota*                   0.217%                        annual-report.aspx

                                           https://www.michigan.gov/documents/msp/CPL_A
Ohio                         0.062%             nnual_Report_01-04-2018_611131_7.pdf

                                                 https://dps.mn.gov/divisions/ooc/news-
                                           releases/Pages/BCA-releases-2017-permit-to-carry-
Oklahoma                     0.022%                        annual-report.aspx

Tennessee                    0.075%
                                           https://www.michigan.gov/documents/msp/CPL_A
36
nnual_Report_01-04-2018_611131_7.pdf
https://dps.mn.gov/divisions/ooc/news-
releases/Pages/BCA-releases-2017-permit-to-carry-
Texas 0.013% annual-report.aspx
https://www.michigan.gov/documents/msp/CPL_A
Utah 0.028% nnual_Report_01-04-2018_611131_7.pdf
Washington State 0.038% Teresa Clark, Washington Department of Licensing,
Public Disclosure
https://www.doj.state.wi.us/sites/default/files/dles
Wisconsin 0.366% /ccw/2017%20Annual%20CCW%20Statistical%20Re
port.pdf
*Revocations for non-traffic violations.
** Excludes revocations for change in residency.
Listed above are the recent revocation rates in 16 states. Most of these rates
include revocations for any reason, including people moving out of the state, and
for the states where the revocation rates are higher than hundredths of a
percentage point are due to residency revocations. People can also lose their
permits for some types of traffic violations, for forgetting to have their permits
with them, or for being charged with or convicted on a violent misdemeanor or
felony. In Ohio, most of these revocations were apparently a result of handgun
course teachers not spending the required number of hours teaching their
classes.20
20
“Concealed carry instructor allegedly gave out 170 invalid training certificates,” The News-Herald
(Ohio), May 25 2015 (http://www.news-herald.com/general-news/20150525/concealed-carry-
instructor-allegedly-gave-out-170-invalid-training-certificates); “About 50 gun permits invalid after two
instructors accused of forgery,” The Columbus Dispatch, July 15 2016
(http://www.dispatch.com/content/stories/local/2016/07/14/Concealed-carry-permits-bad.html); Lynn
Thompson, “Silent Justice for gun permits,” Bryan (Ohio) Times, February 4 2015
(http://www.bryantimes.com/news/local/article_35d9b7bd-10c7-5d86-b9fe-a56843d73d91.html);
“CCW Instructors get jail for cutting class short,” Lima (Ohio) News, November 25 2014
(http://limaohio.com/archive/18890);37 Since permit holders commit virtually no crimes, right-to-carry laws can’t increase violent crime rates (see appendix).21 Deterring Crime Many factors affect crime rates: arrest and conviction rates, policing policies, prison, demographics, income, poverty, and education. But concealed carry laws are also part of the story, especially when a large percentage of the population has permits. The overwhelming majority of peer-reviewed academic research by economists and criminologists concludes that ownership of permitted concealed handguns causes a reduction in violent crime. The debate is between those claiming a reduction in crime and those denying any effect (for a survey of the academic research, see Lott, “What a balancing test will show for right-to-carry laws,” University of Maryland Law Review (2012): 1205-1218). Most research, however, focuses on what states allow right-to-carry, not the more relevant question of how many people actually have permits. (Only peer- reviewed studies by John Lott in the second and third editions of More Guns, Less Crime [University of Chicago Press, 2000 and 2010] use the number of permits to measure the impact of concealed carry laws). Empirical tests should measure whether crime rates fell relatively sharply in those states with the largest percentage of permit holders. In 2014, the seven states with constitutional carry had much lower rates of murder and violent crime than did the seven jurisdictions with the lowest percentages of permit holders. Indeed, the murder rate was 31 percent lower in the states not requiring permits. The violent crime rate was 28 percent lower. Compared to the rest of the country, the 25 states with the highest concealed carry rates experienced markedly lower rates of murder and violent crime. Of course, such a comparison is far too simplistic. There are many factors that influence crime rates, and simple, cross-sectional comparisons are unable to account for all of them. We can account for differences across states only by looking at how crime rates vary before and after changes in a state’s concealed carry laws. 21 A detailed discussion of these numbers and how the percentages are calculated is available here (https://crimeresearch.org/2017/07/badly-flawed-misleading-donohue-aneja-weber-study/).
38

States have adopted concealed handgun laws in different years and issued
permits at different rates. This allows for revealing comparisons (see Appendix for
a large and growing body of peer-reviewed literature). We must look across states
and compare changes in crime rates with changes in the rates of permit holding.
Doing so has consistently revealed a very strong relationship between more
permits and less violent crime (e.g., Lott, More Guns, Less Crime, University of
Chicago Press 2010 and Lott 2012).

Our analysis here doesn’t provide such sophisticated estimates, simply because
the necessary data will not be available for at least a couple of years. Thus, this
report should only be viewed as suggestive.22

Instead of just comparing states that don’t require permits with those that do, it is
also possible to look just at states that require permits. After accounting for the
per capita number of police, new prison admissions, and demographics, this state
level permit data suggests that each 20 percent increase in the rate of adults with
permits (about one percentage point) is roughly associated with a 15 percent
drop in the murder rate. Since the latest state level crime data is only available
through 2014, the 2011 and 2014.23

Using permit and murder data from 2011 through 2014, we find that states with
the sharpest increases in permits had the largest percentage drops in murder
rates. A 10 percent increase in the share of the adult population with permits
reduces the murder rate by 1.4 percent.24

22
  Regressing the natural log of the murder rate on the percent of the adult population with permits, the
number of full-time sworn police officers per 1,000 Americans, and a time trend finds:

ln(murder rate) = -.2499 (7.15) percent of adults with permits -.8197 (5.50) police per 1,000 Americans –
0.0023 (3.41) Prison Population per 100,000 people + 0.0068 (2.51) year time trend -8.95 (1.76)
Constant

Using the percent of the population in prison instead of a time trend produced very similar results.

23
   To estimate this we ran a couple simple regressions on the murder rate on the percentage of adult
population with permits as well as with and without state and year fixed effects. There is a lot of noise in
these estimates both because the permit numbers come from many different years as well as the
estimated number of murders in 2013. These estimates have a great deal of measurement error and
should only be taken as suggestive. That said, the simplest estimate regressing the murder rate on the
percentage of the adult population with permits produces a coefficient and absolute t-statistics of -
12.68 (1.66). With fixed effects, the estimate was 6.8 (0.82).
24
   Regressing the percent change in murder rates on the percent change in the share of the adult
39

population between 2011 and 2014 gives us this:

Percent change in murder rates = -.136 (1.38) the percent change in the share of the adult population +
.212 (0.99) Constant

F-statistics = 1.92, Adjusted R-squared = 0.0242

We used the GAO report on percent of the population with permits for 2011
(http://www.gao.gov/assets/600/592552.pdf). There were obvious errors in the GAO report for Maine
and Connecticut. For example, in 2011, the GAO states that there were only 4,000 concealed handgun
permits. That would imply an amazing 725 percent increase in permits between 2011 and 2013. For a
permitting system that had been around for decades and no recent change in their laws, it would be
surprising to have any state see that type of change. Maine’s Special Investigations Unit told us that
there were in fact 24,000 in 2011. Possibly the GAO simply left off the number “2” when then recorded
this information. In Connecticut, we had a smaller number of permits in 2011 (115,000).
40

Why is the Number of Permits Increasing?
A simple Google Trends search shows that people’s interest in concealed carry
has spiked in the wake of recent mass public shootings. Here is the search activity
after four notable attacks.

These attacks have also been followed by sharp increases in the number of
41

permits being issued. With about 890,000 new concealed handgun permits
issued in just the last year — bringing the total to 17.25 million — Americans have
clearly done more than simply look up information on the Internet.

The surge in concealed handgun permits corresponds closely with opinion polls
on guns. Take a series of polls by the Pew Research Center. In December 2012,
48% of respondents said that owning a gun “protected them from being crime
victims” as opposed to 37% who answered that it would be “putting people’s
safety at risk.”25 By December 2014, people’s positive impressions of gun
ownership had grown to a margin of 57-to-38.
Similar changes can be seen in polls by Gallup and ABC News-Washington Post.26
They asked a more narrow question: whether having a gun in the home makes
the home safer or more dangerous. The change has been dramatic. In 2000,
Gallup found that only 35 percent of Americans thought that owning a gun made
their home safer. By 2014, that number had soared to 63 percent.
It's not just that Americans think that having a gun makes them safer as
individuals. They also feel better knowing that their neighbors are armed. A
Rasmussen poll from this past June found that a 68-to-22 percent margin of
Americans “feel safer in a neighborhood where guns are allowed.”27
A poll by PEW helps to explain why there has been such a large increase in
concealed handgun permits among blacks and women. The poll shows a 25
percentage point increase in the proportion of blacks with a favorable view of gun
ownership. This is the largest increase of any group. The increase among all
women was 11 percentage points, and the increase among men was 8 percentage
points.

25
   Pew Research Center, “Growing Public Support for Gun Rights: More Say Guns Do More to Protect
Than Put People at Risk,” December 10 2014 (http://www.people-press.org/2014/12/10/growing-
public-support-for-gun-rights/).
26
   Justin McCarthy, “More Than Six in 10 Americans Say Guns Make Homes Safer,” Gallup, November 7,
2014 (http://www.gallup.com/poll/179213/six-americans-say-guns-homes-
safer.aspx?utm_source=alert&utm_medium=email&utm_content=morelink&utm_campaign=syndicatio
n). Scott Clement and Peyton Craighill, “Majority of Americans say guns make homes safer,”
Washington Post, April 18, 2013 (http://www.washingtonpost.com/blogs/the-
fix/wp/2013/04/18/majority-of-americans-say-guns-make-homes-safer/).
27
   Rasmussen Reports, “Americans Prefer Living in Neighborhoods With Guns,” June 12 2015
(http://www.rasmussenreports.com/public_content/politics/current_events/gun_control/americans_pr
efer_living_in_neighborhoods_with_guns).
You can also read